Article

Thermal Modelling and Simulation Studies of Containerised Vanadium Flow Battery Systems

1
School of Chemical Engineering, University of New South Wales, Sydney, NSW 2052, Australia
2
School of Electrical Engineering & Telecommunications, University of New South Wales, Sydney, NSW 2052, Australia
*
Author to whom correspondence should be addressed.
Batteries 2023, 9(4), 196; https://doi.org/10.3390/batteries9040196
Submission received: 20 December 2022 / Revised: 30 January 2023 / Accepted: 10 March 2023 / Published: 24 March 2023
(This article belongs to the Special Issue Feature Papers to Celebrate the First Impact Factor of Batteries)

Abstract

:
With increasing commercial applications of vanadium flow batteries (VFB), containerised VFB systems are gaining attention as they can be mass produced and easily transported and configured for different energy storage applications. However, there are limited studies on the thermodynamic modelling of containerised vanadium redox flow battery systems, and thermal control designs. In this paper, a dynamic thermal model is developed for containerised VFB systems, based on which thermal design options are evaluated using simulation studies.

1. Introduction

The all-vanadium redox flow battery (VFB) invented at the University of New South Wales (UNSW) in the mid-1980s [1] is currently receiving considerable attention as an alternative to lithium batteries for long duration energy storage. As a relatively advanced energy storage technology, the vanadium redox flow battery has already been used for peak shaving, load levelling and renewable energy storage, but on-going improvements and cost reduction are expected to promote more widespread implementation, especially in renewable energy storage where more than 6 h of energy storage capacity is required. As more VFB systems are being installed in different climates and applications, good system design is essential to ensure efficient, long-term, stable operation.
To date, two design approaches have been used depending on the size of the installation. Megawatt (MW) scale systems that are typically custom-made and installed in battery rooms, while smaller scale systems tend to be enclosed within an insulated container which may include passive and or active heating or cooling facilities to control the electrolyte temperature to ensure proper battery operation. The use of insulation and temperature control allows the battery to be installed in more extreme climates. More and more VFB manufacturers are moving to fully or partially containerised systems with modular designs as they can be mass produced and easily transported and configured for different energy storage applications, including MW-scale applications. Thermal modelling provides a useful tool for containerised flow battery designs for applications in different climates.
In a containerised VFB system, the battery stacks, tanks, pipes, pumps, power electronic devices are enclosed within the container and thus are not directly exposed to the ambient environment. This means that auxiliary heating (such as inverters) should be considered when establishing a thermal model for commercial systems. Commercial VFB systems should be operated between 10 °Cand 40 °C to avoid vanadium precipitation in the electrolyte that may cause blockages in the flow channels. Therefore, it is important to develop a dynamic thermal model for the containerised VFB systems. A thermal model was proposed in [2] to study the dynamics of stacks and electrolyte tanks temperatures. This model was further extended to consider self-discharge and ion depletion [3,4]. Wei et al. [5] proposed a forced cooling strategy using a simplified thermal model based on foster networks. Tang et al. further described the development of a thermal model for when different ranges of ambient temperature scenarios are applied [6]. Shen et al. proposed some improvement of the thermal model and temperature control strategies [7], but the model is not for containerised systems. Subsequently, Richard et al. proposed a thermal model application on transport devices, but simulations are still based on simple thermal model [8].
The aim of this paper is to develop a dynamic thermal model for containerised commercial VFB systems with multiple stacks which can be used to determine the temperatures of electrolytes in the stacks, the tanks, pipes and air temperature inside the container, in response to the ambient temperature dynamics. Based on the proposed model, different thermal design are evaluated to maintain a suitable operating temperature range under a wide range of external temperature conditions. Heat generation by the power electronics devices and the effects of membrane, insulation materials as well as passive heating and/or cooling are explored in this paper. The overview of the system is shown in Figure 1.

2. Thermal Model Development for Containerised VRB Systems

The thermal model describes the dynamics of the VFB system including stacks, tanks, pipes, inverters and fans. Fans conduct heat transfer between the inside and outside of the container.

2.1. Vanadium Battery Charge–Discharge Reactions and Self-Discharge Reactions

The reactions occurring at the electrodes of the positive and negative half-cells of the vanadium battery during the normal charging–discharging processes are shown below.
At the positive electrode
V O 2 + + 2 H + + e ch arg e discharge V O 2 + + H 2 O ,   E 0 = 1   V
At the negative electrode
V 3 + + e disch arg e ch arg e V 2 + + 2 H + + e ,   E 0 = 0.26   V
Although the use of the same element in both half-cells avoids problems of cross contamination in the VFB, as there is no perfect membrane, vanadium ions will still diffuse across the membrane leading to self-discharge and capacity loss, the magnitude of which will depend on the type of membrane used. The self-discharge reactions will also generate heat so these need to be included in the development of the thermal model. In the VFB, V(V) and V(IV) ions will diffuse from the positive into the negative half-cell where the following self-discharge reactions take place.
V 5 + + 2 V 2 +   3 V 3 +
V 4 + + V 2 +   2 V 3 +
V 5 + + V 3 +   2 V 4 +
Likewise, the V2+ and V3+ ions that diffuse from the negative half-cell will react with V O 2 + and V O 2 + in the positive half-cell, as expressed below:
V 2 + + 2 V 5 +   3 V 4 +
V 3 + + V 5 +   2 V 4 +
V 2 + + V 4 +   2 V 3 +

2.2. Assumptions for Modelling

  • Stacks and tanks are treated as continuous stirred tank reactors (CSTRs).
  • The resistance of each stack remains constant during the whole simulation.
  • Equations (4) and (7) can be neglected.
  • The concentration and temperature in each component of the battery are uniform.
  • Self-discharge reactions occur instantaneously.
  • The electrolyte takes up the entire volume of the tank.
  • The containerised VRB system remains closed during the simulation.
  • Gas side reactions can be ignored.
  • Influence of shunt current is neglected.
  • No reactions occur in pipes.
  • The electrolyte tank walls are in direct contact with the container walls.
  • The insulation material is sandwiched between 2 sheets of metal of the container.
  • Tanks are in contact with each other and are fully filled.
  • Half of the heat generated by each pump dissipates into air within the container while the other half dissipates into the electrolyte.

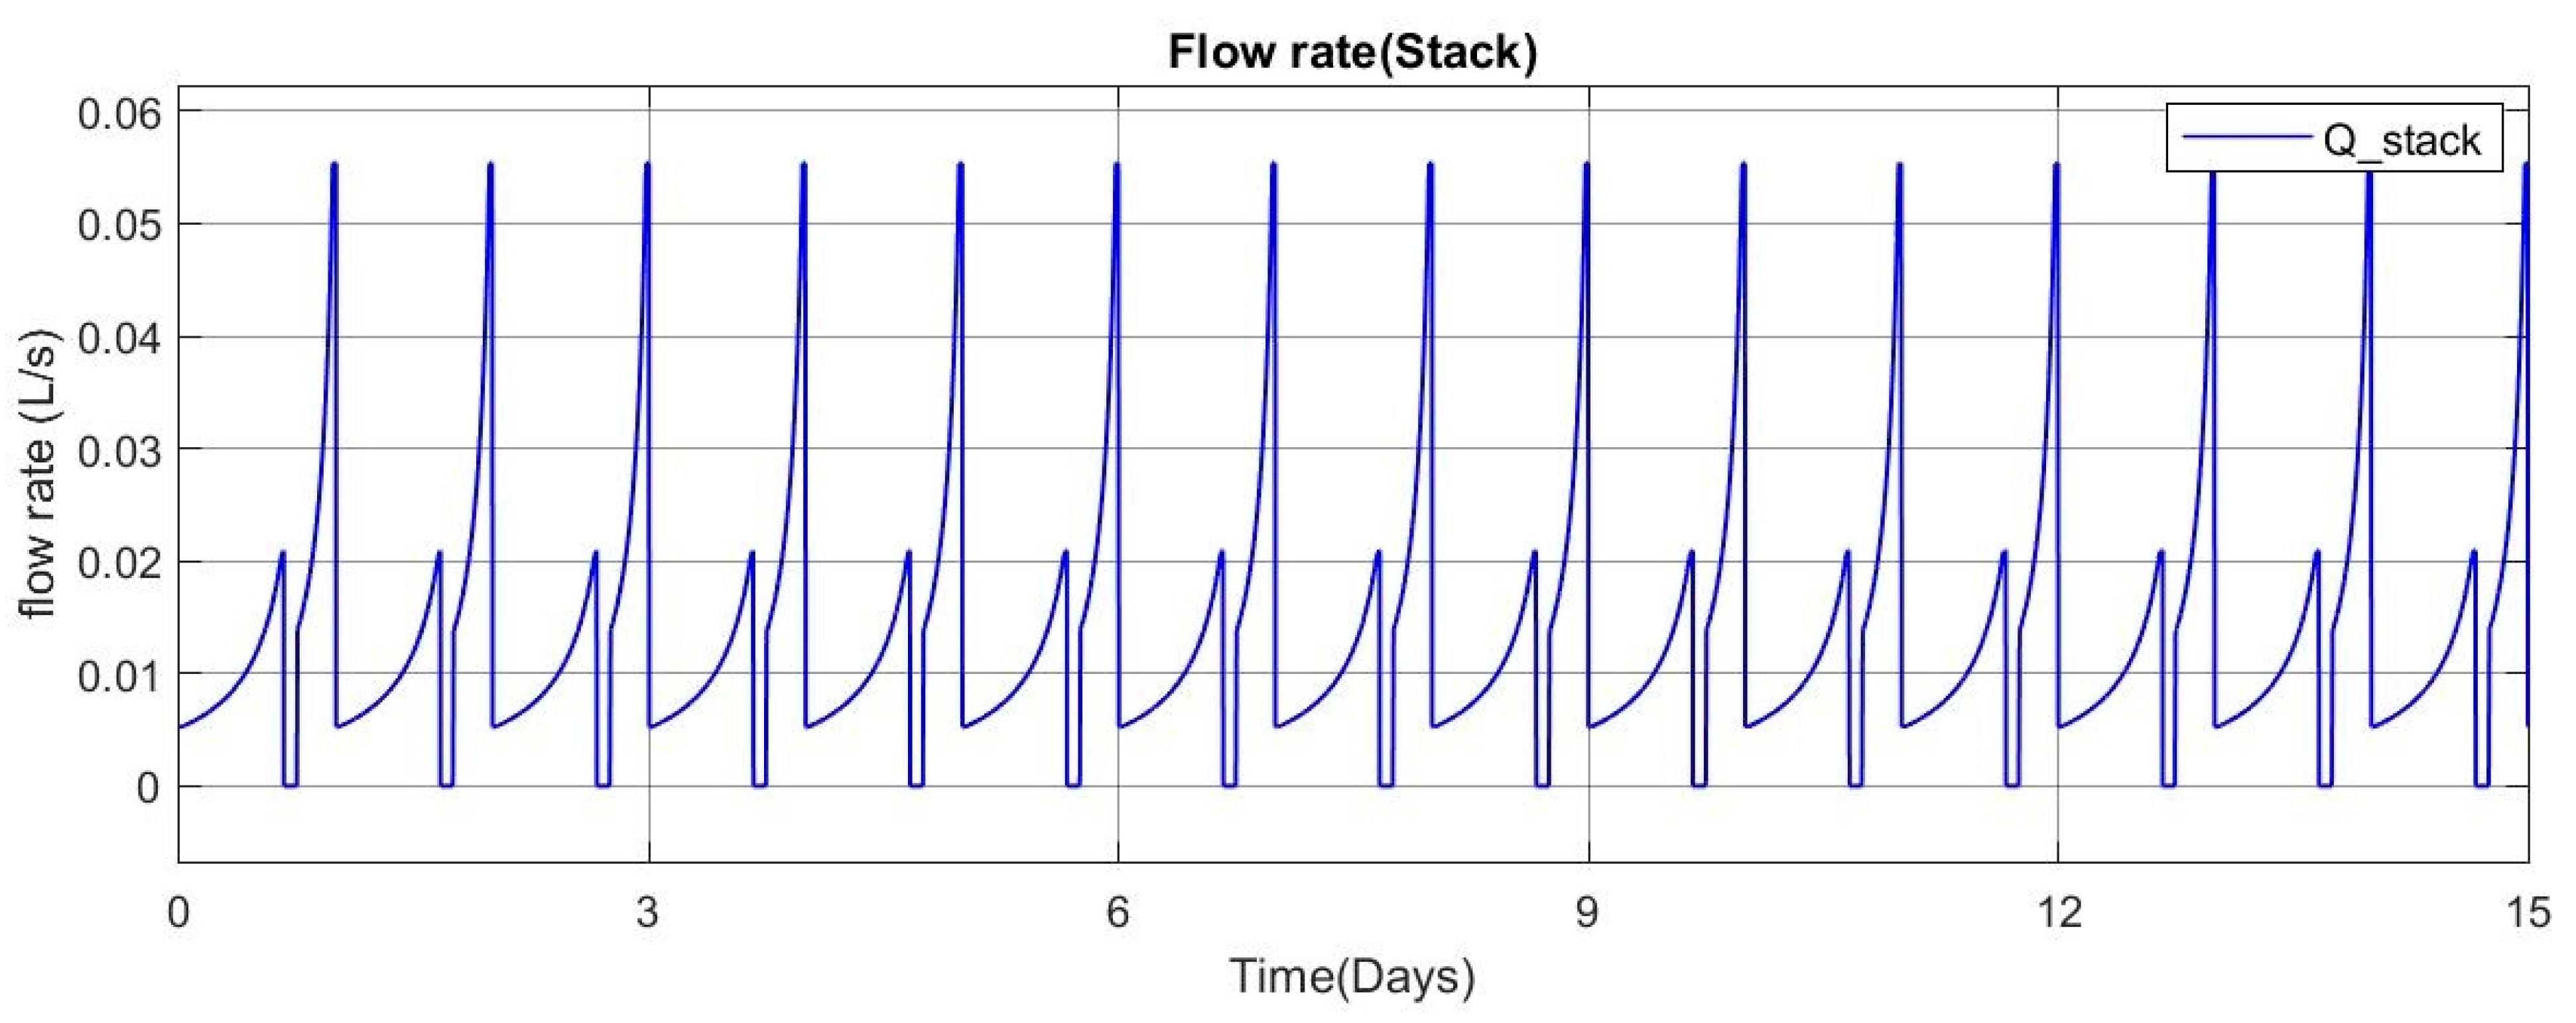
2.3. Mass Balance for Stacks and Tanks

Fick’s law is used to describe ion diffusion during reactions. The mass balance equations used in the development of this model are described as follows:
For stacks:
V s t a c k 2 d c 2 s d t = Q s t a c k ( c 2 t c 2 s ) ± N I z F N k 2 c 2 s d S 2 N k 5 c 5 s d S N k 4 c 4 s d S
V s t a c k 2 d c 3 s d t = Q s t a c k ( c 3 t c 3 s ) N I z F N k 3 c 3 s d S + 3 N k 5 c 5 s d S + 2 N k 4 c 4 s d S
V s t a c k 2 d c 4 s d t = Q s t a c k ( c 4 t c 4 s ) N I z F N k 4 c 4 s d S + 3 N k 2 c 2 s d S + 2 N k 3 c 3 s d S
V s t a c k 2 d c 5 s d t = Q s t a c k ( c 5 t c 5 s ) N I z F N k 5 c 5 s d S 2 N k 2 c 2 s d S + N k 3 c 4 s d S
For tanks:
V tank d c 2 t d t = Q tank ( c 2 s c 2 t )
V tank d c 3 t d t = Q tank ( c 3 s c 3 t )
V tank d c 4 t d t = Q tank ( c 4 s c 4 t )
V tank d c 5 t d t = Q tank ( c 5 s c 5 t )
where V s t a c k and V t a n k are volume of stacks and tanks, respectively, c n s and c n t are concentration of different vanadium ions in stacks and tanks, respectively, Q t a n k and Q s t a c k are electrolyte flow rate in tanks and stacks, S is membrane area, N is number of cells, F is Faraday’s constant, d is the thickness of the membrane, z is number of electrons transferred and k x are diffusion coefficients of different vanadium ions.
Diffusion coefficients need to be described by a temperature related function as they will be influenced by the temperature of the electrolyte. The Arrhenius equation can be applied to describe the relationship between the electrolyte temperature and the diffusion coefficients for the four vanadium ions [3]
K = A e E a / R T
where A is the pre-factor, R is gas constant and T is the temperature of the stack.

2.4. Energy Balance for Stacks, Tanks and Pipes

The energy balance equations used in the development of the thermal model were also detailed by Tang et al. [3]; however, in this model, heat transfer occurs directly between the battery and the environment. In the present model, energy balance equations are used to describe all items that generate heat. As in the previous model, the influence of heat transfer and self-discharge reactions were also considered.
For stacks (no depletion occurs)
C p ρ V s t a c k   d T s t a c k d t = Q s t a c k C p ρ ( T p t k s t T s t a c k )   + Q s t a c k C p ρ ( T n t k s t T s t a c k ) + I 2 R   + N k 2 c 2 s d S ( Δ H ( 1 ) ) + N k 3 c 3 s d S ( Δ H ( 2 ) )   + N k 4 c 4   s d S ( Δ H ( 4 ) ) + N k 5 c 5   s d S ( Δ H ( 5 ) )   + U s A s ( T a i r i n s i d e c o n t a i n e r T s t a c k )
where Δ H ( 1 ) ,   Δ H ( 2 ) ,   Δ H ( 4 ) , Δ H ( 5 ) are enthalpy changes due to self-discharge reactions. The values used are the same as in [3], which are based on temperature of 298.15 K. I 2 R is the ohmic heating produced by the stack resistance, and its value will only change when switching back and forth between charging and discharging because it has been assumed that it is constant in the same operating mode.
However, if depletion occurs, then some ions concentration can be regarded as zero, and the energy balance equation for each stack should be modified.
If V 2 + depleted firstly
C p ρ V s t a c k   d T s t a c k d t = U s A s ( T a i r T s t a c k )   + N k 3   c 3 s d S ( Δ H ( 2 ) ) + N k 5 c 5 s d S ( Δ H ( 2 ) )  
If V 5 + depleted firstly
  C p ρ V s t a c k   d T s t a c k d t = U s A s ( T a i r T s t a c k )   + N k 2   c 2 s d S ( Δ H ( 4 ) ) + N k 4 c 4 s d S ( Δ H ( 4 ) )  
After V 2 + and V 5 + are both depleted, V 3 + and V 4 + will exchange across the membrane until the concentrations of V 3 + and V 4 + reach an equilibrium where the two are equal to each other.
For each tank, the heat transfer takes place from the electrolyte, through the tank wall and the container wall to the ambient environment, as stated in the assumptions. The energy balance equation for each tank is shown below. As shown in the assumptions, for this case, the heat transfer will take place from the electrolyte, through the tank wall and the container wall to the ambient environment. The energy balance equations for each tank are shown below.
Positive side:
C p ρ V t a n k p   d T t a n k p d t = Q t a n k p C p ρ ( T p s t t k T t a n k p )   + U t k p p A t k p p ( T t a n k p T a i r i n )   + U t k s i d e p   A t k s i d e p ( T t a n k p T a i r )   + U t k g r o u n d p   A t k g r o u n d p   ( T t a n k p T g r o u n d p )
Negative side:
C p ρ V t a n k n   d T t a n k n d t = Q t a n k n   C p ρ ( T n s t t k T t a n k n )   + U t k t o p n   A t k t o p n   ( T t a n k n T a i r i n )   + U t k s i d e n   A t k s i d e n   ( T t a n k n T a i r )   + U t k g r o u n d n   A t k g r o u n d n   ( T t a n k n T g r o u n d n )
where it is assumed that T g r o u n d = T a i r
For pipes
Positive part (tanks to stacks)
C p ρ V p i p e p ( t k s t )   d T p i p e p ( t k s t ) d t = Q p i p e p C p ρ ( T t a n k p T p i p e p ( t k s t ) )   + U p i p e s t A p i p e s t ( T a i r i n s i d e c o n t a i n e r T p i p e p ( t k s t ) )   + W p u m p h a l f
Positive part (stacks to tanks)
C p ρ V p i p e p ( s t t k )   d T p i p e p ( s t t k ) d t = Q p i p e p C p ρ ( T s t a c k T p i p e p ( s t t k ) )   + U p i p e t k A p i p e t k ( T a i r i n s i d e c o n t a i n e r T p i p e p ( s t t k ) )  
Negative part (tanks to stacks)
  C p ρ V p i p e n ( t k s t )   d T p i p e n ( t k s t )   d t = Q p i p e n C p ρ ( T t a n k n T p i p e n ( t k s t ) )   + U p i p e s t A p i p e s t ( T a i r i n s i d e c o n t a i n e r T p i p e n ( t k s t ) )   + W p u m p h a l f
Negative part (stacks to tanks)
  C p ρ V p i p e n ( s t t k )   d T p i p e n ( s t t k )   d t = Q p i p e n C p ρ ( T s t a c k T p i p e n ( s t t k ) )   + U p i p e t k A p i p e t k ( T a i r i n s i d e c o n t a i n e r T p i p e n ( s t t k ) )
It is assumed that pipes for transferring electrolyte from tanks to stacks have the same size and pipes for transferring electrolyte from stacks to tanks also have the same size.

2.5. Energy Balance for Containerised VRB System

As for the energy balance equation for the air temperature inside the container, the heat generated by fans and removed by fans, ohmic heat produced by cell resistances, heat caused by self-discharge, as well as heat contributed by other components inside the container should also be taken into consideration. It is assumed that six inverters are assembled in the container, each of which is 5 kW with 95.8% efficiency and all the efficiency loss is attributed to the heat generated by the inverters. Moreover, fans may be used when necessary and they will also generate heat when working. The volume of air inside the container should be the total container volume minus the volume of all the components in the container. Detailed information for the energy balance is shown below:
C p , a i r ρ a i r V a i r   d T a i r i n   d t = W f a n + W i n v e r t e r + W p u m p h a l f   + U c o n A c o n ( T a i r T a i r i n )   + N f a n s m ˙ C p , a i r ( T a i r T a i r i n )   + N s t a c k U s A s ( T s t a c k T a i r i n )   + N t a n k U t k t o p A t k t o p   ( T t a n k T a i r i n )   + N t a n k U t k s i d e A t k s i d e   ( T t a n k T a i r )   + N t a n k U t k g r o u n d A t k g r o u n d   ( T t a n k T g r o u n d )   + U p i p e t k A p i p e t k ( T p i p e p ( s t t k ) T a i r i n )   + U p i p e s t A p i p e s t ( T p i p e p ( t k s t ) T a i r i n )   + U p i p e s t A p i p e s t ( T p i p e n ( t k s t ) T a i r i n )   + U p i p e t k A p i p e t k ( T p i p e n ( s t t k ) T a i r i n )
where it is assumed that T g r o u n d = T a i r

2.6. Cooling Strategy and Auxiliary Heating for Containerised System

A commercial VRB system should be able operate over a wide range of climates with temperature ranges between −5 °C to 45 °C. On the other hand, the stack and electrolyte temperatures need to be maintained between 10 °C and 40 °C to prevent precipitation in the electrolytes and blockages in the stacks and pipes. A containerised system is not directly exposed to the ambient temperature, so the air temperature inside the container would be easier to control. For studies of thermal design options, a simple temperature threshold-based logic control strategy for the cooling system is considered here to maintain a normal operating temperature range. The simplest way for cooling is to use fans, which are of low costs and easy to maintain. The schematic diagram for a containerised VFB system is shown in Figure 2.

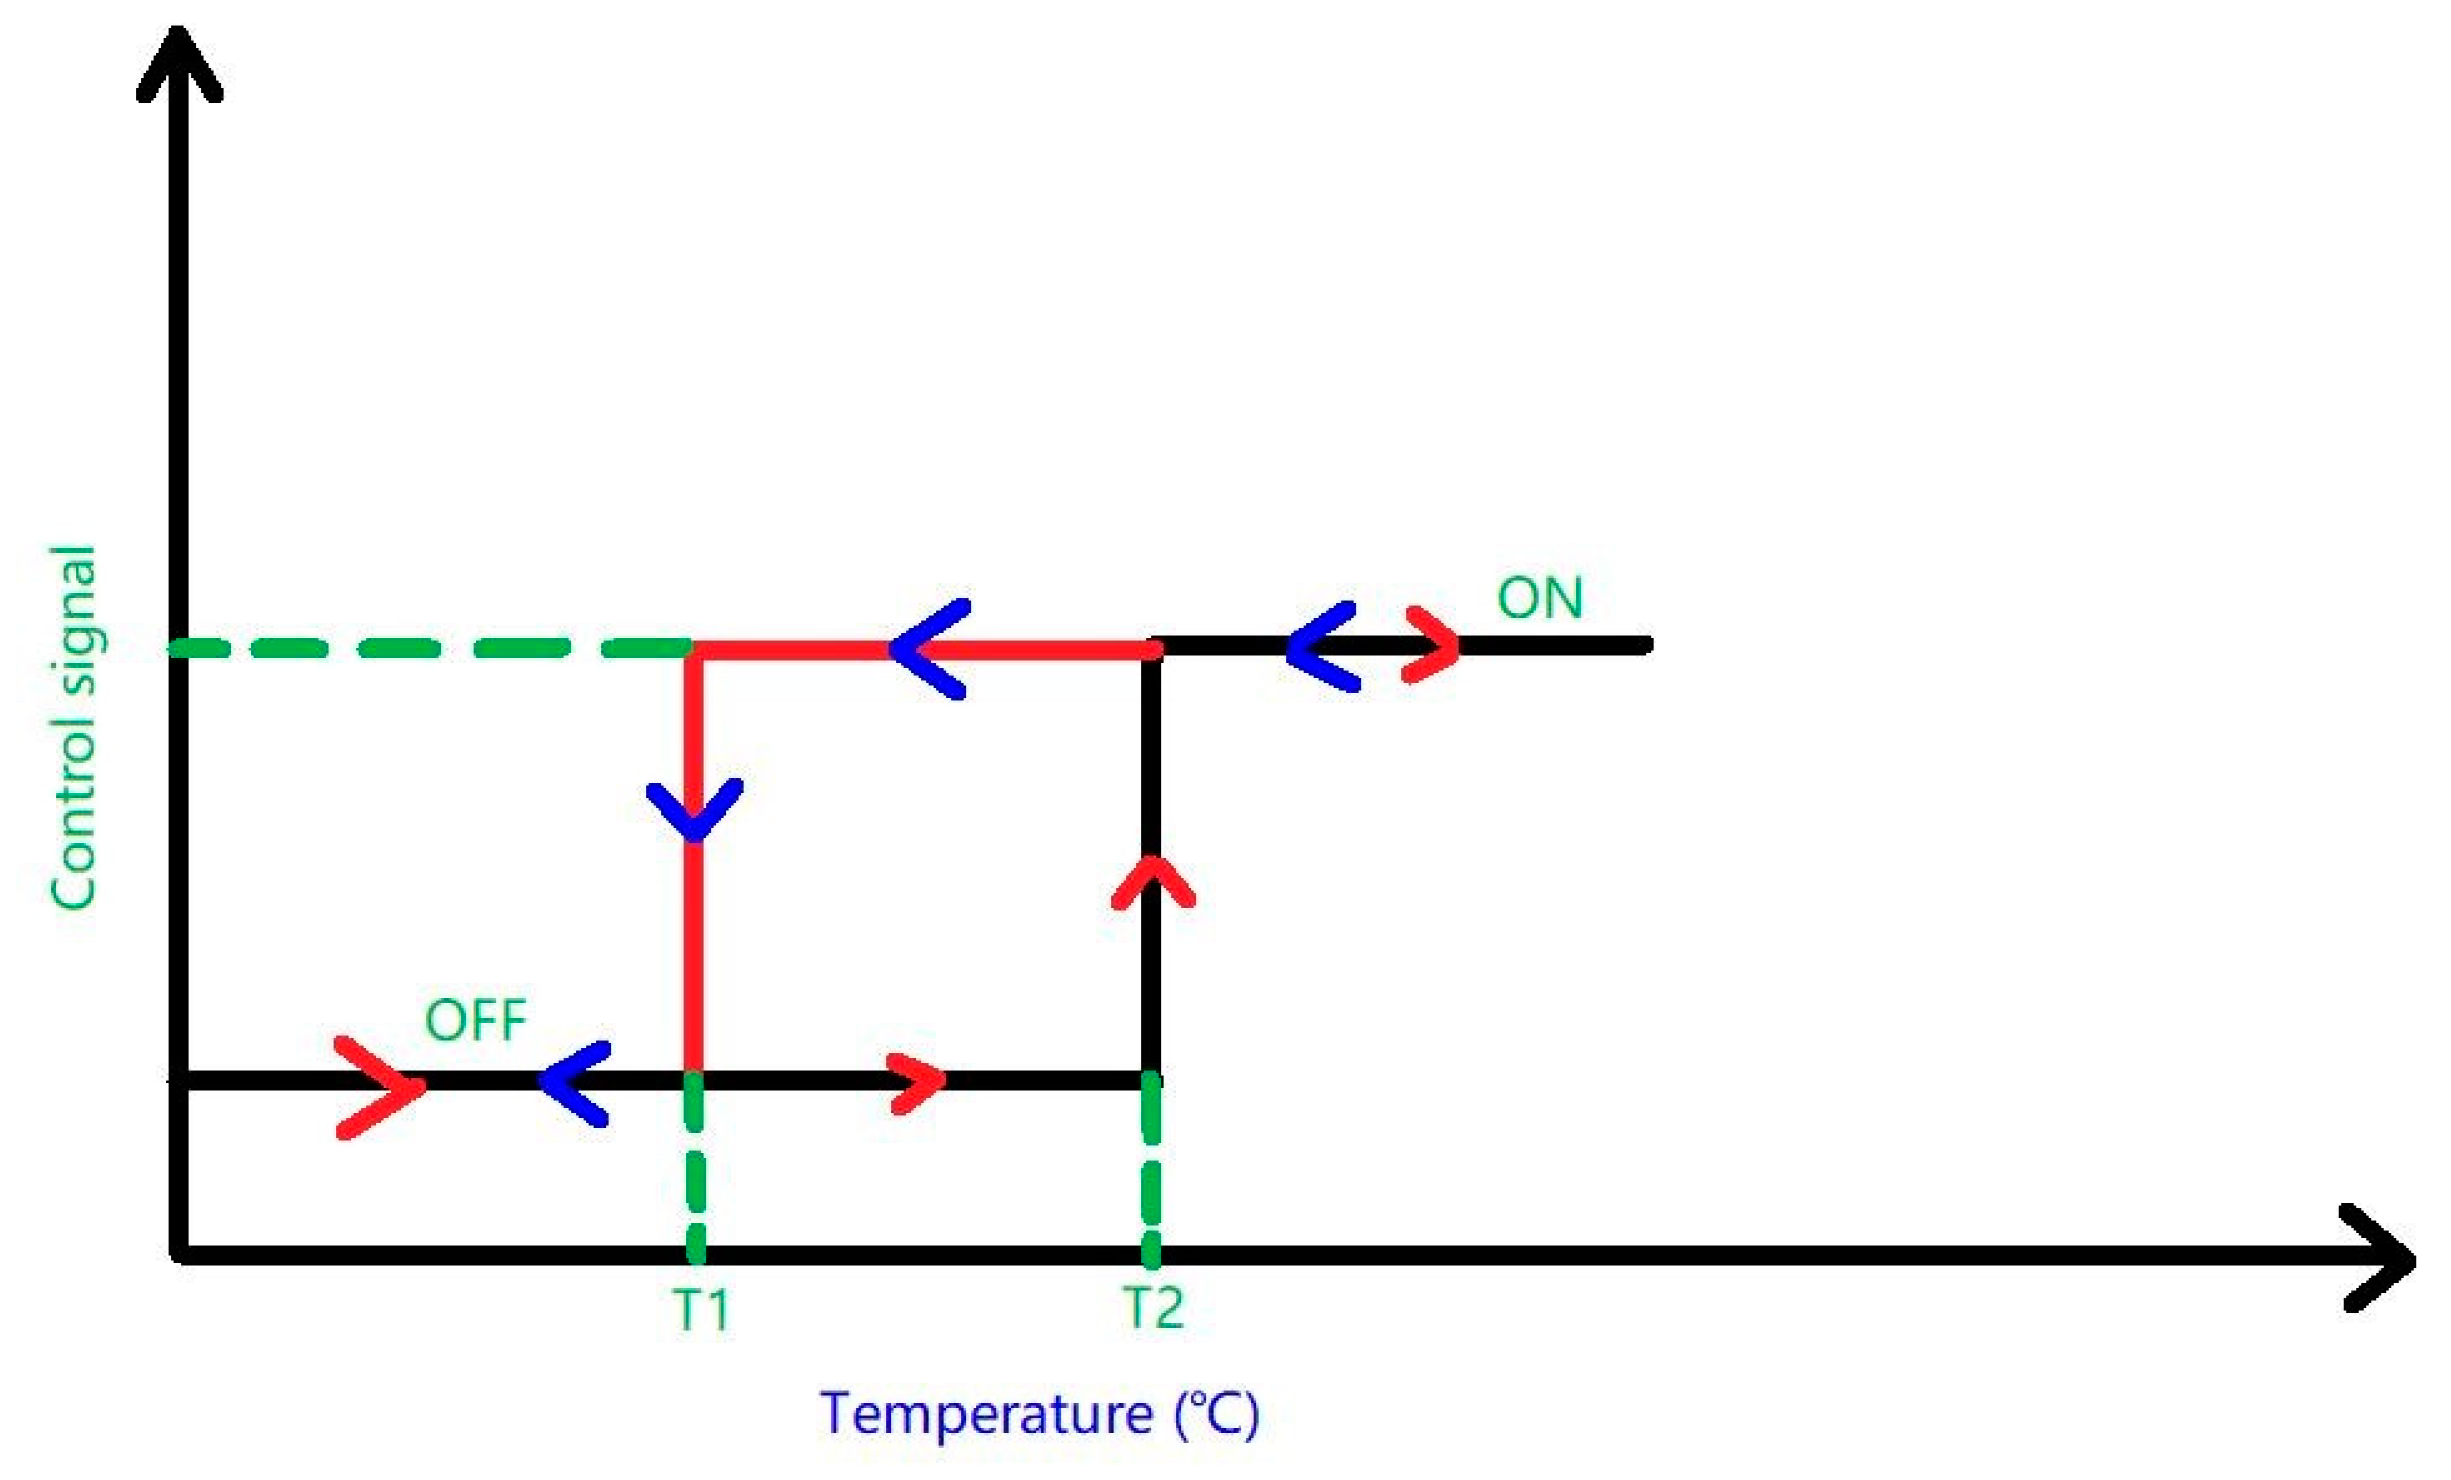
2.6.1. Fans Selection and Cooling Strategy

In the present model, the fans are designed to blow air from the outside environment into the container whenever the temperature of the container is greater than the external temperature. It is assumed that four fans are incorporated into the container and all of the cooler atmospheric air blown into the container by the fans replaces the interior hot air instantaneously. This is a reasonable assumption given the small volume of air inside the container. It is also assumed that when the temperature changes, the specific heat and density of air remain constant. The volumetric flow rate of each fan can be found on websites of different manufacturers. Therefore, it is easy to obtain the mass flow rate for each fan by simple calculation. The rate of heat transferred by the fans can be described as:
Q f a n s = N f a n s m ˙ C p , a i r ( T a i r , i n T a i r )
where N f a n s is the number of fans, m ˙ is mass flow rate of air, T a i r , i n is the air temperature inside the container. T a i r is the ambient temperature. Due to the fact that the number of fans is fixed according to the assumption, different air mass flow rate values can be used as a trial for the test until the cooling effect of the fans is sufficient.

2.6.2. Auxiliary Heating for the Containerised System

In the containerised system, power electronic devices are included to provide power and conduct AC-DC bidirectional conversion. Feasible inverter control strategies such as [9] should also be applied if the system is used for outdoors with connection of solar panels. In addition, pumps will also generate heat when operating.
No matter how many power electronic devices and pumps are used in the system, their auxiliary heating should be taken into consideration because it will affect the temperature of the battery enclosure and therefore of the battery stacks and the electrolyte.
The inverter efficiency, rated DC input and AC output can be found in inverter specifications. The input and output power conservation and the power efficiency of the inverter can be represented below:
P i n = P o u t + Q i n v e r t e r     η = P o u t P i n  
The rate of heat generated by the inverters when they operate at the rated DC input power is
Q i n v e r t e r = ( 1 η ) × P i n
The rate of heat generated by the inverters when they operate at the rated AC output power is
Q i n v e r t e r = P o u t η P o u t
The heat that is generated by each pump can be calculated by
Q p u m p ( e a c h ) = P i n p u t × ( 1 η )           η = P w o r k P i n p u t  
where P w o r k is the pump operating power at different flow rates, P i n p u t is input power for the pump and η is the efficiency of the pump. In the simulation, the flow rate is a variable but we choose the average flow rate to calculate the heat generated by the pumps. It is assumed that two pumps are used and all the power loss is converted to heat.

3. Simulation and Results

In this section, the thermal design options are studied based on the thermal model developed in the previous section.

3.1. Specifications of the System

For illustration purposes, we consider a containerised 30 kW–130 kWh VFB system. Unless otherwise stated, the simulations are based on the FAP-450 membrane (Fumatech). This membrane is used in a number of commercial VFB systems and has the advantages of low resistance, relatively low vanadium ion permeability and high stability in acidic environments [10,11,12]. The specification of the system used in this model are shown in Table 1. Diffusion coefficients for the four vanadium ions are shown in Table 2, and the calculation is based on permeability rates measured at 20 °C in [13]. In the following sections scenarios with different ambient temperature ranges will be explored.

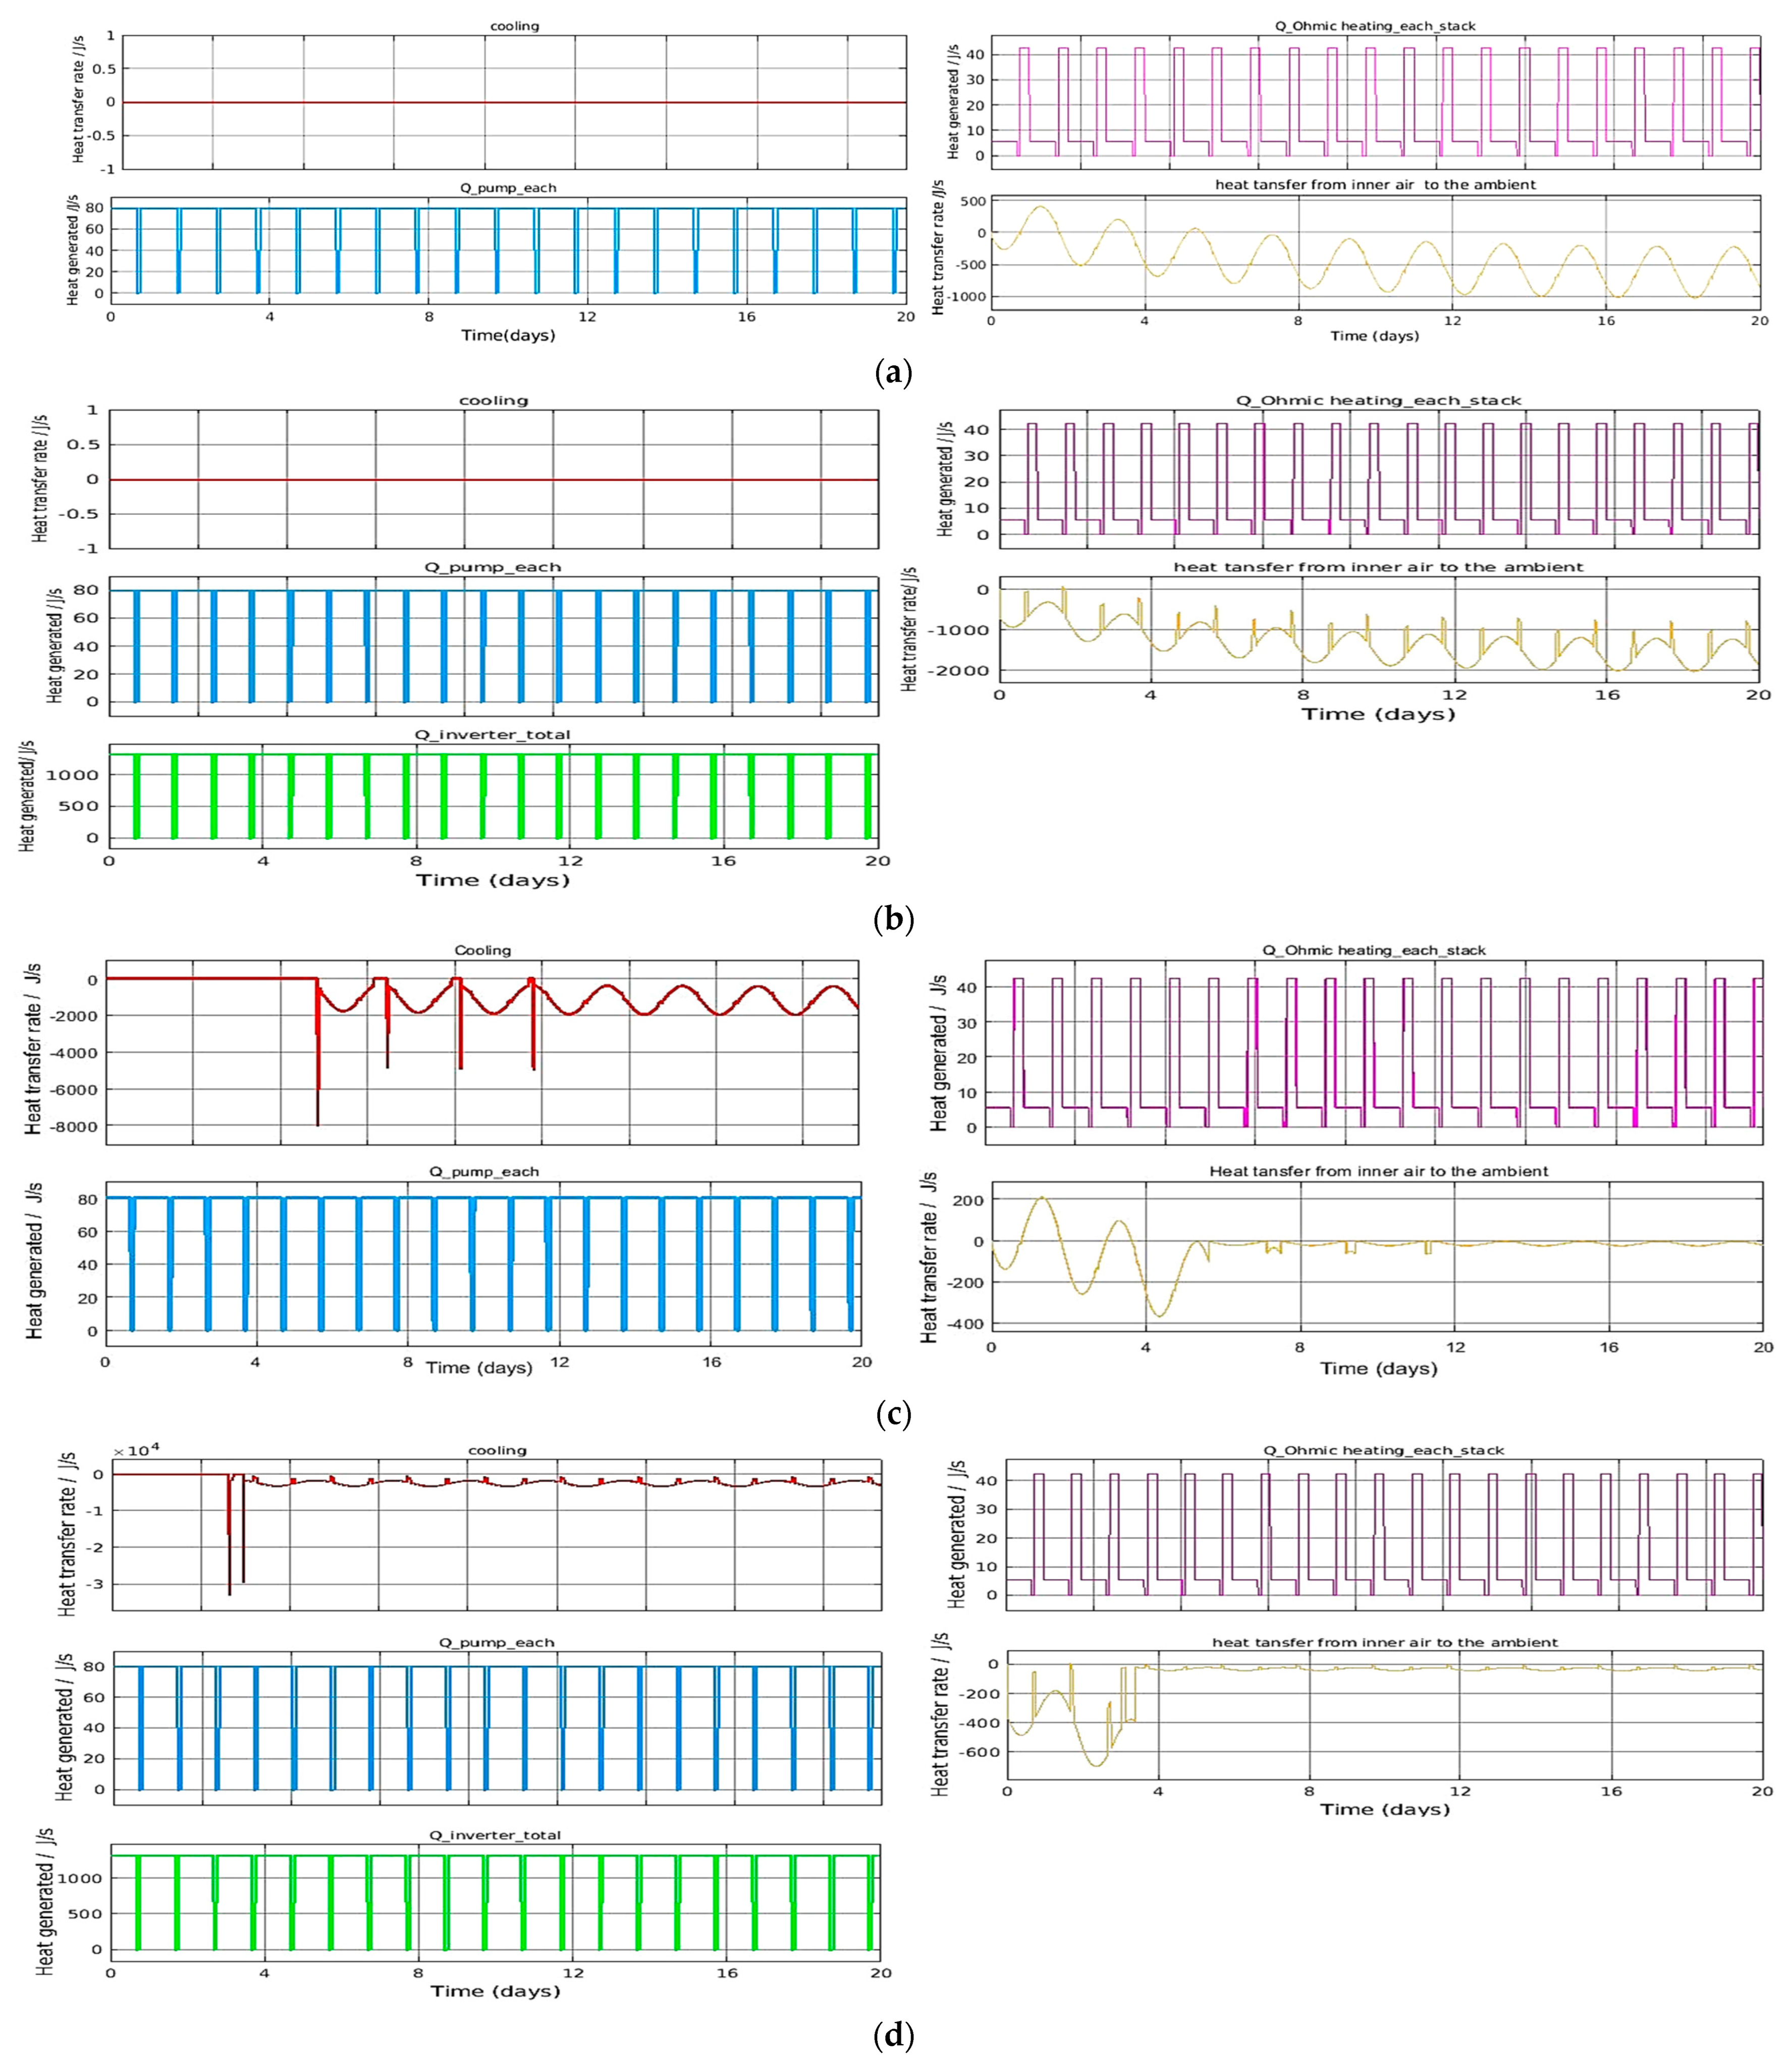
3.2. Heat Generated by Pumps and Inverters

In this simulation, six inverters are assumed to be used in the system and the output power of each is 5 kW with 95.8% efficiency in the 30 kW–130 kWh containerised VRB system. Then, the heat generated by six inverters can be calculated as shown below:
Q i n v e r t e r = ( 1 0.958 1 ) × 5000 × 6 = 1315.24   W
As for pumps, a feasible pump type is chosen for the simulation with maximum capacity of 75 L/min and 85 W input power. One such pump is MD-100R and its performance curve can be used to calculate efficiency [14].
This kind of pump can meet the requirement of the maximum and minimum flow rate in the simulation, which are approximately 6.28 L/min and 66.46 L/min, respectively.
The heat generated by each pump can thus be calculated as follows:
F l o w   r a t e ( a v e r a g e ) = 16.32   L / min Q p u m p ( e a c h ) = 245 × ( 1 165 245 ) = 80   W

3.3. Ambient Temperature Setting

The ambient temperature is set as a sine-wave, as described by
T a i r = C   s i n   ( ω t + ϕ ) + B
where B is the average temperature of a day and C is half of magnitude of temperature variation; ω = 2πf, where ω and f are the angular frequency and frequency of the temperature oscillations, respectively; ϕ is the phase with a unit of radians, t is the time. The maximum and minimum values of the ambient temperature will vary for a range of scenarios to simulate different climate conditions.
For each simulation, the discharging and charging currents are set as 45 A and 17 A, respectively and the battery is operated between 20% to 80% state of charge (SOC). The current profile, SOC response as well as flow rate profile of each stack for a 15-day simulation are shown in Figure 3, Figure 4 and Figure 5.

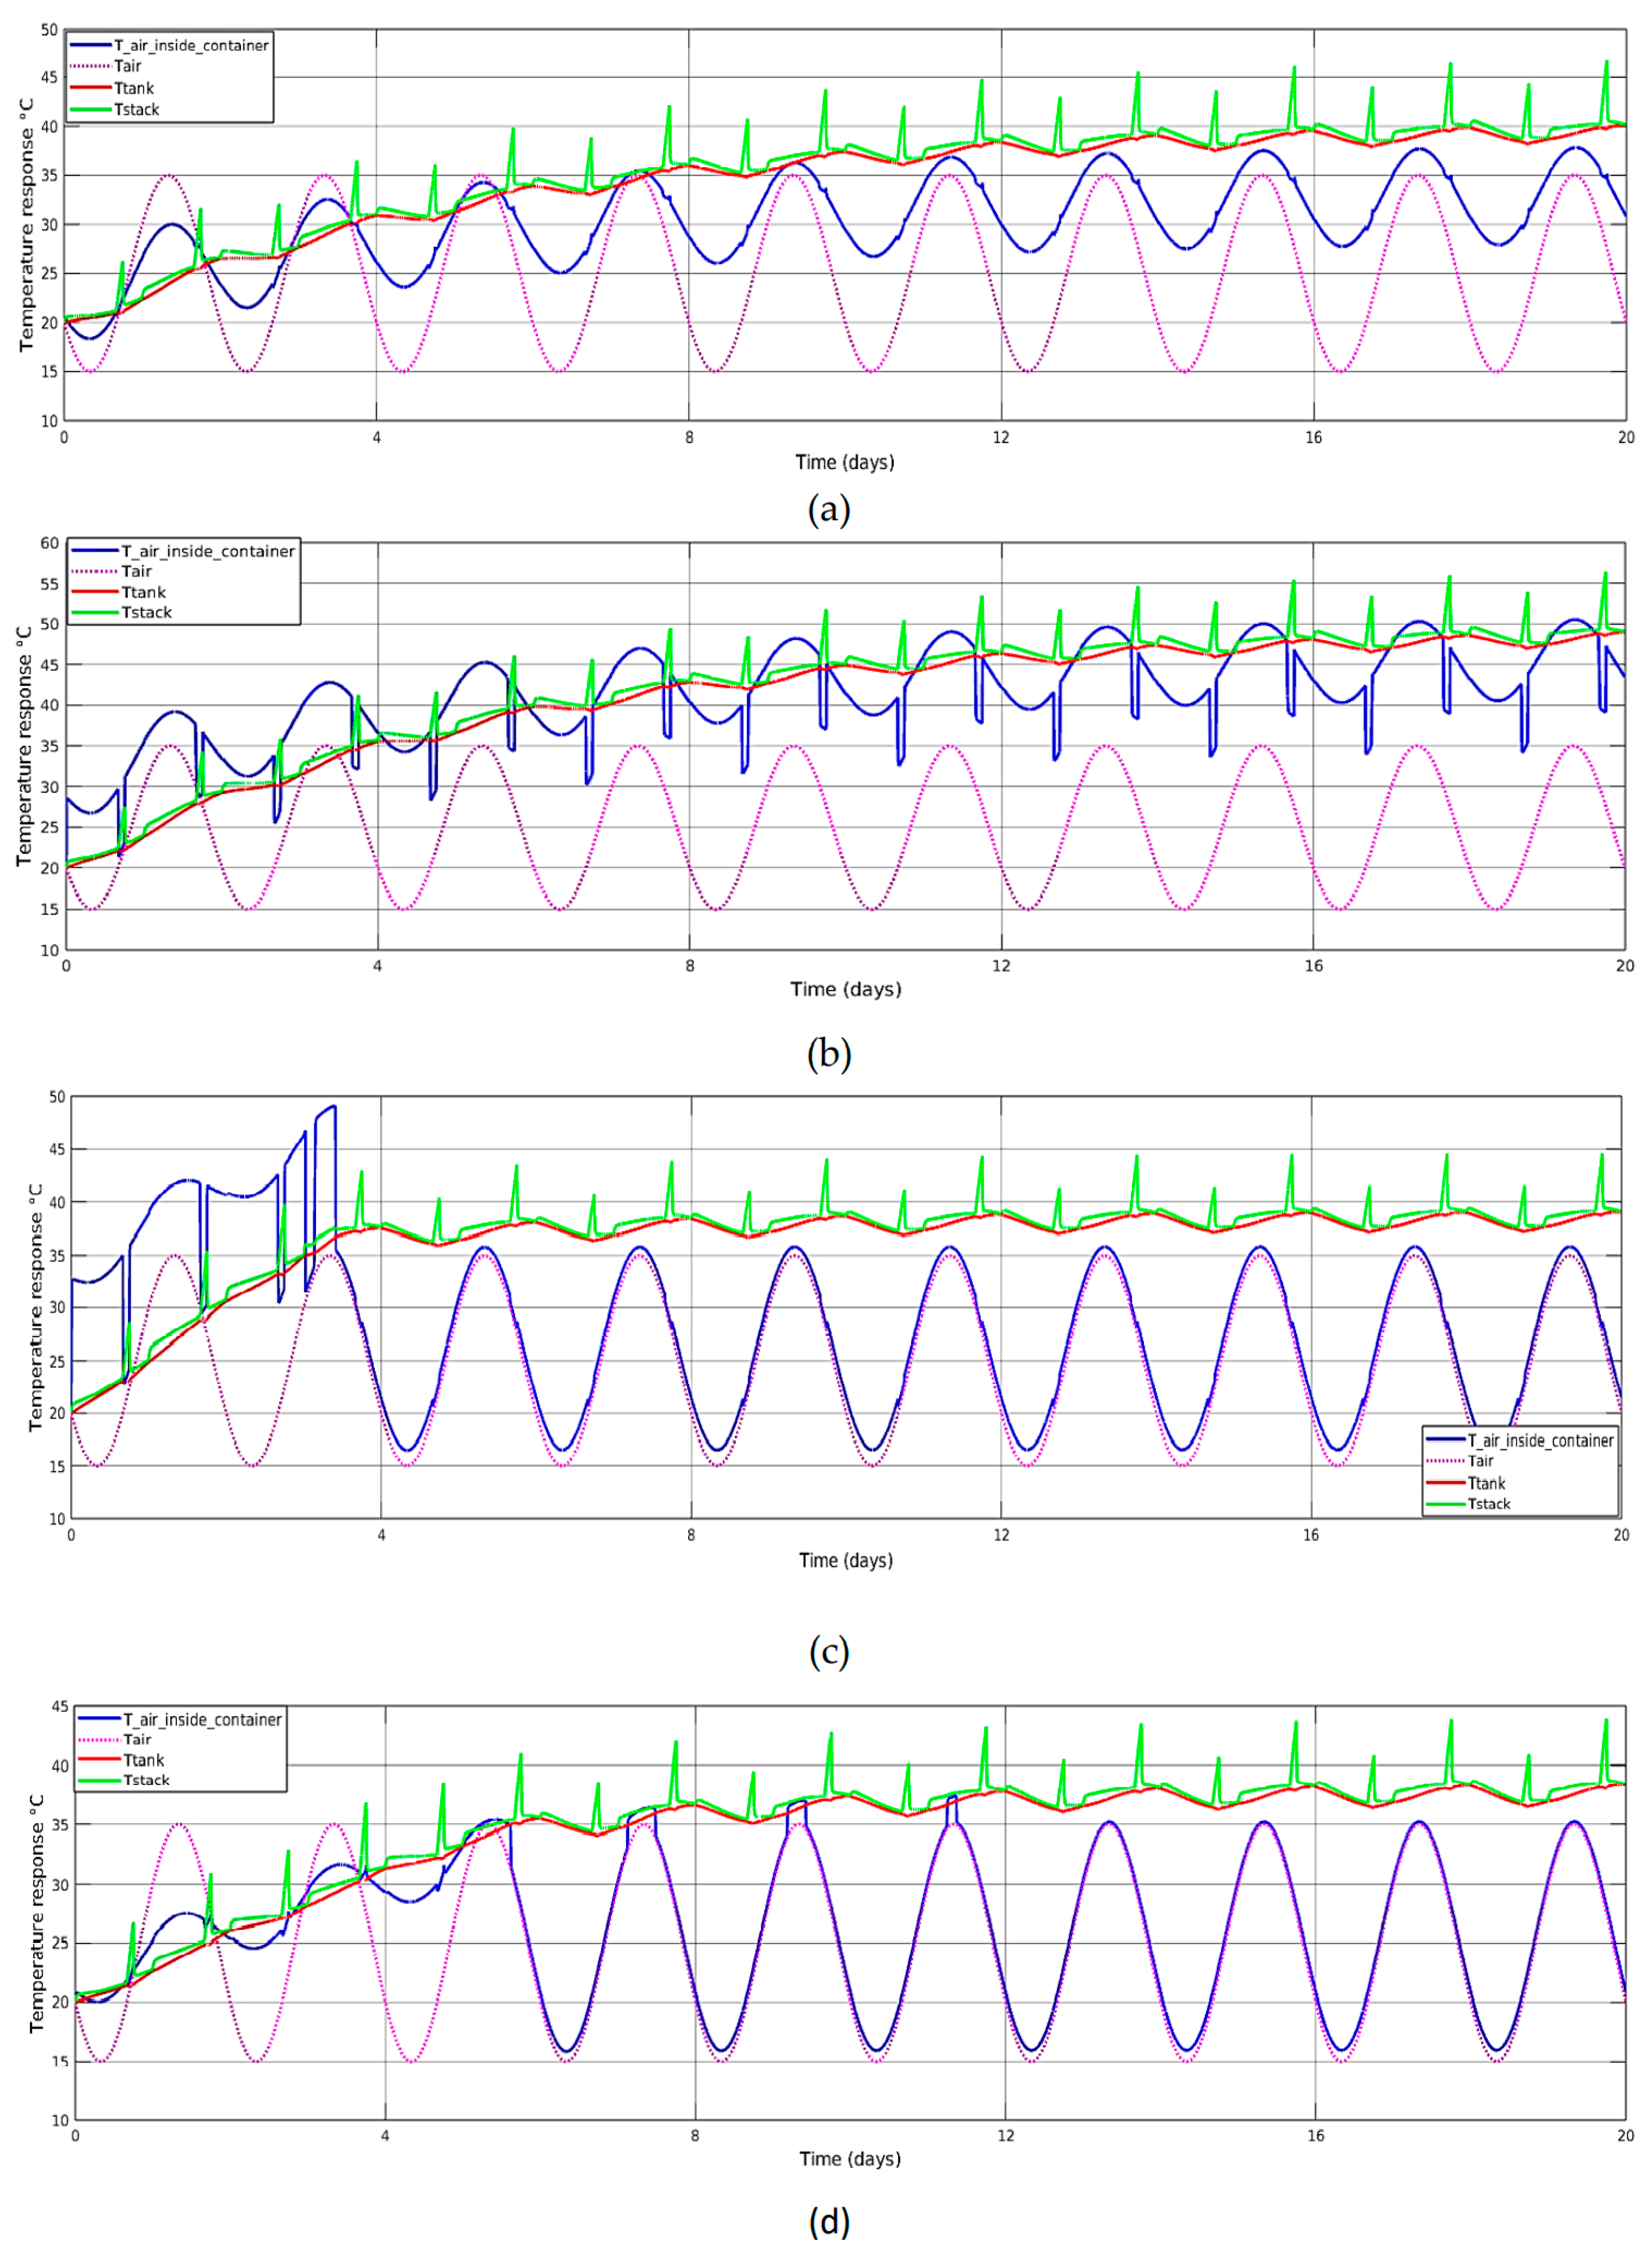
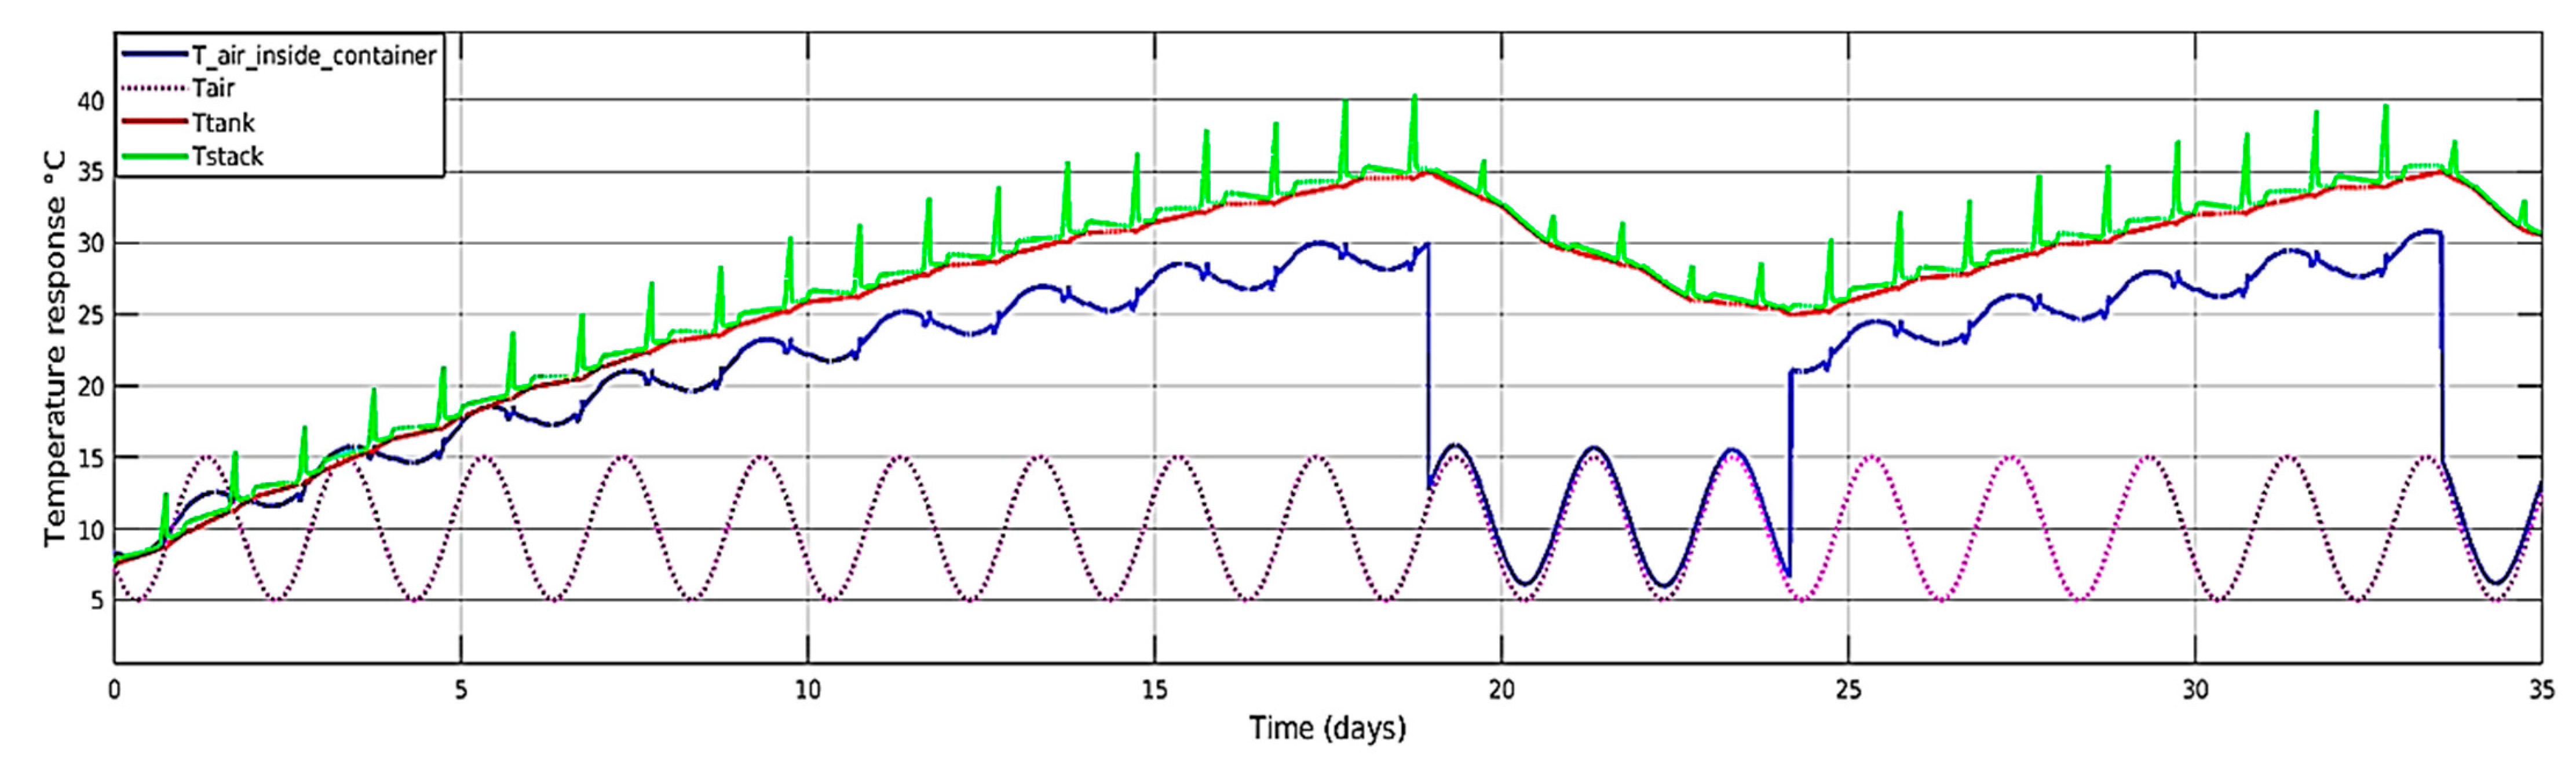
3.4. Case 1: Temperate Climate—Normal Summer

In this case study, an average summer temperature range for a temperate climate is simulated.
The objective of this scenario is to obtain the temperature response for a containerised 20-stack 30 kW/130 kWh VRB system with no insulation when the ambient temperature varies from 15 °C to 35 °C. In order to make the whole system operate normally, hysteresis control-based cooling strategies are applied to prevent frequent temperature switching. Its working principle is shown in Figure 6, where T1 and T2 are fans turn-off and turn-on threshold temperature, respectively.
Cooling control logic for simulations are shown below:
i f   ( T t a n k > T a i r + Δ T   a n d   T a i r t e m p e r a t u r e i n s i d e c o n t a i n e r > T a i r )               i f   ( T t a n k > T 1 )                           f a n = o n               e n d               i f   ( T t a n k < T 2 )                           f a n = o f f               e n d e l s e             f a n = o f f   e n d
The simulation results for ambient temperature ( T a i r ), stack temperature ( T s t a c k ), tank temperature ( T t a n k ) as well as air temperature inside the container ( T a i r   i n s i d e   c o n t a i n e r ) are shown below:
Figure 7 shows the temperature response when there is no insulation and no cooling strategies applied. The initial temperature for stacks, tanks and air temperature inside the container is set to be same as the ambient temperature. In order to charge the VFB system when the electricity price is low, charging is assumed to begin at 10 pm. Charging continues for 16 h until 2 pm at which time the battery goes into stand-by mode with the pumps turned off. Then, after the 2 h stand-by period, the battery will operated under discharge mode for 6 h. During the stand-by period, there is no heat generated by pumps and inverters, but fans still operate. This charge–discharge profile was selected to match a typical residential electricity usage based on peak power prices between 2 pm and 8 pm and off-peak or shoulder tariffs between 10 pm and 2 pm in the afternoon.
As seen in Figure 7a, the temperature of important components inside the container continuously increases, reaching a bit more than 40 °C at the end of the sixteenth day. For this case, inverters are assumed to be isolated from other part of the container. Due to significant heat generated by inverters, the temperature of tanks and stacks will reach more than 45 °C if inverters directly contribute heat to the air temperature inside the container, as shown in Figure 7b. In addition, a feasible cooling strategy is required to further decrease temperature of stacks and tanks.
Insulation materials are often used to avoid heat dissipation and they will not be changed once assembled to the container. Thus, it is important to explore temperature response of stacks and tanks when insulation materials are incorporated into the container. From Figure 7c, temperature of stacks and tanks can be maintained at below 40 °C during normal operation when the insulation material is applied. For this case, inverters are assumed to be isolated from the inner environment and a cooling strategy is applied. During the first several days, fans will remain closed because the trigger condition is not satisfied. In fact, this cooling strategy also improves fans usage efficiency and avoids frequent switching. Figure 7d shows the temperature response when the inverter directly contributes heat to the air inside of the container with 0.02 m thick insulation and a feasible cooling strategy. As shown in Figure 7d, temperature of stacks and tanks is very close to 40 °C, which is due to the heat generated by inverters directly contributing to the air temperature inside of the container as compared with Figure 7c. For the case shown in Figure 7d, fans need to work longer than the case shown in Figure 7c. VFB system in this case is at the risk of electrolyte blockage and thermal precipitation of V 5 + in the positive half-cell electrolyte because temperature response is very close to the threshold for safe operation.
Figure 7 also shows that the stack temperature reaches a peak during the stand-by period because the pumps are turned off and the heat released from the self-discharge reactions cannot be dissipated. When the pumps are turned on again, the electrolyte inside the stacks is flushed and replaced with fresh electrolyte from the tanks, so the stack temperature drops to the tank temperature which increases steadily and reaches a steady state value of about 0.5–3 °C below 40 °C for the scenario where the cooling strategy is applied. In order to further decrease the temperature, it is necessary to isolate the inverters from the other part of the container. For this temperate climate summer scenario therefore, it is seen that adequate temperature control can be achieved to guarantee safe operation during normal operation even if insulation materials are applied.
Figure 8 illustrates the heat generation and transfer in Figure 7a–d, which clearly shows the heat generation of fans, pumps and inverters, as well as the heat carried by the fans. As shown in Figure 8, heat transfer becomes faster when fans operate, whereas heat transfer from inner air to ambient becomes slower with insulation. As pumps and stack resistance produce much less heat than inverters, the heat generated by inverters can increase the rate at which heat is transferred from the internal air to the atmosphere because the heat generated by inverters directly contributes heat to the internal air and causes larger temperature differences between internal air temperature and ambient temperature. Inverters and pumps are not functioning during stand-by, but fans are still working, so the internal air temperature decreases, resulting in a decrease in the temperature difference between the internal and ambient air temperatures, which ultimately reduces heat transfer rate between them. Dynamically stable heat transfer rates are also observed at steady states in Figure 8. Charging and discharging result in inconsistent ohmic heating since stack resistance and current differ.

3.5. Case 2: Temperature Climate—Normal Winter

In this case, the ambient temperature will vary from 5 °C to 15 °C between night and day, which is a typical winter temperature range in many cities or regions. The simulations will reflect the temperature response of important components within the containerised system, as well as the air temperature within the container.
Due to relatively low ambient temperature, it is not necessary to apply cooling strategies if there is no insulation material applied. As mentioned in the normal summer scenario, it is better to isolate inverters from other parts of the container for efficient summer operation. Thus, exploring temperature response of important components inside the container when the insulation material as well as the cooling strategy are applied, and inverters are isolated from the inner environment of the container becomes very crucial. Based on these conditions, Figure 9 shows that when tank temperature reaches more than 35 °C, the tank temperature minus air temperature inside the container is greater than 2 °C and air temperature is greater than ambient temperature, fans will be switched on, while fans will be closed once the tank temperature drops below 25 °C or other situations. Furthermore, in this case, the temperature of the tanks will be between 25 °C and 35 °C after it reaches 35 °C for the first time and the average temperature of tanks will be eventually maintained at approximately 30 °C. Therefore, temperature of tanks and stacks can be well controlled to be within the safe operation range by using this cooling strategy for this normal winter case.

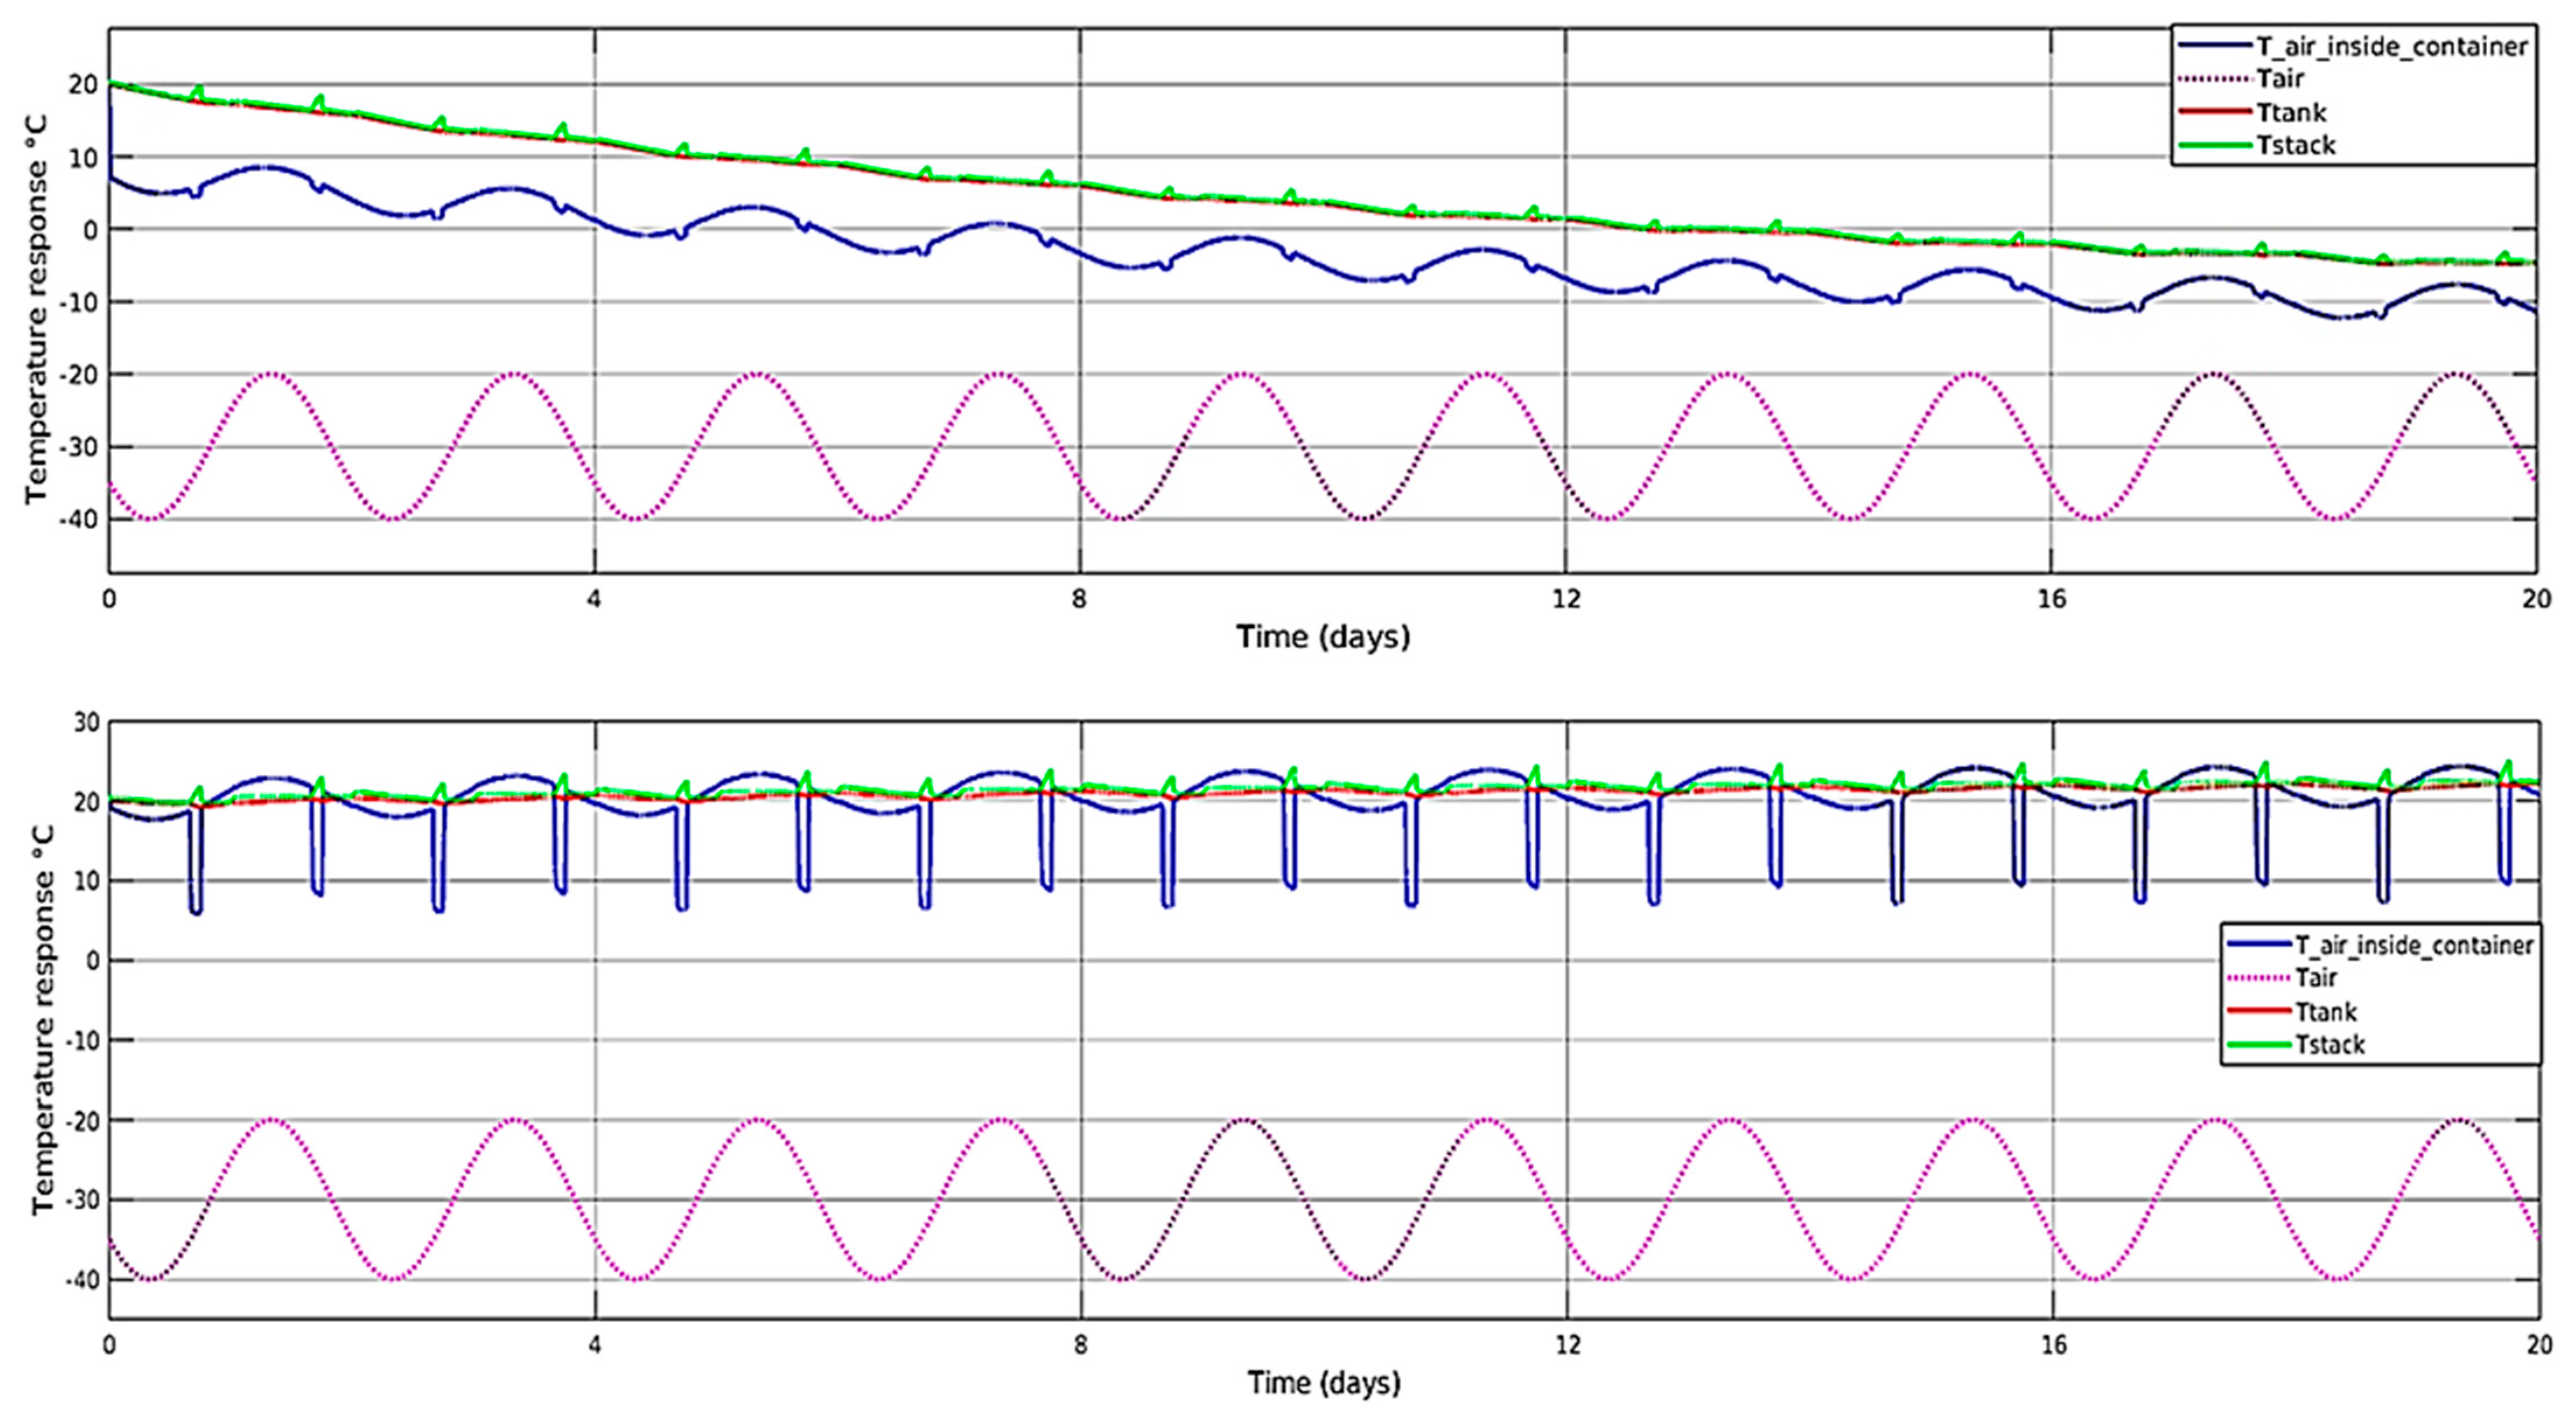
3.6. Case 3: High Latitude Area Winter Climate Scenario

For this scenario, the related temperature response of the containerised VRB system for regions with very low ambient temperature in winter will be explored. The objective of exploring this scenario is to provide insights for deciding whether insulation materials and effect of heat generated by inverters should be applied to the system. Moreover, it will also be made clear whether the temperature of important components in the container will be lower than the minimum temperature threshold of 10 °C for normal operation. Fans are closed during the whole simulation for this scenario to eliminate the influence of low ambient temperature. The ambient temperature of this scenario is set between −40 °C to −20 °C to reflect situations for regions such as the north area of Scandinavia and parts of northern Siberia in winter. For this scenario, it is assumed that initial temperature is within the normal operating temperature.
As we can see from Figure 10, the initial temperature of important components in the VFB system are set as 20 °C. The temperature of stacks and tanks will drop continuously and reach about −10 °C at the twentieth day if inverters are isolated from the container even if the insulation material is introduced to the system. If the initial temperature is set to be even lower, then the condition will further deteriorate. Figure 10 (Bottom) shows the temperature response of the main components of the containerised system when polyurethane is applied as the insulation material and inverters directly contribute heat to the air inside the container. The temperature of important components inside the container can be controlled at about 20 °C as shown in Figure 10 (bottom). This means that when ambient temperature is very low, making full use of the heat generated by inverters is very useful to heat up the inner environment of the container. It should be noted that it is a wrong choice to pursue only better thermal insulation, because if the insulation thickness is constant, the better the thermal insulation, the less heat will be dissipated from the containerised system. This means that when the energy saving policy (with no fan working) is applied, the temperature inside the container will continue to rise if the performance of insulation materials exceeds the limit, and the ambient temperature will have almost no effect on the air temperature inside the container.

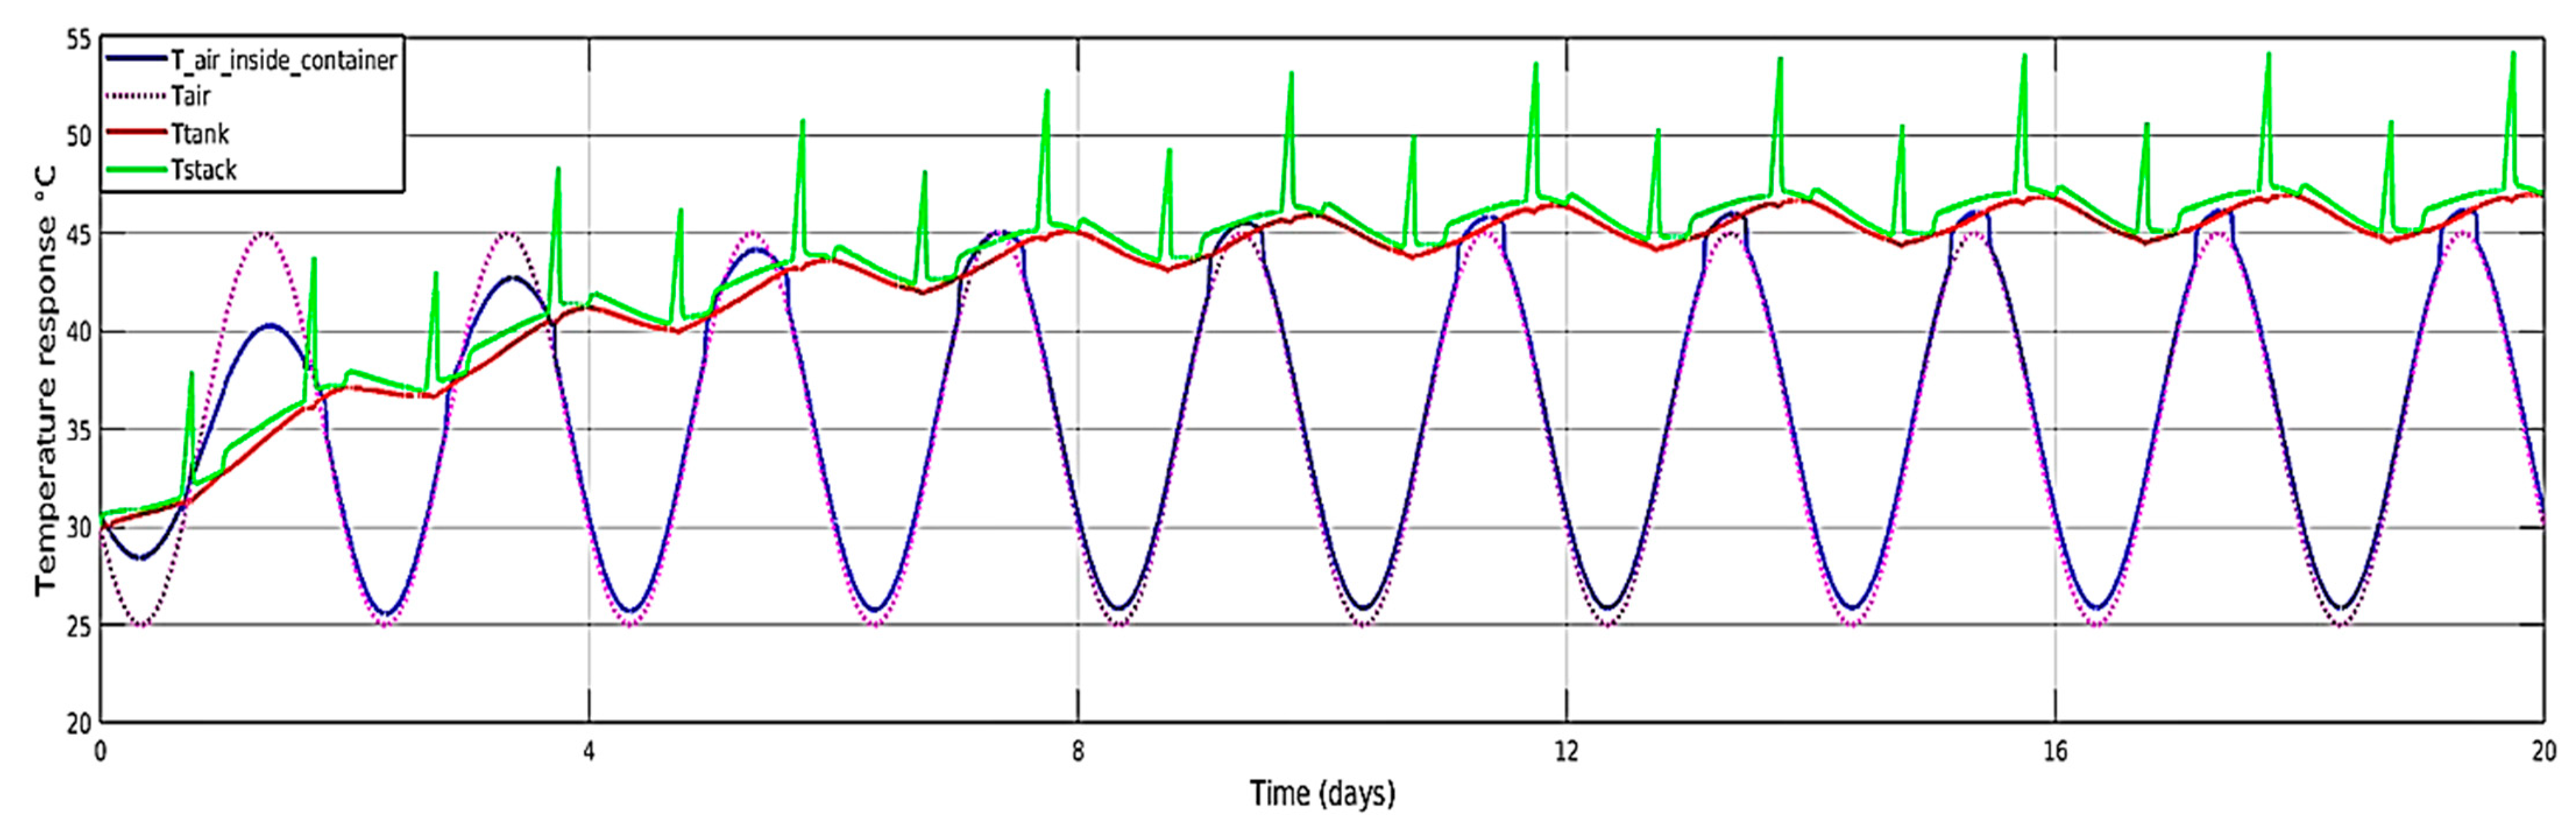
3.7. Case 4: Large Diurnal Temperature Difference Scenario

In some places, the temperature difference during the day and night is very large. The performance of fans and the insulation material can be studied to identify the level of cooling required and the effect of the insulation materials.
A temperature range 25 °C~45 °C is very common in regions with a hot climate. Due to high ambient temperature value, the heat in the container needs to be dissipated as much as possible. Hence, the simulation without insulation materials but with a feasible cooling strategy should be conducted and inverters in this case should also be isolated from the inner environment of the container. Figure 11 shows the temperature response of important components within the container in this simulation, from which it can be seen that fans need to remain open most of the time while the temperature of tanks and stacks will eventually reach about 47 °C. This means that this battery system is at risk of electrolyte blockage and thermal precipitation. It is obvious that even if more heat is ensured to be dissipated in this scenario, the containerised VFB system cannot operate within a safe temperature range. Therefore, it is recommended to use additional cooling strategies such as air pumps and air conditioning systems to help further decrease temperature of tanks and stacks.

3.8. Discussion

Simulations have explored the expected temperature responses of important components of a containerised VFB under different climatic circumstances. The proposed model is able to estimate the temperature response of the tanks, stacks as well as the air temperature inside the container. Influence of fans, insulation materials and inverters are explored in different scenarios. Fans as an economical passive cooling strategy extend the feasible operating temperature range of an insulated containerised VFB system used in a climate where there is a reasonable temperature range between night and day. Heat that is generated by fans and power electronic devices are also taken into account in the simulation. Different ambient temperature scenarios are discussed to provide a thermodynamic basis for designing commercial VFB systems.
The model can certainly be simplified by taking the entire container as a single system. However, in that case we will lose the detailed temperature variations inside the container. For example, the electrolyte temperature in the stack during standby (when the pumps are switched off) may differ significantly from that of the electrolyte in the tanks. Keeping the stack temperature in an appropriate range is important to the battery operation.
Insulation materials with different thicknesses can be chosen for the containerised system. Performance will depend on thicknesses and thermal conductivity, but their applications may be harmful in hot climates since less heat will be dissipated from the containerised system, leading to continuous temperature increases in important components inside the container. Inverters generate much heat during normal battery operation, and it is better to isolate the inverters for most cases to minimise excessive heating, but in extremely cold climates, they could be used to heat the air inside the container to maintain a safe temperature range.
For cooling fan operation, the proposed cooling strategy helps save energy and decrease carbon emissions when fans are not necessary to work. If proper insulation materials are applied with heat generated from the inverters under very cold climates, operating cost can be reduced because less electricity will be consumed. In addition, hysteresis fan switching control is significantly useful to reduce the power consumption because it prevents frequent switching.

4. Conclusions

The containerised VFB system can operate safely when certain passive cooling strategies are applied when the ambient temperature ranges from 15 °C to 35 °C. For this ambient temperature case, even if heat generated by inverters directly contributes to the air temperature inside the container, the temperature of tanks and stacks can still be maintained below 40 °C. It is also necessary to apply a passive cooling strategy for this case because isolating the inverters from the inside of the container with no insulation cannot prevent the temperature of the stacks and tanks from exceeding 40 °C during normal operation.
When the ambient temperature is between −40 °C and −20 °C in extremely cold winter climates, inverters can play a vital role in regulating the temperature inside the container to reduce temperature drop. Proper insulation materials and inverters can help to maintain the steady-state temperature of tanks and stacks at about 20 °C without additional heating.
When applying 0.02 m or more polyurethane insulation for an ambient temperature scenario of between 5 °C to 15 °C, the cooling strategy mentioned above is very effective, allowing the temperature of tanks and stacks to be maintained between 25 °Cand 35 °C. A passive cooling strategy is not required when there is no insulation applied in this case no matter whether inverters are isolated or not.
Extra active cooling should be applied however if the ambient temperature varies from 25 °C to 45 °C because passive cooling is not sufficient to maintain the temperature of tanks and stacks below 40 °C during normal operation.
In addition, it is better to isolate the inverters from the inside of the container in all scenarios unless the ambient temperature is very low.

Author Contributions

Conceptualization, B.S. and M.S.-K.; methodology, B.S.; software, B.S.; validation, B.S., M.S.-K., J.B. and K.M.; formal analysis, B.S., M.S.-K., J.B., L.S.W. and K.M.; investigation, B.S., M.S.-K., J.B. and K.M.; resources, L.S.W. and B.S.; data curation, B.S.; writing—original draft preparation, B.S.; writing—review and editing, B.S., M.S.-K., J.B., L.S.W. and K.M.; visualization, B.S.; supervision, M.S.-K., J.B., and K.M.; project administration, J.B.; funding acquisition, J.B. All authors have read and agreed to the published version of the manuscript.

Funding

This project was partially funded by the Australian Research Council Research Hub for Integrated Energy Storage Solutions IH180100020.

Data Availability Statement

Data is unavailable due to privacy or ethical restrictions.

Conflicts of Interest

The authors declare no conflict of interest.

References

  1. Rychcik, M.; Skyllas-Kazacos, M. Characteristics of a new all-vanadium redox flow battery. J. Power Sources 1998, 22, 59–67. [Google Scholar] [CrossRef]
  2. Tang, A.; Ting, S.; Bao, J.; Skyllas-Kazacos, M. Thermal modelling and simulation of the all-vanadium redox flow battery. J. Power Sources 2012, 203, 165–176. [Google Scholar] [CrossRef]
  3. Tang, A.; Bao, J.; Skyllas-Kazacos, M. Thermal modelling of battery configuration and self-discharge reactions in vanadium redox flow battery. J. Power Sources 2012, 216, 489–501. [Google Scholar] [CrossRef]
  4. Yan, Y.; Li, Y.; Skyllas-Kazacos, M.; Bao, J. Modelling and simulation of thermal behaviour of vanadium redox flow battery. J. Power Sources 2016, 322, 116–128. [Google Scholar] [CrossRef]
  5. Wei, Z.; Zhao, J.; Xiong, B. Dynamic electro-thermal modeling of all-vanadium redox flow battery with forced cooling strategies. Appl. Energy 2014, 135, 1–10. [Google Scholar]
  6. Tang, A.; Skyllas-Kazacos, M. Simulation analysis of regional temperature effects and battery management schedules for a residential-scale vanadium redox flow battery system. ChemPlusChem 2015, 80, 368–375. [Google Scholar] [CrossRef]
  7. Shen, H.; Zhu, X.; Cao, H.; Xue, B. Thermal modeling and temperature control of an all-vanadium redox flow battery. In Proceedings of the 2019 12th Asian Control Conference (ASCC), Kitakyushu, Japan, 9–12 June 2019; pp. 1536–1541. [Google Scholar]
  8. Woodfield, R.; Glover, S.; Watson, R.; Nockemann, P.; Stocker, R. Electro-thermal modelling of redox flow-batteries with electrolyte swapping for an electric ferry. J. Energy Storage 2022, 54, 105306. [Google Scholar] [CrossRef]
  9. Shu, B.; Gao, M.; Zhang, D.; Meng, K.; Ashraf, R.N.; Wang, Y. Control strategy of three-phase inverter under weak grid condition. In Proceedings of the 2020 International Conference on Smart Grids and Energy Systems (SGES), Perth, Australia, 23–26 November 2020; pp. 740–745. [Google Scholar]
  10. Manufacturer, Fap-450. Available online: https://www.fuelcellstore.com/fumasep-fap (accessed on 10 November 2022).
  11. Maghsoudy, S.; Rahimi, M.; Dehkordi, A.M. Investigation on various types of ion-exchange membranes in vanadium redox flow batteries: Experiment and modeling. J. Energy Storage 2022, 54, 105347. [Google Scholar] [CrossRef]
  12. Cho, H.; Krieg, H.M.; Kerres, J.A. Performances of anion-exchange blend membranes on vanadium redox flow batteries. Membranes 2019, 9, 31. [Google Scholar] [CrossRef] [PubMed] [Green Version]
  13. Li, Y.; Sun, L.; Cao, L.; Bao, J.; Skyllas-Kazacos, M. Dynamic model based membrane permeability estimation for online soc imbalances monitoring of vanadium redox flow batteries. J. Energy Storage 2021, 39, 102688. [Google Scholar] [CrossRef]
  14. Iwaki. iwaki pump. Available online: https://iwaki-nordic.com/en/home/download/oem/performance-curves/md/ (accessed on 10 November 2022).
Figure 1. A containerised VFB system.
Batteries 09 00196 g001
Figure 2. A schematic diagram of a containerised VRB system.
Batteries 09 00196 g002
Figure 3. Current profile.
Batteries 09 00196 g003
Figure 4. SOC response.
Batteries 09 00196 g004
Figure 5. Electrolyte flow rate.
Batteries 09 00196 g005
Figure 6. Hysteresis temperature control.
Batteries 09 00196 g006
Figure 7. Temperature response for containerised VFB using FAP-450 membrane for ambient temperature between 15 °C and 35 °C (a) without insulation and fans, inverters are isolated from the inner environment ( Q i n v e r t e r = 0   W ); (b) without insulation and fans but inverters are not isolated ( Q i n v e r t e r = 1315.24   W ); (c) with 0.02 m thick polyurethane insulation and cooling strategy, inverters are isolated from the inner environment ( Q i n v e r t e r = 0   W ); (d) with 0.02 m thick polyurethane insulation and cooling strategy but inverters are not isolated ( Q i n v e r t e r = 1315.24   W ).
Batteries 09 00196 g007
Figure 8. Heat generation and transfer information of studies in case 1 (ad), as shown in Figure 7a–d.
Batteries 09 00196 g008
Figure 9. Temperature response with a feasible cooling strategy, 0.02 m thick polyurethane insulation material as well as FAP-450 membrane when the ambient temperature ranges from 5 °C to 15 °C, Q i n v e r t e r = 0   W .
Batteries 09 00196 g009
Figure 10. (Top): temperature response without cooling strategies but with 0.02 m thick insulation material and FAP-450 membrane when the ambient temperature ranges from −40 °C to −20 °C and inverters are isolated; (Bottom): Temperature response without cooling strategies but with the insulation material and FAP-450 membrane when the ambient temperature ranges from −40 °C to −20 °C and inverters are not isolated.
Batteries 09 00196 g010
Figure 11. Temperature response for containerised VFB using FAP-450 membrane for ambient temperature between 25 °C and 45 °C with no insulation and fans on/off is dependent on cooling strategy, Q i n v e r t e r = 0   W .
Batteries 09 00196 g011
Table 1. Specifications of the system.
ParameterSymbolValue
Volume of each tank
Volume of each stack
Number of stacks
Volume of each pipe(tank to stack)
Flow rate factor
Total vanadium concentration
Specific heat of electrolyte
Density of electrolyte
Thickness of tank walls
Tank wall material heat transfer coefficient
(polyethylene)
Stack flow frame thermal conductivity
(polytetrafluoroethylene)
Membrane area
Membrane thickness
Activation energy for diffusion
Reaction (6) enthalpy change
Reaction (7) enthalpy change
Reaction (4) enthalpy change
Reaction (3) enthalpy change
Overall heat transfer coefficient of
from side walls to air of each tank(no insulation)
Overall heat transfer coefficient of
from bottom walls to air(no insulation)
Overall heat transfer coefficient of
from side walls to air of each tank(with 0.02 m insulation
Overall heat transfer coefficient of
from bottom walls to air(with 0.02 m insulation)
Overall heat transfer coefficient of
from top wall to inner air of each tank
Overall heat transfer coefficient of side walls of each stack
Overall heat transfer coefficient of
from bottom walls to air(with 0.02 m insulation)
Gas constant
Overall heat transfer coefficient of the container
(steel side walls, no insulation)
Overall heat transfer coefficient of the container
(steel top wall, no insulation)
Overall heat transfer coefficient of the container
(side walls with 0.02m insulation)
Overall heat transfer coefficient of the container
Pipe length (each)
Pipe diameter (tanks to stacks)
Pipe diameter (stacks to tanks)
Pipe thickness (tanks to stacks)
Pipe thickness (stacks to tanks)
Overall heat transfer capability of pipes (tanks to stacks)
Overall heat transfer capability of the pipes (stacks to tanks)
Cell resistivity for charging(average)
Cell resistivity for discharging(average)
Container size
Inverter size(each one)
Copper thermal conductivity(current collectors in stacks)
Thickness of container
Thickness of insulation materials
V tan k
V stack

V pipe 1 V pipe 2 Q f c C ρ ρ θ k tank

k stack

S d
E a
Δ H ( 1 )
Δ H ( 2 )
Δ H ( 4 )
Δ H ( 5 ) U t sd 1

U t bt

U t sd 2

U t bt 2

U t tp

U s 1
U s 2

R
U con 1

U con 2

U con 3

U con 4 L
θ pipe 1
θ pipe 2
D 1
D 2
U p 1 A p 1
U p 2 A p 2

R c
R d
V con
V inv
K co
θ con
θ ins
3.608   m 3 10.3   L 20 2.4261   dm 3 3.7561   dm 3 2 1.6   mol / L 3.2   Jg - 1 K - 1 1354   kgm - 3 0.01   m 0.34   Wm - 1 K - 1  

0.3   Wm - 1 K - 1  

1000   cm 2
1.27 × 10 4   m
17,341   Jmol - 1
220   kJ   mol - 1
64   kJ   mol - 1  
91.2   kJ   mol - 1 246.8   kJ   mol - 1
1.896   Wm - 2 K - 1  

2.756   Wm - 2 K - 1  

0.753   Wm - 2 K - 1  

0.86   Wm - 2 K - 1  
4.45   Wm - 2 K - 1  

1.88   Wm - 2 K - 1  
3.13   Wm - 2 K - 1  

8.314   Jmol - 1 K - 1
2.04   Jmol - 1 K - 1

3.06   Wm - 2 K - 1

0.775   Wm - 2 K - 1

0.887   Wm - 2 K - 1
4.5   m 0.032   m
0.040   m
0.0058   m
0.0074   m
2.62   WK - 1
3.02   WK - 1

1.1   Ω cm 2
1   Ω cm 2
4.66 2.2 2.42   m 3
0.467 0.612 0.242 m 3
385   Wm - 1 K - 1
0.005   m
0.01   m
Table 2. Diffusion coefficient of FAP-450.
ParameterSymbolValue
Diffusion   coefficient   of   V 2 + k 2 4.31 × 10 10   dm 2 s - 1
Diffusion   coefficient   of   V 3 + k 3 1.92 × 10 10   dm 2 s - 1
Diffusion   coefficient   of   V 4 + k 4 6.53 × 10 10   dm 2 s - 1
Diffusion   coefficient   of   V 5 + k 5 3.78 × 10 10   dm 2 s - 1
Disclaimer/Publisher’s Note: The statements, opinions and data contained in all publications are solely those of the individual author(s) and contributor(s) and not of MDPI and/or the editor(s). MDPI and/or the editor(s) disclaim responsibility for any injury to people or property resulting from any ideas, methods, instructions or products referred to in the content.

