Article

Particle Contamination in Commercial Lithium-Ion Cells—Risk Assessment with Focus on Internal Short Circuits and Replication by Currently Discussed Trigger Methods

1
Research Center Energy Storage Technologies, Clausthal University of Technology, Am Stollen 19A, D-38640 Goslar, Germany
2
Institute of Electrical Power Engineering and Electrical Energy Engineering, Clausthal University of Technology, Leibnizstraße 28, D-38678 Clausthal-Zellerfeld, Germany
*
Author to whom correspondence should be addressed.
Batteries 2023, 9(1), 9; https://doi.org/10.3390/batteries9010009
Submission received: 8 November 2022 / Revised: 9 December 2022 / Accepted: 20 December 2022 / Published: 23 December 2022
(This article belongs to the Topic Safety of Lithium-Ion Batteries)

Abstract

:
A possible contamination with impurities or material weak points generated in cell production of lithium-ion batteries increases the risk of spontaneous internal short circuits (ISC). An ISC can lead to a sudden thermal runaway (TR) of the cell, thereby making these faults especially dangerous. Evaluation regarding the criticality of an ISC, the development of detection methods for timely fault warning and possible protection concepts require a realistic failure replication for general validation. Various trigger methods are currently discussed to reproduce these ISC failure cases, but without considering a valid basis for the practice-relevant particle properties. In order to provide such a basis for the evaluation and further development of trigger methods, in this paper, the possibilities of detecting impurity particles in production were reviewed and real particles from pouch cells of an established cell manufacturer were analysed. The results indicate that several metallic particles with a significant size up to 1 mm × 1.7 mm could be found between the cell layers. This evidence shows that contamination with impurity particles cannot be completely prevented in cell production, as a result of which particle-induced ISC must be expected and the need for an application-oriented triggering method currently exists. The cause of TR events in the field often cannot be identified. However, it is noticeable that such faults often occur during the charging process. A new interesting hypothesis for this so-far unexplained phenomenon is presented here. Based on all findings, the current trigger methods for replicating an external particle-induced ISC were evaluated in significant detail and specific improvements are identified. Here, it is shown that all current trigger methods for ISC replication exhibit weaknesses regarding reproducibility, which results mainly from the scattering random ISC contact resistance.

1. Introduction

The lithium-ion battery is a widely used energy storage device for a range of different applications [1,2]. The future production volume of lithium-ion batteries will further increase, especially due to the expected expansion of usage in electric vehicles and stationary storage systems [1,3]. However, lithium-ion batteries have a frequently discussed safety problem due to the limited thermal stability of some of the used cell components (electrolytes, active materials and separator) [4,5] and, as a result, safety-critical conditions are reported repeatably in field operation (field failures) [6,7]. In the worst-case scenario, the spontaneous exothermic combustion of cell internals, so-called thermal runaway (TR), occurs, resulting in the release of partly toxic gases and large amounts of energy [8,9]. The risk is further increased by the possibility of thermal propagation (TP) to adjacent cells in larger energy storage systems [10].
The onset of a safety-critical condition can be triggered by mechanical, electrical or thermal failures [11,12]. With the addition of passive protection devices [13], a battery management system (BMS) with intelligent fault detection [14,15], a robust mechanical design [16] or with appropriate cooling solutions [17] on system level, the risk of many faults can be reduced to a lower and acceptable level. One of these faults, which is suspected to be responsible for up to 90% of field failures [18], is the internal short circuit (ISC). Here, the characteristic short circuit is formed inside the battery casing, e.g., by dendrites, poor production and assembly quality or by particles from the production process itself [19]. Early warning of internal short circuits is challenging in practice [15,20]. Suitable countermeasures to minimise damage are currently not established, which further increases the criticality of ISC [5]. Alongside this, the failure is spontaneous within the permitted operating limits [21]. Impurities, in the case of external particles, can either cause local mechanical damage to the separator or, in the case of an electrically conductive particle such as iron (Fe) or nickel (Ni) located on the cathode, can form dendrites over a longer time period [22,23,24,25]. This leads first to dissolution (oxidation) with the formation of ions at the cathode and then to deposition (reduction), possibly in the form of dendrites, on the anode [23,26].
In addition to the ISC risk, impurity particles in the cell can lead to accelerated ageing behaviour and a decrease in performance [27,28,29]. The recall of 26,700 plug-in hybrid electric vehicles (PHEV) initiated in October 2020 due to possible impurities underlines this issue’s relevance in application even more [30].
Due to the layered structure of a cell with positive and negative electrodes—consisting both of current collector and active material—there are four different possible contact types for an ISC [31]. A large variance in resulting contact resistances is possible as a result of the strongly different electrical conductivities of the current collector material aluminium (Al) and copper (Cu) compared to the active materials of the cathode (Ca) and anode (An) [32]. For an ISC case with surface-related high power density, a rapid melting of the contact point occurs, which is known as the fusing phenomenon [19,32]. For the criticality of different short circuit types, in addition to the heat output, the possible heat dissipation and initiation of exothermic side reactions must also be considered [31,33]. In consequence, the ISC between Al and An (Al↔An) is the most critical ISC case, especially when the cell has a high state of charge (SOC) [19,31,33,34]. If the local heat generation is high enough, exothermic self-accelerating reactions occur, which can lead to a thermal runaway within a short time [11,32,35].
As a general source for possible impurities, the hardware, i.e., the complete set of machines used in production [29], or the cutting process of the electrode layers [23,36] are considered. In cell production, many moving parts of machines are present, which creates a risk of contamination due to possible material abrasion or collisions [3,37]. Thus, in cell production, focus must always be given to a high-quality standard in the various production steps, also in order to increase production efficiency and minimise scrap [28,38,39]. There are various approaches published in the literature for the detection of impurities, but to our best knowledge, no publicly available information exists regarding how far these methods are used in commercial cell production [3,39].
For example, J. Kurfer et al. developed a photo-optical system which scans the coating surface (electrode layer coated with active material) and detects particles down to a size of 100 μ m [36], which is a bit larger than the usual thickness of the electrode layer [40]. Using Infrared thermography (IRT), D. Mohanty et al. were able to detect particles with a size of ≤2 mm [29]. A. Etiemble et al. used X-ray technology with a resolution of 20 μ m to determine the electrode thickness as well as for the localisation of thickness changes caused by surface impurities [41]. Furthermore, the computed tomography (CT) scan has been found suitable for detecting contaminants in manufactured cells. The detectable particle size depends on the resolution of the scanner, such that Y. Wu et al. were able to detect particles with a size of 100 μ m [42] and G. Qian et al. even significantly smaller particles (about 20 μ m to 50 μ m) [38]. The CT scan is also suitable as a basis for detection with the assistance of neural networks, which was investigated in more detail for this specific application by O. Badmos et al. [43]. In addition, J. Robinson et al. successfully utilised ultrasonic waves to detect local cell defects with a size of 20 μ m to 200 μ m [44].
For the presented methods, specifically prepared cells with intentional impurities or cells that had already failed quality control due to increased self-discharge were analysed. To our best knowledge, there is no specific documentation of particles sizes and types that might be introduced within the production process without immediate short-circuit creation.
Many safety-critical failure cases in practice are reported to occur during the charging process [6,45,46,47,48]. However, the exact cause of these field failures remains unknown due to the limited analysis possibilities for a burned battery after the TR. In particular, the so-called sudden-death ISC [35] or ghost failures [49], in which no prior signals are present, cannot be plausibly explained at present, and, therefore, there is a need for new hypotheses [19], which will be presented in the following:
Due to ageing processes, such as side reactions with gaseous reaction products or solid electrolyte interface (SEI) layer expansion, there is an irreversible increase in the internal cell pressure correlated to the cell age, which is known as the swelling force [50,51,52,53]. For example, Y. Li et al. observed that after 1000 full cycles with 80% state of health (SOH) remaining, the swelling force increased four times compared to the new state (100% SOH) [50]. J. Cannarella et al. found that the swelling force of small (0.5 Ah) pouch cells increased from 0 MPa to 0.6 MPa when the cell has reached an SOH of 90% [51]; therefore, the aging-related increase in force reaches significant values. In addition, during the charging process, a reversible expansion in cell volume occurs—known as breathing—which ranges between 2% and 4% [52,54,55]. This force is particularly strong in the case of high current rates and/or a large pre-stress [56,57]. In summary, it can be concluded that the effective impact force on a hypothetical impurity particle increases due to parallel ageing processes and with each charging cycle, as visualised in Figure 1. Moreover, the mechanical stability of the separator also decreases with cell ageing [58,59,60], as indicated by the red curve in Figure 1. For example, X. Zhang et al. observed a reduction in strength by up to 30% after 1200 full cycles compared to the new condition in a punch test [59]. M. Sprenger et al. also noticed a decrease by 25% in tensile strength, 50% in failure strain and 30% in Youngs modulus when investigating aged cells at an SOH of 90% [60].
Thus, if there is an external particle between the cell layers, the risk of separator puncture and subsequent ISC increases with battery lifetime, because the resistivity of the separator and the load on the particle converge to each other.
The increase in force due to the charging process of one cycle is significantly greater than the constant aging-related growth of the swelling force [56]; thus, there is a higher probability of ISC occurring in the high SOC condition. Due to the large amount of electric energy and the reduced thermal stability of the cell materials, an ISC at a high SOC poses a significantly larger safety risk [61,62,63,64].
Understanding the development, fault behaviour and consequences of an ISC is a significant aspect of battery safety [19,35,65]. Due to its rare and stochastic [23] behaviour, ISC research requires methods for the intentional creation of such field failures [12,66]. Thus, a wide variety of trigger methods are discussed for investigating ISC behaviour [22,35,67]. Methods that are suitable for the imitation of particle-induced ISC are summarised in the following Table 1, with special focus on the corresponding geometric and material-specific parameters in anticipation of the later evaluation of the short-circuit conditions.
The melting wax layer of the PCM (phase change material) from NREL /NASA or deforming bimetal SMA (shape memory alloy) is considered as particularly suitable in the literature [19,22]. However, a ceramic nail with a nickel tip is also supposed to be much more suitable for simulating practical ISC compared to the conventional penetration test with a steel nail [68,69].
Table 1. Overview of current approaches to replicate a close-to-the-field ISC with special focus on the replicated geometric and material-specific short-circuit conditions.
No.NameDescriptionRefs.
Melting wax layer (phase change material—PCM)
  • Wax-coated Cu-puck is inserted into cell
  • ISC is triggered by melting insulation wax layer (at ~57 ° C)
  • Puck properties: contact area 0.32 mm to 4 mm; thickness 25 μ m
  • Cu puck is located between two pads corresponding to the current collectors with a diameter of 11mm. The thickness of these pads is between 25 μ m and 76 μ m, depending on the ISC type, so that the active materials become connected
[70,71,72,73,74]
Low-melting-point alloy
  • Tin/Bismuth/Indium (Sn/Bi/In) alloy with a melting point of around 60 °C
  • Electrically conductive liquid metal bridged the separator isolation. Short circuit area is 1 mm 2 . Metal coating 0.2 mm thick
[75]
Bi-metal (shape memory alloy—SMA)
  • Sharp arrow of SMA bends up and pieces the separator at around 70 ° C)
  • Nickel–titanium (Ni-Ti) alloy with a ground area of 7.5 mm × 7.5 mm and a thickness of 0.2 mm
[22,76]
External force on internal particle (Battery Association of Japan—BAJ)
  • Ni particle with L-shape (0.2 mm height, 0.1 mm width, 1 mm long each side)
  • Fe particle 0.25 mm to 1 mm
  • Part of IEC 62133-2:2017, IEC 62660-3:2016, JIS C8714
[69,77,78,79]
Inserting steel ball externally/blunt rod/IIISC Test
  • Pressing a steel ball (∅ 2 mm) into the cell
  • Similar mechanical stress on the cell as in the blunt rod test or indentation-induced internal short circuit (IIISC) test
  • Voltage drop is caused by pressure on internal cell layers
  • Critical ISC occurs due to deformation of the electrode current collector
[80,81,82,83]
Slots in separator and electrode materials
  • Small holes of 2 mm in diameter provide an ISC when pressure is applied
  • Temporary isolation of the defect by Kapton® tape, which is removed immediately before local force is introduced
[64,80]
Penetration: ceramic Nail with Ni tip
  • Nail diameter: 1 mm to 3 mm
  • Tip properties: angle 28 ° to 45 ° ; length 0.3 mm to 0.35 mm
  • Penetration stop: voltage drop 2 mV to 5 mV
  • Ceramic nail leads to less heat dissipation from ISC location than full metal nail
[68,69,84]
Slow penetration with small needle
  • Penetration with steel needle with a diameter of ≈1.25 mm
  • Slow penetration speed (0.02 mm s 1 )
[85,86]
The evaluation of different trigger methods to replicate these impurity-triggered internal fault conditions has not been made publicly available, yet. The direct link between failure case and failure replication represents a novel basis for the selection and further development of suitable trigger methods for field-realistic ISC. Thanks to the cooperation with a battery systems manufacturer, we gained unique and rare access to pouch cells that passed the cell manufactures quality control but had particle inclusions visually detected by input control, thereby gaining the rare opportunity to analyse indisputable realistic field impurities. Both the corresponding risk under increasing tension force (see above) and in-depth ex-situ analyses were conducted. The results of this paper show that impurity particles in cell production cannot be completely prevented and must be considered as a possible cause for the feared internal short circuit.
The remainder of this paper is structured as follows: In Section 2, both the cells under investigation and utilised analysis methods are described. Based on the particles presented in Section 3, first, potential sources and corresponding risks are identified in Section 3.3, followed by the comparison of current trigger methods with the findings (Section 3.4). The conclusions derived are presented in Section 4.

2. Materials and Methods
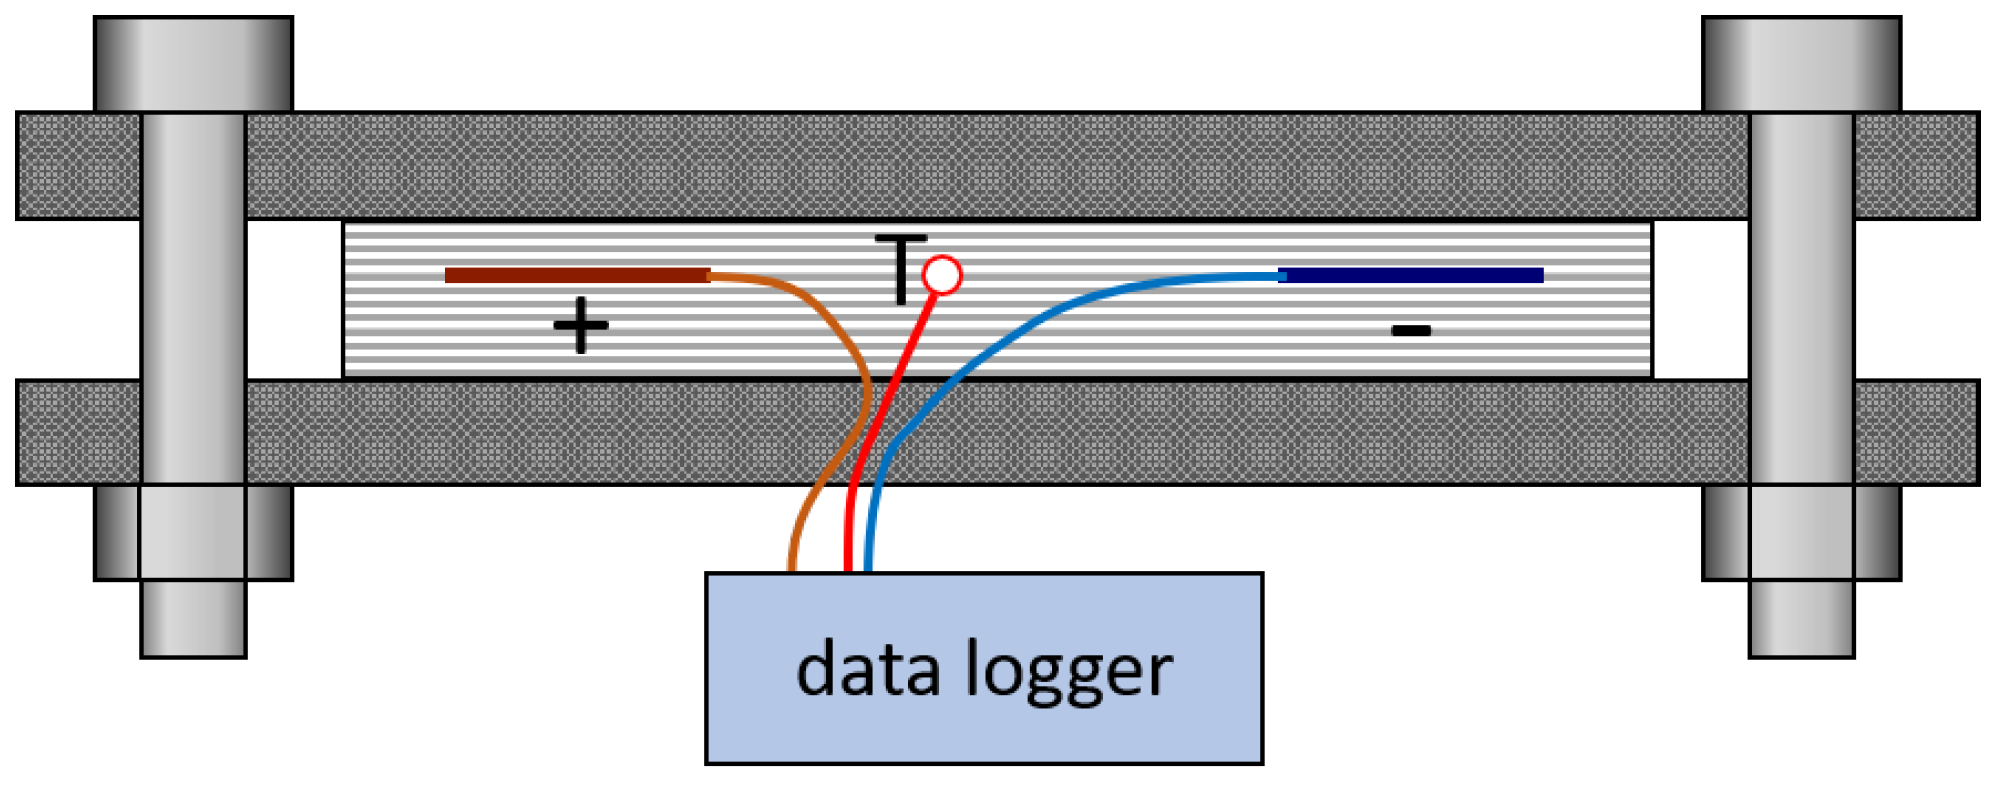
For the investigation, six 53Ah high-energy pouch cells with the cell chemistry nickel manganese cobalt (NMC)/Graphite were used. For an overview, the cells with the particle inclusions are listed in Table 2.
First, the inclusions were classified, according to their visibility characteristics on the outer pouch foil, into the categories poor, medium and good. Then, the increase in tension force due to changes in battery state (SOH and SOC) was investigated using three tension configurations. The cells were then disassembled and the identified particles were analysed using optical microscope and SEM (scanning electron microscopy) with EDX (energy dispersive X-ray spectroscopy). The process steps are shown in Figure 2.

2.1. Tensioning

As a safety precaution, the cells were located in a special storage chamber for lithium-ion batteries (manufacturer: Stöbich; type: Stainlock L). To monitor the cell state, the temperature and the cell voltage were recorded by a datalogger (manufacturer: Graphtec; type: midiLogger GL 240) with a sample rate of 100 ms and a resolution of 1mV, in order to detect possible ISCs. For temperature measurement, 0.5 mm thick type-K mantle thermometers (manufacturer: TC Direct; type: 405-008) were used. One sensor per cell was positioned between the cell tabs with thermal insulation from the outside. The temperature of the chamber was not actively controlled, so that possible temperature fluctuations, e.g., day–night period, were able to influence the cell voltage due to entropy effects [87,88]. However, due to the placement of the storage chamber inside a laboratory and its massive walls, this effect was damped. At the beginning of the voltage measurement, the initial voltage U Init with the corresponding temperature value was set as a comparative value. Later, after 44 h to 52 h, the voltage U End was determined when the cell reached the same temperature as in the initial state to minimise thermal effects. For verification, an intact cell ( Cell ref ) without particle inclusions was taken as a reference. The cells were delivered with a voltage of 3.59 V to 3.67 V, which corresponds to a low SOC. In total, the three states listed in Table 3 were investigated.
In each configuration, the cells were monitored for at least 48 h to ensure a constant pressure state in the cell [89]. The first unstrained state (configuration No. 1) was used to demonstrate an intact cell by constant cell voltage. For the second state (configuration No. 2), the cells were tensioned with an area force of 0.25 MPa, which is typical for automotive pouch cells [56,90]. Therefore, the cells were clamped between two 8 mm thick aluminium plates and screwed with eight M8 screws with a torque of 1.5 Nm using a torque spanner (manufacturer: Wera; type: 7440), which is illustrated schematically in Figure 3. The relationship between the torque and the area force was previously determined with a load cell (manufacturer: Burster; type: 8526-6002). In the final configuration, No. 3, the area force was increased by a factor of 4 to 1 MPa. A further increase in the tension force was not considered due to the limited bending stiffness of the aluminium plates.
The cells were tested in two batches incorporating the cells Cell 1 , Cell 2 , Cell 3 and Cell 4 , Cell 5 , Cell 6 , respectively. The reference cell ( Cell ref ) was measured both times in parallel. However, charging of the cell was not performed due to the following reasons:
  • Significant increase in TR risk if ISC is created at high SOC state [62];
  • Losing the opportunity for any ex-situ analysis of realistic particles in case of TR;
  • Overall significant effort required for handling the potential TR of large-format (53 Ah) cells.
In contrast to the low SOC, in which the cell was tensioned, there was a significantly increased probability of a TR if an ISC occurred in the high SOC [62]. In the case of a TR of a cell, the analysis of the impurity particle would be practically impossible and would result in reduced knowledge benefit. Furthermore, the risk of a TR should be kept low due to the possible severity of damage for these large-format cells.

2.2. Disassembling

The cells were discharged to 2.7 V (0% SOC) before disassembly to reduce the safety risk [91]. With a ceramic cutter, the cell layers at the particle inclusion were removed with an approximate area-size of 5 × 6 cm layer per layer until the particle was reached. Both depths in terms of number of layers and position within one layer was documented. For further analysis, the samples were stored in glass cups.

2.3. Particle Analysis

For the optical analysis, a digital microscope (manufacturer: Keyence; type: VHX-5000) was used and the particle size was determined. Furthermore, images were taken with an SEM from Zeiss (type: Evo). An EDX from Bruker (type: Quantax 800—XFlash 6) was used for material analysis.

3. Results

3.1. Tensioning

No change in cell tension was measured in any of the individual tensing states (No. 1–3) after eliminating the influence of temperature changes. Even when the complete measurement time of about 10 days is considered ( U init , config No . 1 to U end , config No . 3 ), no significant change in voltage can be measured, as shown in Table 4. With a resolution of 1 mV, the measured value may fluctuate by ±1 mV. By applying a filter, the trend of the voltage curve was determined as Δ U .
Here, a maximum voltage change Δ U of −0.744 mV was calculated for Cell 4 . For the reference cell, a deviation of −0.14 mV resulted in the first batch and a difference of 0.29 mV in the second batch. Thus, the fluctuation in the cell voltages can be explained by a combination of limited measurement accuracy, residual entropy effects [88,92] due to temperature influence and self-discharge [93]. An existing significant ISC can be excluded at this point. Due to the already visible bending of the aluminium plates in configuration No. 3 (1 MPa), an inhomogeneous distribution of the surface force can already be assumed. However, since the increase in force as a result of changes in SOH and SOC would be distributed more homogeneously over the cell surface [53], the non-existing ISC here cannot be used to draw representative conclusions about the high mechanical-load tolerance of the separator and its principally lower criticality.

3.2. Disassembling and Particle Identification

When the cells were disassembled, electrically conductive and non-conductive particles were found inside. The impurity particles were located between different cell layers, as shown schematically in Figure 4—also refer to Table 5 for specification of the involved layer components. For a possible faster ageing and performance decrease due to electrochemical inactivity, non-conductive particles are less relevant than conductive particles [29]. Conductive particles are much more critical for a potential risk of an ISC, since they become part of the current flow [19]. In the following, positions in which conductive metallic particles were found are focused on. The complete set of particles is then summarised in Table 6.

3.2.1. Particle 2.1

The localisation and removal of particle 2.1 is shown in Figure 5. Particle 2.1 was located at position E and created a clear bump in the overlying layers (Figure 5 left). In the separator layers 4–6, increasingly stronger separator deformations and, in the centre at the particle position, transparent areas were visible. The transparent separator areas result from the pressure-induced pore plugging and lead to locally hindered ion transport in the cell, which can affect Li plating [27]. Separator layer 6 had no visible holes, but the pressure spots and warps showed signs of starting mechanical wear (Figure 5 center), which would be further stressed by cyclic loading [58]. Particle 2.1 was clearly pressed into the active material, but had no direct contact with the Al collector. The following separator layers, 7 and 8, also showed local pressure spots.
Figure 6a,b shows the images from the optical microscope. As indicated by the scale, the particle had a width of 1 mm, a length of 1.7 mm and a thickness of about 0.8 mm. The surface appears relatively rough. With the EDX-analysis realised in the yellow marked region of Figure 6c, a clear detection of Al and magnesium (Mg) is visible in Figure 6d, which means that this particle was an Al–Mg alloy. This result also corresponds to the colouring of images in Figure 6a,b. The fluorine (F) and phosphorus (P) components have their origin in the conducting salt LiPF 6 and appear on all samples.
In principle, an Al-particle could result from laser cutting of the Al-cathode collector [43]. However, the particle was significantly larger than the usual thickness of an electrode collector, at 10 μ m to 25 μ m [40,94]. Therefore, the origin of this particle is assumed to be machine abrasion [29], which is supported by its size and shape.
The size and location of the particle pose a significant safety risk to the cell due to the high electric conductivity of aluminium (~ 37.7 × 10 6 S m 1 ) [32]. The lower melting temperature, of 660 ° C, compared to other metals favours a fusing process; however, based on the particle size, this process would only locally interrupt the internal short circuit. The danger of a continuous, critically developing internal short-circuit situation would still exist [80,95]. Consequently, the risk caused by particle 2.1 is rated as high.

3.2.2. Particle 5.1, 5.2 and 5.3

In Cell5, three particles (5.1, 5.2 and 5.3) were located in position , as shown in Figure 7. The close locations of the particles suggest that the origin of the particles is linked.
With a size of 3.5 mm × 1.6 mm, particle 5.1 was the largest particle found in this analysis. In the detailed images in Figure 8a, the bulky shape, but with a mostly smooth surface, of particle 5.1 is visible. Inside the separator, the particle contour is clearly identified as a pressure zone in Figure 8b.
Particle 5.1 consisted of a non-conductive material and, consequently, the SEM image (Figure 8c) was charged—as indicated by bright spots and the lower contrast. The over-average Flur (F) component of the EDX analysis (Figure 8d) is not purely related to the conducting salt ( LiPF 6 ). Consequently, it is reasonable to assume that the particle originates from a fluorinated polymer such as PTFE (Polytetrafluoroethylene), which is also consistent with the colouring. Due to the low electrical conductivity of particle 5.1, the risk of a mechanically induced separator rupture can be classified as reduced. Nevertheless, the size of particle 5.1 leads to structural stresses in many other electrode layers, resulting in an increased risk of a separator defect and a potentially critical contact between the anode and cathode [19,33]. However, the additional mechanical stress due to increased tension force in condition No. 3 (1 MPa) did not result in any separator damage, so the risk is classified in the medium range.
Particle 5.2 also caused clear structural changes in the above separator layer. This particle 5.2 showed a triangular shape with peaks which are slightly curved upwards and the dimension was 1.4 × 1.5 mm. The surface shows a thin black coating in Figure 9a. The particle edges, on the other hand, were rough and look like a broken edge (Figure 9b). From the EDX-analysis, Figure 9c, increased Fe amounts and traces of Ti were detected. It is, therefore, highly probable that particle 5.2 was an Fe particle in which titanium had been used as an additive [96]. Particle 5.2 was potentially dangerous for a separator puncture due to its partially peaked corners. The good electrical conductivity (~ 9.9 × 10 6 S m 1 ) and the high melting point of Fe (~1500 °C) created a high risk of a safety-critical failure should an ISC occur [32].
Particle 5.3—measuring 0.3 mm × 0.7 mm—was significantly smaller than the adjacent particles 5.1 and 5.2 (Figure 10a)). The crystalline structures on the particle consisted of conducting salt ( LiPF 6 ). The colouring and EDX analysis (Figure 10c) indicate that the particle was carbon (C), presumably corresponding to the anode active material (graphite). The safety risk of this particle, 5.3, is considered low due to the smaller size of the comparatively low electric conductivity (~100 S m 1 ) and mechanical stability of graphite compared to the metal particles (2.1 and 5.2) [22,97].
Polymer particle 5.1 and Fe-particle 5.2 could have been created by a mechanical abrasion with a machine used in production [23,29]. The graphite particle, 5.3, could have been already adhered to a machine and fallen on the cell layer due to collision impact.

3.3. Evaluation of All Particles

Further particles were found in the cells, which are—together with the particles presented—summarised in Table 6 regarding their characteristic properties.
Particle 1.1 had a fibre-like structure, which is glued together in the particle centre. The safety risk of particle 1.1 is classified as low as a result of its non-electrical conductivity. Due to the colourless and transparent structure, the fibres could originate from separator production. However, this assumption is not supported by the fact that the fibres have a thickness of 25 μ m to 35 μ m, which is significantly larger than the structures of the commercially used separators, which have a thickness of approximately 20 μ m to 25 μ m [13,94].
Particle 3.1 also belonged to the category of conductive particles, but due to its more paste-like structure, the risk of separator penetration was significantly lower and the general risk is, therefore, rated as medium. Particles 4.1, 4.2, 4.3 and 4.4 were taken from outside the active electrochemical cell area. Due to the small size, low conductivity and minor mechanical stability of the active materials, the outgoing risk is rated as low [22,97]. Particle 6.1 was also removed from position of the Cell 6 and had a brownish-yellow round structure. Increased silicon (Si) contents were detected in the EDX analysis. It can be assumed that the Si content originates from a silicate used as a flux in soldering, e.g., of the cell tabs [98]. The generated risk level of Particle 6.1 is evaluated as low.
One of the properties is the visual appearance on the cell surface. Figure 11a clearly shows that particle 5.1 caused a more prominent bump on the pouch foil than did particle 5.2 and one significantly heavier than particle 5.3 did. In connection with the particle sizes, it is clear that smaller particles are more difficult to detect by visual appearance from the outside. However, larger impurities such as 2.1 are also more difficult to detect with a deeper layer positioning (Figure 11b), since the deeper position smooths out the uplift and makes it less prominent.
Considering the position of all found particles (Table 6), it is noticeable that the particles appeared more frequently in the upper cell layers. On the other hand, only larger and more mechanically stable particles were found in the deeper cell layers ( and ). Position is located at approximately 10% of the total cell thickness, which means no particles could be found—when we look at the top and bottom side—at approximately 80% of the cell volume. Agglomerations of anode- or cathode-active material have a similar structural stability, as a result of which impurity particles adapt to the active material applied to the collector [97]. Therefore, it is reasonable to assume that deeper lying and smaller particles cannot be detected by visual inspection and find their way into commercial use. This fact is particularly risky in the case of metal particles. For cells with a prismatic or round housing, a visual inspection of this kind is not possible anyway. The size of the particles found suggests that only limited methods for detecting impurities are used in the cell production by the manufacturer of these cells or that the particles found their way between the electrode layers in a subsequent production step.

3.4. Evaluation of Current Trigger Methods for Particle-Induced ISC

The metal particles 2.1 and 5.2 found in this study, with an edge length of <1 mm, were significantly larger than the particles presented by G. Qian et al. with a size in the micrometre range (approx. 20 μ m to 50 μ m edge length) [38]. The smallest particle inclusion found in this study (Particle 6.1) had a size of 0.25 × 0.3 mm. It can be assumed that the occurring particle inclusions have a wide particle size distribution, in reality. Particles in the size of the separator thickness can only create an ISC between the active materials (Ca↔An), which is considered to have lower safety criticality [19,33]. However, larger particles above ~60 μ m can create an ISC between one collector and the active material of the counterpart electrode [40]. In particular, a short circuit between the aluminium collector of the cathode and the anode active material (Al↔An) is considered particularly safety-critical [19,33,72] and has to be reproduced as a worst-case scenario during battery safety tests. It can be expected that the separator will be penetrated by larger particles (such as particle 2.1 or 5.2) only locally, similar to a pinch test [99], and, consequently, the resulting contact area will most likely be smaller than the particle diameter. The resulting contact resistance is responsible for the criticality of the short circuit and will be affected by some variation, mainly due to the size of the contact area [32,100], the material [32], the contact force [80,101] and the amount of available electrolyte [85], as a result of which each occurring ISC has a certain uniqueness. M. Chen et al. investigated different contact resistances by a ~20 times repeated puncture with a steel needle and obtained a contact resistance of 2.5 ± 1.5 Ω between the needle and An/Cu and a contact resistance of 20.3 ± −12.4 Ω between the needle and Al/Lithium Cobalt Oxide ( LiCoO 2 ), which represent significant scatter [85]. Depending on the technical properties, all trigger methods presented in Table 7 are expected to show scattering of at least this order of magnitude.
The PCM device ① presented by NREL can be used to create contact surfaces of various sizes with diameters in the range of 0.32 mm to 4 mm. The smaller contact area is considered to be well-suited for reproducing practical fault cases. Conceptually, it is possible to adapt the thickness or material of the puck through which the current flows in the ISC case. The reproducibility is considered high compared to other trigger methods, such as the nail test defined in current standards [19,22]. However, this trigger method also has a certain variance in the results, which is based, in particular, on the already discussed scattering of the short-circuit resistance. In [71], it is reported that 6 of 10 cells were triggered to TR in a test series to produce an ISC of the Al↔An type. In two of these cells, no activation of the device was registered. With the Al↔Cu ISC type, the device was activated in 7 out of 10 cells, and one cell in total achieved a TR. In a further application with 9 round cells (type 18650), this device was activated in some cases only at a significantly increased temperature of 100 ° C [74]. L. Liu et al. tested the PCM in 8 cells, whereby one cell was triggered at 29.5 ° C and another cell was triggered only after extra pressure was applied to the prepared location [22].
The melting Bi/Sn/In-alloy ② can only be evaluated based on a single study. Here, only one 18650 round cell with the rather uncritical short-circuit-type Ca↔An was tested [75]. Other experiments were conducted with coin cells and resulted in an ISC in 4 out of 5 cases. The contact resistances before short-circuit initiation varied between 10 Ω and 35 Ω. The short circuit occurred at temperatures between 58 ° C and 65 ° C. From the voltage curves, it can be deduced that different ISC resistances were generated.
In the first research performed with SMA ③ four 1 Ah cells with ISC type Al↔An were investigated [76]. The ISC was triggered between 58 ° C to 72 ° C accompanied with a sudden voltage drop. All the investigated cells with this ISC type (Al↔An) went into a TR with similar maximum temperatures. The other two investigated cells—shorted with type Ca↔An—reached similar maximum temperatures of 70 ° C. From the voltage curves, it can be determined that the first cell already dropped from 4.2 V to 4 V after 2000 s, whereas the second cell took double the time of ~4000 s for this voltage drop. In the investigations by L. Liu et al., the SMA was triggered at a temperature between 60 ° C and 80 ° C [22]. However, one device only functioned when additional local pressure was applied.
Methods ①, ② and ③ trigger the ISC all by a temperature-related phase change. In the case of positioning in deeper cell layers, the cell must be heated up significantly before the trigger temperature is reached internally [102]. When applied to cells with a hard case (prismatic design or round cells), heat distribution on the cell surface is enhanced, which leads to a large heating zone for the cell. This heating of the cell results in a higher criticality due to the significantly lowered internal cell resistance between 50 ° C and 90 ° C [103,104] and a lower temperature difference before exothermic side reactions’ start (80 ° C to 105 ° C) [105], which does not correspond to the practical application.
The technique BAJ ④, which placed an electrically conductive external particle between the cell layers and then created an ISC by applying an external force, comes close to the realistic failure case. However, the reconstruction of a single layer ISC requires an iterative strategy to determine the correct force level. It should also be noted that for every cell type and every particle type (size and shape), this value needs to be determined individually [77]. A single-layer ISC was achieved with quite high accuracy in the studies by K. Maeda [69]. In the study by H. Döring et al., two different particle sizes (∅0.25 mm and 1 mm) were implemented in the cell. Then, a cylindrical stamp (∅150 mm) was used to generate a large-area compressive load. The smaller 0.25 mm Fe particle did not lead to an ISC even under a very high large-area pressure load of 154 kN (deformation to 50% of the cell thickness). A larger Fe particle with 1 mm diameter caused a clear voltage drop at 55 kN. When the compressive load was further increased to 154 kN, the particle triggered a TR. For testing cells with a hard case, the fully charged cell coil is removed out of the case and the particle-prepared cell is then sealed in a plastic bag [79]. The original case is not used further. A test of this type is required, for example, in the JIS C8714 and IEC 62,133 standards [79,106]. The approach of repeating the test five times, documented here, is recommended. The reproducibility of this methodology is difficult to assess due to a lack of data, but in comparison it is considered to be between moderate and good.
In method ⑤, a steel ball is pressed into the cell. Due to the setup it will not participate in the ISC, but will deform the cell internally to a point where the separator collapses and an ISC between Ca↔An is formed first [80]. With further applied load, the upper collector bends into the active material below and creates more critical ISC conditions. For an SOC of 95%, ISC occurred quite reproducibly in four repetitions with a required force application between 260 N to 280 N, whereas other voltage and temperature characteristics showed different ISC resistances. In another study, J. Lamb et al. produced similar ISC conditions with a blunt rod test, in which a blunt steel body with a diameter of 3 mm was pressed into the cell until the voltage dropped [81]. Repeated runs also showed that the force required to reach the ISC was very constant—ranging from 935 N to 939 N. However, the ISC conditions were different, which is shown by the different maximum temperatures of 99 ° C (soft ISC) and 455 ° C (hard ISC). Overall, under different experimental conditions, soft ISCs were found to be present in about 25% (2 out of 8) of the tested cells, and, therefore, different ISC characteristics must also be expected for this method. The performance of this test type is well practicable on pouch cells. When the test type is transferred to cells with a hard case, in particular such as prismatic cells, a large force is required to trigger the ISC and the internal surface load will be less local, which does not correspond to the conditions of an ISC triggered by a particle in the small mm range [66,81,83].
Method ⑥, presented by P. Ramadass, creates a defect in the separator with a diameter of 2 mm. A flat plunger is used to create the compression impact. Just before the plunger touches the cell surface, the Kapton® tape is pulled out of the cell. This procedure is both critical from a safety point of view, and can also only be transferred to a limited extent to large-format cells. It was observed that a compressive load of about 333 N did not lead to complete contacting of the previously prepared defective area. On the other hand, an increased force led to a multi-layer ISC, which means that the optimal force design requires experience or extensive pre-tests. The optional local removal of the active material at the cathode also enables the more critical Al↔An ISC type, in addition to the Ca↔An type. Due to a single test with identical parameters, the reproducibility can be evaluated only to a minor extent. The presented results showed, at least for both short circuit types, an increasing maximum temperature with increased SOC ( T max , 100 % > T max , 80 % > T max , 60 % ), which corresponds to a plausible behaviour. The experiments by B. Liu et al., with a defect of 10 mm 2 in the separator, led to an untypical contact resistance of approx. 40% lower for the ISC type Ca↔An than for the type Ca↔Cu [80]. T. Volck et al. tested the contact resistances of all four short-circuit types (with and without electrolyte) with a larger sample of ten single-layer pieces each [101]. For this purpose, a 1 mm 2 large and 0.2 mm thick copper particle was implemented in a separator hole. The standard deviations of the measured short-circuit resistances were typically about 50% of the mean value. For a practical fault replication, the separator defect should be selected to be ≤2 mm.
External penetration by a nail (method ⑦) with a nickel tip has the advantage that the preparation effort—compared to the already-mentioned tests—is minimised. However, for cells with a hard case, a reduction in the case thickness is foreseen [68]. In the studies by K. Maeda et al. for the desired voltage drop of 2mV with a penetration speed of 0.05 mm s 1 , typically two to five cell layers were short-circuited [69]. Nevertheless, the short-circuit characteristic is clearly more local and, thus, more safety-critical than the nail test with conventional steel nails [84]. The replication of different ISC types is not possible due to the comparatively large Ni tip (∅ ~0.3 mm).
Method ⑧ with a thinner needle, also leads to a more local heat generation [85,86]. Depending on the cell configuration, either the anode or the cathode is penetrated first and, thus, better contacted. Consequently, the cell structure predefines different critical ISC scenarios. In the study by S. Huang et al., it was first possible to reproduce more gentle voltage drops by a slow (0.02 mm s 1 ) needle penetration and—with further penetration—more critical ISC conditions [86]. Similar to method ⑦ it was possible to simulate different contact resistances with varying penetration depths. The generation of relatively gentle ISC can present the possibility of triggering ISC initiated by small particles in the size range of 0.1 mm. Due to the limited mechanical stability of the needle, transferability to cells with hard cases is only possible with prior case adaptation. All methods that insert a third-party material inside the cell (method ④ ⑦ and ⑧) can vary the melting point and, thus, the fusing behaviour through a selected material choice. However, mechanical stability must also be considered in the realisation. The advantage of methods ⑦ and ⑧ is the free parameter combination of SOC, temperature and SOH.

4. Conclusions

By in-situ and ex-situ analyses, six large-format pouch cells with visually detected impurities were investigated. These impurities were identified not only as metallic conductive particles with diameter x ≥ 1 mm, but as smaller impurities (x ≤ 1 mm) of active materials and other non-conductive contaminants. Although methods for particle detection in cell production have already been developed and published by the scientific community, the findings indicate that these do not currently seem to be generally applied in cell production. Thus, apparently, in cell production, inclusions of impurities cannot be completely prevented. Due to the location of the impurities found within the outer 10% layers, it is unlikely that all critical impurities can be identified in a subsequent visual inspection.
Using real compression, the safety risk of the defects was evaluated. Although moderate compression did not caus an ISC of the investigated cells, structural changes in the separator were identified in a subsequent analysis.
Based on the material properties, the individual origins of the particles—ranging most likely from machine abrasion to material abrasion—were discussed. In addition, the specific risk potential was classified, as summarised in Table 6. The risk of causing a safety-critical ISC is considered high for the large (≥1 mm) metallic (Fe and Al) particles found.
With consideration of already-published behaviour of the internal cell tension during operation and lifetime as well as the ageing process of the separator, the failure process of sudden ISCs was deduced and described (see Figure 1). Thus, the probability of spontaneous ISC occurring in the critical high SOC increases with battery lifetime due to the increasing force on the internal particle and the reduced separator stability, which describes so far unexplained causes of failure, especially during or immediately after the charging process. Nevertheless, further experimental tests are needed to replicate field ISCs, especially to investigate their causes and consequences, for developing detection methods and new safety concepts, as well as for a general risk assessment.
Currently discussed test methods for this purpose were evaluated in terms of such important parameters as reproducibility, possibilities of parameter adjustment and transferability, etc., based on published results. Due to varying contact resistances, significant scattering must be expected with all considered methods. Since, even under laboratory conditions, there is considerable variation in the essential contact resistance for the ISC, independent of the method, a well-founded evaluation is only possible by increasing the number of tests (n ≥ 5) with the same test parameters. Overall, only a few experimental studies are currently available for evaluation. In particular, the application to larger cells has hardly been investigated and more related research investigations are required here.
At least for pouch cells, slow needle penetration (method ⑧) is an interesting novel trigger method with potential for further development. This includes, for example, stopping needle penetration after the first ISC for a closer field-failure replication and monitoring the ongoing progress. In the future, this approach will be investigated in detail by the authors of this paper.
Since the position of an impurity particle must be assumed to be random, the most safety-critical ISC case, Al↔An, must be replicated as a worst-case scenario. This is more reliable than methods that prepare the cells internally. On the other hand, this ISC type can also be replicated by precise needle penetration, assuming the cathode is the outer cell layer.

Author Contributions

Conceptualization, J.G. and J.K.; methodology, J.G.; investigation, J.G.; data curation, J.G.; writing—original draft preparation, J.G.; writing—review and editing, J.G. and J.K.; visualization, J.G.; supervision, H.-P.B. and I.H.; project administration, R.B.; funding acquisition, R.B. All authors have read and agreed to the published version of the manuscript.

Funding

This research was founded by the Federal Ministry for Economic Affairs and Climate Action of Germany in the project RiskBatt (project number: 03EI3010A).

Institutional Review Board Statement

Not applicable.

Informed Consent Statement

Not applicable.

Data Availability Statement

The data of this study as well as further information are available on request by the corresponding author.

Acknowledgments

We thank Dorian Hühne and Mahmoud Mhaidly for the experimental support. The authors acknowledge the financial support of the Federal Ministry for Economic Affairs and Energy of Germany in the project RiskBatt (project number 03EI3010A). We thank the support by Open Access Publishing Fund of Clausthal University of Technology.

Conflicts of Interest

The authors declare no conflict of interest. The founders had no role in the design of the study; in the collection, analyses, or interpretation of data; in the writing of the manuscript, or in the decision to publish the results.

Abbreviations

The following abbreviations are used in this manuscript:
AlAluminium
AnAnode
BAJBattery Association of Japan
BMSBattery management system
CCarbon
CaCathode
CuCopper
EDXEnergy dispersive X-ray spectroscopy
FFlurine
FeIron
IIISCIndentation-induced internal short circuit
IRTInfrared thermography
ISCInternal short circuit
LiCoO 2 Lithium cobalt oxide
MgMagnesium
NiNickel
NMCNickel manganese cobalt
PCMPhase change material
PPhosphorus
PHEVPlug-in hybrid electric vehicle
PTFEPolytetrafluoroethylene
SEMScanning electron microscopy
SiSilicon
SEISolid electrolyte interphase
SOCState of charge
SOHState of health
TPThermal propagation
TRThermal runaway
Sn/Bi/InTin/bismuth/indium
TiTitanium

References

  1. Zubi, G.; Dufo-López, R.; Carvalho, M.; Pasaoglu, G. The lithium-ion battery: State of the art and future perspectives. Renew. Sustain. Energy Rev. 2018, 89, 292–308. [Google Scholar] [CrossRef]
  2. Tidblad, A.A.; Edström, K.; Hernández, G.; de Meatza, I.; Landa-Medrano, I.; Jacas Biendicho, J.; Trilla, L.; Buysse, M.; Ierides, M.; Horno, B.P.; et al. Future Material Developments for Electric Vehicle Battery Cells Answering Growing Demands from an End-User Perspective. Energies 2021, 14, 4223. [Google Scholar] [CrossRef]
  3. Bryntesen, S.N.; Strømman, A.H.; Tolstorebrov, I.; Shearing, P.R.; Lamb, J.J.; Stokke Burheim, O. Opportunities for the State-of-the-Art Production of LIB Electrodes—A Review. Energies 2021, 14, 1406. [Google Scholar] [CrossRef]
  4. Bravo Diaz, L.; He, X.; Hu, Z.; Restuccia, F.; Marinescu, M.; Barreras, J.V.; Patel, Y.; Offer, G.; Rein, G. Review—Meta-Review of Fire Safety of Lithium-Ion Batteries: Industry Challenges and Research Contributions. J. Electrochem. Soc. 2020, 167, 090559. [Google Scholar] [CrossRef]
  5. Börger, A.; Mertens, J.; Wenzl, H. Thermal runaway and thermal runaway propagation in batteries: What do we talk about? J. Energy Storage 2019, 24, 100649. [Google Scholar] [CrossRef]
  6. Federal Aviation Administration. Events with Smoke, Fire, Extreme Heat or Explosion Involving Lithium Batteries. Available online: https://www.faa.gov/sites/faa.gov/files/2022-04/April%201%202022%20Li-Batt.%20Thermal%20Events.pdf (accessed on 7 January 2022).
  7. Electric Power Research Institute. BESS Failure Event Database: Stationary Energy Storage Failure Events. Available online: https://storagewiki.epri.com/index.php/BESS_Failure_Event_Database (accessed on 5 July 2022).
  8. Baird, A.R.; Archibald, E.J.; Marr, K.C.; Ezekoye, O.A. Explosion hazards from lithium-ion battery vent gas. J. Power Sources 2020, 446, 227257. [Google Scholar] [CrossRef]
  9. Essl, C.; Golubkov, A.W.; Gasser, E.; Nachtnebel, M.; Zankel, A.; Ewert, E.; Fuchs, A. Comprehensive Hazard Analysis of Failing Automotive Lithium-Ion Batteries in Overtemperature Experiments. Batteries 2020, 6, 30. [Google Scholar] [CrossRef]
  10. Ouyang, D.; Liu, J.; Chen, M.; Weng, J.; Wang, J. Thermal Failure Propagation in Lithium-Ion Battery Modules with Various Shapes. Appl. Sci. 2018, 8, 1263. [Google Scholar] [CrossRef] [Green Version]
  11. Wang, Q.; Mao, B.; Stoliarov, S.I.; Sun, J. A review of lithium ion battery failure mechanisms and fire prevention strategies. Prog. Energy Combust. Sci. 2019, 73, 95–131. [Google Scholar] [CrossRef]
  12. Feng, X.; Ouyang, M.; Liu, X.; Lu, L.; Xia, Y.; He, X. Thermal runaway mechanism of lithium ion battery for electric vehicles: A review. Energy Storage Mater. 2018, 10, 246–267. [Google Scholar] [CrossRef]
  13. Chombo, P.V.; Laoonual, Y. A review of safety strategies of a Li-ion battery. J. Power Sources 2020, 478, 228649. [Google Scholar] [CrossRef]
  14. Klink, J.; Hebenbrock, A.; Grabow, J.; Orazov, N.; Nylén, U.; Benger, R.; Beck, H.P. Comparison of Model-Based and Sensor-Based Detection of Thermal Runaway in Li-Ion Battery Modules for Automotive Application. Batteries 2022, 8, 34. [Google Scholar] [CrossRef]
  15. Hu, X.; Zhang, K.; Liu, K.; Lin, X.; Dey, S.; Onori, S. Advanced Fault Diagnosis for Lithium-Ion Battery Systems: A Review of Fault Mechanisms, Fault Features, and Diagnosis Procedures. IEEE Ind. Electron. Mag. 2020, 14, 65–91. [Google Scholar] [CrossRef]
  16. Chen, Y.; Kang, Y.; Zhao, Y.; Wang, L.; Liu, J.; Li, Y.; Liang, Z.; He, X.; Li, X.; Tavajohi, N.; et al. A review of lithium-ion battery safety concerns: The issues, strategies, and testing standards. J. Energy Chem. 2021, 59, 83–99. [Google Scholar] [CrossRef]
  17. Thakur, A.K.; Prabakaran, R.; Elkadeem, M.R.; Sharshir, S.W.; Arıcı, M.; Wang, C.; Zhao, W.; Hwang, J.Y.; Saidur, R. A state of art review and future viewpoint on advance cooling techniques for Lithium–ion battery system of electric vehicles. J. Energy Storage 2020, 32, 101771. [Google Scholar] [CrossRef]
  18. Challa, V. How to Prevent Li-Ion Battery Failures. Baltimore (USA). 2018. Available online: https://slideplayer.com/slide/17213977/ (accessed on 1 December 2022).
  19. Zhang, G.; Wei, X.; Tang, X.; Zhu, J.; Chen, S.; Dai, H. Internal short circuit mechanisms, experimental approaches and detection methods of lithium-ion batteries for electric vehicles: A review. Renew. Sustain. Energy Rev. 2021, 141, 110790. [Google Scholar] [CrossRef]
  20. Wu, C.; Zhu, C.; Ge, Y.; Zhao, Y. A Review on Fault Mechanism and Diagnosis Approach for Li-Ion Batteries. J. Nanomater. 2015, 2015, 1–9. [Google Scholar] [CrossRef] [Green Version]
  21. Kong, X.; Lu, L.; Yuan, Y.; Sun, Y.; Feng, X.; Yang, H.; Zhang, F.; Zhang, J.; Liu, X.; Han, X.; et al. Foreign matter defect battery and sudden spontaneous combustion. eTransportation 2022, 12, 100170. [Google Scholar] [CrossRef]
  22. Liu, L.; Feng, X.; Zhang, M.; Lu, L.; Han, X.; He, X.; Ouyang, M. Comparative study on substitute triggering approaches for internal short circuit in lithium-ion batteries. Appl. Energy 2020, 259, 114143. [Google Scholar] [CrossRef]
  23. Brodd, R.J. Batteries for Sustainability; Springer: New York, NY, USA, 2013. [Google Scholar] [CrossRef]
  24. Barnett, B. Lithium-Ion Cell Internal Shorting: 1. Early Detection 2. Simulation: CamXPower; Battery Safety Council Forum: Washington, DC, USA, 2017. [Google Scholar]
  25. Ceder, G. Opportunities and challenges for material design in LIB. MRS Bull. 2010, 35, 693–701. [Google Scholar] [CrossRef]
  26. Zhu, R.; Feng, J.; Guo, Z. In Situ Observation of Dendrite Behavior of Electrode in Half and Full Cells. J. Electrochem. Soc. 2019, 166, A1107–A1113. [Google Scholar] [CrossRef]
  27. Cannarella, J.; Arnold, C.B. The Effects of Defects on Localized Plating in Lithium-Ion Batteries. J. Electrochem. Soc. 2015, 162, A1365–A1373. [Google Scholar] [CrossRef] [Green Version]
  28. David, L.; Ruther, R.E.; Mohanty, D.; Meyer, H.M.; Sheng, Y.; Kalnaus, S.; Daniel, C.; Wood, D.L. Identifying degradation mechanisms in lithium-ion batteries with coating defects at the cathode. Appl. Energy 2018, 231, 446–455. [Google Scholar] [CrossRef]
  29. Mohanty, D.; Hockaday, E.; Li, J.; Hensley, D.K.; Daniel, C.; Wood, D.L. Effect of electrode manufacturing defects on electrochemical performance of lithium-ion batteries: Cognizance of the battery failure sources. J. Power Sources 2016, 312, 70–79. [Google Scholar] [CrossRef] [Green Version]
  30. Randall, C. BMW Recalls Multiple PHEV Models. 2020. Available online: https://www.electrive.com/2020/10/13/bmw-recalls-multiple-phev-models/ (accessed on 1 December 2022).
  31. Kaliaperumal, M.; Dharanendrakumar, M.S.; Prasanna, S.; Abhishek, K.V.; Chidambaram, R.K.; Adams, S.; Zaghib, K.; Reddy, M.V. Cause and Mitigation of Lithium-Ion Battery Failure—A Review. Materials 2021, 14, 5676. [Google Scholar] [CrossRef]
  32. Zhang, M.; Liu, L.; Stefanopoulou, A.; Siegel, J.; Lu, L.; He, X.; Ouyang, M. Fusing Phenomenon of Lithium-Ion Battery Internal Short Circuit. J. Electrochem. Soc. 2017, 164, A2738–A2745. [Google Scholar] [CrossRef] [Green Version]
  33. Zhang, Z.J.; Ramadass, P.; Fang, W. Safety of Lithium-Ion Batteries. In Lithium-Ion Batteries; Elsevier: Amsterdam, The Netherlands, 2014; pp. 409–435. [Google Scholar] [CrossRef]
  34. Santhanagopalan, S.; Ramadass, P.; Zhang, J. Analysis of internal short-circuit in a lithium ion cell. J. Power Sources 2009, 194, 550–557. [Google Scholar] [CrossRef]
  35. Lai, X.; Jin, C.; Yi, W.; Han, X.; Feng, X.; Zheng, Y.; Ouyang, M. Mechanism, modeling, detection, and prevention of the internal short circuit in lithium-ion batteries: Recent advances and perspectives. Energy Storage Mater. 2021, 35, 470–499. [Google Scholar] [CrossRef]
  36. Kurfer, J.; Westermeier, M.; Tammer, C.; Reinhart, G. Production of large-area lithium-ion cells—Preconditioning, cell stacking and quality assurance. CIRP Ann. 2012, 61, 1–4. [Google Scholar] [CrossRef]
  37. Asianometry. How China’s CATL Makes an EV Battery. Available online: https://www.imdb.com/title/tt16996328/ (accessed on 17 December 2021).
  38. Qian, G.; Monaco, F.; Meng, D.; Lee, S.J.; Zan, G.; Li, J.; Karpov, D.; Gul, S.; Vine, D.; Stripe, B.; et al. The role of structural defects in commercial lithium-ion batteries. Cell Rep. Phys. Sci. 2021, 2, 100554. [Google Scholar] [CrossRef]
  39. Liu, Y.; Zhang, R.; Wang, J.; Wang, Y. Current and future lithium-ion battery manufacturing. iScience 2021, 24, 102332. [Google Scholar] [CrossRef] [PubMed]
  40. Lain, M.J.; Brandon, J.; Kendrick, E. Design Strategies for High Power vs. High Energy Lithium Ion Cells. Batteries 2019, 5, 64. [Google Scholar] [CrossRef] [Green Version]
  41. Etiemble, A.; Besnard, N.; Adrien, J.; Tran-Van, P.; Gautier, L.; Lestriez, B.; Maire, E. Quality control tool of electrode coating for lithium-ion batteries based on X-ray radiography. J. Power Sources 2015, 298, 285–291. [Google Scholar] [CrossRef]
  42. Wu, Y.; Saxena, S.; Xing, Y.; Wang, Y.; Li, C.; Yung, W.; Pecht, M. Analysis of Manufacturing-Induced Defects and Structural Deformations in Lithium-Ion Batteries Using Computed Tomography. Energies 2018, 11, 925. [Google Scholar] [CrossRef] [Green Version]
  43. Badmos, O.; Kopp, A.; Bernthaler, T.; Schneider, G. Image-based defect detection in lithium-ion battery electrode using convolutional neural networks. J. Intell. Manuf. 2020, 31, 885–897. [Google Scholar] [CrossRef]
  44. Robinson, J.B.; Owen, R.E.; Kok, M.D.R.; Maier, M.; Majasan, J.; Braglia, M.; Stocker, R.; Amietszajew, T.; Roberts, A.J.; Bhagat, R.; et al. Identifying Defects in Li-Ion Cells Using Ultrasound Acoustic Measurements. J. Electrochem. Soc. 2020, 167, 120530. [Google Scholar] [CrossRef]
  45. Sun, P.; Bisschop, R.; Niu, H.; Huang, X. A Review of Battery Fires in Electric Vehicles. Fire Technol. 2020, 56, 1361–1410. [Google Scholar] [CrossRef]
  46. Lai, X.; Yao, J.; Jin, C.; Feng, X.; Wang, H.; Xu, C.; Zheng, Y. A Review of Lithium-Ion Battery Failure Hazards: Test Standards, Accident Analysis, and Safety Suggestions. Batteries 2022, 8, 248. [Google Scholar] [CrossRef]
  47. Zhao, M. Statistics and Analysis on Fire Accidents for EVs. China, EVS 16th Session, 11 September 2018. Available online: https://www.google.com/url?sa=t&rct=j&q=&esrc=s&source=web&cd=&ved=2ahUKEwiPlNnCt4_8AhUfklYBHQT6AO8QFnoECA4QAQ&url=https%3A%2F%2Fwiki.unece.org%2Fdownload%2Fattachments%2F60358932%2FEVS16-H14%2520%255BCN%255DACT02%2520%2526%252005%2520Statistics%2520and%2520Analysis%2520on%2520fire%2520accidents%2520for%2520EVs%2520-China-0829.pdf%3Fapi%3Dv2&usg=AOvVaw2oI7oOgFzJJ2uwQYjE-S3g (accessed on 26 August 2022).
  48. Wikipedia, Plug-In Electric Vehicle Fire Incidents. 2022. Available online: https://en.wikipedia.org/wiki/Plug-in_electric_vehicle_fire_incidents#cite_note-BYDe6Fire-2 (accessed on 14 July 2022).
  49. Feng, X.; Ren, D.; He, X.; Ouyang, M. Mitigating Thermal Runaway of Lithium-Ion Batteries. Joule 2020, 4, 743–770. [Google Scholar] [CrossRef]
  50. Li, Y.; Wei, C.; Sheng, Y.; Jiao, F.; Wu, K. Swelling Force in Lithium-Ion Power Batteries. Ind. Eng. Chem. Res. 2020, 59, 12313–12318. [Google Scholar] [CrossRef]
  51. Cannarella, J.; Arnold, C.B. State of health and charge measurements in lithium-ion batteries using mechanical stress. J. Power Sources 2014, 269, 7–14. [Google Scholar] [CrossRef]
  52. Popp, H.; Koller, M.; Jahn, M.; Bergmann, A. Mechanical methods for state determination of Lithium-Ion secondary batteries: A review. J. Energy Storage 2020, 32, 101859. [Google Scholar] [CrossRef]
  53. Li, R.; Ren, D.; Guo, D.; Xu, C.; Fan, X.; Hou, Z.; Lu, L.; Feng, X.; Han, X.; Ouyang, M. Volume Deformation of Large-Format Lithium Ion Batteries under Different Degradation Paths. J. Electrochem. Soc. 2019, 166, A4106–A4114. [Google Scholar] [CrossRef]
  54. Willenberg, L.K.; Dechent, P.; Fuchs, G.; Sauer, D.U.; Figgemeier, E. High-Precision Monitoring of Volume Change of Commercial Lithium-Ion Batteries by Using Strain Gauges. Sustainability 2020, 12, 557. [Google Scholar] [CrossRef] [Green Version]
  55. Oh, K.Y.; Siegel, J.B.; Secondo, L.; Kim, S.U.; Samad, N.A.; Qin, J.; Anderson, D.; Garikipati, K.; Knobloch, A.; Epureanu, B.I.; et al. Rate dependence of swelling in lithium-ion cells. J. Power Sources 2014, 267, 197–202. [Google Scholar] [CrossRef]
  56. Cannarella, J.; Arnold, C.B. Stress evolution and capacity fade in constrained lithium-ion pouch cells. J. Power Sources 2014, 245, 745–751. [Google Scholar] [CrossRef]
  57. Bitzer, B.; Gruhle, A. A new method for detecting lithium plating by measuring the cell thickness. J. Power Sources 2014, 262, 297–302. [Google Scholar] [CrossRef]
  58. Yuan, Z.; Xue, N.; Xie, J.; Xu, R.; Lei, C. Separator Aging and Performance Degradation Caused by Battery Expansion: Cyclic Compression Test Simulation of Polypropylene Separator. J. Electrochem. Soc. 2021, 168, 030506. [Google Scholar] [CrossRef]
  59. Zhang, X.; Zhu, J.; Sahraei, E. Degradation of battery separators under charge–discharge cycles. RSC Adv. 2017, 7, 56099–56107. [Google Scholar] [CrossRef] [Green Version]
  60. Sprenger, M.; Dölle, N.; Schauwecker, F.; Raffler, M.; Ellersdorfer, C.; Sinz, W. Multiscale Analysis and Safety Assessment of Fresh and Electrical Aged Lithium-Ion Pouch Cells Focusing on Mechanical Behavior. Energies 2022, 15, 847. [Google Scholar] [CrossRef]
  61. Mao, B.; Huang, P.; Chen, H.; Wang, Q.; Sun, J. Self-heating reaction and thermal runaway criticality of the lithium ion battery. Int. J. Heat Mass Transf. 2020, 149, 119178. [Google Scholar] [CrossRef]
  62. Mao, B.; Chen, H.; Cui, Z.; Wu, T.; Wang, Q. Failure mechanism of the lithium ion battery during nail penetration. Int. J. Heat Mass Transf. 2018, 122, 1103–1115. [Google Scholar] [CrossRef]
  63. Wang, J.; Mei, W.; Cui, Z.; Shen, W.; Duan, Q.; Jin, Y.; Nie, J.; Tian, Y.; Wang, Q.; Sun, J. Experimental and numerical study on penetration-induced internal short-circuit of lithium-ion cell. Appl. Therm. Eng. 2020, 171, 115082. [Google Scholar] [CrossRef]
  64. Ramadass, P.; Fang, W.; Zhang, Z. Study of internal short in a Li-ion cell I. Test method development using infra-red imaging technique. J. Power Sources 2014, 248, 769–776. [Google Scholar] [CrossRef]
  65. Duan, J.; Tang, X.; Dai, H.; Yang, Y.; Wu, W.; Wei, X.; Huang, Y. Building Safe Lithium-Ion Batteries for Electric Vehicles: A Review. Electrochem. Energy Rev. 2020, 3, 1–42. [Google Scholar] [CrossRef] [Green Version]
  66. Pfrang, A. JRC Exploratory Research: Safer Li-Ion Batteries by Preventing Thermal Propagation; EU Publications: Petten, The Netherlands, 2018; (accessed on 1 December 2022). [Google Scholar] [CrossRef]
  67. Liu, B.; Jia, Y.; Yuan, C.; Wang, L.; Gao, X.; Yin, S.; Xu, J. Safety issues and mechanisms of lithium-ion battery cell upon mechanical abusive loading: A review. Energy Storage Mater. 2020, 24, 85–112. [Google Scholar] [CrossRef]
  68. Park, N. Cell/Module/System Test. 3.06.2015. Available online: https://slideplayer.com/slide/5853673/ (accessed on 1 December 2022).
  69. Kiyotaka, M.; Takahashi, M. A Study on Alternative Test Methods of Forced Internal Short Circuit Test for Lithium-Ion Batteries in Automobile Applications. Meet. Abstr. 2018, MA2018-02, 493. [Google Scholar] [CrossRef]
  70. Keyser, M.; Darcy, E.; Shoesmith, M.; McCarthy, B. NREL/NASA Internal Short-Circuit Instigator in Lithium Ion Cells. In Proceedings of the Battery Safety Conference, San Diego, CA, USA, 14 November 2013; Available online: https://www.nrel.gov/docs/fy15osti/60745.pdf (accessed on 1 December 2022).
  71. Keyser, M.; Darcy, E.; Shoesmith, M.; McCarthy, B. NREL/NASA Internal Short-Circuit Instigator in Lithium Ion Cells; Phoenix, Arizona, USA, Okt. 2015, 228th ECS Conference. Available online: https://www.nrel.gov/docs/fy17osti/66958.pdf (accessed on 1 December 2022).
  72. Keyser, M.; Darcy, E. Internal Short-Circuit Instigator in Lithium Ion Cells. Petten, Netherlands, 8 März 2019. Available online: https://rechargebatteries.org/wp-content/uploads/2020/01/2-Initiation-presentation-MDBTC_matthew_keyser-nrel-nasa_internal_short_circuit_instigator_in_lithium_ion_cells_03_2018.pdf (accessed on 1 December 2022).
  73. Finegan, D.P.; Darst, J.; Walker, W.; Li, Q.; Yang, C.; Jervis, R.; Heenan, T.M.; Hack, J.; Thomas, J.C.; Rack, A.; et al. Modelling and experiments to identify high-risk failure scenarios for testing the safety of lithium-ion cells. J. Power Sources 2019, 417, 29–41. [Google Scholar] [CrossRef]
  74. Finegan, D.P.; Darcy, E.; Keyser, M.; Tjaden, B.; Heenan, T.M.M.; Jervis, R.; Bailey, J.J.; Malik, R.; Vo, N.T.; Magdysyuk, O.V.; et al. Characterising thermal runaway within lithium-ion cells by inducing and monitoring internal short circuits. Energy Environ. Sci. 2017, 10, 1377–1388. [Google Scholar] [CrossRef] [Green Version]
  75. Orendorff, C.J.; Roth, E.P.; Nagasubramanian, G. Experimental triggers for internal short circuits in lithium-ion cells. J. Power Sources 2011, 196, 6554–6558. [Google Scholar] [CrossRef]
  76. Zhang, M.; Du, J.; Liu, L.; Stefanopoulou, A.; Siegel, J.; Lu, L.; He, X.; Xie, X.; Ouyang, M. Internal Short Circuit Trigger Method for Lithium-Ion Battery Based on Shape Memory Alloy. J. Electrochem. Soc. 2017, 164, A3038–A3044. [Google Scholar] [CrossRef] [Green Version]
  77. Döring, H.; Wörz, M. Initializing of Thermal Runaway for Lithium-Ion Cells, 8-9.03.2018. Available online: https://dokumen.tips/documents/initializing-of-thermal-runaway-for-lithium-ion-cells-initializing-of-thermal-runaway.html (accessed on 1 December 2022).
  78. Ruiz, V.; Pfrang, A.; Kriston, A.; Omar, N.; van den Bossche, P.; Boon-Brett, L. A review of international abuse testing standards and regulations for lithium ion batteries in electric and hybrid electric vehicles. Renew. Sustain. Energy Rev. 2018, 81, 1427–1452. [Google Scholar] [CrossRef]
  79. AA Portable Power Corp, IEC62133, 2nd ed.; Safety Test Standard of Li-Ion Cell and Battery; Available online: https://www.batteryspace.com/prod-specs/IEC62133/IEC62133%208.3.9.pdf (accessed on 16 September 2022).
  80. Liu, B.; Jia, Y.; Li, J.; Yin, S.; Yuan, C.; Hu, Z.; Wang, L.; Li, Y.; Xu, J. Safety issues caused by internal short circuits in lithium-ion batteries. J. Mater. Chem. A 2018, 6, 21475–21484. [Google Scholar] [CrossRef]
  81. Lamb, J.; Orendorff, C.J. Evaluation of mechanical abuse techniques in lithium ion batteries. J. Power Sources 2014, 247, 189–196. [Google Scholar] [CrossRef]
  82. Florence, L.B. Indentation Induced Internal Short Circuit (IIISC) Test. 2013. Available online: https://www.google.com/url?sa=t&rct=j&q=esrc=s&source=web&cd=1&ved=2ahUKEwi5hdWWu9jmAhXLblAKHTHWDiwQFjAAegQIAxAB&url=https%3A%2F%2Fwiki.unece.org%2Fdownload%2Fattachments%2F10420383%2FEVS-04-08e.pdf%3Fapi%3Dv2&usg=AOvVaw0aYqJ9BiOUoynFWgw5Zeez (accessed on 28 December 2019).
  83. Chapin, J.; Tabaddor, M.; Wang, C.; Wu, A.; Wu, D.; Wu, M.; Yen, J. Cell-level IIISC, Nail Penetration, Hot Pad and ARC Tests for LVP65: Projekt 13CA50802. 2014. Available online: https://www.ntsb.gov/investigations/AccidentReports/Documents/UL_ISC_Report.pdf (accessed on 16 September 2020).
  84. Hoffmann, D.; Petit, M.; Marlair, G.; Abada, S.; Wang, C.Y. Safety Tests for Li-Secondary Batteries. In Li-Battery Safety; Garche, J., Brandt, K., Eds.; Electrochemical Power Sources; Elsevier: San Diego, CA, USA, 2019; pp. 387–453. [Google Scholar] [CrossRef]
  85. Chen, M.; Ye, Q.; Shi, C.; Cheng, Q.; Qie, B.; Liao, X.; Zhai, H.; He, Y.; Yang, Y. New Insights into Nail Penetration of Li–Ion Batteries: Effects of Heterogeneous Contact Resistance. Batter. Supercaps 2019, 2, 874–881. [Google Scholar] [CrossRef]
  86. Huang, S.; Du, X.; Richter, M.; Ford, J.; Cavalheiro, G.M.; Du, Z.; White, R.T.; Zhang, G. Understanding Li-Ion Cell Internal Short Circuit and Thermal Runaway through Small, Slow and In Situ Sensing Nail Penetration. J. Electrochem. Soc. 2020, 167, 090526. [Google Scholar] [CrossRef]
  87. Ren, D.; Feng, X.; Lu, L.; Ouyang, M.; Zheng, S.; Li, J.; He, X. An electrochemical-thermal coupled overcharge-to-thermal-runaway model for lithium ion battery. J. Power Sources 2017, 364, 328–340. [Google Scholar] [CrossRef]
  88. Eddahech, A.; Briat, O.; Vinassa, J.M. Thermal characterization of a high-power lithium-ion battery: Potentiometric and calorimetric measurement of entropy changes. Energy 2013, 61, 432–439. [Google Scholar] [CrossRef]
  89. Holland, A.A. The Effect of Compression on Lithium-Ion Batteries. Ph.D. Thesis, Imperial College London, London, UK, 2019. [Google Scholar]
  90. Barai, A.; Tangirala, R.; Uddin, K.; Chevalier, J.; Guo, Y.; McGordon, A.; Jennings, P. The effect of external compressive loads on the cycle lifetime of lithium-ion pouch cells. J. Energy Storage 2017, 13, 211–219. [Google Scholar] [CrossRef] [Green Version]
  91. Waldmann, T.; Iturrondobeitia, A.; Kasper, M.; Ghanbari, N.; Aguesse, F.; Bekaert, E.; Daniel, L.; Genies, S.; Gordon, I.J.; Löble, M.W.; et al. Review—Post-Mortem Analysis of Aged Lithium-Ion Batteries: Disassembly Methodology and Physico-Chemical Analysis Techniques. J. Electrochem. Soc. 2016, 163, A2149–A2164. [Google Scholar] [CrossRef]
  92. Liu, G.; Ouyang, M.; Lu, L.; Li, J.; Han, X. Analysis of the heat generation of lithium-ion battery during charging and discharging considering different influencing factors. J. Therm. Anal. Calorim. 2014, 116, 1001–1010. [Google Scholar] [CrossRef]
  93. Zimmerman, A.H. Self-discharge losses in lithium-ion cells. IEEE Aerosp. Electron. Syst. Mag. 2004, 19, 19–24. [Google Scholar] [CrossRef]
  94. Zhu, J.; Wierzbicki, T.; Li, W. A review of safety-focused mechanical modeling of commercial lithium-ion batteries. J. Power Sources 2018, 378, 153–168. [Google Scholar] [CrossRef]
  95. Cai, T.; Stefanopoulou, A.G.; Siegel, J.B. Modeling Li-Ion Battery Temperature and Expansion Force during the Early Stages of Thermal Runaway Triggered by Internal Shorts. J. Electrochem. Soc. 2019, 166, A2431–A2443. [Google Scholar] [CrossRef]
  96. Bargel, H.J.; Schulze, G. Werkstoffkunde; Springer: Berlin/Heidelberg, Germany, 2018. [Google Scholar] [CrossRef]
  97. Wang, L.; Yin, S.; Xu, J. A detailed computational model for cylindrical lithium-ion batteries under mechanical loading: From cell deformation to short-circuit onset. J. Power Sources 2019, 413, 284–292. [Google Scholar] [CrossRef]
  98. Zhang, Q.; Sekol, R.C.; Zhang, C.; Li, Y.; Carlson, B.E. Joining Lithium-Ion Battery Tabs Using Solder-Reinforced Adhesive. J. Manuf. Sci. Eng. 2019, 141, 044502. [Google Scholar] [CrossRef]
  99. Cai, W.; Wang, H.; Maleki, H.; Howard, J.; Lara-Curzio, E. Experimental simulation of internal short circuit in Li-ion and Li-ion-polymer cells. J. Power Sources 2011, 196, 7779–7783. [Google Scholar] [CrossRef]
  100. Zhang, L.; Xu, M.; Zhao, P.; Wang, X. A Computational Study on the Critical Ignition Energy and Chemical Kinetic Feature for Li-Ion Battery Thermal Runaway: WCX World Congress Experience: SAE Technical Paper. SAE Tech. Paper 2018. [Google Scholar] [CrossRef]
  101. Volck, T.; Sinz, W.; Gstrein, G.; Breitfuss, C.; Heindl, S.; Steffan, H.; Freunberger, S.; Wilkening, M.; Uitz, M.; Fink, C.; et al. Method for Determination of the Internal Short Resistance and Heat Evolution at Different Mechanical Loads of a Lithium Ion Battery Cell Based on Dummy Pouch Cells. Batteries 2016, 2, 8. [Google Scholar] [CrossRef]
  102. Parhizi, M.; Ahmed, M.B.; Jain, A. Determination of the core temperature of a Li-ion cell during thermal runaway. J. Power Sources 2017, 370, 27–35. [Google Scholar] [CrossRef]
  103. Zappen, H.; Fuchs, G.; Gitis, A.; Sauer, D.U. In-Operando Impedance Spectroscopy and Ultrasonic Measurements during High-Temperature Abuse Experiments on Lithium-Ion Batteries. Batteries 2020, 6, 25. [Google Scholar] [CrossRef] [Green Version]
  104. Zhao, R.; Liu, J.; Gu, J. A comprehensive study on Li-ion battery nail penetrations and the possible solutions. Energy 2017, 123, 392–401. [Google Scholar] [CrossRef]
  105. Feng, X.; Zheng, S.; Ren, D.; He, X.; Wang, L.; Cui, H.; Liu, X.; Jin, C.; Zhang, F.; Xu, C.; et al. Investigating the thermal runaway mechanisms of lithium-ion batteries based on thermal analysis database. Appl. Energy 2019, 246, 53–64. [Google Scholar] [CrossRef]
  106. Doughty, D.H.; Pesaran, A.A. Vehicle Battery Safety Roadmap Guidance. 2012. Available online: https://www.nrel.gov/docs/fy13osti/54404.pdf (accessed on 1 December 2022).
Figure 1. Exemplary presentation of the relationship between the increasing effective particle force (ageing and cycling) and the reduced separator stability (ageing). As soon as the mechanical stability (failure force) of the separator reaches a level lower than the force impact on an impurity particle, a critical area is reached, which is marked as a critical zone.
Batteries 09 00009 g001
Figure 2. Sequence of continuing process steps for analysis of particle impurities (from left to right).
Batteries 09 00009 g002
Figure 3. Schematic setup of tensioned cell for configuration No. 2 and No. 3 (see Table 3) for voltage and temperature sensor placement.
Batteries 09 00009 g003
Figure 4. Position of the discovered particles in the pouch cell structure. Numbering in ascending order from position A to position E with ascending cell-layer depth.
Batteries 09 00009 g004
Figure 5. Sequential disassembly of cell layers for localisation of particle 2.1 of cell 2. (Left) view of aluminium collector of the 1st cell layer, (centre) view of particle under separator of the 6th cell layer, (right) view of particle 2.1 (position ).
Batteries 09 00009 g005
Figure 6. Characterisation of discovered particle 2.1 by (a) optical image, (b) optical image with size measurement, (c) SEM-image, (d) EDX-analysis.
Batteries 09 00009 g006
Figure 7. Sequential disassembly of cell layers for localisation of particles 5.1, 5.2 and 5.3 of cell 5. (Left) view of cathode active material of the 1st cell layer, (right) view of separator of 1st cell layer. (position ).
Batteries 09 00009 g007
Figure 8. Characterisation of discovered particle 5.1 by (a) optical image with size measurement, (b) optical measurement of generated pressure area in the separator, (c) SEM image, (d) EDX analysis.
Batteries 09 00009 g008
Figure 9. Characterisation of discovered particle 5.2 by (a) optical image with size measurement, (b) SEM-image, (c) EDX analysis.
Batteries 09 00009 g009
Figure 10. Characterisation of discovered particle 5.3 by (a) optical image with size measurement, (b) SEM image, (c) EDX analysis.
Batteries 09 00009 g010
Figure 11. External in-situ visibility of particles found in Figure 7a and Figure 5b dependent of depth in cell layers and particle size (Particle 5.1 > 5.2 > 5.3).
Batteries 09 00009 g011
Table 2. List of the investigated cells with corresponding particle impurities.
Cell No.1234 5 6
Particle No.1.12.13.14.14.24.34.45.15.25.36.1
Table 3. Tension configuration for evaluating the ISC risk of particle impurities.
No.Areal PressureIntended Purpose
10 MPaReference to prove constant voltage/no ISC
20.25 MPaTypical tension force applied to pouch cells
31 MPaReproduction of increased tension force due to higher SOC or increased swelling force (ageing)
Table 4. Individual cell voltages of investigated contaminated cells ( Cell 1 Cell 6 ) and the reference cell ( Cell ref ). Values taken before ( U init , config No . 1 ) and after ( U end , config No . 3 ) tension was applied to maximise the observation time for possible voltage changes. Calculation of Δ U by filter application and trend analysis for the diagnosis of smallest voltage changes.
Cell ref Cell 1 Cell 2 Cell 3 Cell ref Cell 4 Cell 5 Cell 6
U init , config No . 1 /V3.5943.6653.6633.6723.5943.6643.5913.591
U end , config No . 3 /V3.5943.6653.6633.6723.5953.6633.5913.591
Δ U filter /V−0.1450.032−0.0120.1670.29−0.7440.4140.253
Table 5. Nomenclature of identified particle positions with respect to cell layer involved and type of involved layer material.
Pos.Particle betweenPos.Particle between
PouchfoilIsolation2. Anode2. Separator
Isolation1. Al-collector6. Separator6. Cathode
1. Cathode1. Separator
Table 6. Overview of characteristic properties of all analysed impurity particles.
CellParticleImageIn-Situ
Visibility
Particle
Location
Size (w × l)Material
(Assumption)
Risk Level
11.1Batteries 09 00009 i001Medium0.5 × 0.85 mmPolymer (Separator)Low
22.1Batteries 09 00009 i002Medium1.0 × 1.7 mmAluminium-MagnesiumHigh
33.1Batteries 09 00009 i003Medium1.0 × 1.5 mmAluminiumMedium
44.1Batteries 09 00009 i004Medium0.3 × 0.35 mmGraphiteLow
4.2Batteries 09 00009 i005Low0.2 × 0.45mmNMCLow
4.3Batteries 09 00009 i006Medium0.5 × 1.3mmGraphiteLow
4.4Batteries 09 00009 i007Low0.5 × 0.95mmNMCLow
55.1Batteries 09 00009 i008Good1.6 × 3.5mmTeflonMedium
5.2Batteries 09 00009 i009Medium1.4 × 1.5mmIronHigh
5.3Batteries 09 00009 i010Low0.3 × 0.75mmGraphiteLow
66.1Batteries 09 00009 i011Good0.25 × 0.3mmSilicon (Flux)Low
Table 7. Evaluation of trigger methods for the replication of particle-induced internal short circuits with special respect to the characteristics of the created ISC and scientific quality of the method.
No.NameVariation in ISC TypesAdaptabilty of
ISC resistance
Locality of ISCAdaptability of
General Cell Parameter
(T, SOC, SOH, etc.)
ReproducibilityTransferability to
Other Cell Designs
Preparation Effort
PCM+++++o+o-
Low-melting-point alloy+o+ooo-
SMA+-+oo/+o-
Particle-BAJoo/+o+o/+o-
Inserting steel ball externally/blunt rod/IIISC test--o-o-+
Slots in separator and electrode material+++o++--
Penetration: Ceramic nail with Ni tip-/o--++/o+/o+
Slow penetration with small needle-/o-/oo++oo/+
Disclaimer/Publisher’s Note: The statements, opinions and data contained in all publications are solely those of the individual author(s) and contributor(s) and not of MDPI and/or the editor(s). MDPI and/or the editor(s) disclaim responsibility for any injury to people or property resulting from any ideas, methods, instructions or products referred to in the content.

