1. Introduction
In the last decades of the 20th century and the beginning of the 21st century, concerns about pollution, climate change, and the scarcity of fossil resources have boosted production through renewable energies, such as solar photovoltaic, solar thermal, geothermal, wind, biomass, etc. In the current context, the European Union (EU) is still far from producing the energy it needs to meet its demand, having reached an energy dependency rate of close to 60% in 2018. Due to the existence of a high fossil fuel-dependent model, the share of imported oil and gas of the total EU consumption increased by around 10% for each fuel in the last decade. Russia is the EU’s main supplier of crude oil and natural gas, so the countries are exposed to the power of a market that has an impact on energy costs and the stability of the energy supply, especially given the current political tension [
1]. As a result, energy prices are today linked to a great deal of uncertainty in the EU.
Moreover, energy demand in buildings exceeds one-third of the global final energy consumption and is responsible for around 40% of the total global CO
2 emissions [
2]. In addition, primary energy is generally not used by final consumers, so a large proportion of it is consumed in transformation processes to obtain the final energy.
Taking action through effective measures to solve these problems is, therefore, a priority. One example could be the use of indigenous and clean energy sources in energy production. In this sense, energy production through solar resources has been widely considered to be one of the most effective and efficient solutions to address the problems of fossil fuel depletion, greenhouse gas emissions, and the growing demand for energy consumption [
3]. Considering the recent discussions on climate change, the ecological aspect of buildings could also correlate with the economic aspect soon [
4].
However, currently, there is debate about CO
2 emissions during the production phase of PV panels. Yıldız et al. [
5] investigated the CO
2 emissions during the production, recycling, and electricity generation of PV panels, determining that the use of PV panels provided a savings of 1.72 tons of CO
2 emission compared to a thermal power plant for generating the same amount of energy for 17 years and exposing the fact that the energy payback time of the polycrystalline panel was 0.92 years.
Nuclear power is also as capable as renewable energy in terms of reducing CO
2 emissions [
6]. However, it faces significant environmental and safety concerns, such as the fear of the proliferation of weapons-grade nuclear materials, the consequences of accidents, and the problems associated with the long-term storage of radioactive waste. These concerns make future major nuclear power developments questionable [
7].
Worldwide, the installed capacity of photovoltaics (PV) has significantly increased in recent years. In 2018, around 500 GW of PV power was installed, which was a 90-fold increase compared to the 2006 data [
8]. Some studies suggest that by 2050, solar PV could become the second most used electricity source after wind power, meeting around 25% of the world’s total electricity needs [
9]. It is estimated that 40% of this energy will be produced from photovoltaic panels integrated into the building sector [
10].
The main driver for the current increase in installed PV power is the development of PV systems on residential buildings rather than investments for large-scale installations [
11]. In recent years, technological advances have brought down the costs of manufacturing and operating PV panels, achieving a 79% reduction between 2010 and 2019 [
12]. This rapid cost decrease corresponded to increased manufacturing efficiency, reduced silicon requirements, private and public R&D investments, economies of scale, learning, and market penetration by Chinese companies, among others.
However, there are still some barriers to the widespread use of renewable energies in general, which hinder their full integration into buildings. Some of these obstacles are the difficulty of managing them due to their randomness, the use of modern technologies in energy production, the risks associated with the investment, and their lower energy yield compared to fossil fuels. The first of these obstacles, resulting from unpredictable weather conditions, results in alternating periods of energy surplus or deficiency. Furthermore, the demand curve patterns of buildings are directly influenced by the difficulty of predicting the habits of consumers, resulting in a mismatch between solar production and consumption curves. To eliminate this mismatch, it is necessary to develop forms of energy storage to improve energy manageability and optimize the operation of photovoltaic systems. In addition, advances in control technologies give added value to energy storage, allowing users to have full control over the energy generated [
13,
14,
15].
Among the wide variety of energy storage technologies available, batteries have generated great interest in the building sector in recent years, presenting some advantages such as high efficiency, fast response, and the ability to achieve energy and geographic independence [
16,
17,
18]. Lithium-ion (Li-ion) battery costs have fallen since 2008 and are expected to fall further by 2030, benefiting from the development of powerful industries such as electromobility [
19]. Narrowing down the market in batteries for solar use, lead-acid technology is a mature and leading technology in the battery market mainly due to its low cost, around 200 €/kWh [
20]. In contrast, Li-ion technology has a high potential for photovoltaic applications due to its high efficiency and long lifetime, but its current cost is relatively high, being approximately 300 €/kWh [
21]. Apart from the total cost, Mbungu et al. [
22] concluded that other factors, such as operational and maintenance needs, round-trip energy efficiency, lifetime, size, power rating, storage capacity, and safety conditions, should be considered for optimal battery type selection. Thus, Klingler [
23] stated that Li-ion batteries are currently the dominant technology for improving self-consumption ratios and Freitas Gomes et al. [
19] positioned the Li-ion battery as the best technology used in the power industry, vehicle batteries, and other stationary applications. Mulleriyawage et al. [
24] delved into battery chemistry and positioned the LiFePO (lithium-iron-phosphate) battery as the best choice for in-building use due to its fast-charging capability, versatility, and constant discharge voltage that favours its durability. In this regard, Islam et al. [
25] conducted a comparative analysis of the performance of the batteries commonly used in solar photovoltaic applications and concluded that lithium-Ferro phosphate batteries are the most suitable ones for applications that require a stable voltage and deep discharge.
To the best of our knowledge, there are still important fields to be explored. Building-level High Voltage (HV) storage for PV systems is a specific issue for Li-ion technology, which aims to reduce losses when operating at higher voltages. These batteries operate in the range of 200–500 V, as opposed to traditional Low Voltage (LV) systems, which operate at voltages below 100 V, with 48 V being the usual value [
26].
To connect the batteries and the electrical panel where the loads are connected, an inverter is required to convert and control the flow of electricity, whose operating efficiency depends on the working voltage levels. Therefore, if the connection is made via an inverter with a voltage transformer, additional energy losses are introduced [
27]. On the other hand, the transformer can be omitted if the voltage levels of energy storage in the batteries and the voltage required in the switchboard to supply the building loads are close to each other [
28,
29]. In addition, HV systems operate with a lower current than Low Voltage (LV) systems, meaning lower energy losses in the wiring and a smaller conductor cross-section. Therefore, the use of HV batteries with a voltage level like the grid would have, theoretically, present a higher energy efficiency.
In the Direct Current (DC) to Alternating Current (AC) conversion process, no converter device achieves 100% efficiency, varying depending on the DC input power and voltage. In this context, Yoon [
30] stated that, to determine the real efficiency of the inverter, the produced solar power should be accounted for and not based on the efficiency provided by the manufacturer. Some authors analysed the power generation efficiency of inverters, determining their efficiency ranges to be from 95 to 98% [
31]. Along these lines, Kelly [
32] investigated the HV battery. In his study, he designed a photovoltaic system to directly charge a Nickel Metal-Hydride battery with DC without any energy conversion, concluding that the system charged the battery with an efficiency of up to 15%. Previously, he obtained the efficiency of the system using a DC-DC converter for battery charging, resulting in 13.5%. Munzke et al. [
33] also analysed the energy efficiency of 12 different Li-ion PV battery systems in terms of their storage capacity and charging and discharging power but did not consider the influence of the voltage level in their study. Thus, research on energy storage at different voltage levels is needed to optimise the integration of PV installations into buildings, being one of the most interesting topics in the current development of HV Li-ion batteries.
Considering the above, an experimental prototype was designed and installed, consisting of two photovoltaic installations for self-consumption with energy storage using batteries operating at different voltages. One of them operates at low voltage (Low Voltage Installation, LVI) and the other at high voltage (High Voltage Installation, HVI). In addition, a method was established to calculate the energy efficiency of these systems from a series of equations based on the prototype’s operation. Experimentation and a procedure for the comparison of these systems will make it possible to demonstrate which is more energy efficient and under which operating conditions.
2. Materials and Methods
2.1. Design of the Prototype
The School of Industrial Engineering in Badajoz, Spain, was chosen as the site for the prototype. This is a teaching centre belonging to the University of Extremadura, whose activity is teaching and research in the field of Industrial Engineering. The latitude, longitude, and altitude of the site are 38°53′, 6°58′ W, and 186 m, respectively.
The prototype consists of two photovoltaic systems with energy storage using batteries operating at different voltages. The design of these systems involves the arrangement of different components such as photovoltaic panels, inverters, charge controllers, storage systems, protections, and wiring for DC and AC, among others. In this case, the choice of components is influenced by both the energy storage voltage and the compatibility between inverter-battery connection equipment available on the market.
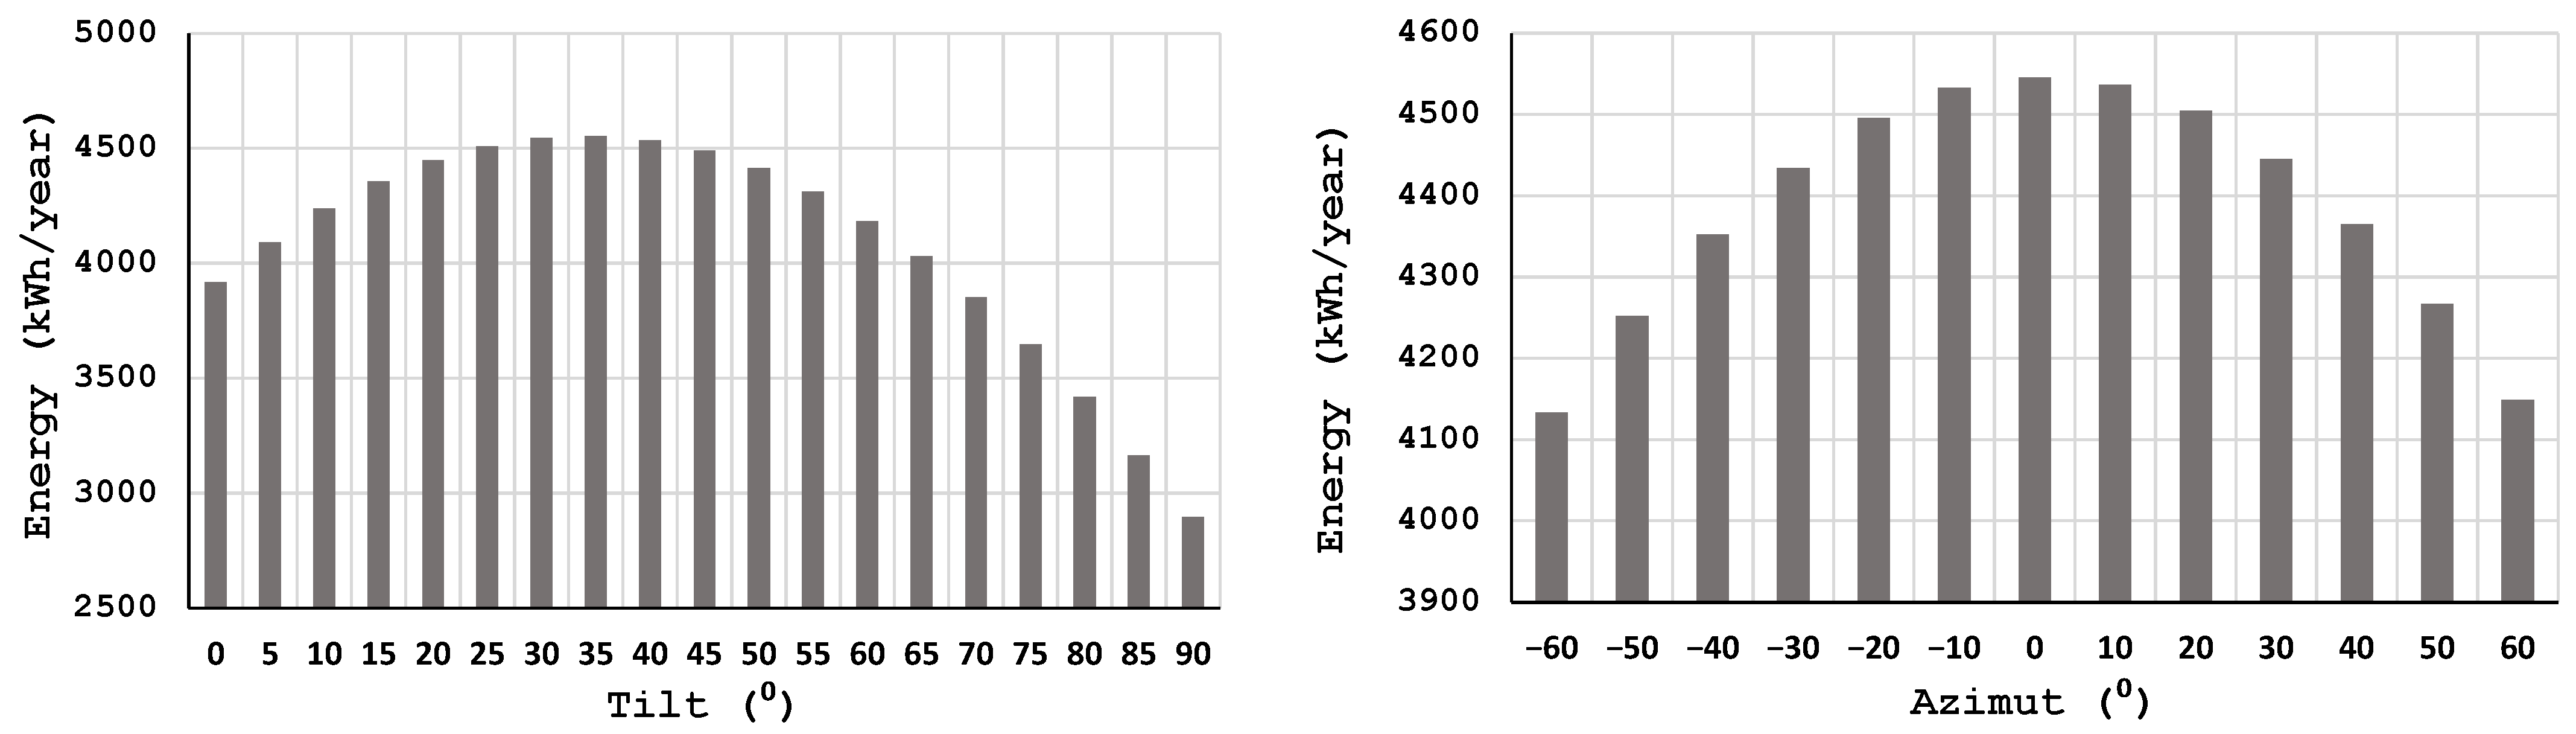
The design was carried out to maximize energy production throughout the year. Accordingly, several key parameters were defined, such as orientation, tilt, panel material, and peak power. Generally, the azimuth that maximises energy generation points south in the northern hemisphere, and the optimal tilt angle is between the latitude of the location (φ) and φ-15°, with energy losses below 5% in the range of ±15° [
34]. In this line, two energy simulation studies were carried out using the PVSyst software [
35], analysing how the annual energy production varies according to the tilt (setting the Azimuth to 0°) and orientation (setting the tilt to 30°). As shown in
Figure 1, the simulation provided the maximum values of electrical energy production for an inclination close to the latitude of the building (38°53′) and south orientation. Finally, the installation was carried out for an inclination of 30° corresponding to that of the precast concrete support. The panels were arranged horizontally to reduce the wind’s impact on a building of considerable height.
Crystalline silicon solar cell PV panel technology was selected, as these account for approximately 90% of the global market share in the PV industry [
36], and more specifically, monocrystalline solar cells, due to their higher conversion efficiency [
37]. On the other hand, a peak power of 2.7 kW was adopted based on the following literature. Roldán Fernández et al. [
38] evaluated the profitability of residential PV self-consumption in Spain and highlighted that a commercial PV self-consumption kit with peak power from 1.5 to 2 kW would generate an optimal turnover for an average household. Tongsopit et al. [
39] concluded that the installation of a 3 kWp PV system is profitable even if there is no compensation for excess generation in Thailand. All these decisions are reflected in
Table 1.
On the other hand, for the design of the inverter-battery set, a compatibility study was carried out among the main brands on the market. Firstly, two identical lithium-Ferro phosphate batteries were selected, except for the voltage level in the energy storage (the basic design parameter of the prototype). The decision to use a storage capacity of about 8 kWh was based on the following studies. According to the report “Consumption in the Residential Sector in Spain” [
40], a Spanish house consumes on average of 9.92 MWh. Weniger et al. [
41] normalised the battery size value to the annual energy consumption of the household and recommended a battery of about 0.7 kWh/MWh of annual electricity consumption. Similarly, Hoppmann et al. [
42] established optimal storage sizes for both a home that supplies surplus into the grid and one that does not, determining ranges of 3.5–6.5 kWh and 3–8 kWh, respectively.
Based on this choice, a search for PV inverter models that are compatible with the battery manufacturer was carried out. Each model of PV inverter supports a limited range of DC voltage and current from the solar array, so the electrical connection of the PV panels was carried out differently for each installation. In this way, by connecting the photovoltaic panels in series and parallel, the output voltage and current of the solar array were adjusted to the admissible input range of the inverter.
As for the injection of the energy generated, as there were no single-phase electrical panels to guarantee sufficient load consumption to take advantage of it, each installation was connected to one phase of the same three-phase electrical panel. Previously, the risk of phase decompensation was assessed. The influence was almost negligible due to the large difference in power between the building’s consumption and the photovoltaic injection. The generated energy is only used for self-consumption in the building, so two backflow preventers were installed, preventing the injection of the generated energy upstream of the switchboard and converting the installation into self-consumption mode without surplus.
Photovoltaic panels of each solar field were placed on the roof of the building, while the rest of the equipment was placed in a room in the basement (
Figure 2).
2.2. Prototype Description
The prototype consists of two photovoltaic solar fields. Each has an output of 2.7 kWp, consisting of 6 equal fixed monocrystalline silicon panels with PERC (Passivated Emitter Rear Cell) coating. The manufacturer of the used model is Canadian Solar, CS3W-450MS. They were mounted horizontally on precast SOLARBLOC® concrete supports with a 30° inclination. The wiring is different for each solar field. For the LVI, 2 parallel rows of 3 modules were connected in series (2 × 3), whereas for the HVI, all modules were connected in series (1 × 6).
The energy flow produced by each solar PV field is managed through equipment installed between the PV panels and the loads that demand energy. These components are a charge controller, two inverters, and two batteries. For the LVI, an MPPT charge controller, SmartSolar 250/70 with VE.Can interface, and an inverter, MULTIPLUS-II 48/3000/35-32, manufactured by Victron Energy, were selected. For the storage of the generated energy, a Low Voltage Li-ion battery was installed, whose manufacturer and model are BYD and B-BOX PREMIUM LVS 8, respectively. A hybrid inverter was used for the HVI. In this case, unlike the LVI, the installation of a solar charger was not required, as this inverter converts the energy from direct to alternating current and acts as a battery charger. The model chosen was the Primo GEN24 3 Plus with 2 MPPT inputs from the manufacturer Fronius. Finally, a High Voltage Li-ion battery was selected, whose manufacturer and model are BYD and B-BOX PREMIUM HVS 7.7, respectively.
Table 2 shows the main technical data of the installed components and
Table 3 shows the joint compatibility between the components that make up the prototype after making their respective adjustments for voltage, current, and power.
2.3. Test Description
Operational tests were carried out to validate the prototype in September 2021. On the one hand, climatological data were extracted from a weather station belonging to the Spanish State Meteorological Agency (AEMET) to define the climatology of the prototype’s location. On the other hand, energy yields were calculated and compared based on the losses produced in the inverter-battery set, influenced by the different operating voltage of each installation, under different energy demand conditions, and with identical radiation levels. For the LVI, the charge regulator was included in this set.
To control the variables in the tests, the measurement and monitoring equipment of the installed devices were used. The data were recorded at 5-min intervals and subsequently stored in the online platforms associated with the inverters. Thus, by accessing Fronius Solar.web [
43]—the platform associated with the HVI—and VRM Portal Victron Energy [
44]—the platform associated with the LVI—the data necessary for the analysis of the systems were acquired. In parallel, a Power Analyzer (PCE Instruments, model PCE-PA 8000) and an AC/DC Digital Clamp Multimeter (Pro`sKit MT-3109) were used to validate the accuracy of the data obtained.
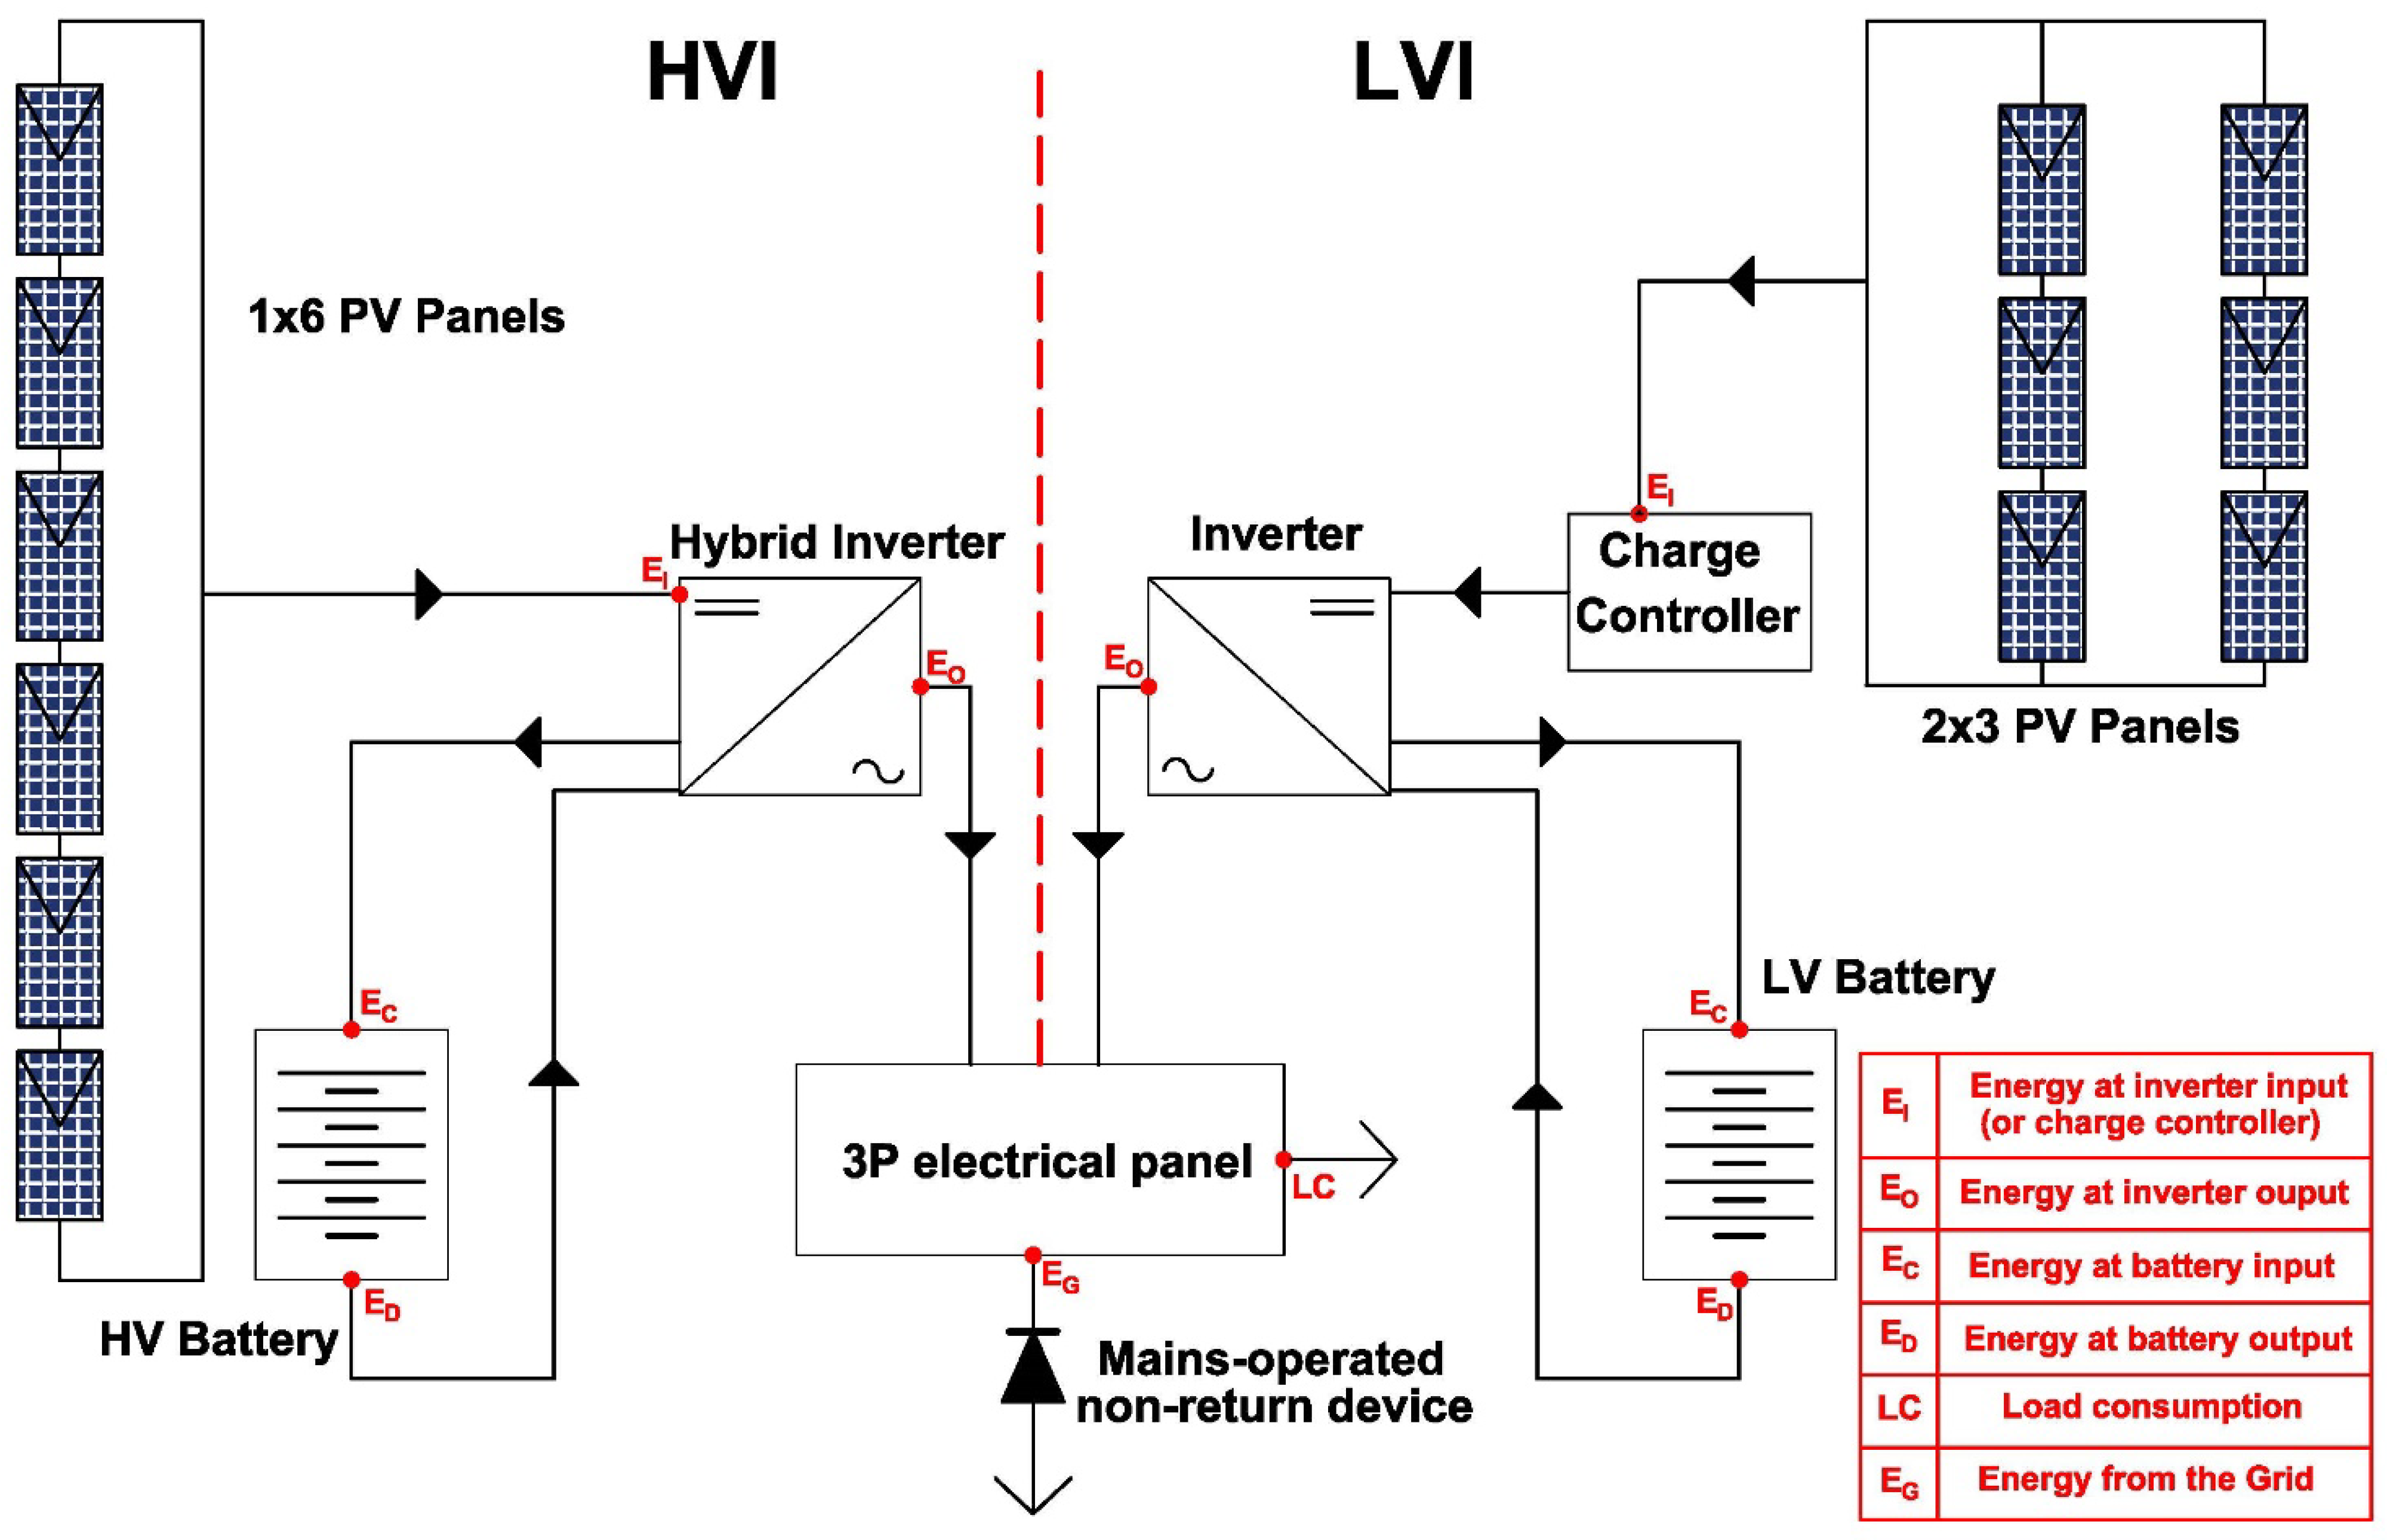
Figure 3 below shows the measurement points of the different variables analysed.
The units of the values exported from each platform were different. Thus, Fronius Solar.web provided energy data, in Wh, whereas VRM Portal Victron Energy provided power values, in W. Therefore, from the time interval between two consecutive measurements, the power measurements at each instant (Pj) were converted to energy (Ej).
The energy efficiency of the inverter-battery set (ɳj) was then calculated for each data record. Through this indicator, the ratio of DC energy before the inverter or regulator (EI) and AC energy after the inverter (EO) is defined, including the influence of the battery charge-discharge process (EC-ED). In this way, the variable load consumption (LCj), which is different because each installation was connected to a different phase of the electrical panel, with different receivers and consumption, was not considered.
The purpose of the operating strategy in the HVI and LVI systems, shown in
Figure 4, is to maximise self-consumption. Thus, the energy from the solar field is preferentially programmed to feed the demand. If the renewable production is higher than the demand, the surplus energy is stored in the batteries. If the battery has reached its maximum SOC (State of Charge), photovoltaic power generation is limited. On the other hand, if the demand is higher than PV generation, the storage system tries to make up the difference. When the demanded energy is greater than the sum of the energy coming from the solar field and the energy delivered by the battery, it is supplied from the Grid. The minimum and maximum battery SOC were set at 10% and 100%, respectively. Therefore, depending on the relationship between the variables in each data acquisition, the system operation changes according to the priority set [
45]. Zhang and Tang [
46] also established the same basic rules to achieve the profitability of a PV self-consumption system.
Thus, Equations (1)–(3) were used to calculate the efficiency, depending on whether the battery was in Charging, Discharging, or Standby Mode, respectively, where
j is each recorded data acquisition. The options for activation of the standby mode are that the battery reaches
SOCmin and the energy production is less than or equal to the line consumption, or that the battery reaches
SOCmax and the energy generation is equal to or greater than that required to satisfy the load.
Subsequently, the average daily efficiency (
) was determined using Equation (4), where
I is each day of the month,
j is each recorded data collection, and
n is the sum of the measurements for one day.
ɳj ≠ 0 values were considered, i.e., when the HVI and LVI were operational.
3. Results and Discussion
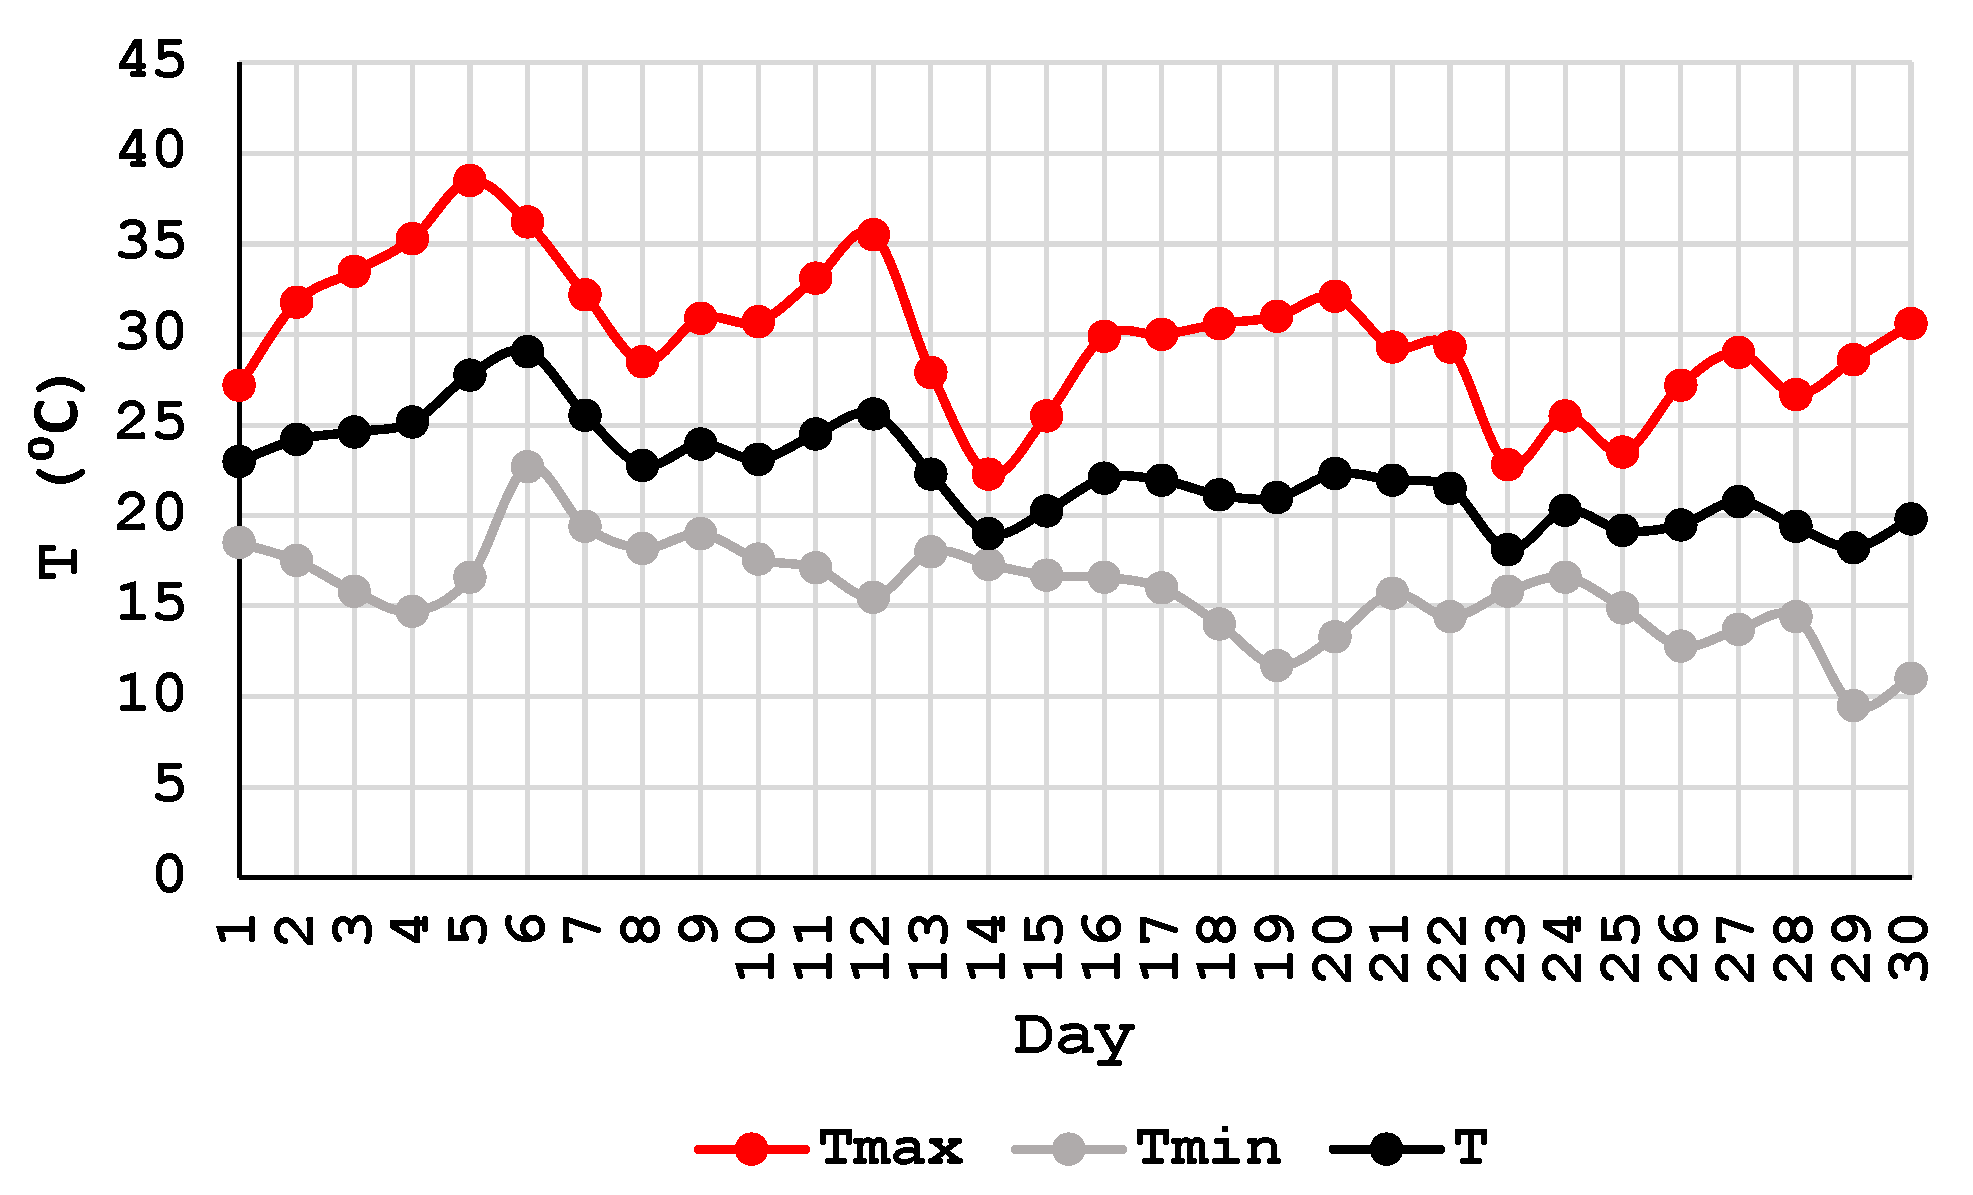
First, the most relevant climatological variables during the start-up month (September 2021), such as the daily maximum (
Tmax), average (
T) and minimum (
Tmin), ambient temperature, daily global radiation in the horizontal plane (
G), and daily average relative humidity (
HR), are presented in
Figure 5,
Figure 6 and
Figure 7.
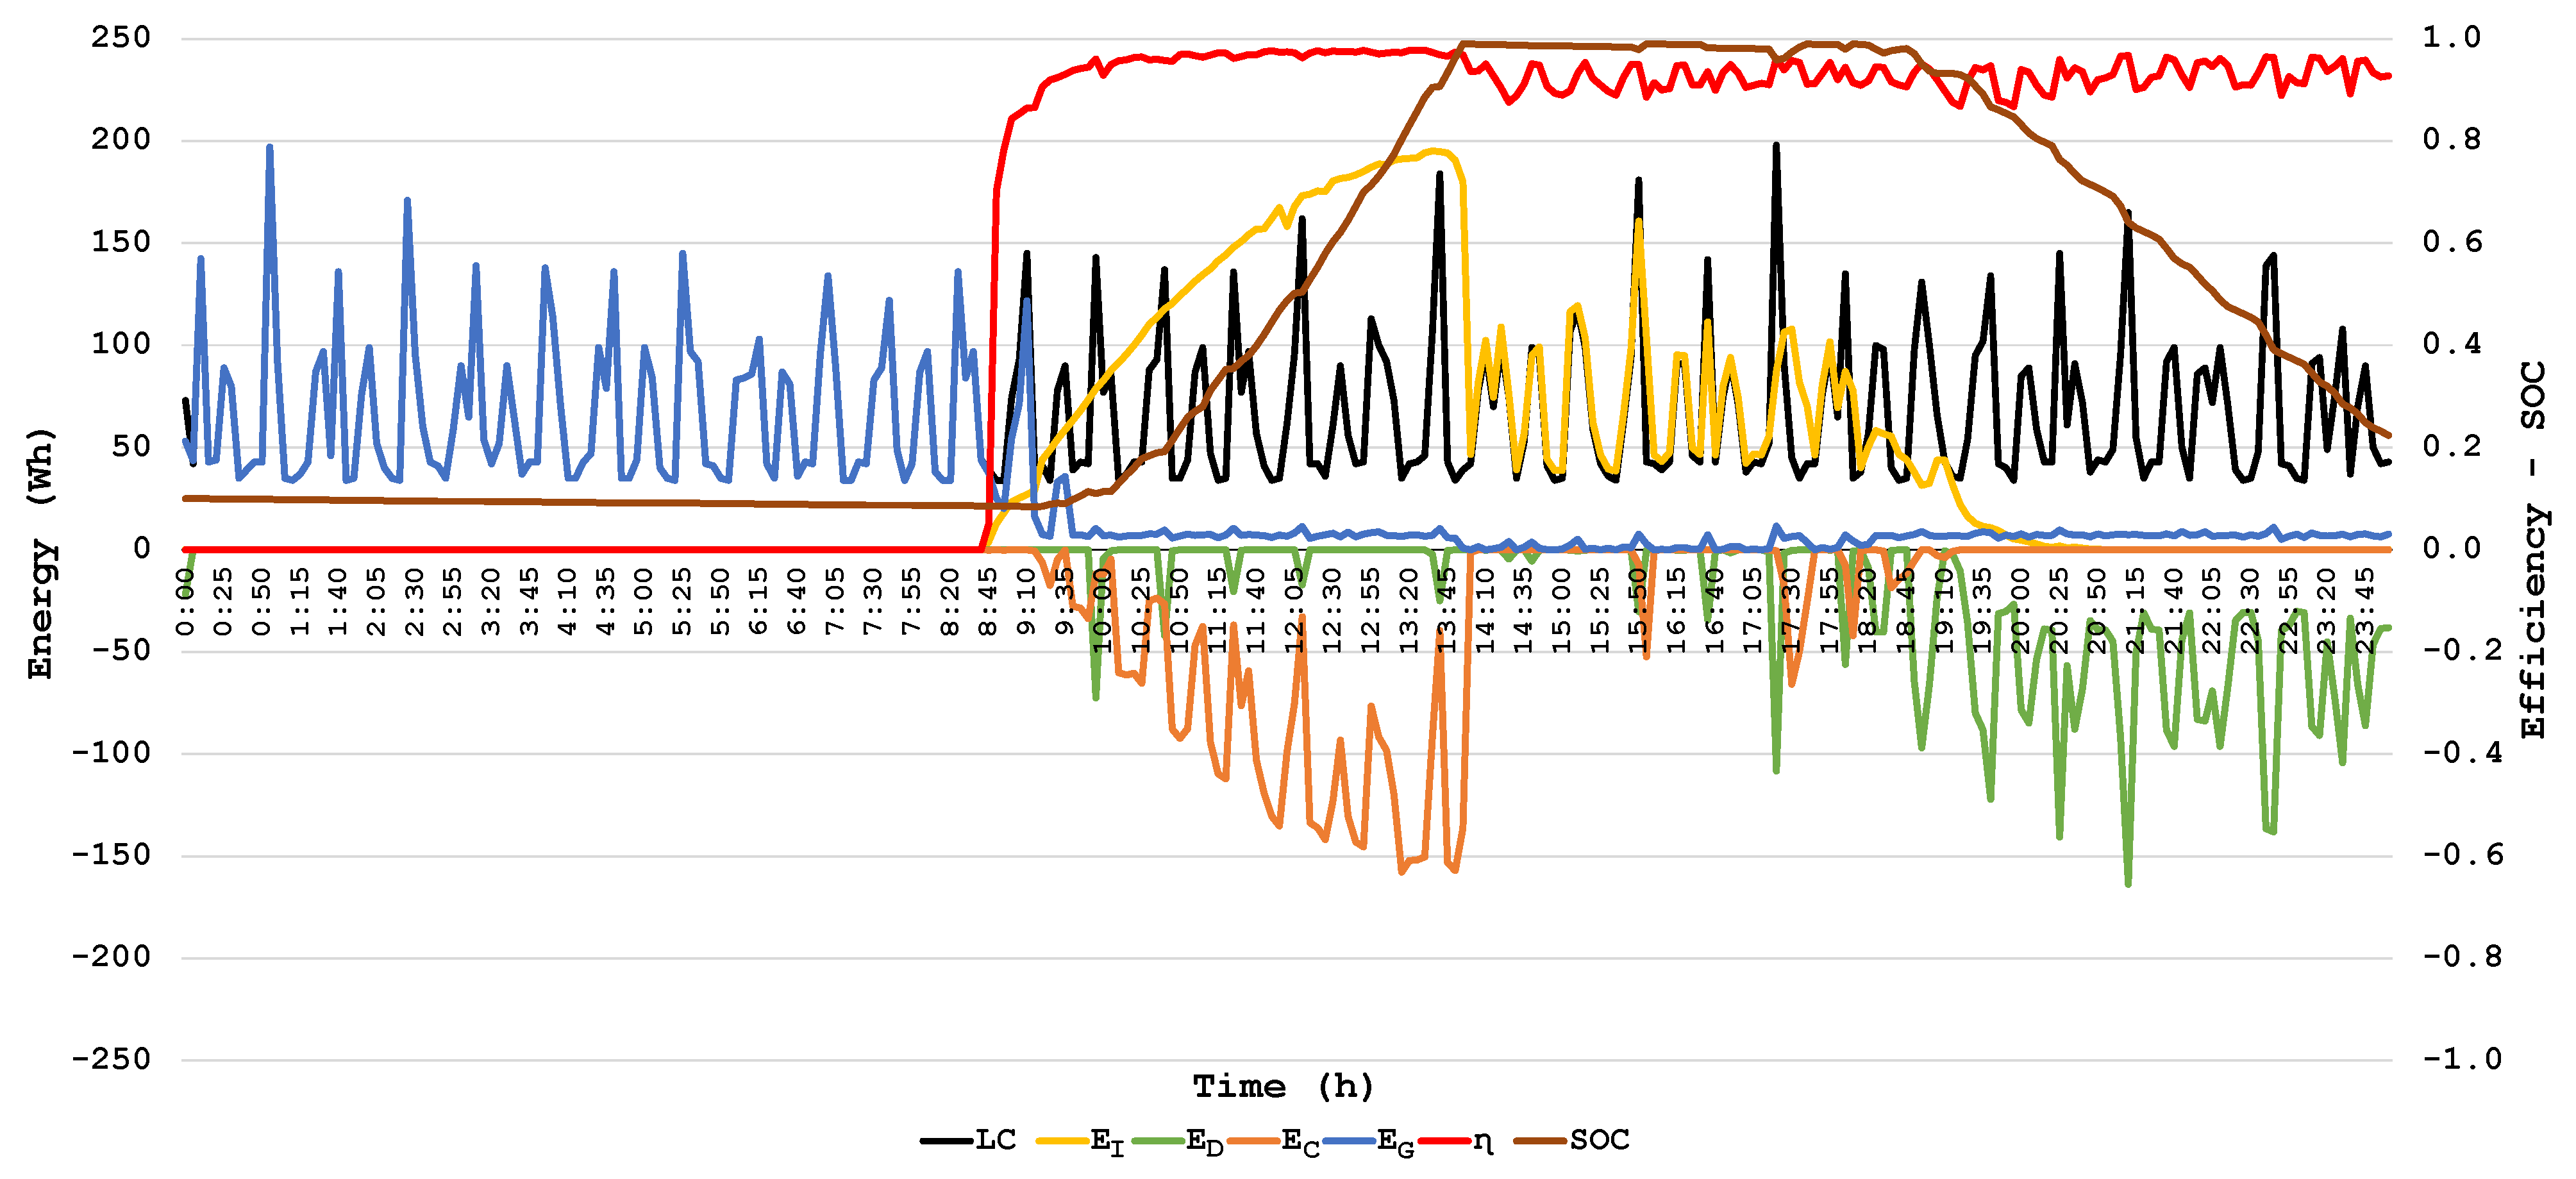
The performance of the HVI and LVI during the tests carried out on 26 September is shown below in
Figure 8 and
Figure 9, respectively.
The energy generated by each installation was different, as the HVI did not generate energy at full capacity from 14:00 to 19:00. The energy demanded from 0:00 to 8:30 was supplied by the grid, as the battery was completely discharged the previous day. At around 8:30, the photovoltaic panels began to generate energy. From 9:00 onwards, the energy input from the grid was very low thanks to the direct energy input from the solar field and the battery. It was observed that, from 9:00 to 14:00, the energy generated was higher than the energy consumed, and consequently, the battery was charged—represented in negative form. However, from 14:00 to 19:00, the energy produced was in line with the energy demanded because the battery was fully charged. From 19:00 onwards, PV power generation was low or negligible and the battery was discharged to meet the demand (represented in negative form). The limitation of the generated PV power had a minimal influence on the energy yield curve.
The LVI, on the other hand, produced energy at full capacity throughout the day because of the higher energy demand. Thus, at no time did the battery reach the SOCmax. As in the operation of the HVI, the energy demanded in the 0:00 to 9:00 h range was fully supplied by the grid. A time slot is identified in the central hours of the day, from 12:00 to 17:00, in which energy generation was higher than consumption. However, despite the energy surplus, the grid had to supply energy to meet the entire demand. This is because the maximum power that can be delivered by this inverter can be limited, and, for operational testing purposes, it was limited to 1.5 kW on this day. Therefore, surplus power was used to charge the battery and not to fully satisfy the demand. Two time slots are also observed, from 9:00 to 12:00 and from 17:00 to 19:00, when the production was lower than the demand and, therefore, energy was required from the grid and the battery. Thus, the energy supplied by the grid along with the energy provided by the installation, which could come directly from the solar field or after passing through the battery, was the energy necessary to satisfy the energy demanded by the line. From 19:00 onwards, photovoltaic energy generation was low or negligible, and, as in the HVI, the battery was discharged to meet the demand. At the start of the LVI’s operation each day, a peak was observed, followed by a sharp decline in the energy yield curve. This peak in performance may be due to inaccuracy and instability in the data records at the beginning of the operation of the installation. A higher variability is also observed in the LVI efficiency curve.
Figure 10 shows the average daily efficiency along with the daily energy generated by and demanded from each installation. The initial results obtained from the commissioning showed the importance of considering the voltage level parameter in a renewable energy production system for self-consumption, as the average daily energy yield in the HVI was higher than that in the LVI on almost all days of the month studied with identical radiation levels.
As in the study by Munzke et al. [
33], the high energy efficiency of the system was mainly achieved on days with high irradiation. On days with energy production above 10,000 Wh, the energy efficiency of the HVI was higher than the LVI, whereas when the generated PV energy was between 6000–10,000 Wh, the energy efficiencies of the HVI and the LVI were the same. Finally, on days with solar generation below 6000 Wh, the efficiency of the HVI reached very low levels, even lower than those of the LVI. The efficiency of the LVI was only drastically reduced on day 14 when the generation was poor. Thus, the efficiency of the inverter-battery array experienced a strong dependence on weather conditions, resulting in lower energy yields during days with lower solar energy production. As reported by Park et al. [
31], the efficiency changed as a function of the DC power output of the solar field.
Finally,
Figure 11 shows the statistical distribution of the data sets concerning average daily energy efficiency, representing the extreme values (maximum and minimum, upper (
Q3) and lower quartile (
Q1), median, average, and outliers)—data that are more than 1.5 times the interquartile range (IQR) and therefore represent observations with values that are very different from others in the same group.
Although days with low irradiation greatly affected the average energy efficiency value of the HVI (0.908), it was slightly higher than that of the LVI (0.899). On the other hand, half of the average daily energy efficiency values exceeded the figures of 0.931 and 0.905 for the HVI and the LVI, respectively. The extreme values of the HVI, both upper and lower, were approximately 3% higher than those of the LVI, and all the HVI outliers coincided with days of low irradiation. In contrast, irradiation did not excessively alter the energy efficiency values of the LVI.
Therefore, the days with low energy production, days 13, 14, and 23 of
Figure 5, caused reductions in the average energy yield of both installations, being drastic in the HVI. The constant changes in the operation of the installation—periods of production and periods without generation—caused by both cloudiness and the variability of the power demanded, could affect the accuracy of the measurements recorded by the systems’ monitoring equipment, or the energy efficiency of the HVI decreasing to a greater extent than in the LVI, for low values of solar-generated power. In this sense, Mughal et al. [
47] stated that accurate energy estimates are crucial for determining the technical and economic performance of PV systems.
As stated by Dufo-López et al. [
48], based on inverter efficiency, the importance of not considering a constant value of energy efficiency in the inverter-battery array of these systems was demonstrated, as it can induce substantial errors with generation and consumption profiles with large peaks and valleys. The efficiency of the set analysed, influenced by the performance curves of the inverters, varies according to the power output at each moment, which in turn depends on the solar power generated and the power demanded.
In future work, both systems will be operated to meet the same controllable load, eliminating the uncertainty of operating with uncontrolled and variable power demands. In addition, different types of tests will be programmed, varying the operating strategy of the systems. In this way, it will be possible to find out which of the two systems is more efficient and under which operating conditions, which will be key to optimising their integration into the building sector.


