
Combined Thermal Runaway Investigation of Coin Cells with an Accelerating Rate Calorimeter and a Tian-Calvet Calorimeter

 , and
, and 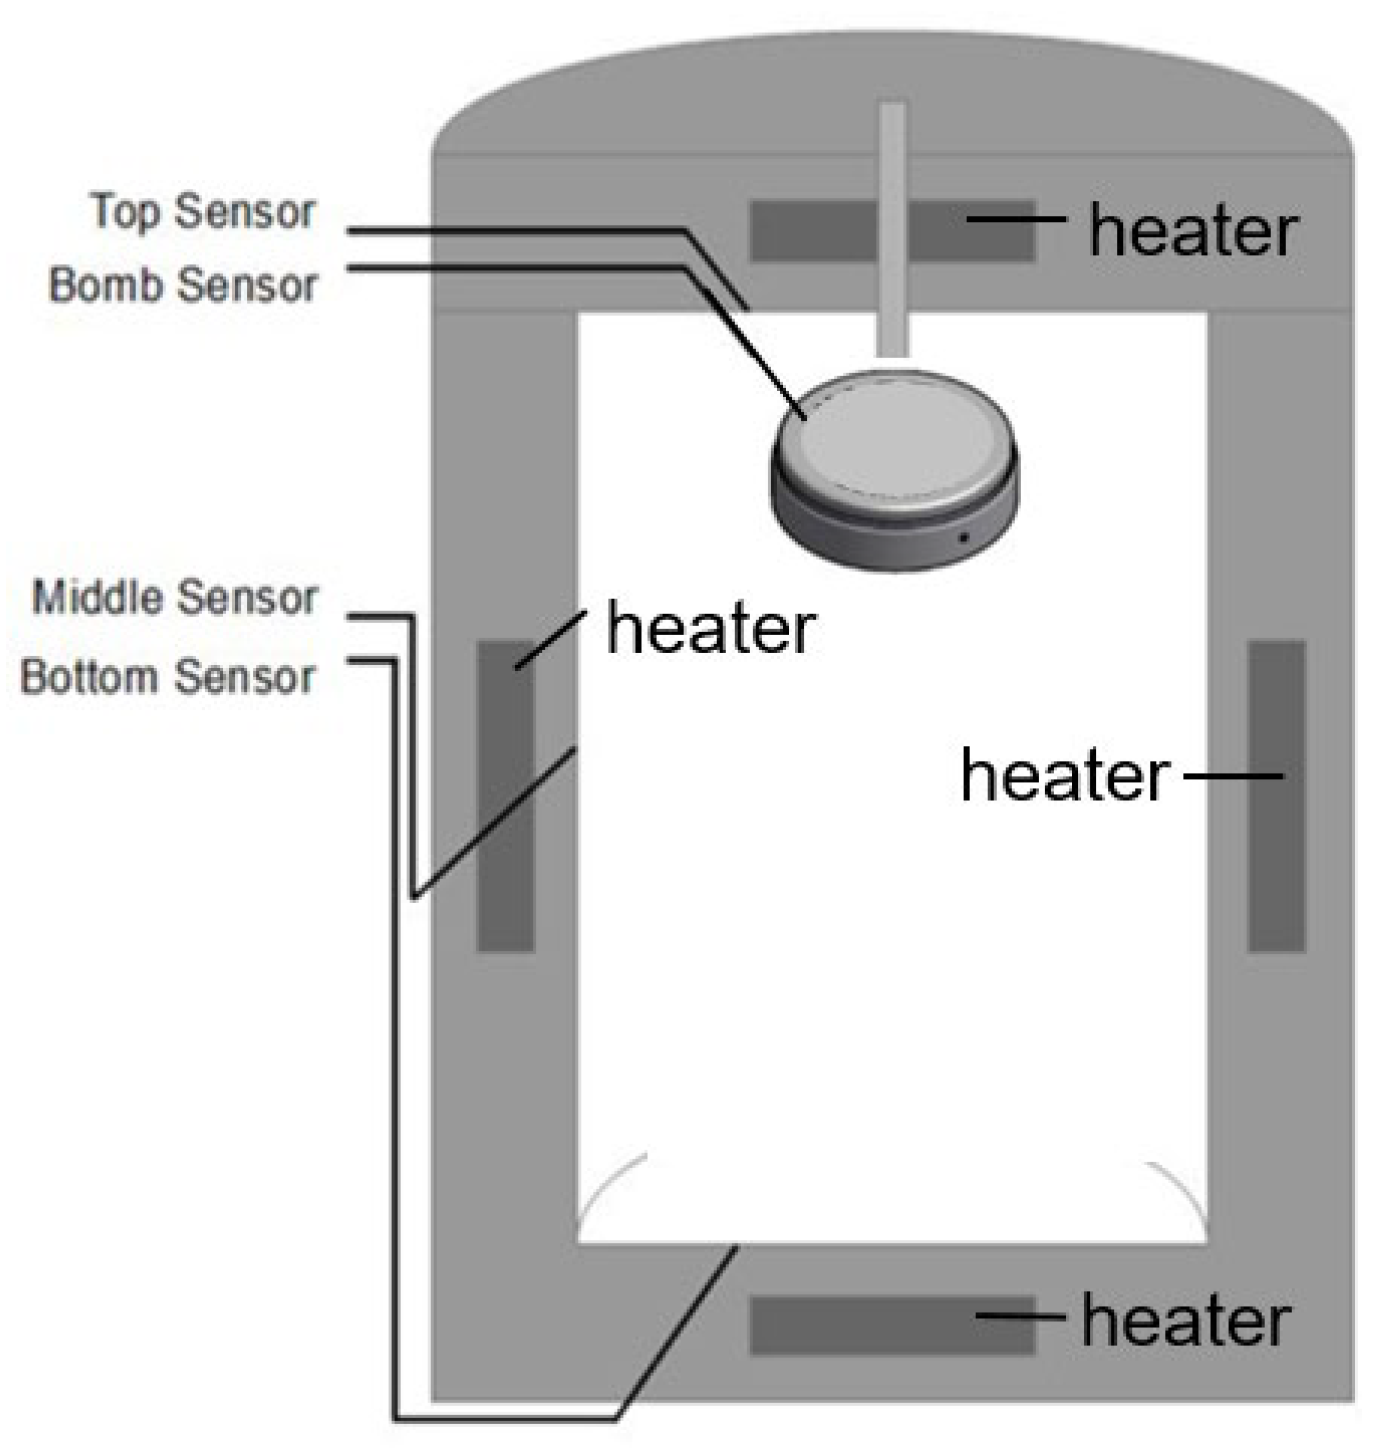
Abstract
:1. Introduction
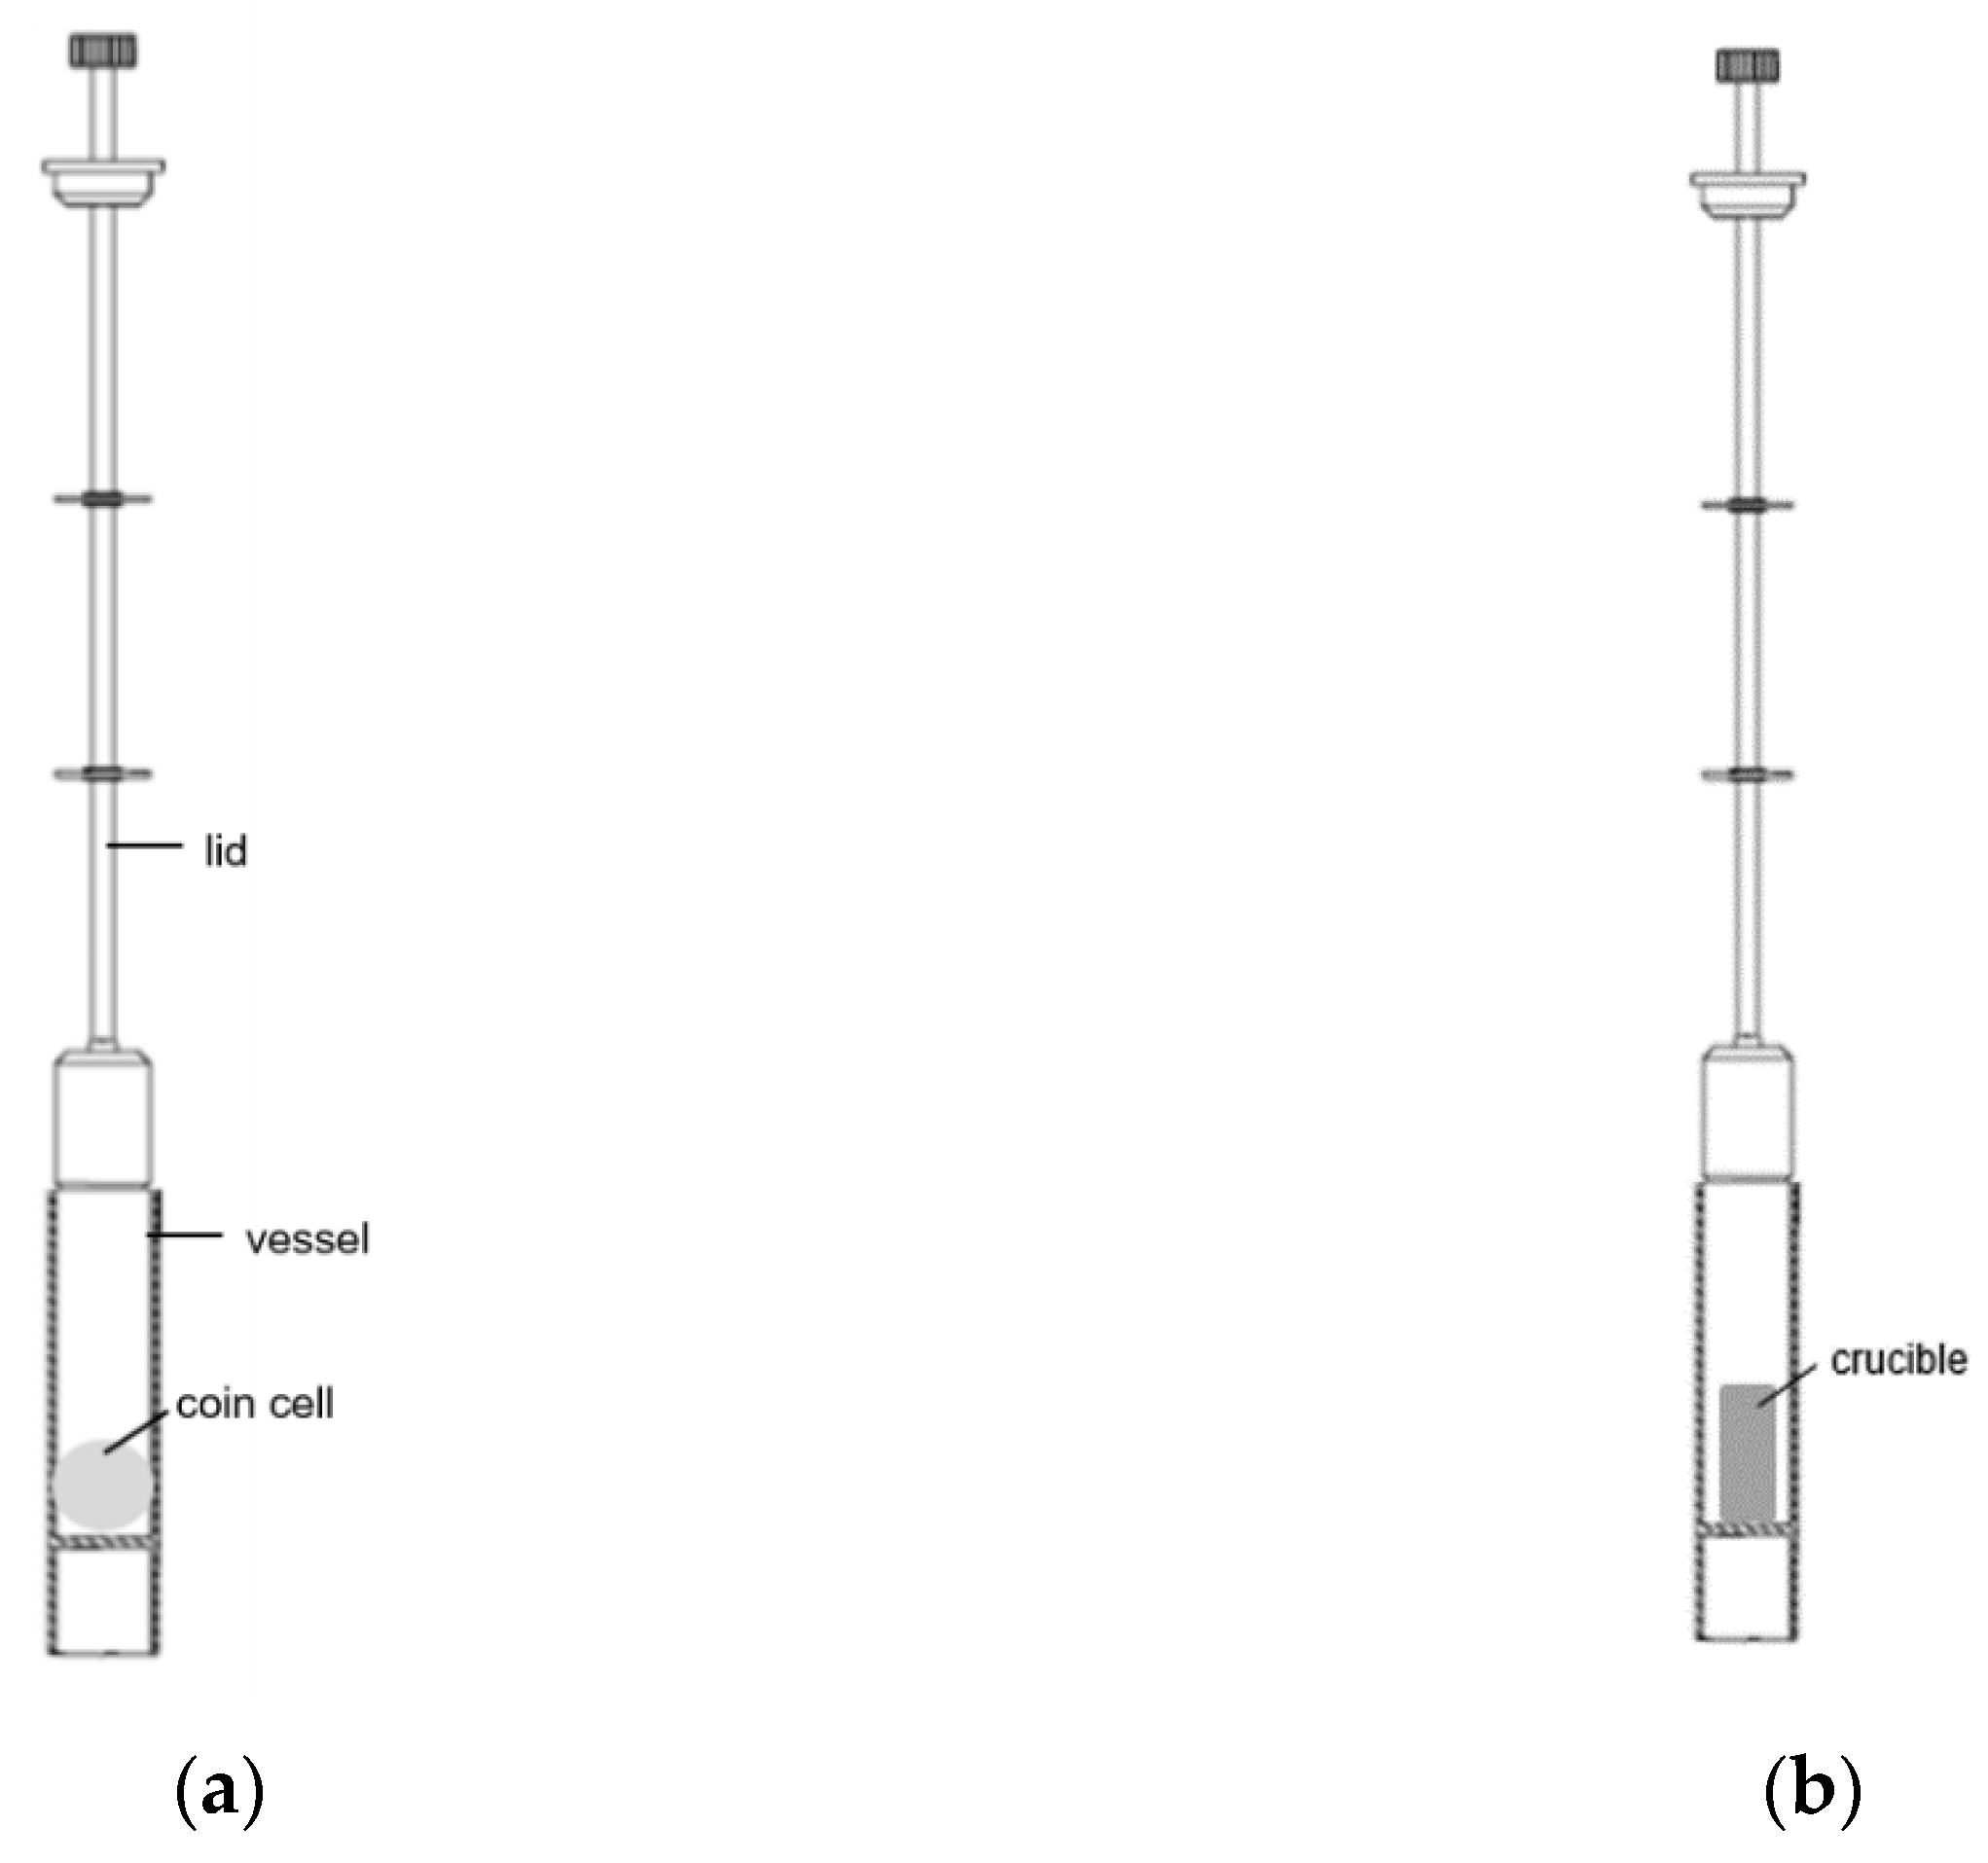
2. Experimental
3. Results and Discussion
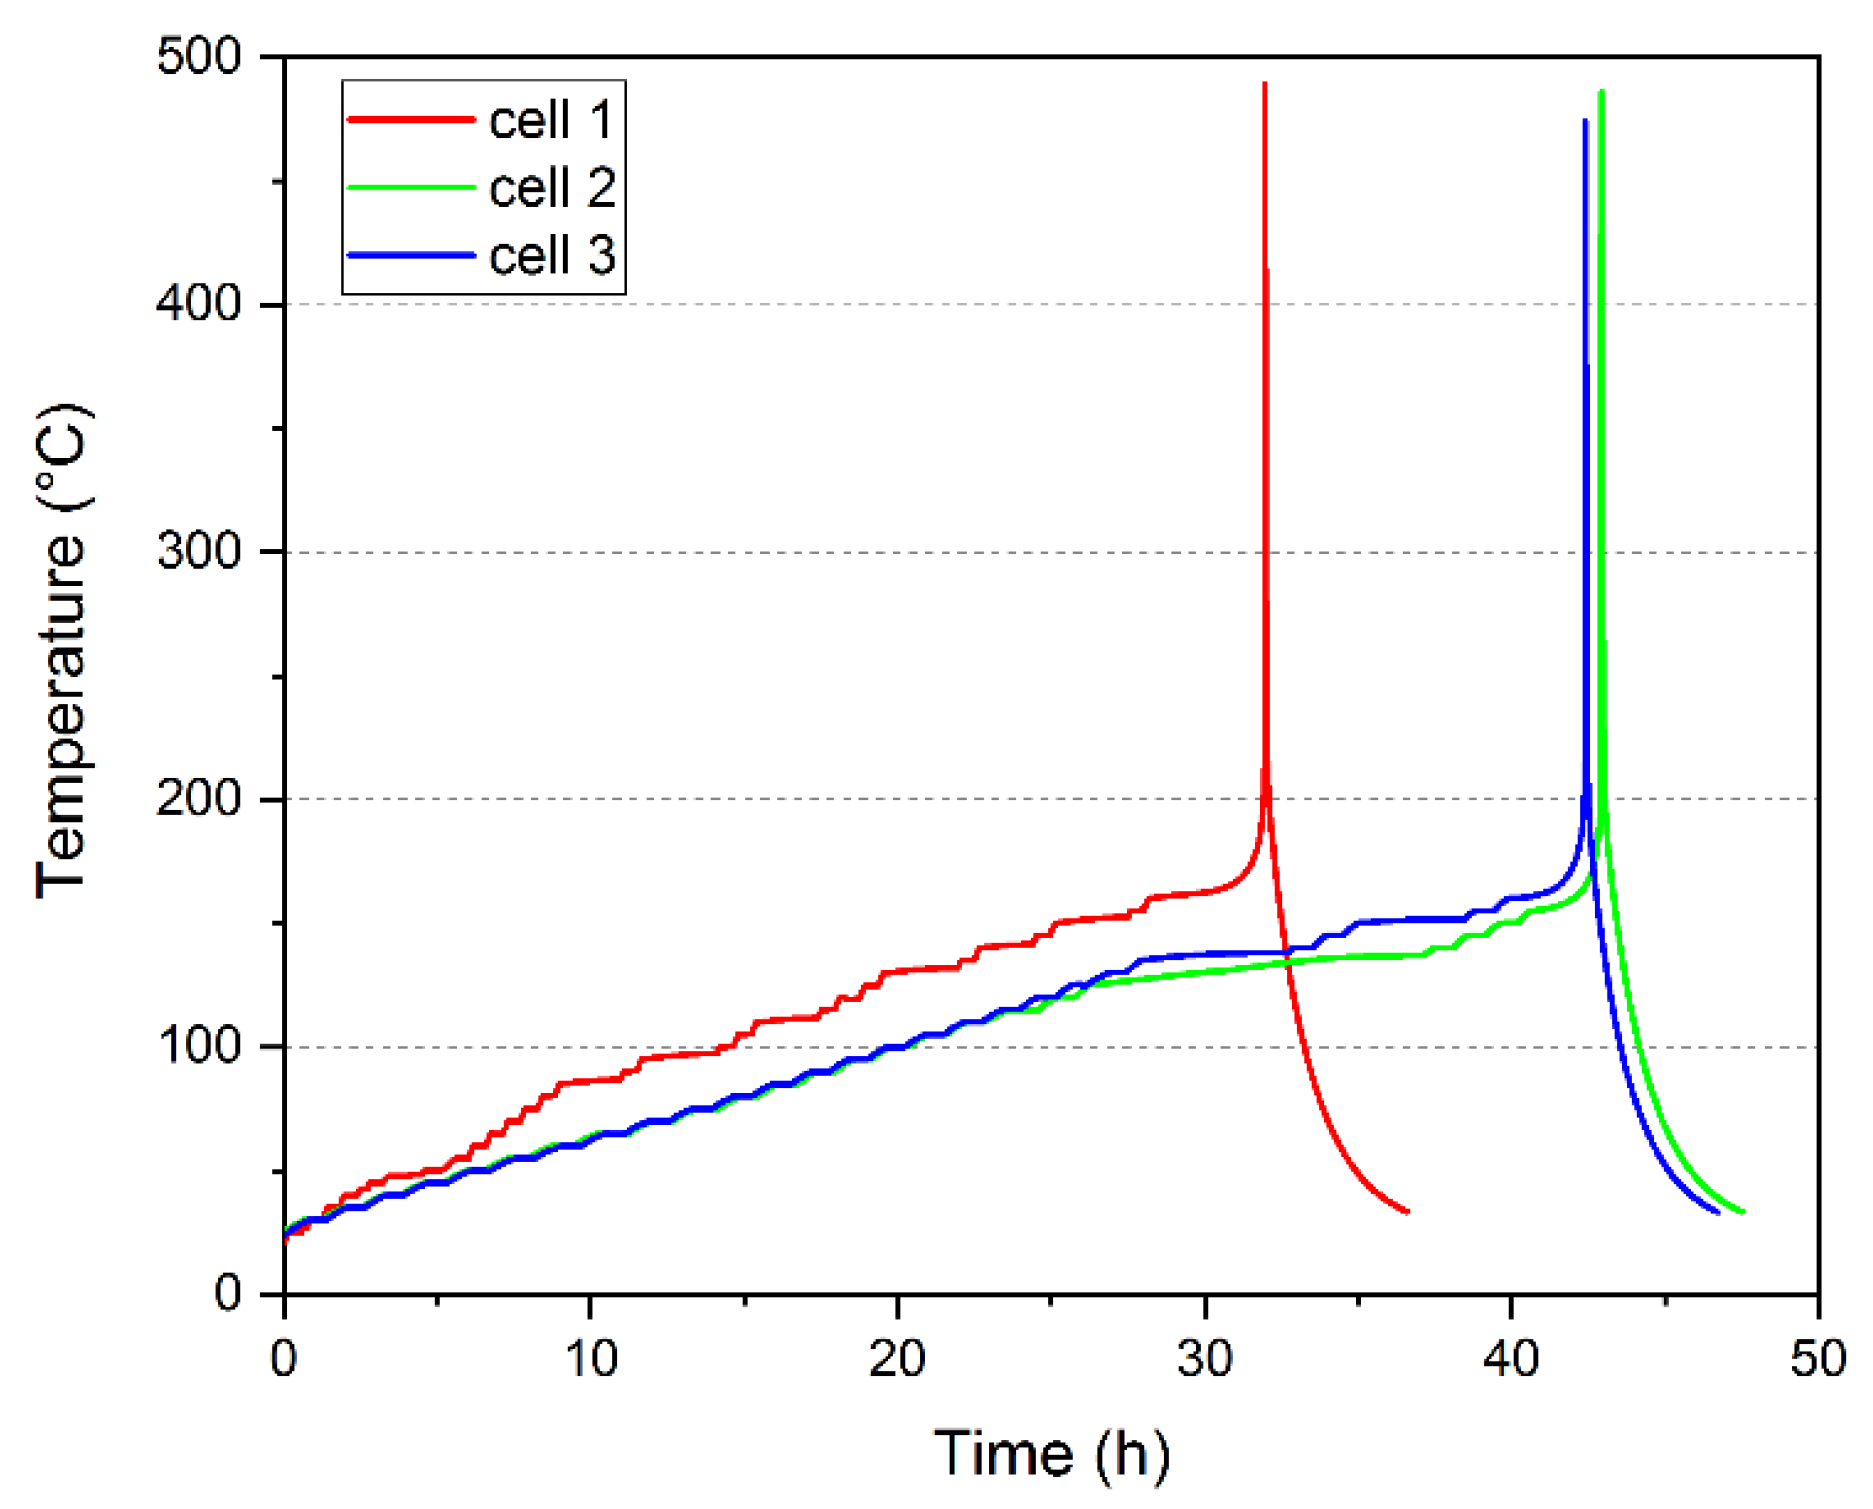
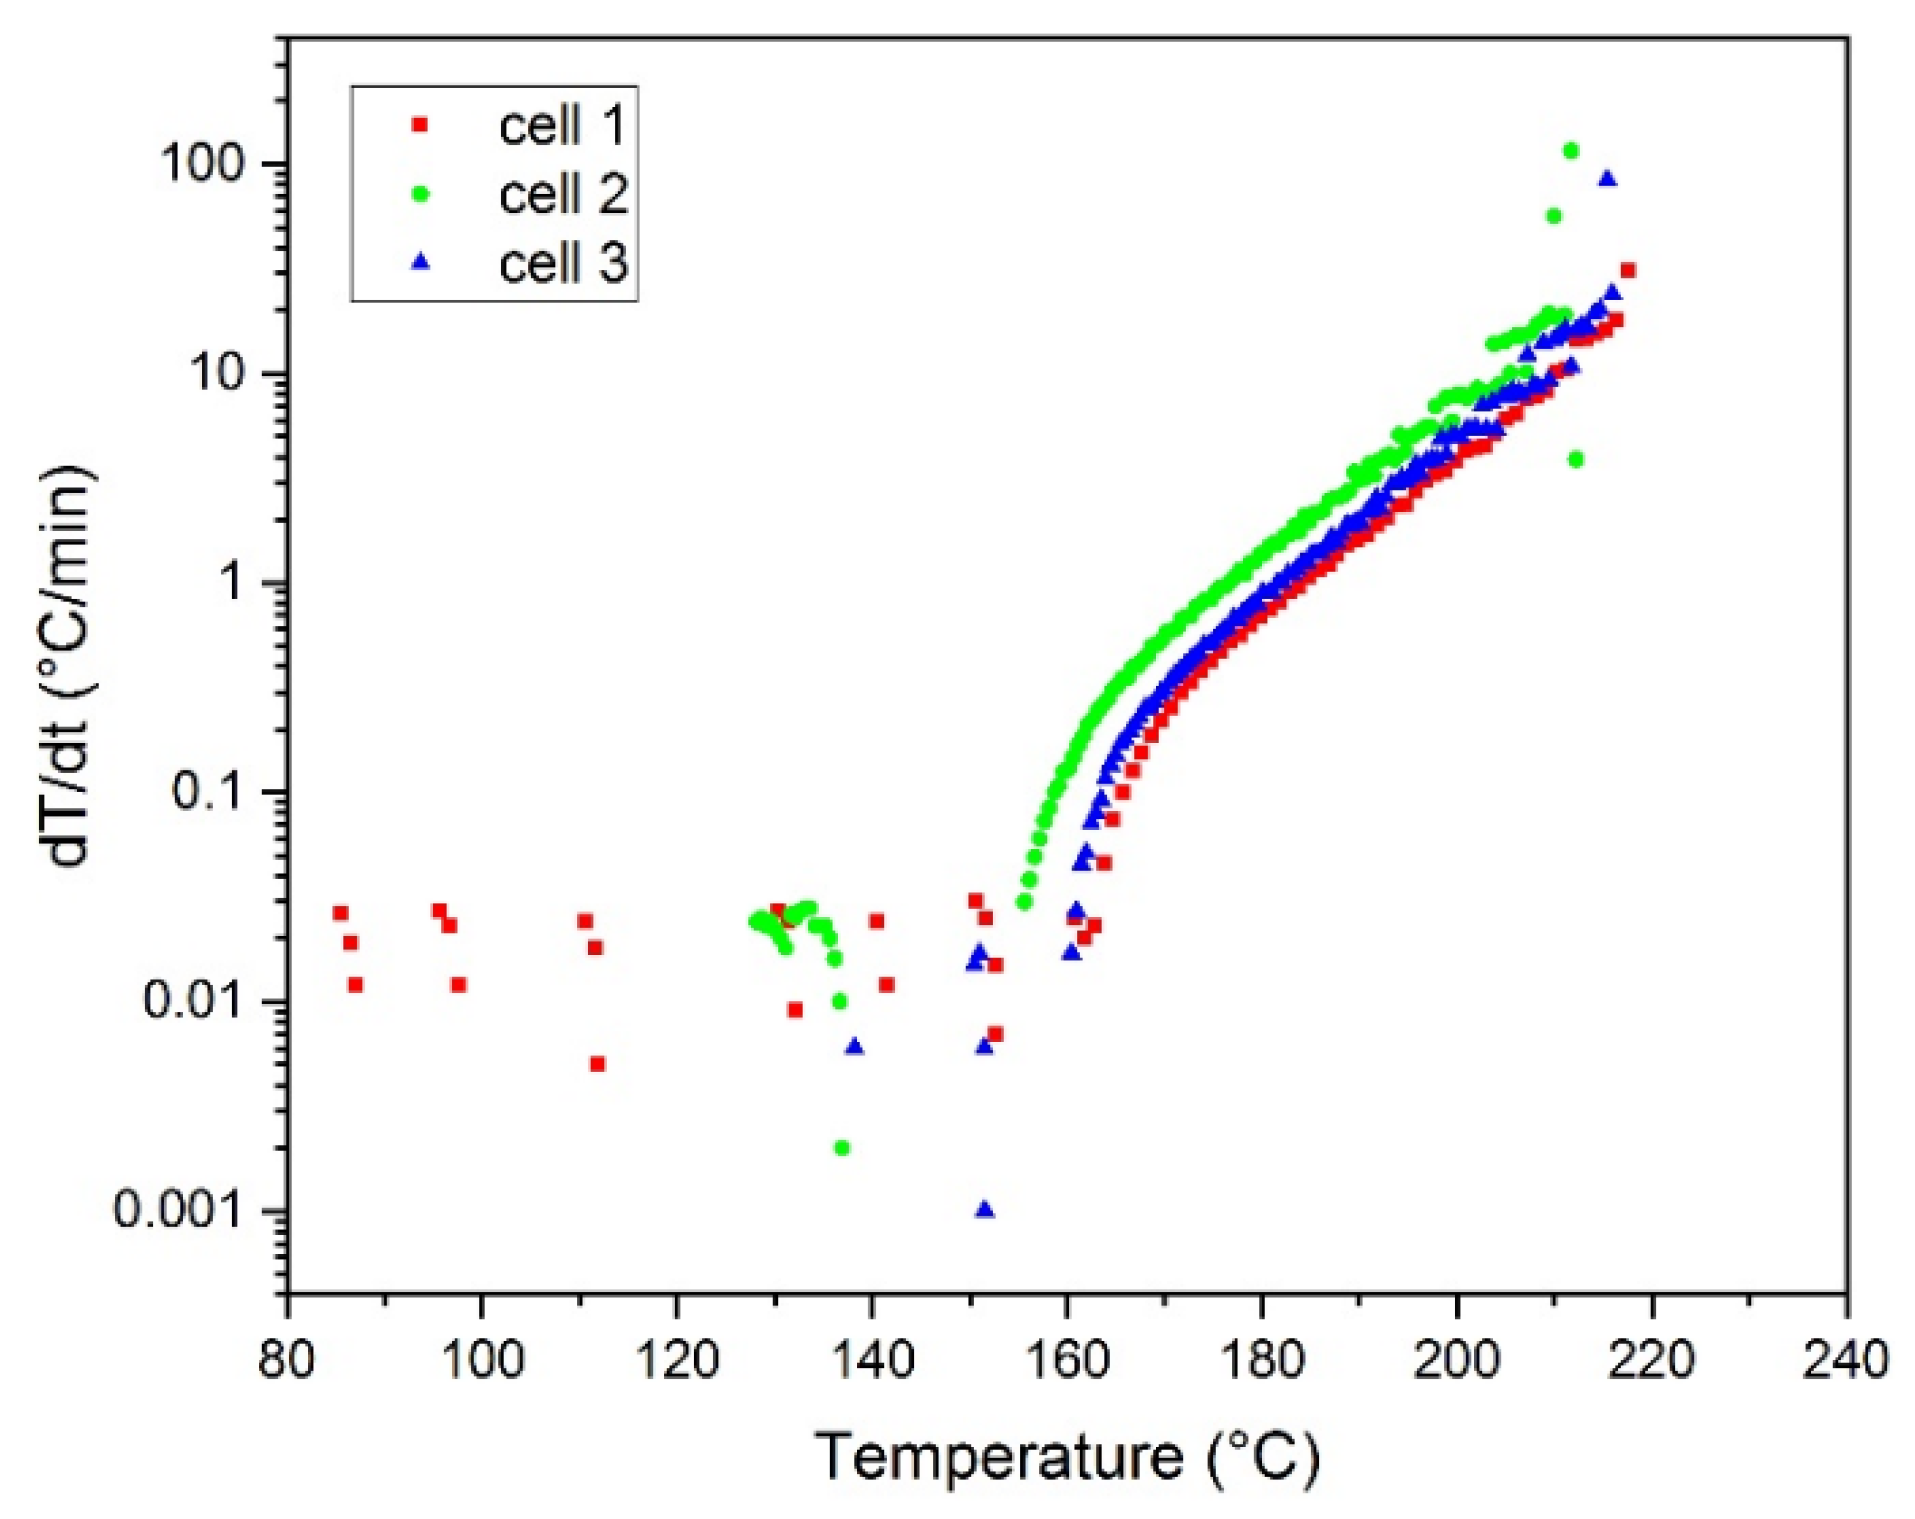
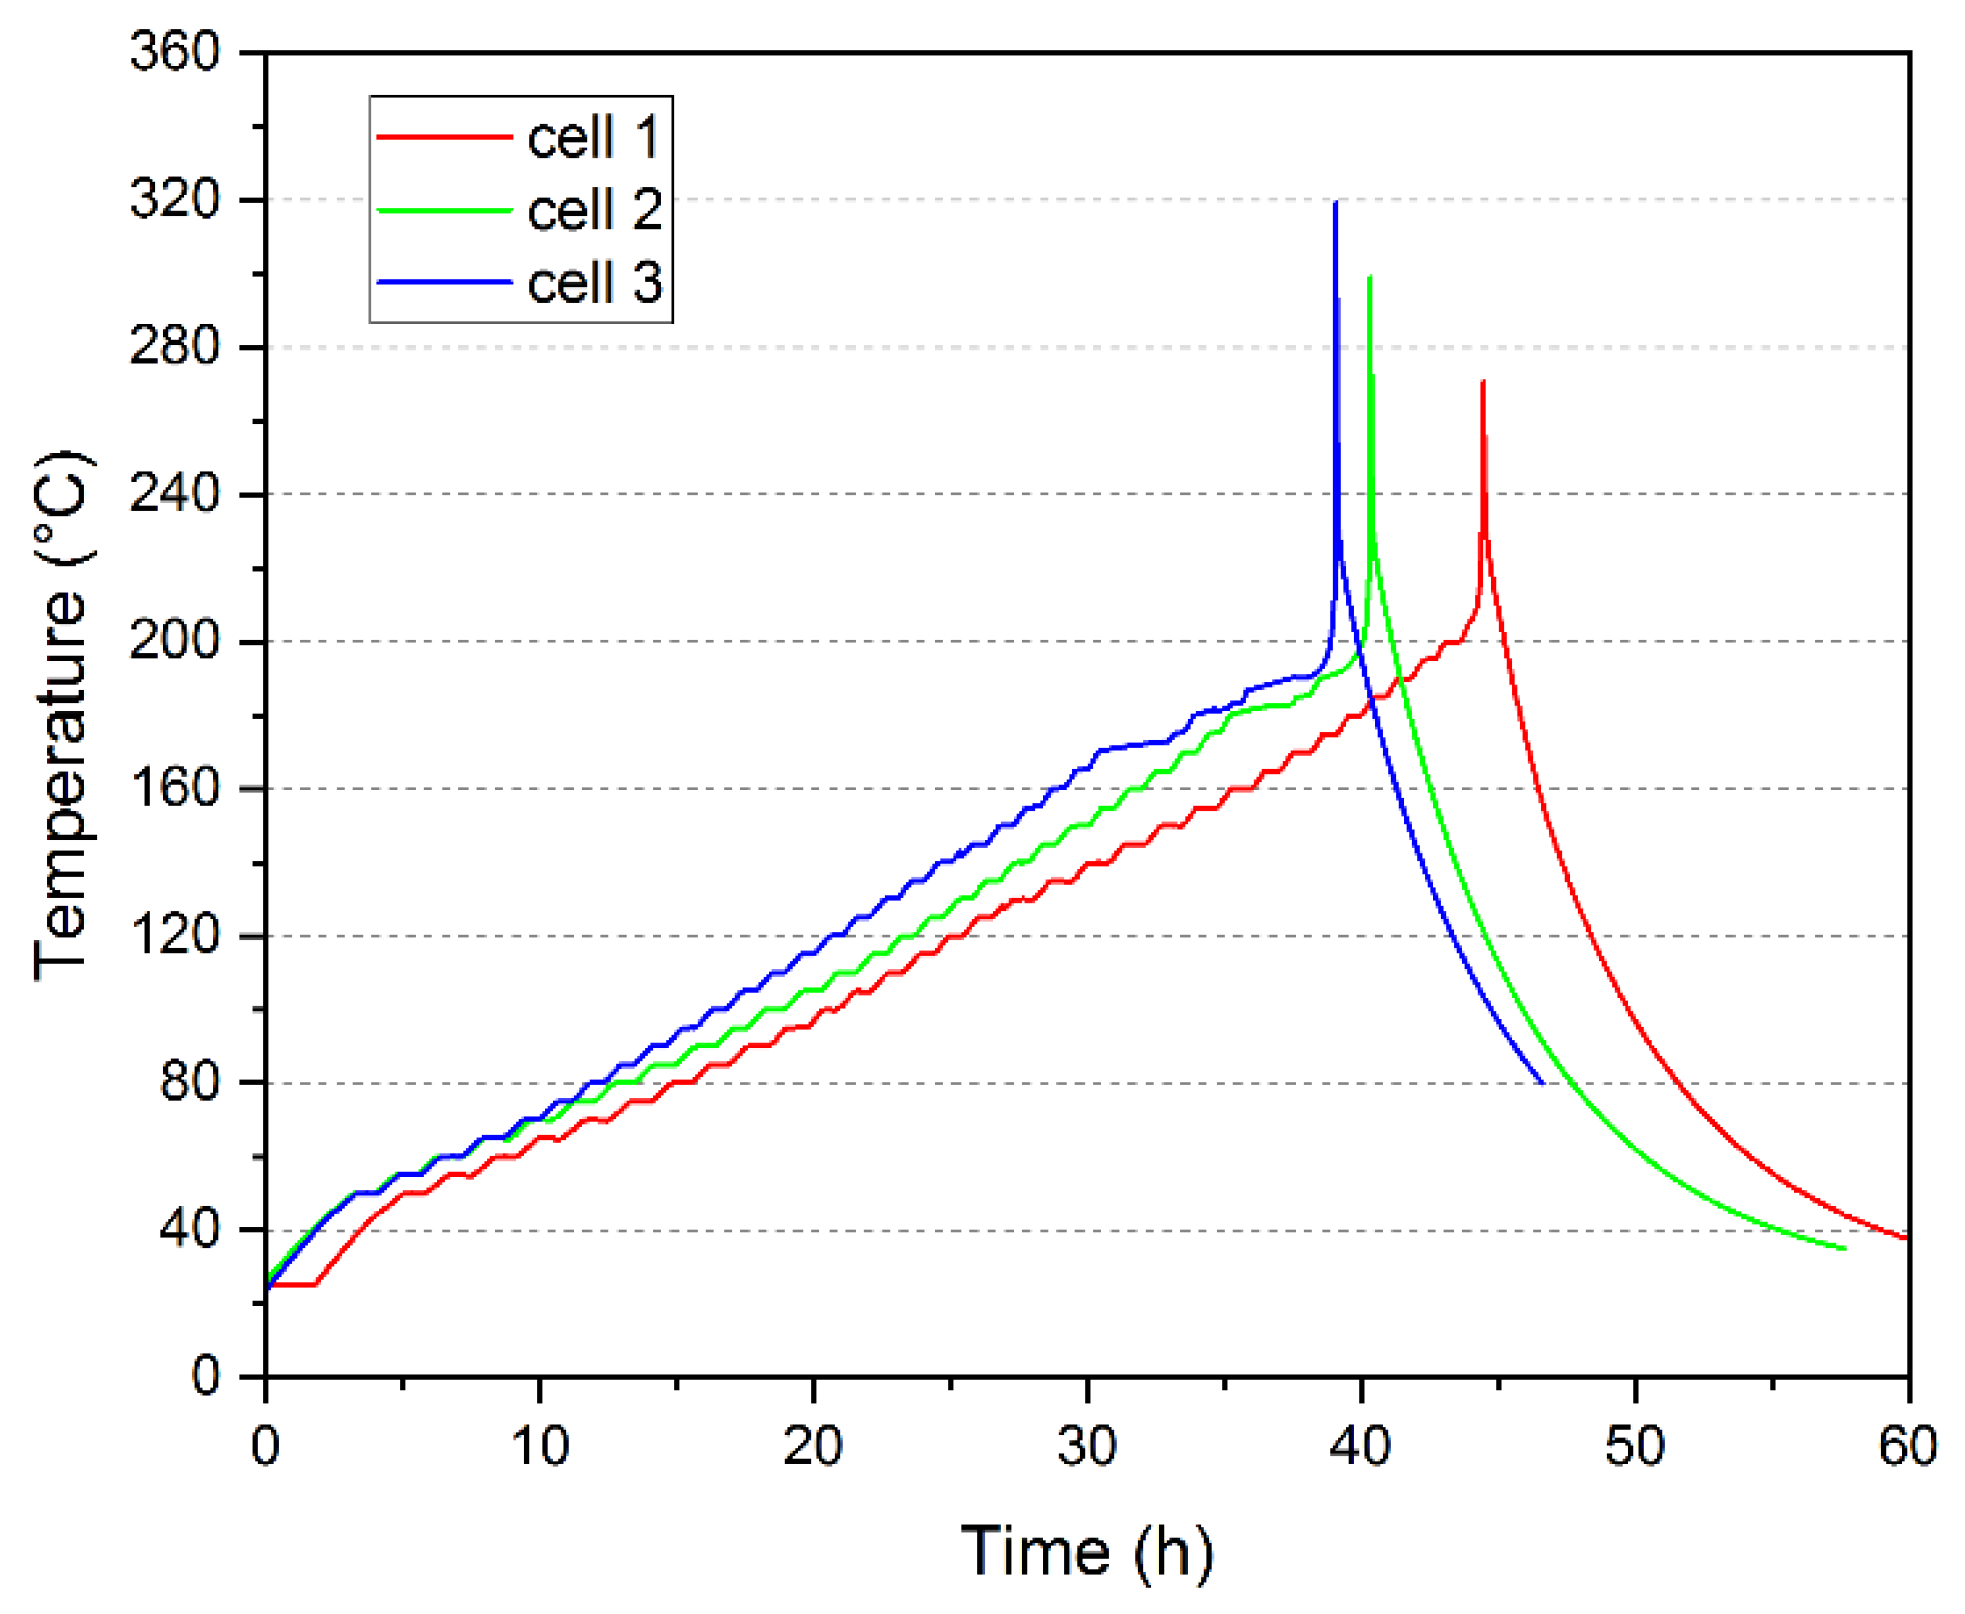
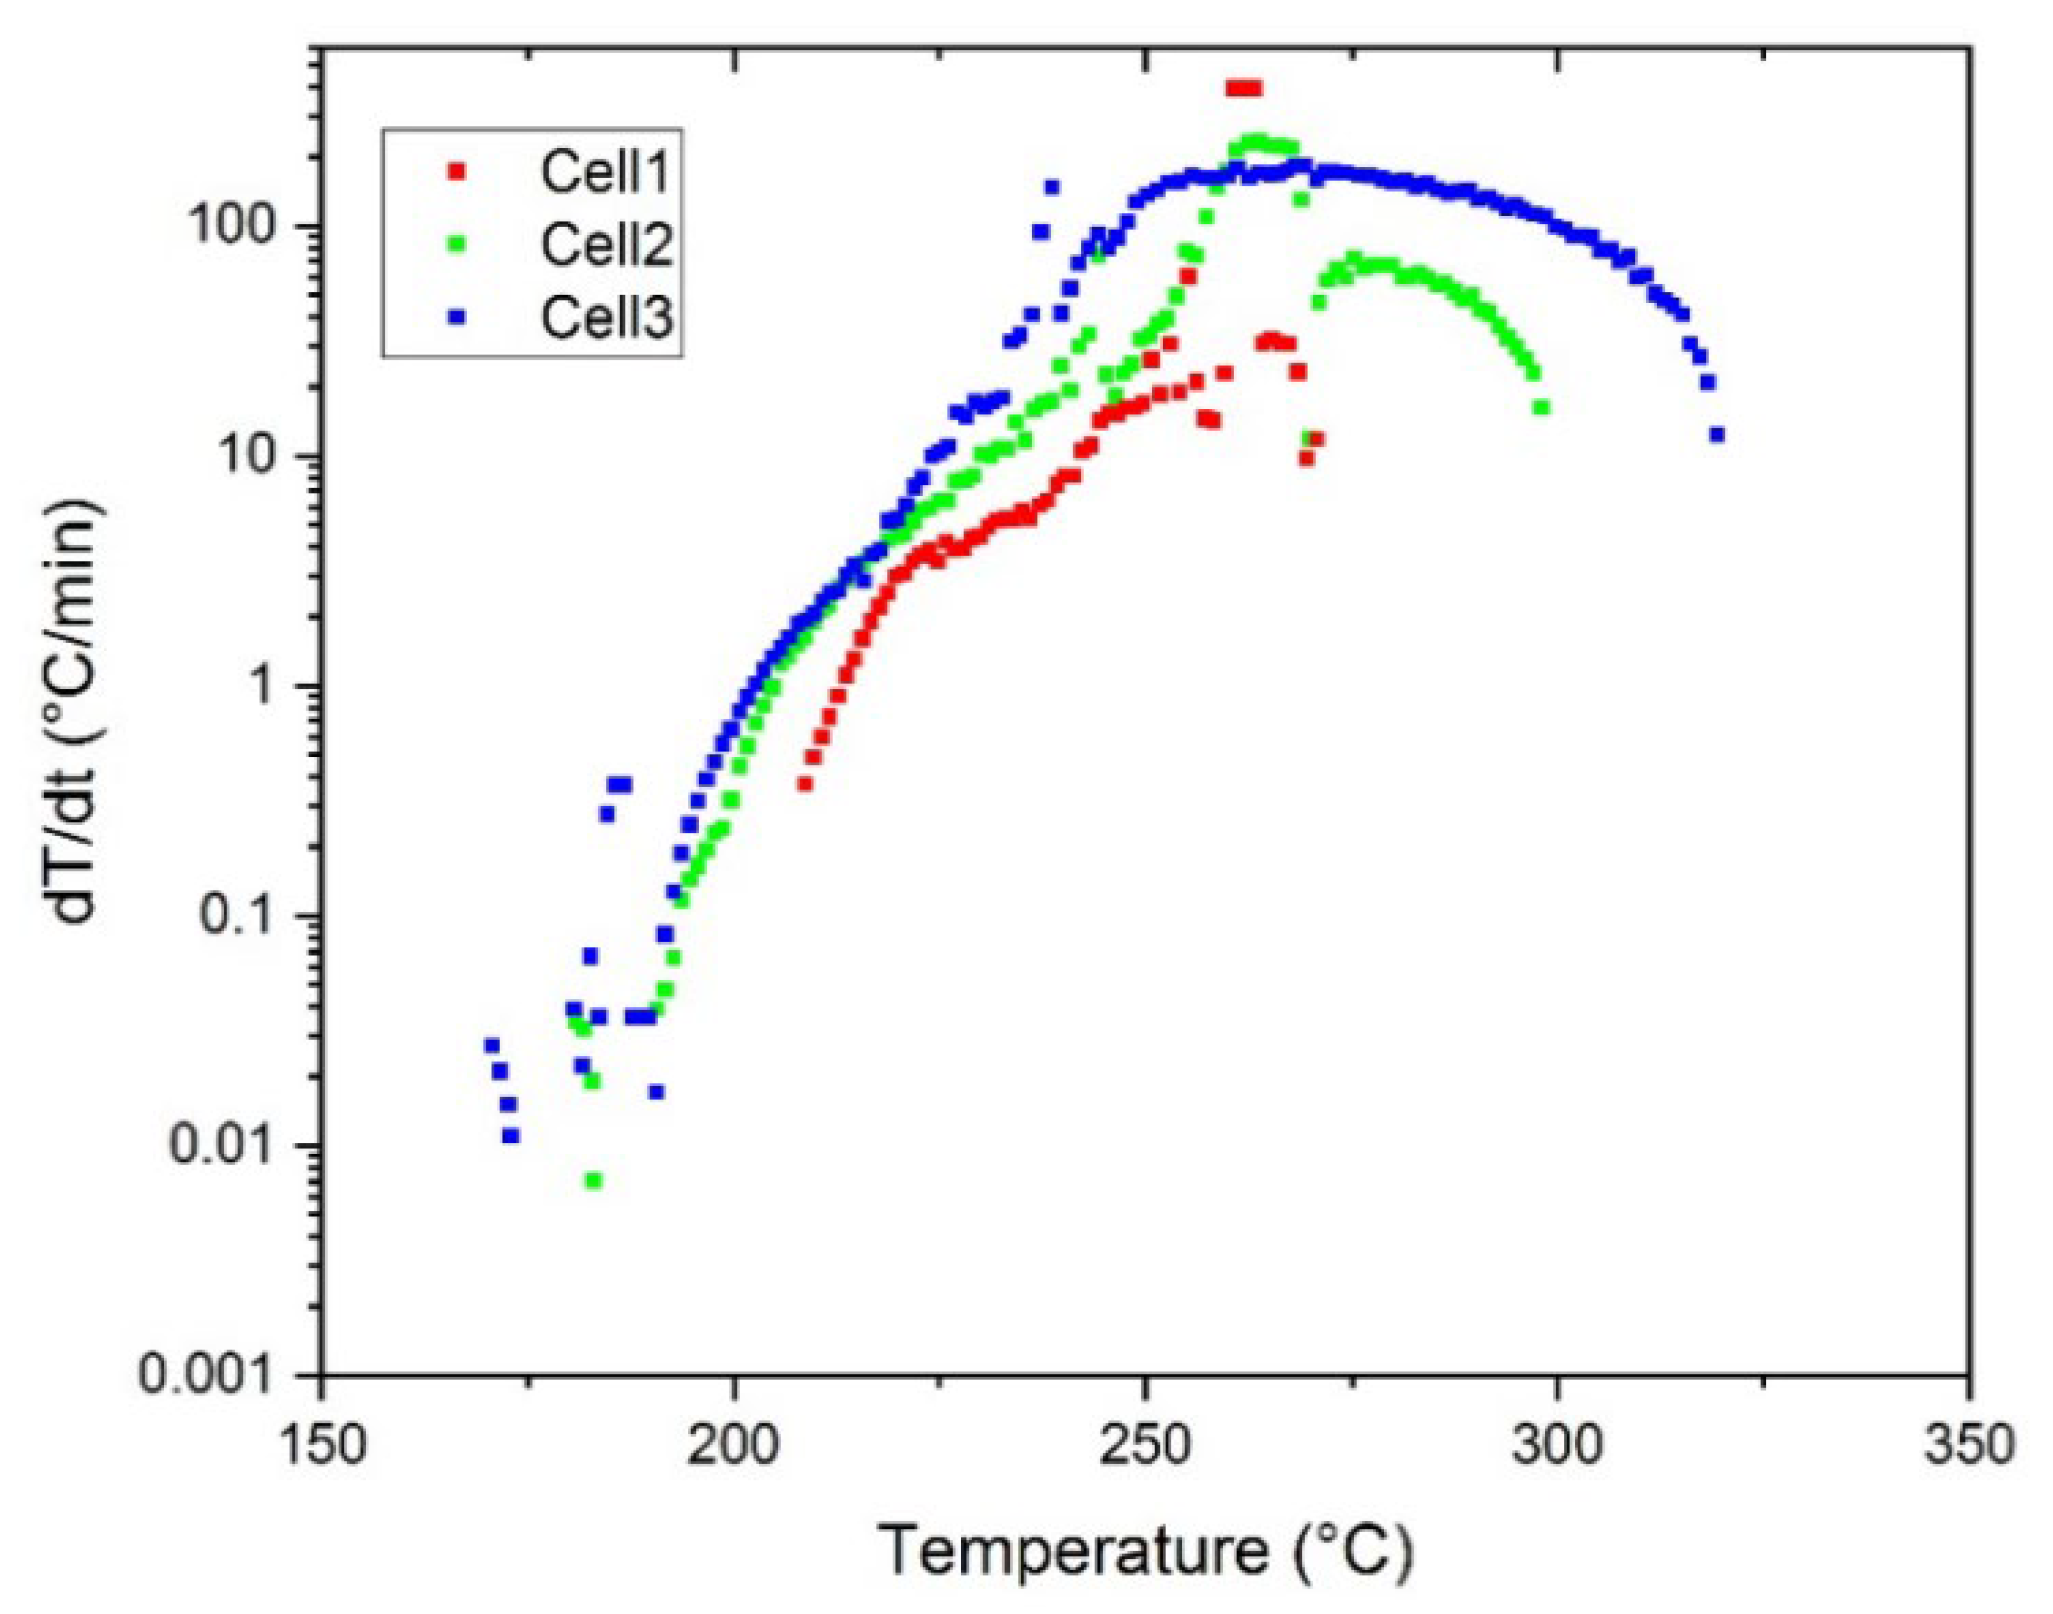
3.1. Results of Thermal Runaway Investigation Using ES-ARC
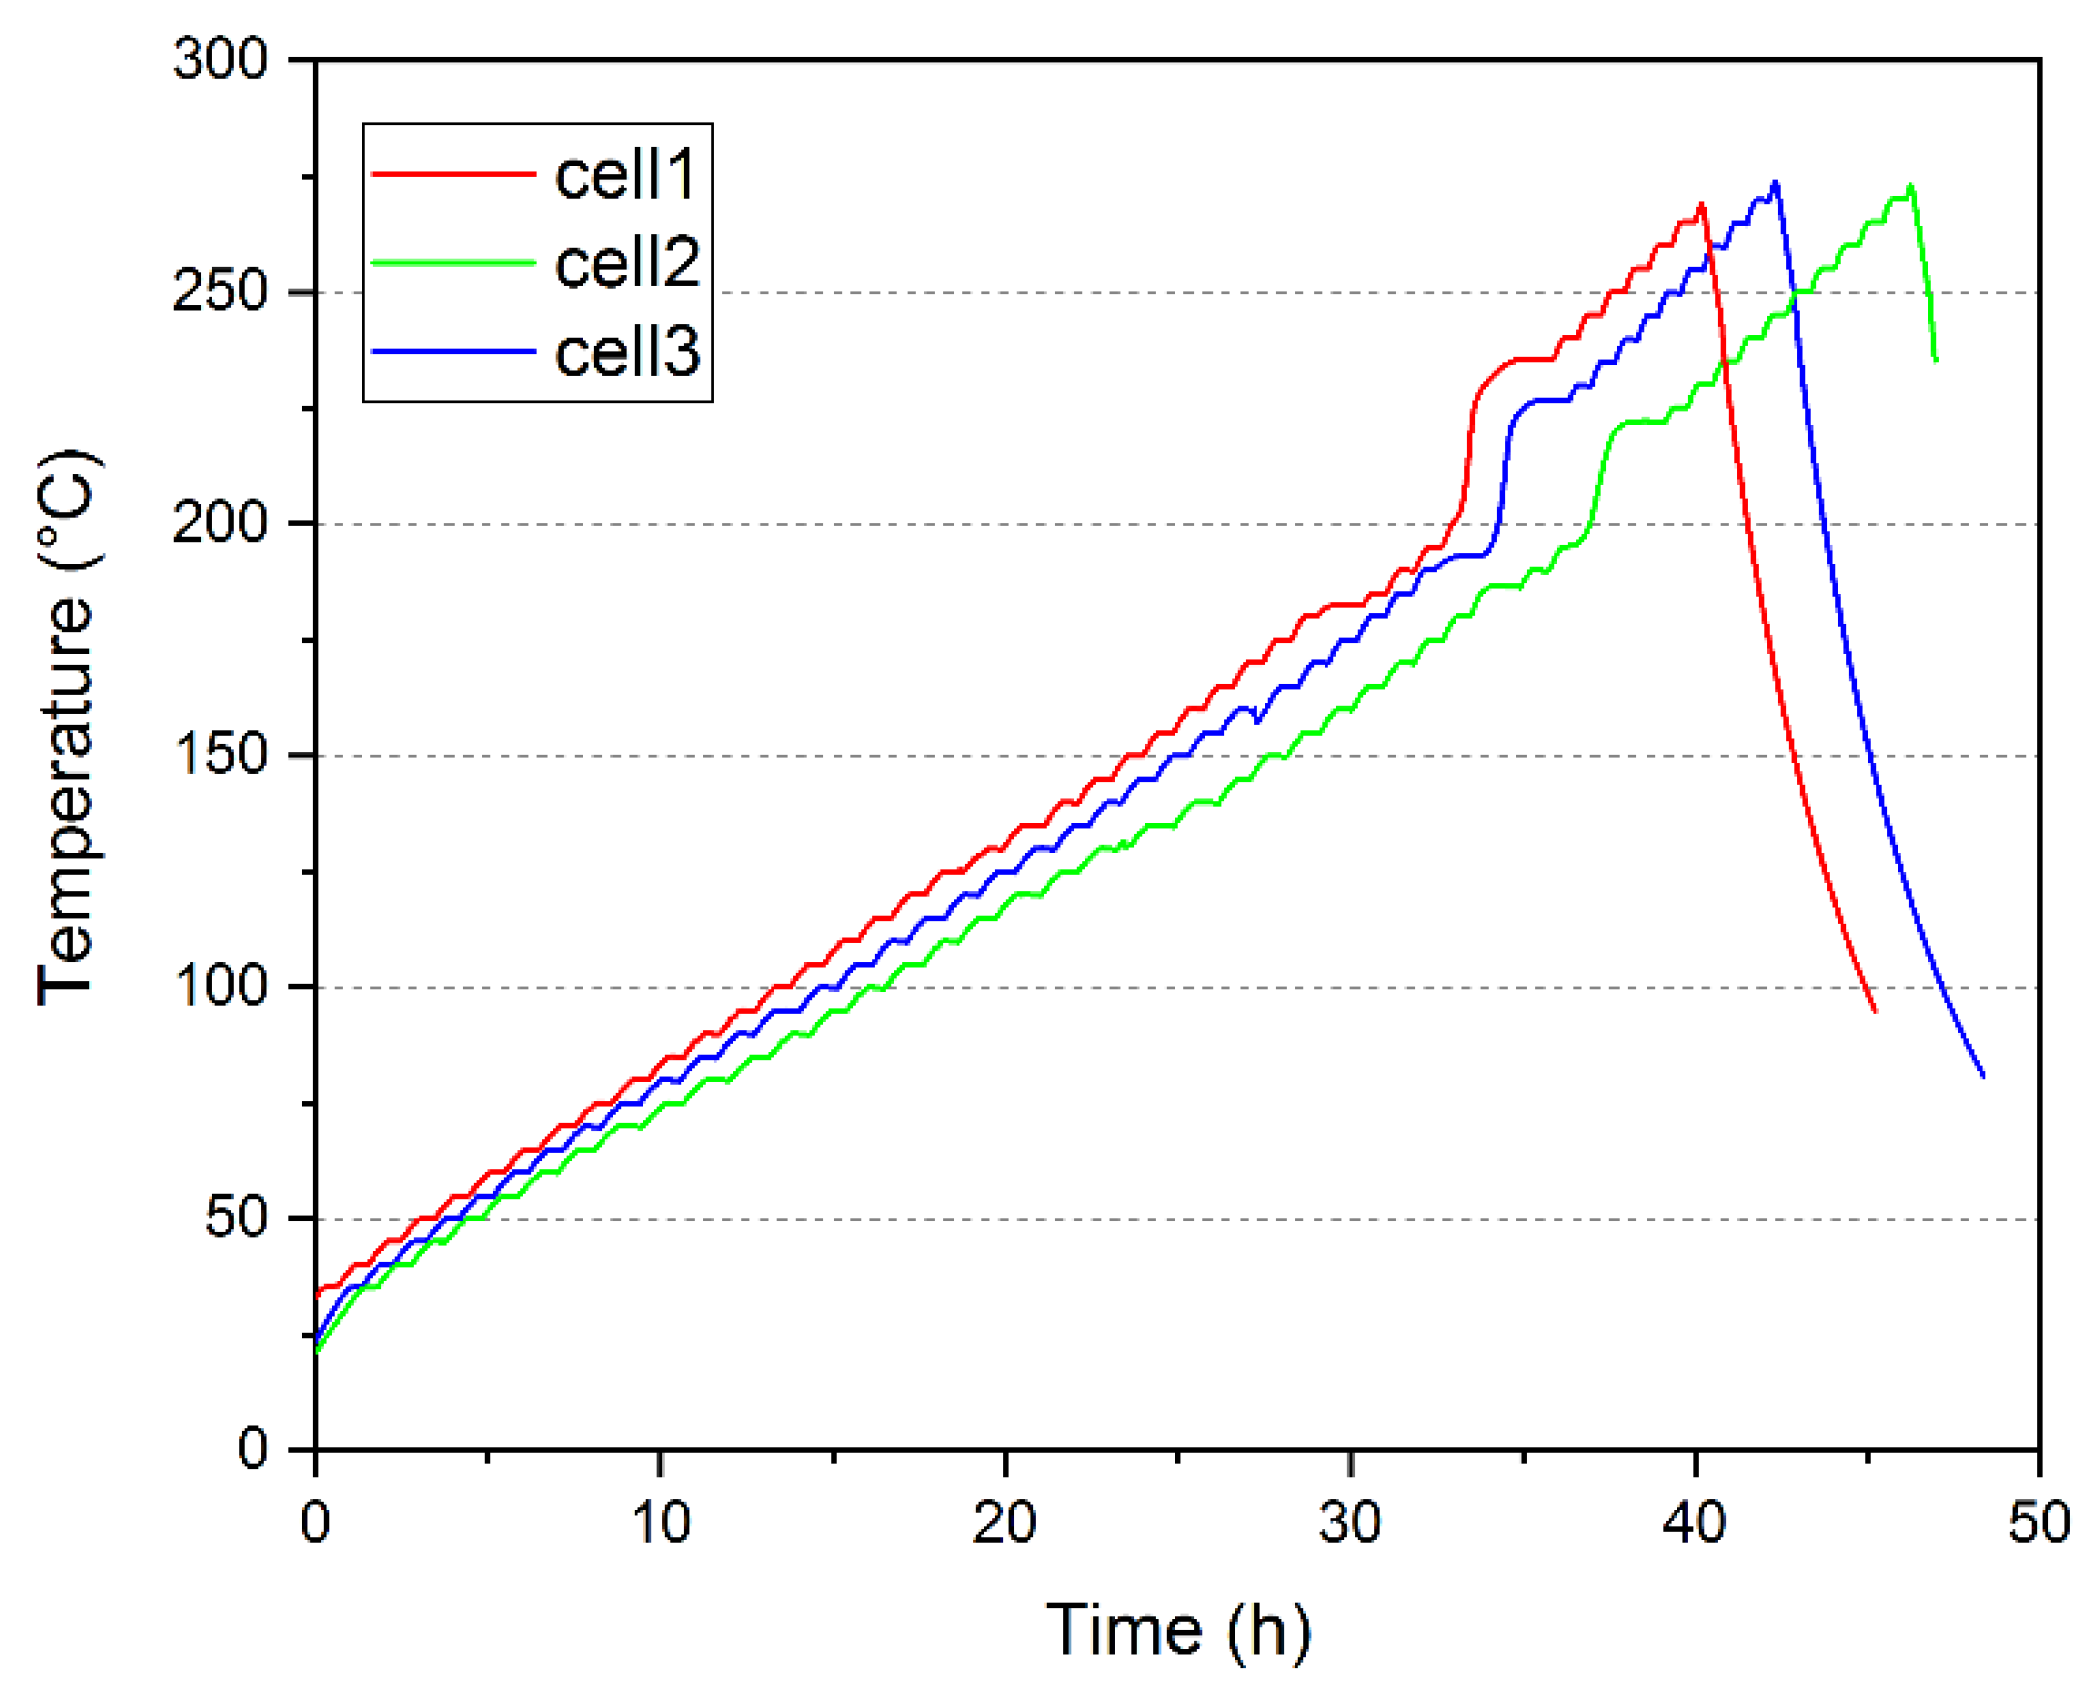
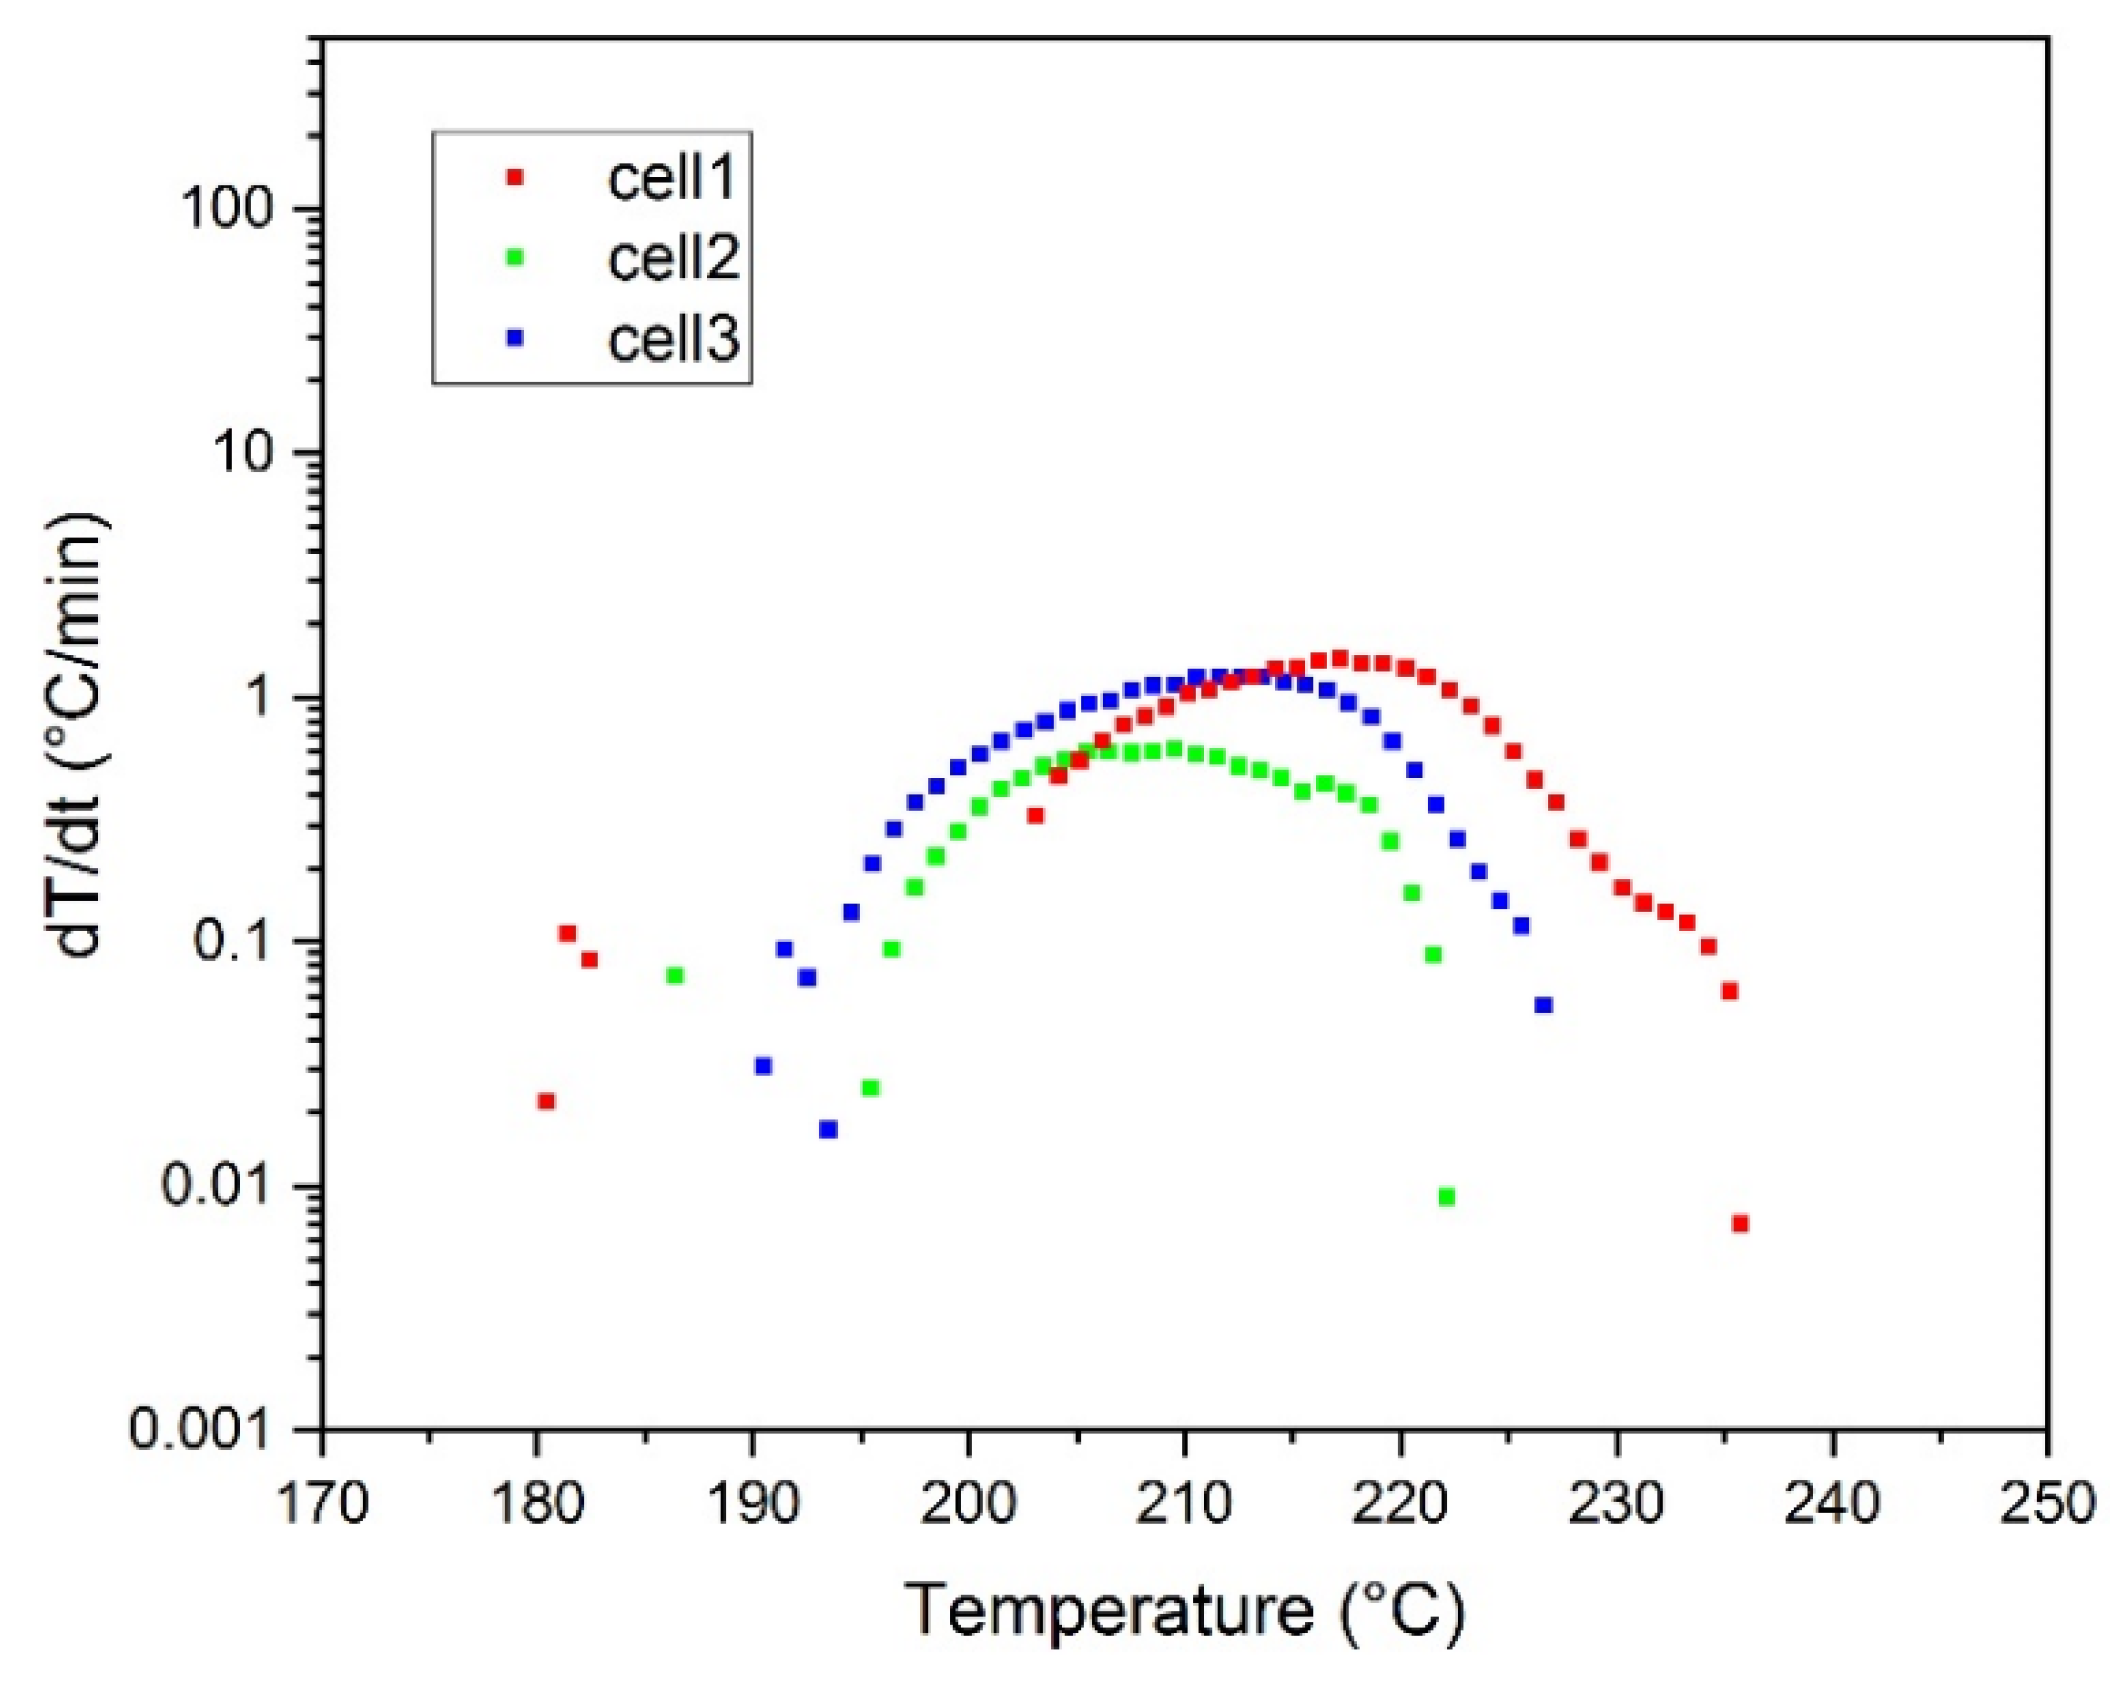
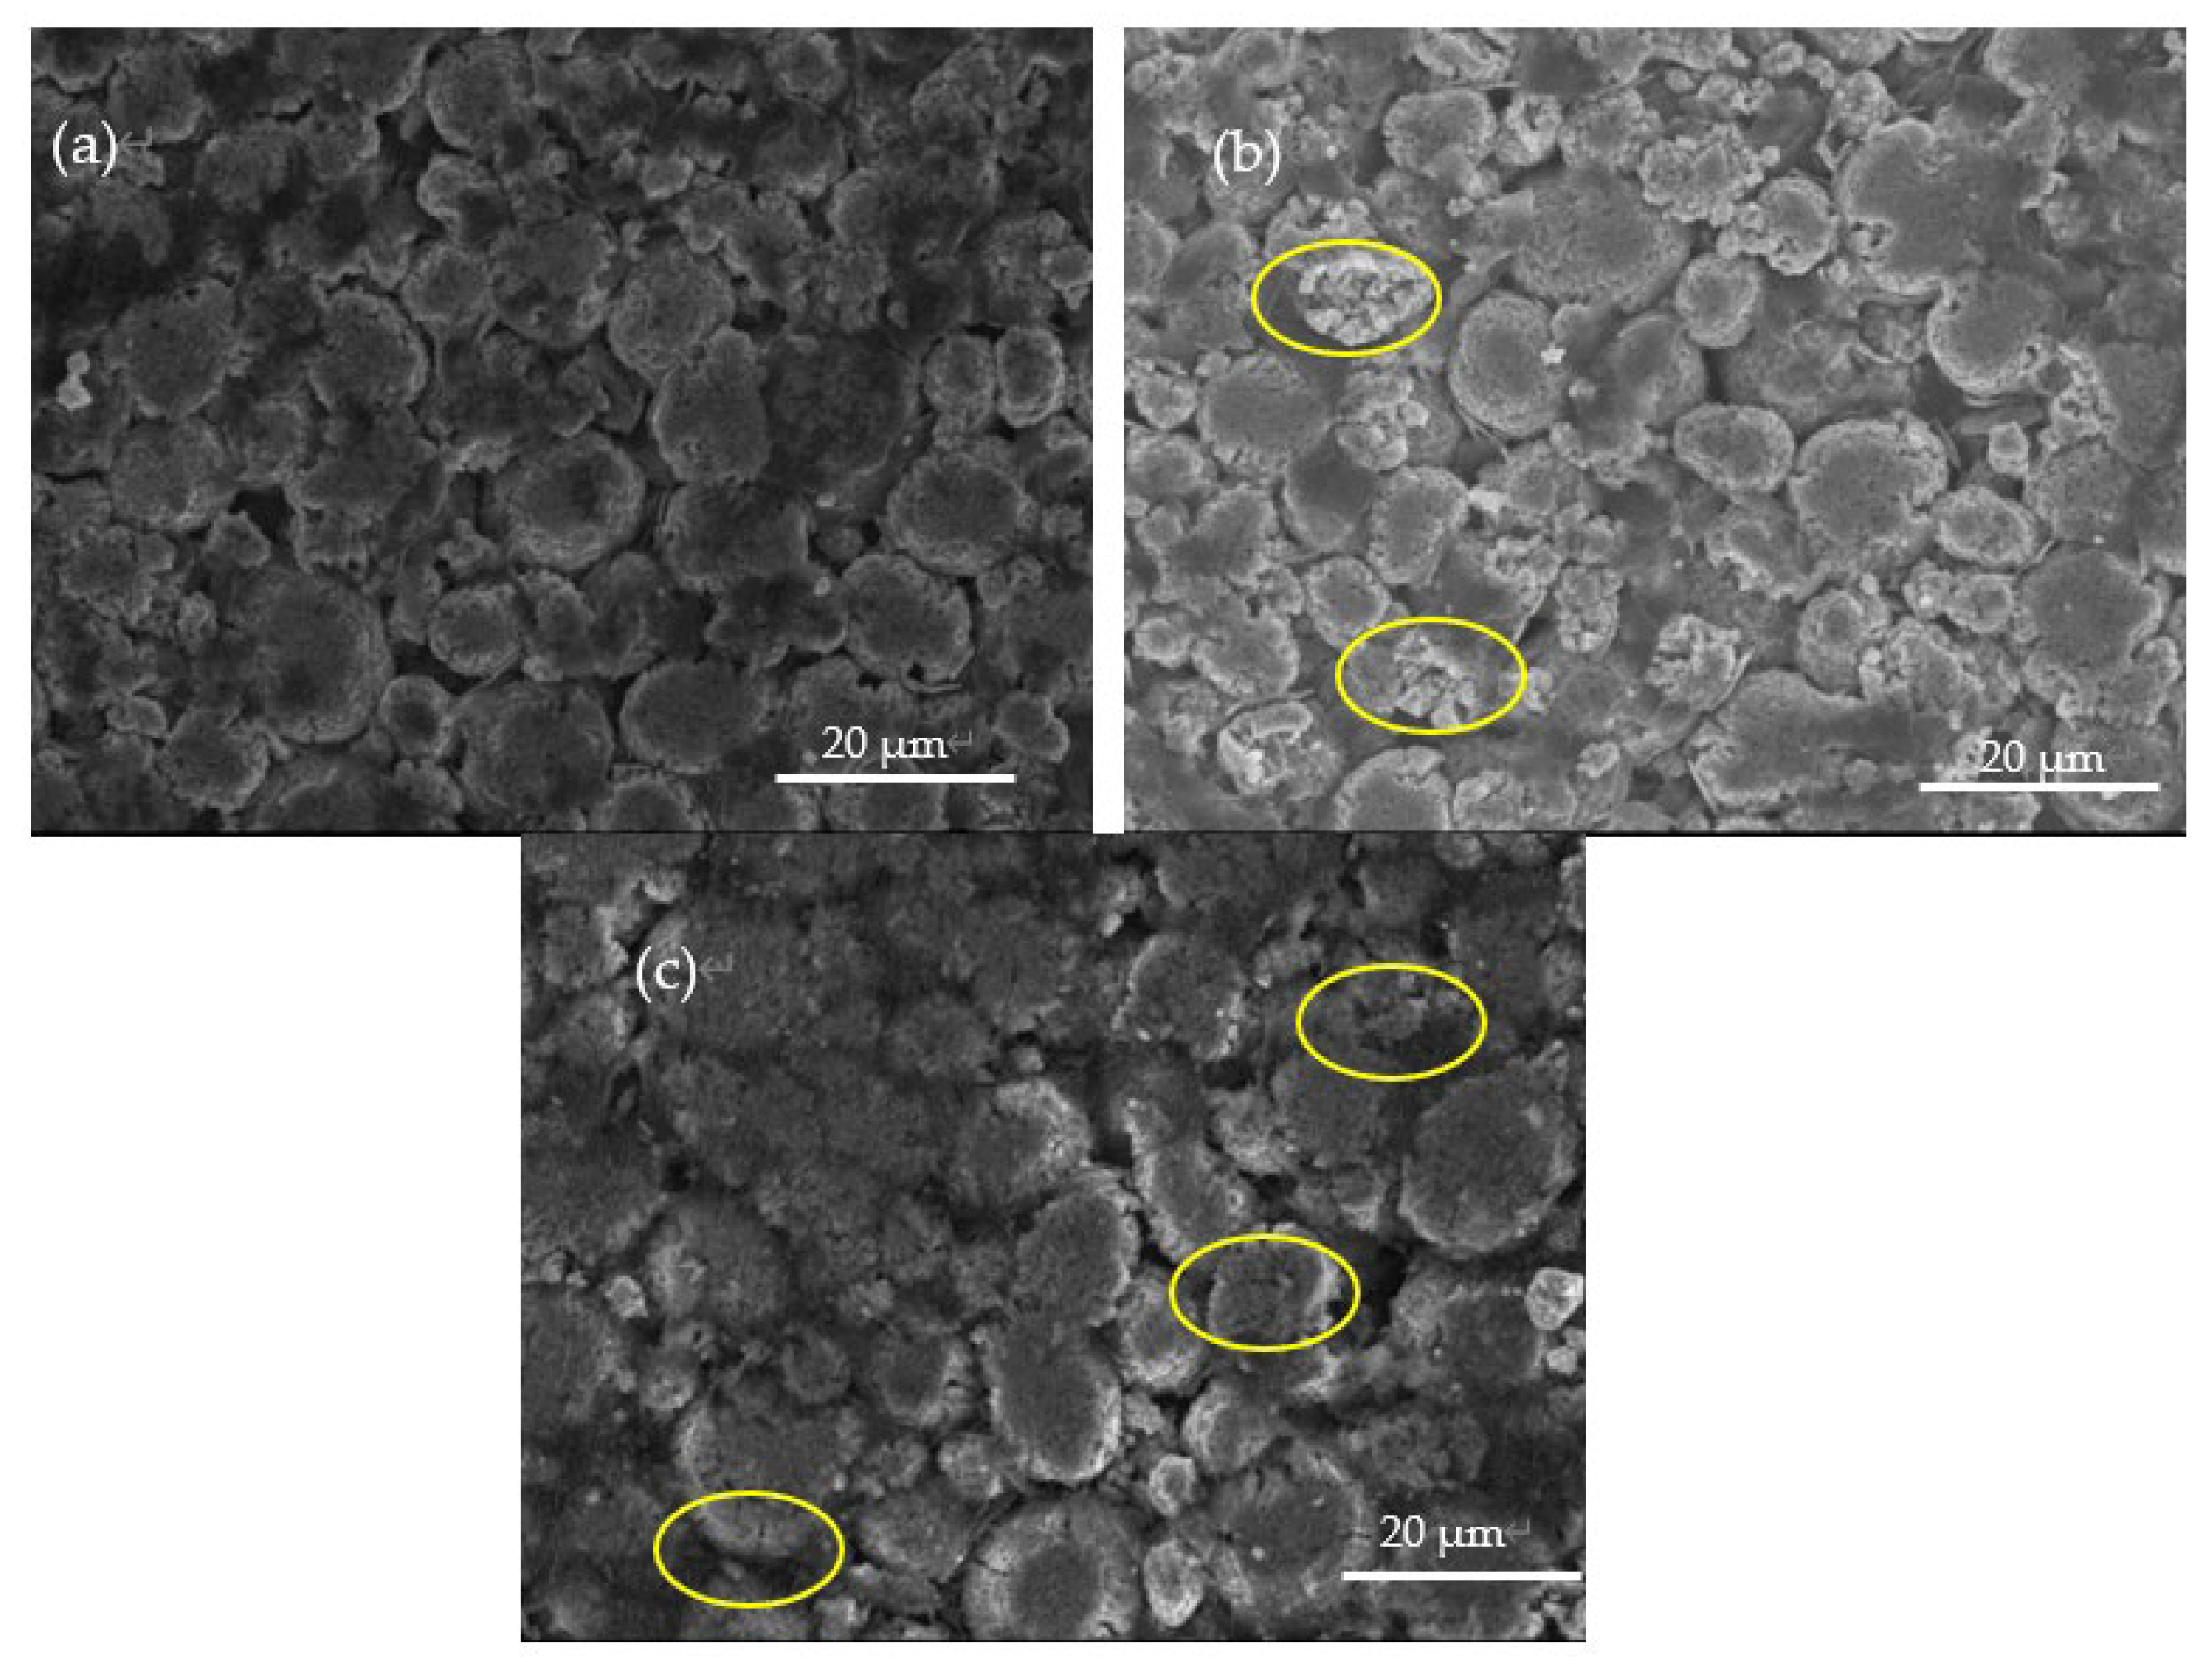
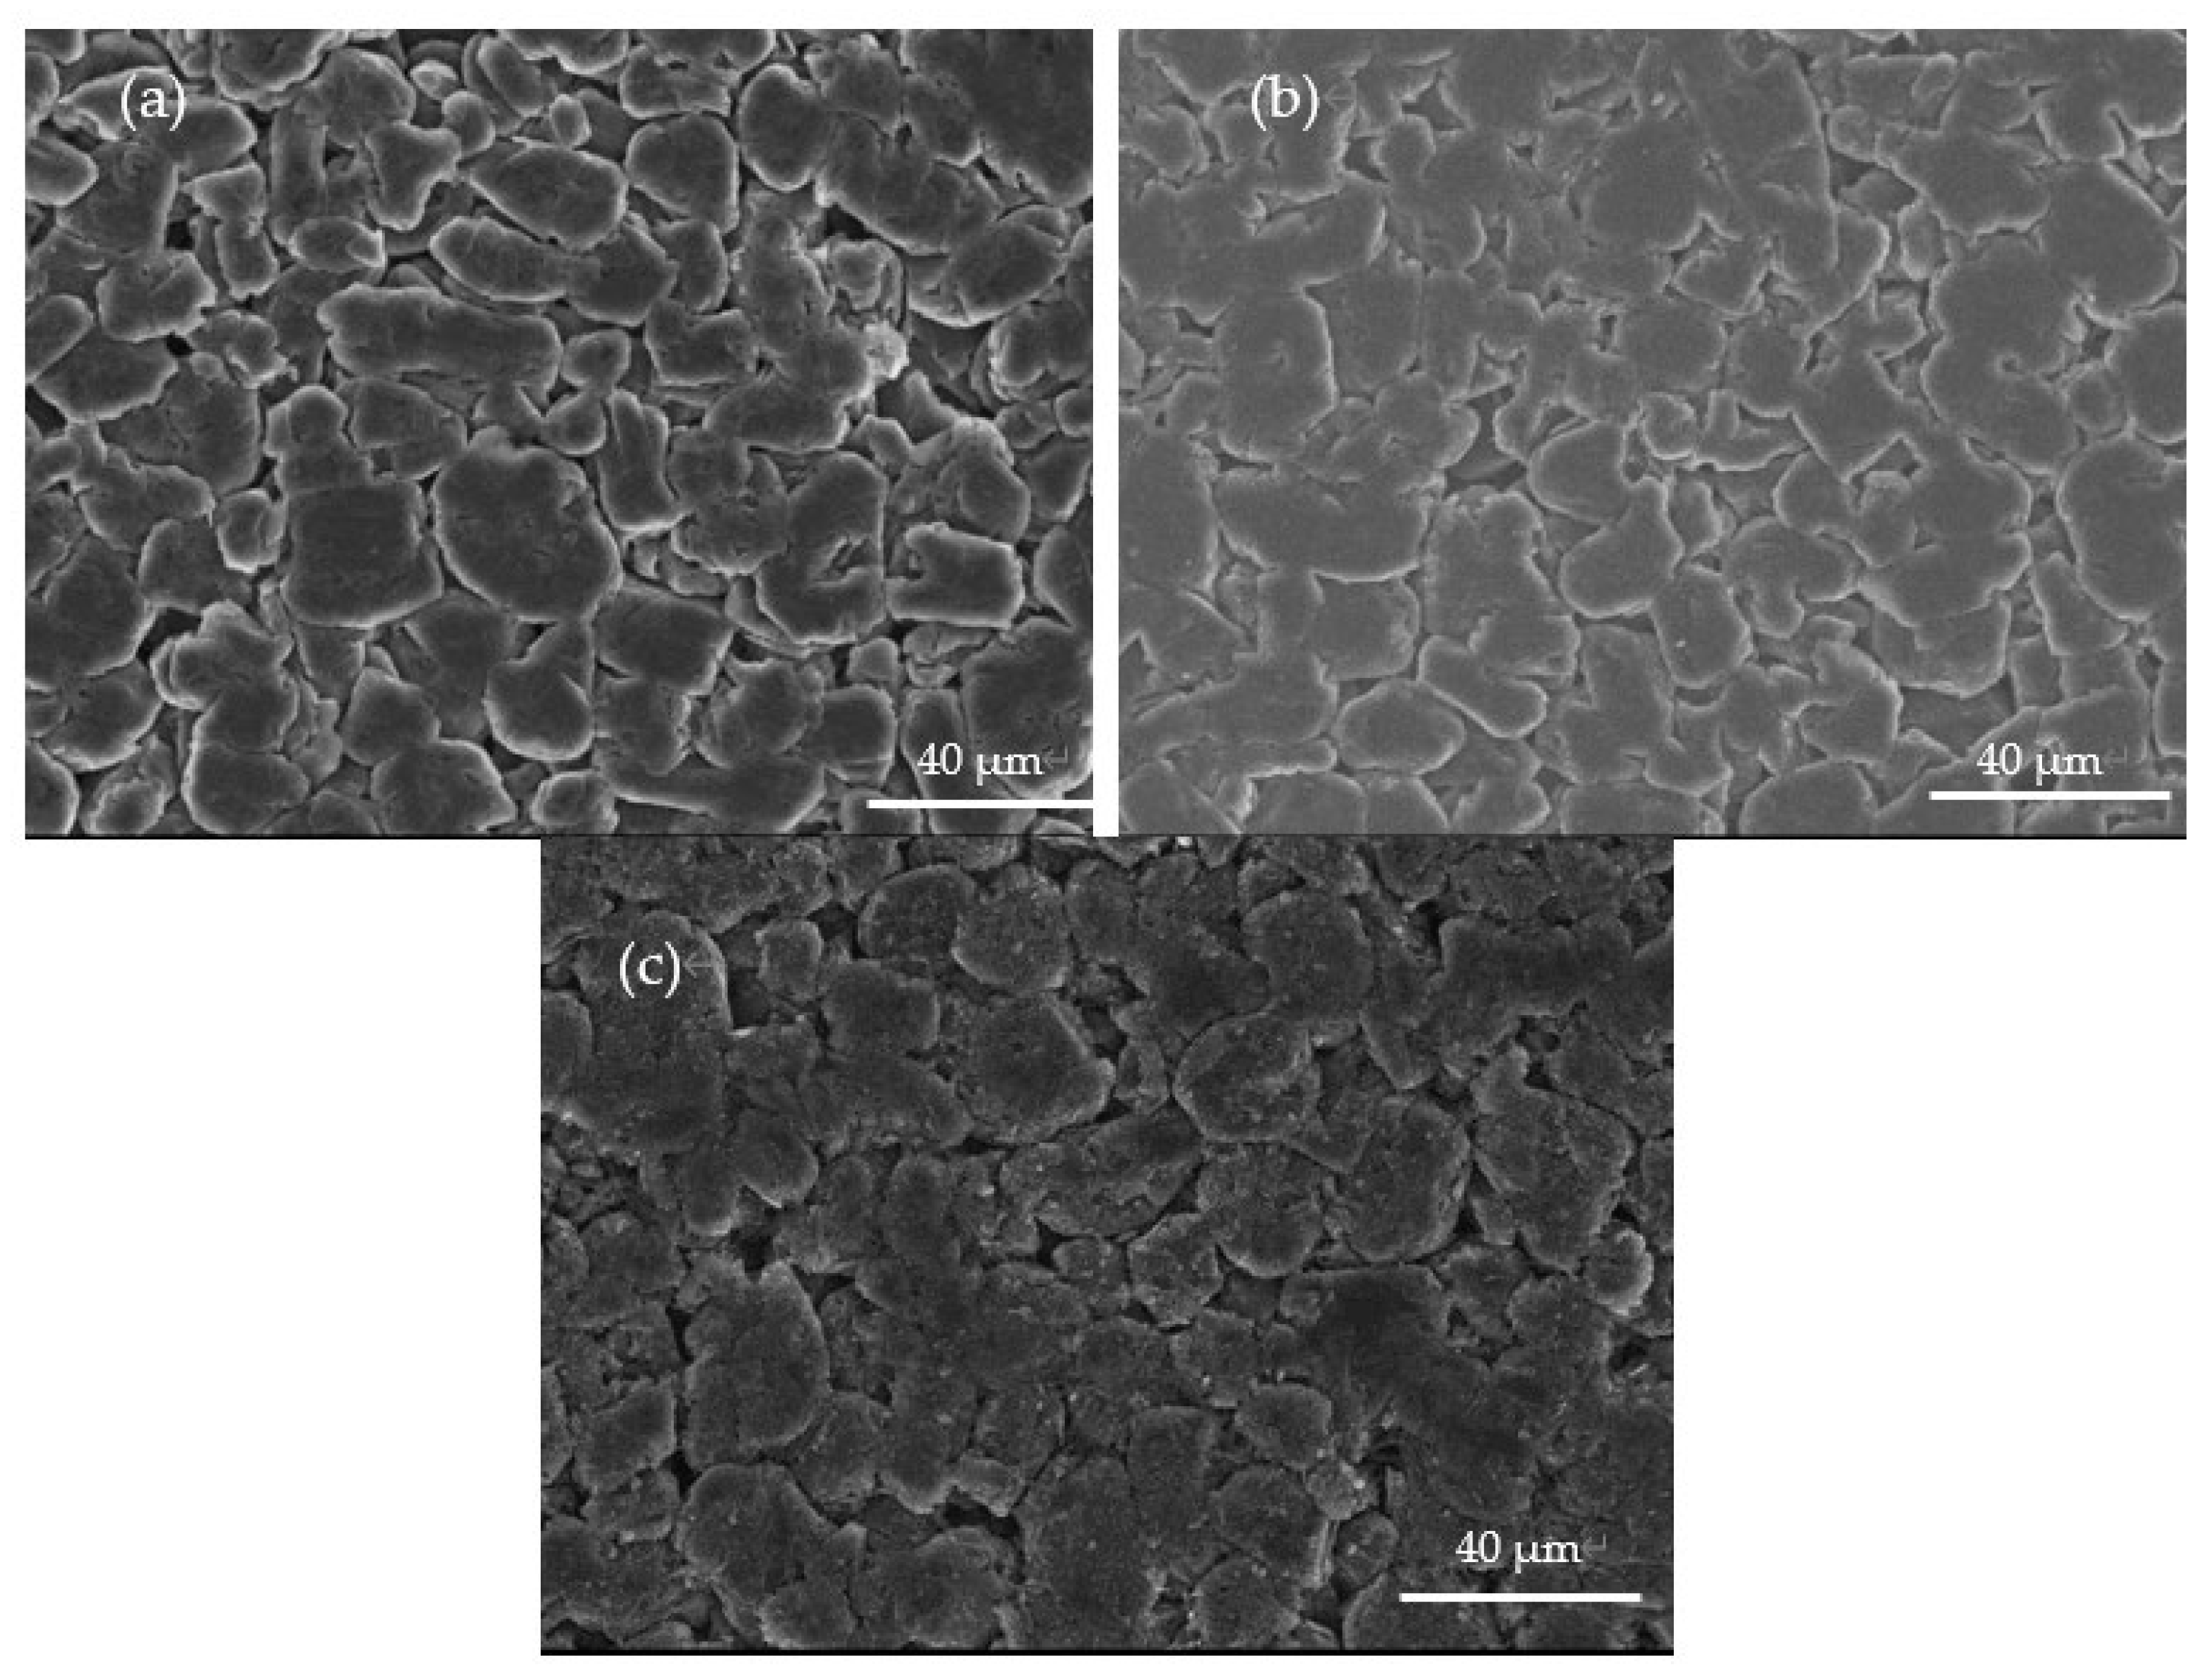
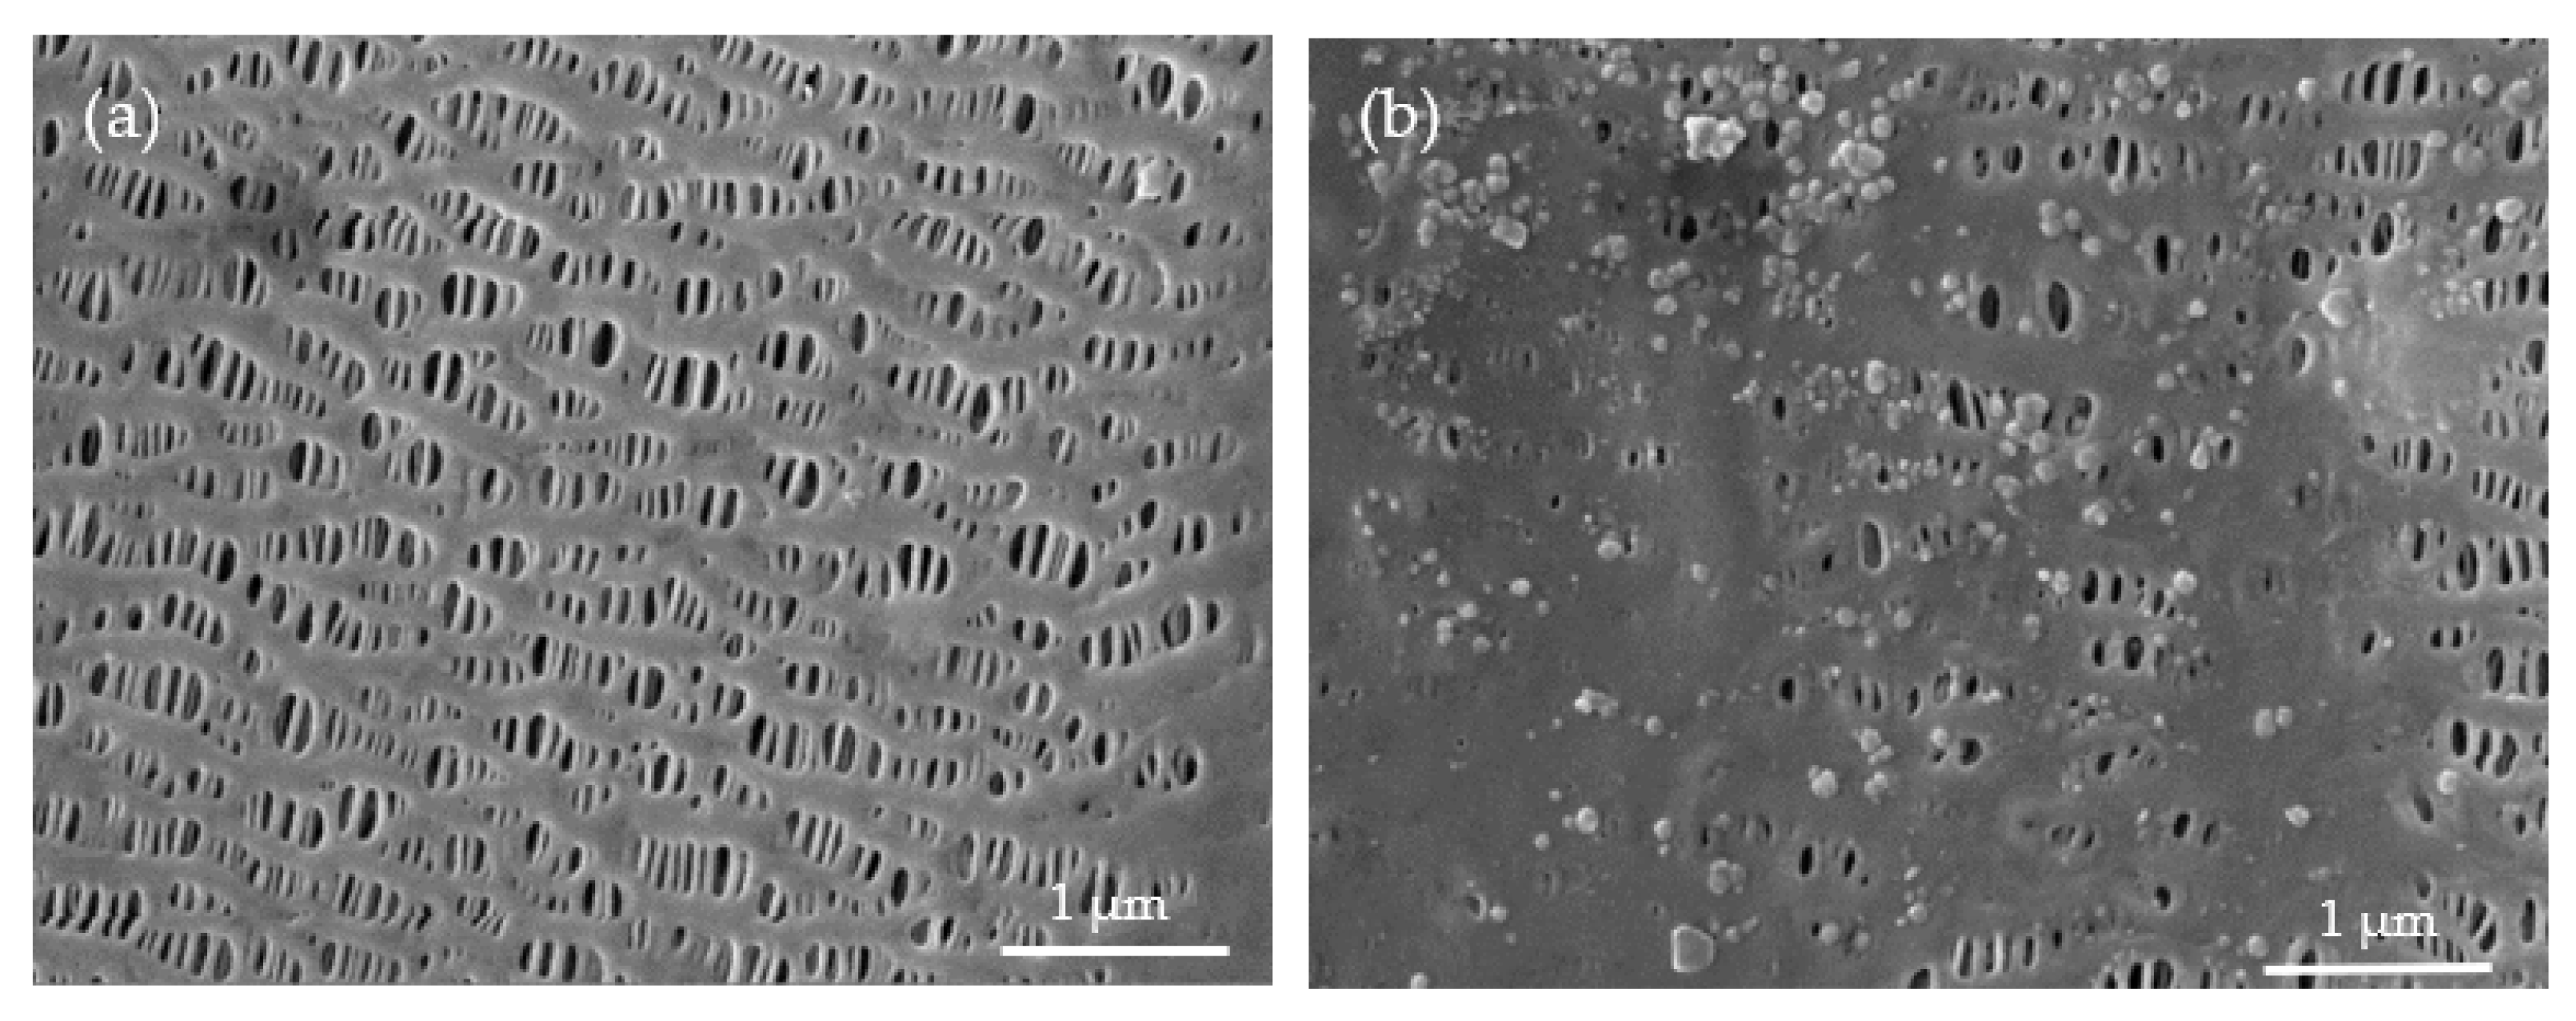
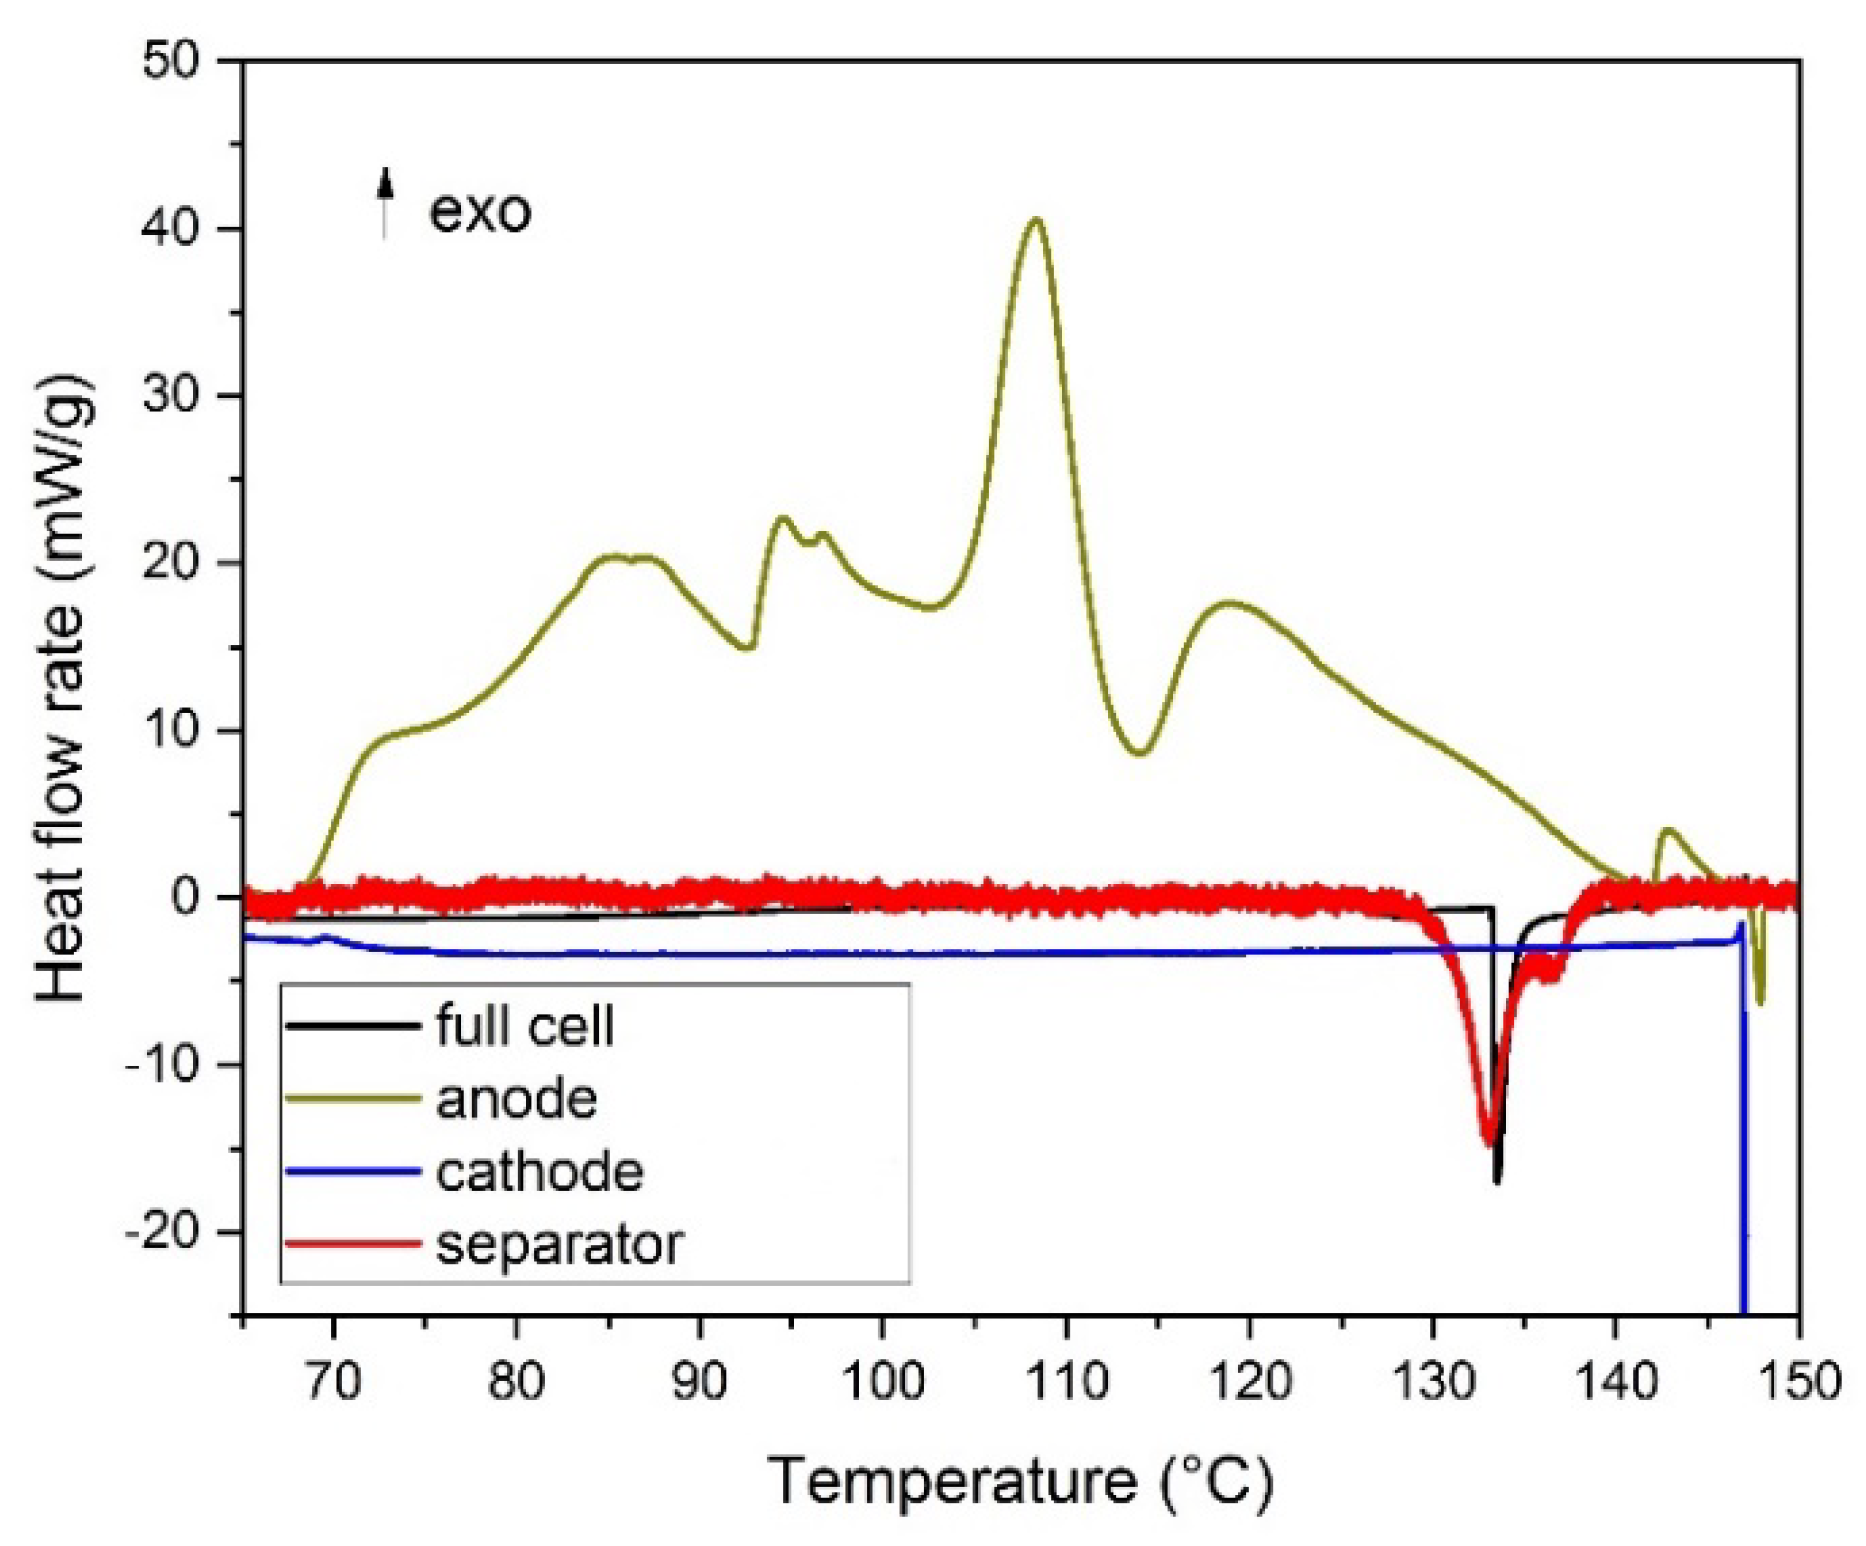
3.2. Early Stages of Thermal Runaway Investigated by a C80 Calorimeter
4. Conclusions
Author Contributions
Funding
Institutional Review Board Statement
Informed Consent Statement
Data Availability Statement
Acknowledgments
Conflicts of Interest
References
- Kurzweil, P. Electrochemical Energy Storage for Renewable Sources and Grid Balancing; Moseley, P.T., Garche, J., Eds.; Elsevier: Amsterdam, The Netherlands, 2015; Chapter 16; pp. 269–307. [Google Scholar]
- Ren, G.; Ma, G.; Cong, N. Review of electrical energy storage systems for vehicular applications. Renew. Sustain. Energy Rev. 2015, 41, 225–236. [Google Scholar] [CrossRef]
- Wang, Y.; Liu, Q.; Li, S.; Cartmell, S.; Ferrara, Z.; Deng, D.; Xiao, J. Lithium and lithium-ion batteries for applications in microelectronic devices: A review. J. Power Sources 2015, 286, 330–345. [Google Scholar] [CrossRef] [Green Version]
- Yabuuchi, N.; Ohzuku, T. Novel lithium insertion material of LiCo1/3Ni1/3Mn1/3O2 for advanced lithium-ion batteries. J. Power Sources 2003, 119, 171–174. [Google Scholar] [CrossRef]
- Wang, Y.D.; Jiang, J.W.; Dahn, J.R. The reactivity of delithiated Li(Ni1/3Co1/3Mn1/3)O2, Li(Ni0.8Co0.15Al0.05)O2 or LiCoO2 with non-aqueous electrolyte. Electrochem. Commun. 2007, 9, 2534–2540. [Google Scholar] [CrossRef]
- MacNeil, D.D.; Lu, Z.; Dahn, J.R. Structure and electrochemistry of Li(NixCo1-2xMnx)O2 (0 ≤ x ≤ 1/2). J. Electrochem. Soc. 2002, 149, A1332. [Google Scholar] [CrossRef]
- Saito, Y.; Takano, K.; Negishi, A. Thermal behaviors of lithium-ion cells during overcharge. J. Power Sources 2001, 97–98, 693–696. [Google Scholar] [CrossRef]
- Spotnitz, R.; Franklin, J. Abuse behavior of high-power, lithium-ion cells. J. Power Sources 2003, 113, 81–100. [Google Scholar] [CrossRef]
- Armand, M.; Tarascon, J.M. Building better batteries. Nature 2008, 451, 652–657. [Google Scholar] [CrossRef]
- Goodenough, J.B.; Kim, T. Challenges for Rechargeable Li Batteries. Chem. Mater. 2010, 22, 587–603. [Google Scholar] [CrossRef]
- Thackeray, M.M.; Wolverton, C.; Isaacs, E.D. Electrical energy storage for transportation—Approaching the limits of, and going beyond, lithium-ion batteries. Energy Environ. Sci. 2012, 5, 7854–7863. [Google Scholar] [CrossRef]
- Balakrishnan, P.; Ramesh, R.; Kumar, P. Safety mechanisms in lithium-ion batteries. J. Power Sources 2006, 155, 401–414. [Google Scholar] [CrossRef]
- Wang, Q.; Ping, P.; Zhao, X.; Chu, G.; Sun, J.; Chen, C. Thermal runaway caused fire and explosion of lithium ion battery. J. Power Sources 2012, 208, 210–224. [Google Scholar] [CrossRef]
- Golubkov, A.W.; Fuchs, D.; Wagner, J.; Wiltsche, H.; Stangl, C.; Fauler, G.; Voitic, G.; Thaler, A.; Hacker, V. Thermal-runaway experiments on consumer Li-ion batteries with metal-oxide and olivin-type cathodes. RSC Adv. 2014, 4, 3633–3642. [Google Scholar] [CrossRef] [Green Version]
- Yeow, K.F.; Teng, H. Characterizing Thermal Runaway of Lithium-ion Cells in a Battery System Using Finite Element Analysis Approach. SAE Int. J. Altern. Powertrains 2013, 2, 179–186. [Google Scholar] [CrossRef]
- Ma, L.; Xia, J.; Xia, X.; Dahn, J.R. The Impact of Vinylene Carbonate, Fluoroethylene Carbonate and Vinyl Ethylene Carbonate Electrolyte Additives on Electrode/Electrolyte Reactivity Studied Using Accelerating Rate Calorimetry. J. Electrochem. Soc. 2014, 161, A1495–A1498. [Google Scholar] [CrossRef]
- Huang, Q.; Liu, L.M.A.; Ma, X.; Li, J.; Wang, J.; Dahn, J.R. The reactivity of charged positive Li1-n[NixMnyCoz]O2 electrodes with electrolyte at elevated temperatures using accelerating rate calorimetry. J. Power Sources 2018, 390, 78–86. [Google Scholar] [CrossRef]
- Ma, L.; Nie, M.; Xia, J.; Dahn, J.R. A systematic study on the reactivity of different grades of charged Li[NixMnyCoz]O2 with electrolyte at elevated temperatures using accelerated rate calorimetry. J. Power Sources 2016, 327, 145–150. [Google Scholar] [CrossRef]
- Zhang, N.; Li, J.; Li, H.; Liu, A.; Huang, Q.; Ma, L.; Li, Y.; Dahn, J.R. Structural, electrochemical, and thermal properties of Ni-rich LiNixMnyCozO2 materials. Chem. Mater. 2018, 30, 8852–8860. [Google Scholar] [CrossRef]
- Patel, D.; Robinson, J.B.; Ball, S.; Brett, D.J.L.; Shearing, P.R. Thermal Runaway of a Li-Ion Battery Studied by Combined ARC and Multi-Length Scale X-ray CT. J. Electrochem. Soc. 2020, 167, 090511. [Google Scholar] [CrossRef]
- Shurtz, R.C. A Thermodynamic Reassessment of Lithium-Ion Battery Cathode Calorimetry. J. Electrochem. Soc. 2020, 167, 140544. [Google Scholar] [CrossRef]
- Wang, Y.; Shu, C. Hazard Characterizations of Liion Batteries: Thermal Runaway Evaluation by Calorimeter Methodology. In Rechargeable Batteries; Zhang, Z., Zhang, S., Eds.; Springer: Cham, Switzerland, 2015; pp. 419–454. [Google Scholar]
- Thermal Hazard Technology. ARC Accelerating Rate Calorimetry. Available online: https://www.thermalhazardtechnology.com/contentfiles/downloads/38.pdf (accessed on 17 October 2021).
- Zhao, W. Thermal Characterization of Lithium-Ion Cells with Positive Electrode Materials LiNixMn0.8-xCo0.2O2 and Their Components. Ph.D. Thesis, Karlsruhe Institute of Technology, Karlsruhe, Germany, 2021; pp. 25–35. [Google Scholar] [CrossRef]
- Zhao, W.; Rohde, M.; Mohsin, I.; Ziebert, C.; Seifert, H. Heat generation in NMC622 coin cells during electrochemical cycling: Separation of reversible and irreversible heat effects. Batteries 2020, 6, 55. [Google Scholar] [CrossRef]
- Chang, W. The state of charge estimating methods for battery: A Review. ISRN Appl. Math. 2013, 2013, 953792. [Google Scholar] [CrossRef]
- Lopez, C.F.; Jeevarajan, J.A.; Mukherjee, P.P. Characterization of Lithium-Ion Battery Thermal Abuse Behavior Using Experimental and Computational Analysis. J. Electrochem. Soc. 2015, 162, A2163–A2173. [Google Scholar] [CrossRef]
- Melcher, A.; Ziebert, C.; Rohde, M.; Seifert, H.J. Modeling and Simulation of the Thermal Runaway Behavior of Cylindrical Li-Ion Cells—Computing of Critical Parameters. Energies 2016, 9, 292. [Google Scholar] [CrossRef] [Green Version]
- Reimers, J.N.; Dahn, J.R. Electrochemical and insitu X-ray-diffraction studies of lithium intercalation in LixCoO2. J. Electrochem. Soc. 1992, 139, 2091–2097. [Google Scholar] [CrossRef]
- Labrini, M.; Saadoune, I.; Almaggoussi, A.; Elhaskouri, J.; Amoros, P. The LiyNi0.2Mn0.2Co0.6O2 electrode materials: A structural and magnetic study. Mat. Res. Bull. 2012, 47, 1004–1009. [Google Scholar] [CrossRef]
- Dahn, J.R.; Fuller, E.W.; Obrovac, M.; von Sacken, U. Thermal-stability of LixCoO2, LiXNiO2 and lambda-MnO2 and consequences for the safety of Li-ion cells. Solid State Ionics 1994, 69, 265–270. [Google Scholar] [CrossRef]
- Sharifi-Asl, S.; Soto, F.A.; Nie, A.; Yuan, Y.; Asayesh-Ardakani, H.; Foroozan, T.; Yurkiv, V.; Song, B.; Mashayek, F.; Klie, R.F.; et al. Facet-Dependent Thermal Instability in LiCoO2. Nano Lett. 2017, 17, 2165–2171. [Google Scholar] [CrossRef]
- Bak, S.-M.; Hu, E.; Zhou, Y.; Yu, X.; Senanayake, S.; Cho, S.-J.; Kim, K.-B.; Chung, K.Y.; Yang, X.-Q.; Nam, K.-W. Structural Changes and Thermal Stability of Charged LiNixMnyCozO2 Cathode Materials Studied by Combined In Situ Time-Resolved XRD and Mass Spectroscopy. ACS Appl. Mater. Interfaces 2014, 6, 22594–22601. [Google Scholar] [CrossRef]
- Sharifi-Asl, S.; Lu, J.; Amine, K.; Shahbazian-Yassar, R. Oxygen Release Degradation in Li-Ion Battery Cathode Materials: Mechanisms and Mitigating Approaches. Adv. Energy Mater. 2019, 9, 1900551. [Google Scholar] [CrossRef]
- Peterson, J.D.; Vyazovkin, S.; Wight, C.A. Kinetics of the Thermal and Thermo-Oxidative Degradation of Polystyrene, Polyethylene and Poly(propylene). Macromol. Chem. Phys. 2001, 202, 775–784. [Google Scholar] [CrossRef]
- Wang, Q.; Sun, J.; Yao, X.; Chen, C. Thermal stability of LiPF6/EC+DEC electrolyte with charged electrodes for lithium ion batteries. Thermochim. Acta 2005, 437, 12–16. [Google Scholar] [CrossRef]
- Wang, Q.; Sun, J.; Yao, X.; Cheng, S.-C. Thermal Behavior of Lithiated Graphite with Electrolyte in Lithium-Ion Batteries. J. Electrochem. Soc. 2006, 153, A274–A329. [Google Scholar] [CrossRef]
- Love, C.T. Thermomechanical analysis and durability of commercial micro-porous polymer Li-ion battery separators. J. Power Sources 2011, 196, 2905–2912. [Google Scholar] [CrossRef]
- Zhuang, G.; Chen, Y.; Ross, P.N. The Reaction of Lithium with Dimethyl Carbonate and Diethyl Carbonate in Ultrahigh Vacuum Studied by X-ray Photoemission Spectroscopy. Langmuir 1999, 15, 1470–1479. [Google Scholar] [CrossRef]
- Wang, Q.; Sun, J.; Chen, X.; Chu, G.; Chen, C. Effects of solvents and salt on the thermal stability of charged LiCoO2. Mater. Res. Bull. 2009, 44, 543–548. [Google Scholar] [CrossRef]
- Wang, Q.; Sun, J.; Chen, C. Effects of solvents and salt on the thermal stability of lithiated graphite used in lithium ion battery. J. Hazard. Mater. 2009, 167, 1209–1214. [Google Scholar] [CrossRef]


Publisher’s Note: MDPI stays neutral with regard to jurisdictional claims in published maps and institutional affiliations. |
© 2022 by the authors. Licensee MDPI, Basel, Switzerland. This article is an open access article distributed under the terms and conditions of the Creative Commons Attribution (CC BY) license (https://creativecommons.org/licenses/by/4.0/).
Share and Cite
Zhao, W.; Rohde, M.; Mohsin, I.U.; Ziebert, C.; Du, Y.; Seifert, H.J. Combined Thermal Runaway Investigation of Coin Cells with an Accelerating Rate Calorimeter and a Tian-Calvet Calorimeter. Batteries 2022, 8, 15. https://doi.org/10.3390/batteries8020015
Zhao W, Rohde M, Mohsin IU, Ziebert C, Du Y, Seifert HJ. Combined Thermal Runaway Investigation of Coin Cells with an Accelerating Rate Calorimeter and a Tian-Calvet Calorimeter. Batteries. 2022; 8(2):15. https://doi.org/10.3390/batteries8020015
Chicago/Turabian StyleZhao, Wenjiao, Magnus Rohde, Ijaz Ul Mohsin, Carlos Ziebert, Yong Du, and Hans J. Seifert. 2022. "Combined Thermal Runaway Investigation of Coin Cells with an Accelerating Rate Calorimeter and a Tian-Calvet Calorimeter" Batteries 8, no. 2: 15. https://doi.org/10.3390/batteries8020015