Article

Comparison of an Experimental Electrolyte Wetting of a Lithium-Ion Battery Anode and Separator by a Lattice Boltzmann Simulation

by
Johannes Wanner
1,* and
Kai Peter Birke
1,2
1
Fraunhofer Institute for Manufacturing Engineering and Automation IPA, Nobelstr. 12, 70569 Stuttgart, Germany
2
Institute for Photovoltaics, Department of Electrical Energy Storage Systems, University of Stuttgart, Pfaffenwaldring 47, 70569 Stuttgart, Germany
*
Author to whom correspondence should be addressed.
Batteries 2022, 8(12), 277; https://doi.org/10.3390/batteries8120277
Submission received: 21 October 2022 / Revised: 1 December 2022 / Accepted: 2 December 2022 / Published: 6 December 2022
(This article belongs to the Special Issue The Precise Battery—towards Digital Twins for Advanced Batteries)

Abstract

:
The filling with electrolyte and the subsequent wetting of the electrodes is a quality-critical and time-intensive process in the manufacturing of lithium-ion batteries. The exact processes involved in the wetting are still under investigation due to their poor accessibility. The accurate replication of the wetting phenomena in porous media can be demonstrated in other research fields by lattice Boltzmann simulations. Therefore, this paper deals with the comparison of experimental wetting and the simulative investigation of the wetting processes of lithium-ion battery materials by a lattice Boltzmann simulation. Particular attention is paid to the interfaces between the battery materials. These effects are relevant for a simulation of the wetting properties at the cell level. The experimental results show a 43% faster wetting of the interface between an anode and a separator than with only an anode. Overall, the simulation results show a qualitatively successful reproduction of the experimental wetting phenomena. In addition, the steps for a more precise simulation and the development of the Digital Twin are shown. This extension enables simulations of the electrolyte wetting phenomena in manufacturing lithium-ion batteries and the quantification of the wetting times.

1. Introduction

A lithium-ion battery cell is a high-demand form of energy storage. The cell manufacturing capacities will therefore be expanded in the coming years. The primary development goals of battery cell manufacturing are to reduce the costs and the resource demand while increasing the cell quality [1]. A process step that has received much attention in the literature is the filling of the dry electrode sheets with electrolyte and the downstream wetting process. This production step is particularly time-intensive and quality-critical [2,3]. The electrolyte filling and the following wetting step aim for the complete wetting of the porous electrode materials and separators with the conducting salt lithium, which is dissolved in a solvent [4]. This is particularly critical in terms of quality, since gas entrapments in the active material’s pores reduce the cell’s performance [5]. Currently, in battery cell manufacturing, an increased amount of expensive electrolyte is added to the cell to ensure complete wetting in the manufacturing process. This leads to an increase in cell weight and a decrease in energy density [5]. In addition, the wetting time after filling is empirically determined in the manufacturing process with high safety margins. Due to the poor accessibility of the phenomena, an inline control of the wetting state is currently not possible [6].
To ensure homogeneous and fast wetting of the electrode sheets, vacuum- and overpressure conditions can be used during electrolyte filling. In addition, material adjustments of the electrodes and electrolyte, as well as specific process temperatures, can be used to influence the wetting conditions [6]. This situation also prevents a precise quantification of process improvements. Various experimental in-situ methods are used in the literature to quantify wetting and to overcome these restrictions. The experimental investigations use electrical methods of impedance spectroscopy to study the degree of wetting at the cell level [7]. Visual methods such as X-ray, neutron radiography, or thermography are available to describe the wetting phenomena macroscopically [6,8,9,10,11]. However, these methods are complex and yield an insufficient temporal and spatial resolution of the wetting processes. Alternatively, wetting balance tests can quantify the wetting on electrodes or separator sheets [12,13]. The wetting balance test reduces the complexity of the wetting to the respective test object and enables a gravimetric or visual examination of the wetting progress in the electrode. The visual measurement enables the quantification of the electrolyte movements on a small scale [14].
In addition to experimental studies, there are several numerical fluid dynamics simulations in the literature, particularly lattice Boltzmann (LBM) simulations, which investigate wetting phenomena at the pore level. The LBM method is often used for fluid simulations in porous media and complex geometries. The multicomponent Shan–Chen pseudopotential method allows the modeling of the fluid–fluid and solid–fluid interaction forces, interfacial tensions and adhesion forces of a wetting phenomenon [15,16,17,18,19]. LBM has already found validated applications in geoscience and fuel cell technology [20,21,22], but just a few authors have used lattice Boltzmann simulations to study the electrolyte transport phenomena in battery materials. Jeon and co-workers, Lee et al. and Mohammadian and Zhang used LBM simulation to study the effects of electrode structural effects on filling on a two-dimensional electrode [23,24,25,26]. Here, the electrode geometries were greatly simplified. Sauter et al. used a binarized three-dimensional microstructure of the separator based on focused-ion-beam scanning electron microscopic tomography data [27]. Lautenschlaeger et al. and Lautenschlaeger et al. used realistic reconstructions of real 3D cathodes, including the binder [28,29]. The separator used was based on binarized CT images. Shin et al., reconstructed PE separators with FIB-SEM tomography image processing [30]. Shodiev et al., additionally, used real tomography data for the cathode and stochastically generated electrodes as semi-realistic microstructures for the anode and the separator [31]. Hagemeister et al. used a multiscale commercial computational fluid dynamics program to study the effect of the process parameters on the filling process [32]. The 3D electrode geometry of the cathode used was reconstructed from the images of a micro CT scan. Most of the literature only simulates the wetting of individual electrode geometries. However, Lautenschlaeger et al., Shin et al., Shodiev et al. and Shodiev et al., also investigate the influence of the interface between the electrodes and the separator [29,30,31,33].
With the help of understanding the process phenomena, additional sensor technology and exact modeling, a Digital Twin of the wetting process can be created to define the individual process times. Therefore, modeling the interface between the battery materials is a subject in the literature [34,35]. However, comparisons of experimental results with simulation results have only just begun to be published in this field [32]. For the transfer to a superordinate process model, further investigations and transfers to a multiscale model are required. In digitized battery cell manufacturing, the process frame conditions and simulation models can be used to estimate the state of battery cell wetting by using a Digital Twin to define the relevant process times. As a basis for this, the experiments investigating cell wetting must be representable by simulations. This could only be insufficiently demonstrated in the literature.
Therefore, this paper shows to what extent the experimental wetting phenomena shown by a visual measurement of the wetting balance test can be compared with an LBM simulation.
The simulation and the experiments are evaluated for their wetting rates. This method is applied to investigate the anode and separator wetting used in lithium-ion batteries. A particular focus of this paper is the description of the interface between the material components of a battery cell.

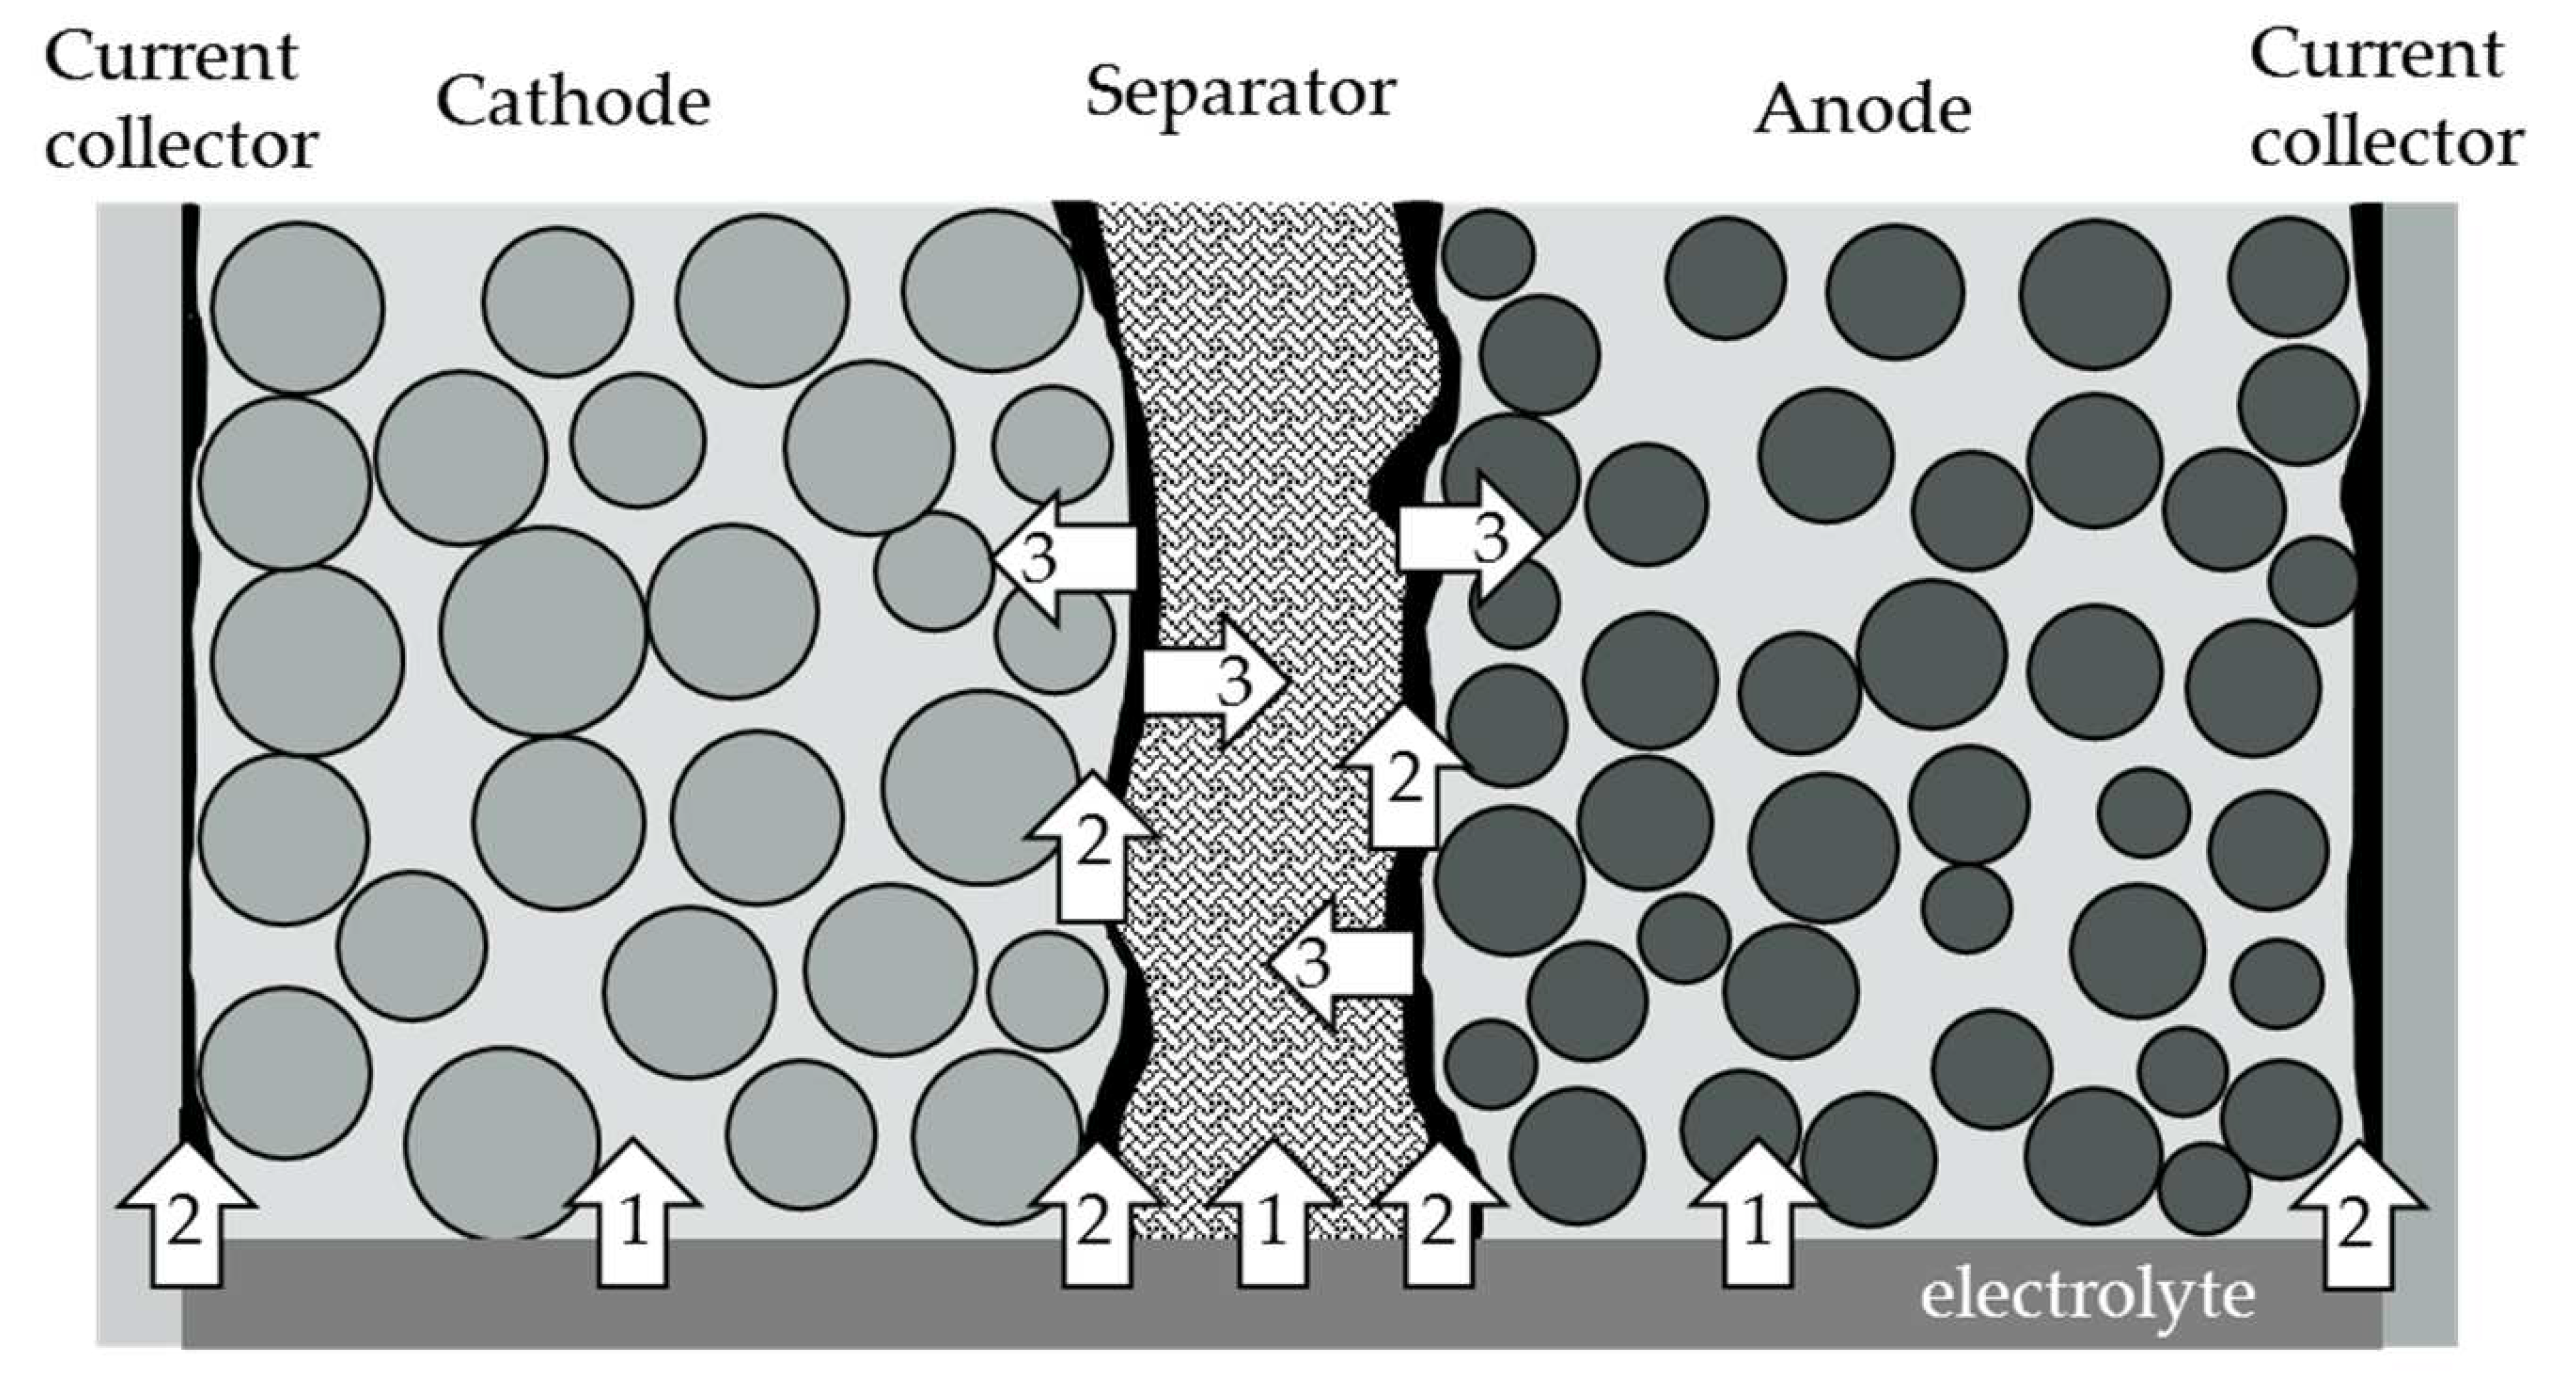
2. Theory of Capillary Wetting

The capillary wetting of porous media can be described by the Lucas–Washburn equation (LWE) [36]. This LWE can be modified to describe the height increase of the infiltrated liquid using a root function. The penetration rate k (mm/s0.5) can be determined by [14]:
h = k · t ,     k = γ 2 η · r e f f · cos θ
where h is the height of the liquid penetration and η is the dynamic viscosity of the liquid. A porous medium with variable pore radii uses a geometry’s effective capillary radius as the macroscopic pore radius distribution reff. γ describes the surface tension between the liquid and the gas and θ is the contact angle of the liquid to the solid. The capillary pressure causing capillary wetting can be described by these variables as follows:
P C = 2 γ · cos θ r e f f
To obtain the flow rate h ˙ t , as an alternative to the wetting rate k, it is necessary to differentiate the height h(t) according to Fries et al. [37]:
h ˙ = γ · r e f f · cos θ 8 η · t
These equations describing wetting can be used both at the cell level and for individual local areas of the cell. Thus, in general, different wetting pathways are described in which the electrolyte penetrates the electrodes and separator sheets of a lithium-ion cell (see also Figure 1):
  • Path 1: Penetration of the electrolyte through the material’s cross-section. This wetting process depends on the contact angle of the materials to the electrolyte and the pore size distribution of the porous material.
  • Path 2: The electrolyte rises at the interface between the electrodes and the separator, or the arrester. This interface depends on the morphology, or surface roughness, between the electrode and the separator or arrester and the compressive force acting on the materials.
  • Path 3: After penetration with path 3, the electrolyte can penetrate laterally into the material.
The Washburn equation assumes a constant capillary radius for wetting under the same general conditions. As shown in Figure 1, the pore radii are very heterogeneous in the porous medium and differ in the described pathways. Therefore, this effective pore radius allows the comparison of different wetting procedures on a macroscopic scale for each pathway in the simulation and the experiment [14].

3. Method

The investigated battery anode materials and separators are used in both experimental and simulative wetting processes. First, the materials are examined with a laser scanning microscope to determine the material properties. The electrolyte properties are taken from the manufacturer’s data sheets and the literature. Then, the experiments and simulations are performed with the materials. For this purpose, the electrodes and separator sheets are wetted with the electrolyte using the wetting balance test in an experimental setup. The wetting process is visually measured by a camera. Downstream data processing is used to evaluate the wetting process over time. The LWE equation can be approximated using the literature values, microscopic examinations and experimental frame conditions. In parallel, a lattice Boltzmann simulation is parameterized with the electrode data and a wetting process is simulated. The wetting parameters are compared with the LWE equation in a downstream simulation evaluation. Thus, a connection between the experiment and the simulation can be established.
With this approach, the following experiments include the wetting of:
  • Graphite anode;
  • Separator;
  • A combined approach of graphite anode and separator.

3.1. Materials

Based on the described wetting processes, battery anode materials and separators are used to investigate wetting on both experimental and simulative levels. For this purpose, the materials are examined with a Keyence VK-9710 (Keyence, Osaka, Japan) laser scanning microscope to determine the material properties.
The microscopy images of the graphite electrode and the separator are shown in Figure 2. The graphite material used was produced and calendered in-house with a coater. The separator “Cellulose Paper (TF44-25)” was provided by NKK Nippon Kodoshi Corp. (Kochi, Japan). The data evaluation with the microscope shows the graphite grains have varying shapes and thicknesses. Through substantial simplifications, the grains can be described as spheres. For simplicity, the spheres are reproduced with a constant radius. Rokhforouz and Amiri attest that the grains’ shape and size considerably influence wetting [39]. Their simplifications result in a lower required capillary pressure during wetting. However, Shodiev et al. put the effect of the material porosity on the wetting in the foreground [31]. In addition, the graphite electrode contains binder material, which is reproduced as amorphous blobs. These binder components are arranged randomly. The separator is a collection of strings. The properties are shown in the following Table 1:
The electrolyte solvent dimethyl carbonate (DMC) from Sigma-Aldrich (St. Louis, MO, USA) is used as electrolyte penetration material. The material properties of contact angle, surface tension γ = 32.01 × 10⁻³ N/m, the dynamic viscosity η = 1.464 × 10⁻³ Pa*s and ρ = 1070 kg/m3 are based on [27,40,41,42,43,44].

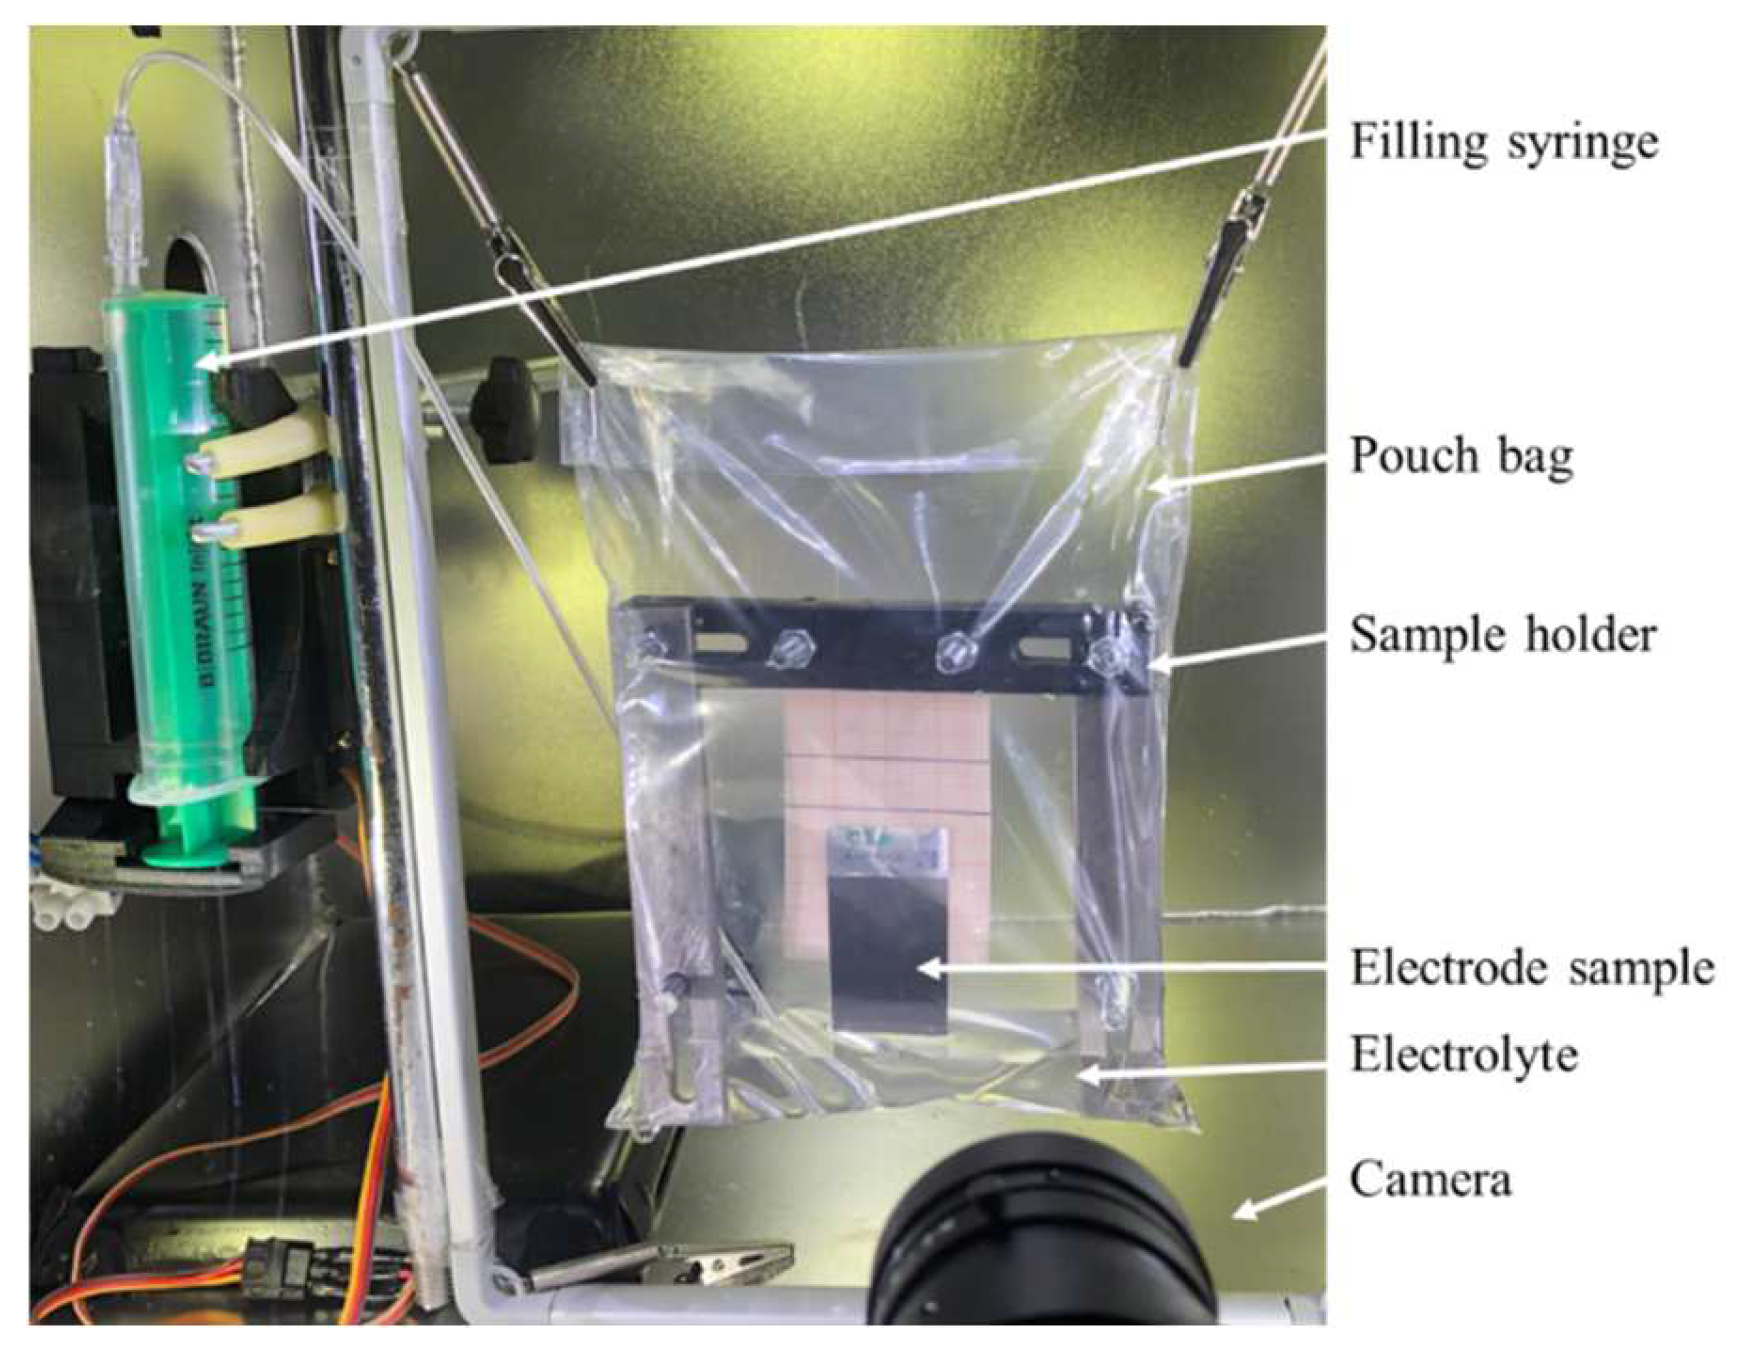
3.2. Experimental Setup

Figure 3 shows the experimental setup. The setup consists of a sample holder and a pouch bag to prevent the evaporation of the electrolyte solvent DMC. The sample is clamped centrally at the top of the sample holder. To avoid disturbing the wetting process, the sample must not touch the pouch bag or the sample holder. The electrolyte solvent DMC is injected into the pouch bag using a syringe to start the wetting process. The syringe is electrically controlled to ensure a defined quantity and a uniform, foam-free and splash-free filling into the pouch bag. An industrial Basler acA2040-25gc camera records the sample with a sampling frequency of two frames per second and a 4 MPixel resolution. The experiments are performed at a constant temperature of 22 °C. In a downstream data analysis, the captured images are cropped to the sample using the python library Pillow, processed in brightness, contrast and gray values to quantify the respective wetting heights.

3.3. Simulation Setup

Based on the material characterization by the laser scanning microscope, the stochastic 3D electrodes and separator geometries are created in python using the porespy library [45]. All simulations are processed with the LBM open source environment Palabos [17]. The exact parameterization of the simulation is described in Appendix A Table A1 and Table A2. For further literature we recommend [16,18,28,46,47]. The data evaluation of the simulation is performed with ParaView and python [48]. The simulation examines the pressure-saturation behavior of the filling process depending on the electrode geometry, the filling time, the gas entrapments and thus the final electrolyte saturation.

3.3.1. Artificial Generation of the Geometry

The 3D geometry of the graphite grains is generated as randomly arranged spheres with a radius of 6.77 × 10⁻⁶ m. The generated spheres can touch each other sporadically. Randomly placed amorphous blobs with an average diameter of 1.45 × 10⁻⁶ m create the impermeable binder material. To simplify the geometry, these binder components are arranged randomly and are not necessarily connected to a graphite grain. The porosity of the total graphite electrode is 50%. The volume fraction of graphite particles is 42.7% and of the binder is 7.3%. When creating the electrodes, the geometry of the binder is overwritten by the geometry of the graphite grains. If a graphite grain and binder are placed at the same point in the geometry, the graphite grain overwrites the binder. Thus, the graphite grains remain intact, but the binder is cut off at contact with the graphite grain. In Figure 2 and in Appendix B Figure A1, Figure A2 and Figure A4, the bonded graphite grains can be seen well, as well as the grains held together by the binder. Of course, due to the random arrangement, there are areas where no bonding is possible. This simplification is accepted in terms of the resulting porosity. The examination area for the electrode is 145.1 × 72.5 × 48.4 × 10−6 m3. The 3D geometry of the separator is a random arrangement of cylinders with a radius of 4.84 × 10⁻⁷ m. The cylinders are not curved and are placed end-to-end in the entire geometry. The porosity is 40%, and the examination area is 145.1 × 72.5 × 24.2 × 10−6 m3 due to the separator thickness of 25 × 10−6 m. The resulting geometry of the separator is comparable to Xu and Bae and to Sauter et al. and is shown in Appendix B Figure A3 [27,49]. An additional geometry is created to investigate the interfacial phenomena between the graphite grains and the arrester. A flat surface with a thickness of 4.84 × 10⁻⁷ m represents the arrester. An additional geometry examines the interfacial phenomena between the graphite grains and the separator. For this purpose, the geometries are added in the z-direction. To focus on the interfacial phenomena, the geometry under consideration is reduced to 145.1 × 72.5 × 24.2 × 10−6 m3 for the anode-separator interface and the anode-arrester interface.

3.3.2. Lattice Boltzmann Simulation Setup

As shown in Figure 4, the geometry is integrated into the lattice Boltzmann environment. The voxel size and the lattice unit (lu) size are 4.84 × 10⁻⁷ m. The wetting is investigated in the y-direction. At the beginning of the simulation, the pores of the geometry are filled with the gas density ρG (and the electrolyte density ρEdis). The geometry components are defined as bounceback into the fluid model. Here the adhesion parameters are Gads,nonwetting effects to the gas and Gads,wetting effects to the electrolyte. For stability, the lattice Boltzmann environment has numerically periodic boundary conditions in the x-direction. This may have some impact on the wetting of the geometry. Pressure boundaries ρE and ρGdis are implemented at the inlet and ρG and ρEdis at the outlet in the y-direction. In addition, a reservoir with a thickness of eight lattice units is attached to the inlet and outlet. These are filled with electrolyte at the inlet and with gas at the outlet. These are necessary for pressurization during the simulation and for the stability of the boundary conditions. Each reservoir is separated from the electrode by an additional membrane with a thickness of one lattice unit to prevent unwanted fluid backflow. The membrane at the inflow is permeable to the electrolyte and at the outflow to the gas. A bounceback condition is implemented for the respective other media. The wetting process takes place through a pressure difference between the two fluid phases with an interfacial tension of the interaction parameter G c , and the time step Δ t [19,31]:
P = 1 3 ρ + ρ d i s + 1 3 G c · ρ · ρ d i s · Δ t 2
Δ P = P I n l e t P O u t l e t
This pressure difference corresponds to the capillary pressure and is stimulated by implementing a force in the x-direction on each lattice cell in the electrolyte reservoir in the simulation. For this purpose, the force is increased every 2000 time steps to achieve a saturation of the geometry. The lattice cell is wetted as soon as the gas density drops to ρG < 1 mu/lu3. The saturation is calculated as the ratio of the number of current gas pores with a density ρG > 1 mu/lu3 and the number of gas pores at the beginning of the simulation. In addition, the size of the gas reservoir is subtracted in each case.
S E = N P o r e t , ρ G > 1 N P o r e , G a s r e s e r v o i r N P o r e t 0 , ρ G > 1 N P o r e , G a s r e s e r v o i r
The simulation evaluation takes place every 500 time steps and lasts until no further saturation occurs. After no further saturation is observed, the gas entrapments can be quantified, and the wetting time is determined.

4. Results

4.1. Experimental Results

The following Figure 5 shows the wetting of the different materials. The wetting front can be quantified by using these images.
Figure 5 shows the course of wetting at t = 100 s. In (a), the wetting state of the graphite electrode, in (b), of the separator and, in (c), of the combined experiment of the overlapping separator and graphite electrode is shown. In this case, the materials were not pressed on but laid over each other. Due to the wetting, the two materials have stuck together. The resulting interface might have larger pores than the actual cell coil or stack. Therefore this is a setup which is different from the actual battery cell. The shown images are not processed and already show a difference in brightness between the non-wetted and wetted material. The wetting front has a nearly straight front in the graphite electrode, while the wetting of the separator has a parabolic shape. Due to the homogenous pore distribution, the wetting should be uniform, as in Figure 5a. The edges of the separator and in particular the slower wetting of the individual materials in the combined approach, lead to a slowed wetting at the edge of the image. The electrode and the separator overlap in the center of Figure 5c. This creates the parabolic shape of the wetting front. In the combined approach, the difference in the wetting rates is noticeable.
The data evaluation is shown in the following Figure 6.
The h-t graph from Figure 6a shows that the combined approach wets the fastest and rises the highest to t = 275 s. The graphite electrode also wets faster and higher than the separator. For the separator, little further wetting is evident after t > 275 s. At t = 980 s, the wetting height is steady at h = 17.2 mm. The graphite electrode wets to a height of 23 mm within 275 s. The combined approach reaches the maximum strip height of h = 42.26 mm within 263 s. The wetting height is shown against the root of time in Figure 6b to determine the wetting rate k. The wetting rate can be determined in the linear range of wetting, as in Kaden et al. and Stange et al., between 10–15 s0.5 [14,50]. The wetting rate is k = 0.496 mm/s0.5 for the separator, k = 1.363 mm/s0.5 for the graphite electrode and k = 1.953 mm/s0.5 for the combined approach. In general, the injection of the electrolyte into the sample causes unwanted electrolyte movements, leading to measurement inaccuracies at the beginning of the experiment. This effect could also be observed in Kaden et al. [14]. After the temporal fading of this effect, a constant height increase between 10 and 15 s0.5 can be observed in all experiments, and thus a good approximation of the wetting rates k can be achieved (r2 > 0.97). The wetting of the graphite is constant over the root of time, as seen in Figure 6b. With the combined approach and the separator, the dynamic wetting processes below <10 s0.5 are neglected by this approximation of the wetting rate k. Therefore, according to Fries et al., the wetting height derivation is shown in Figure 6c,d. Here, a qualitative difference in the wetting rates, especially between the combined approach and the individual electrodes, can be seen. The fit of the experimental points with Equation (3) can be achieved here. However, it is less accurate with r2Graphite = 0.41, r2Separator = 0.24 and r2Combined = 0.7 than with Equation (1).

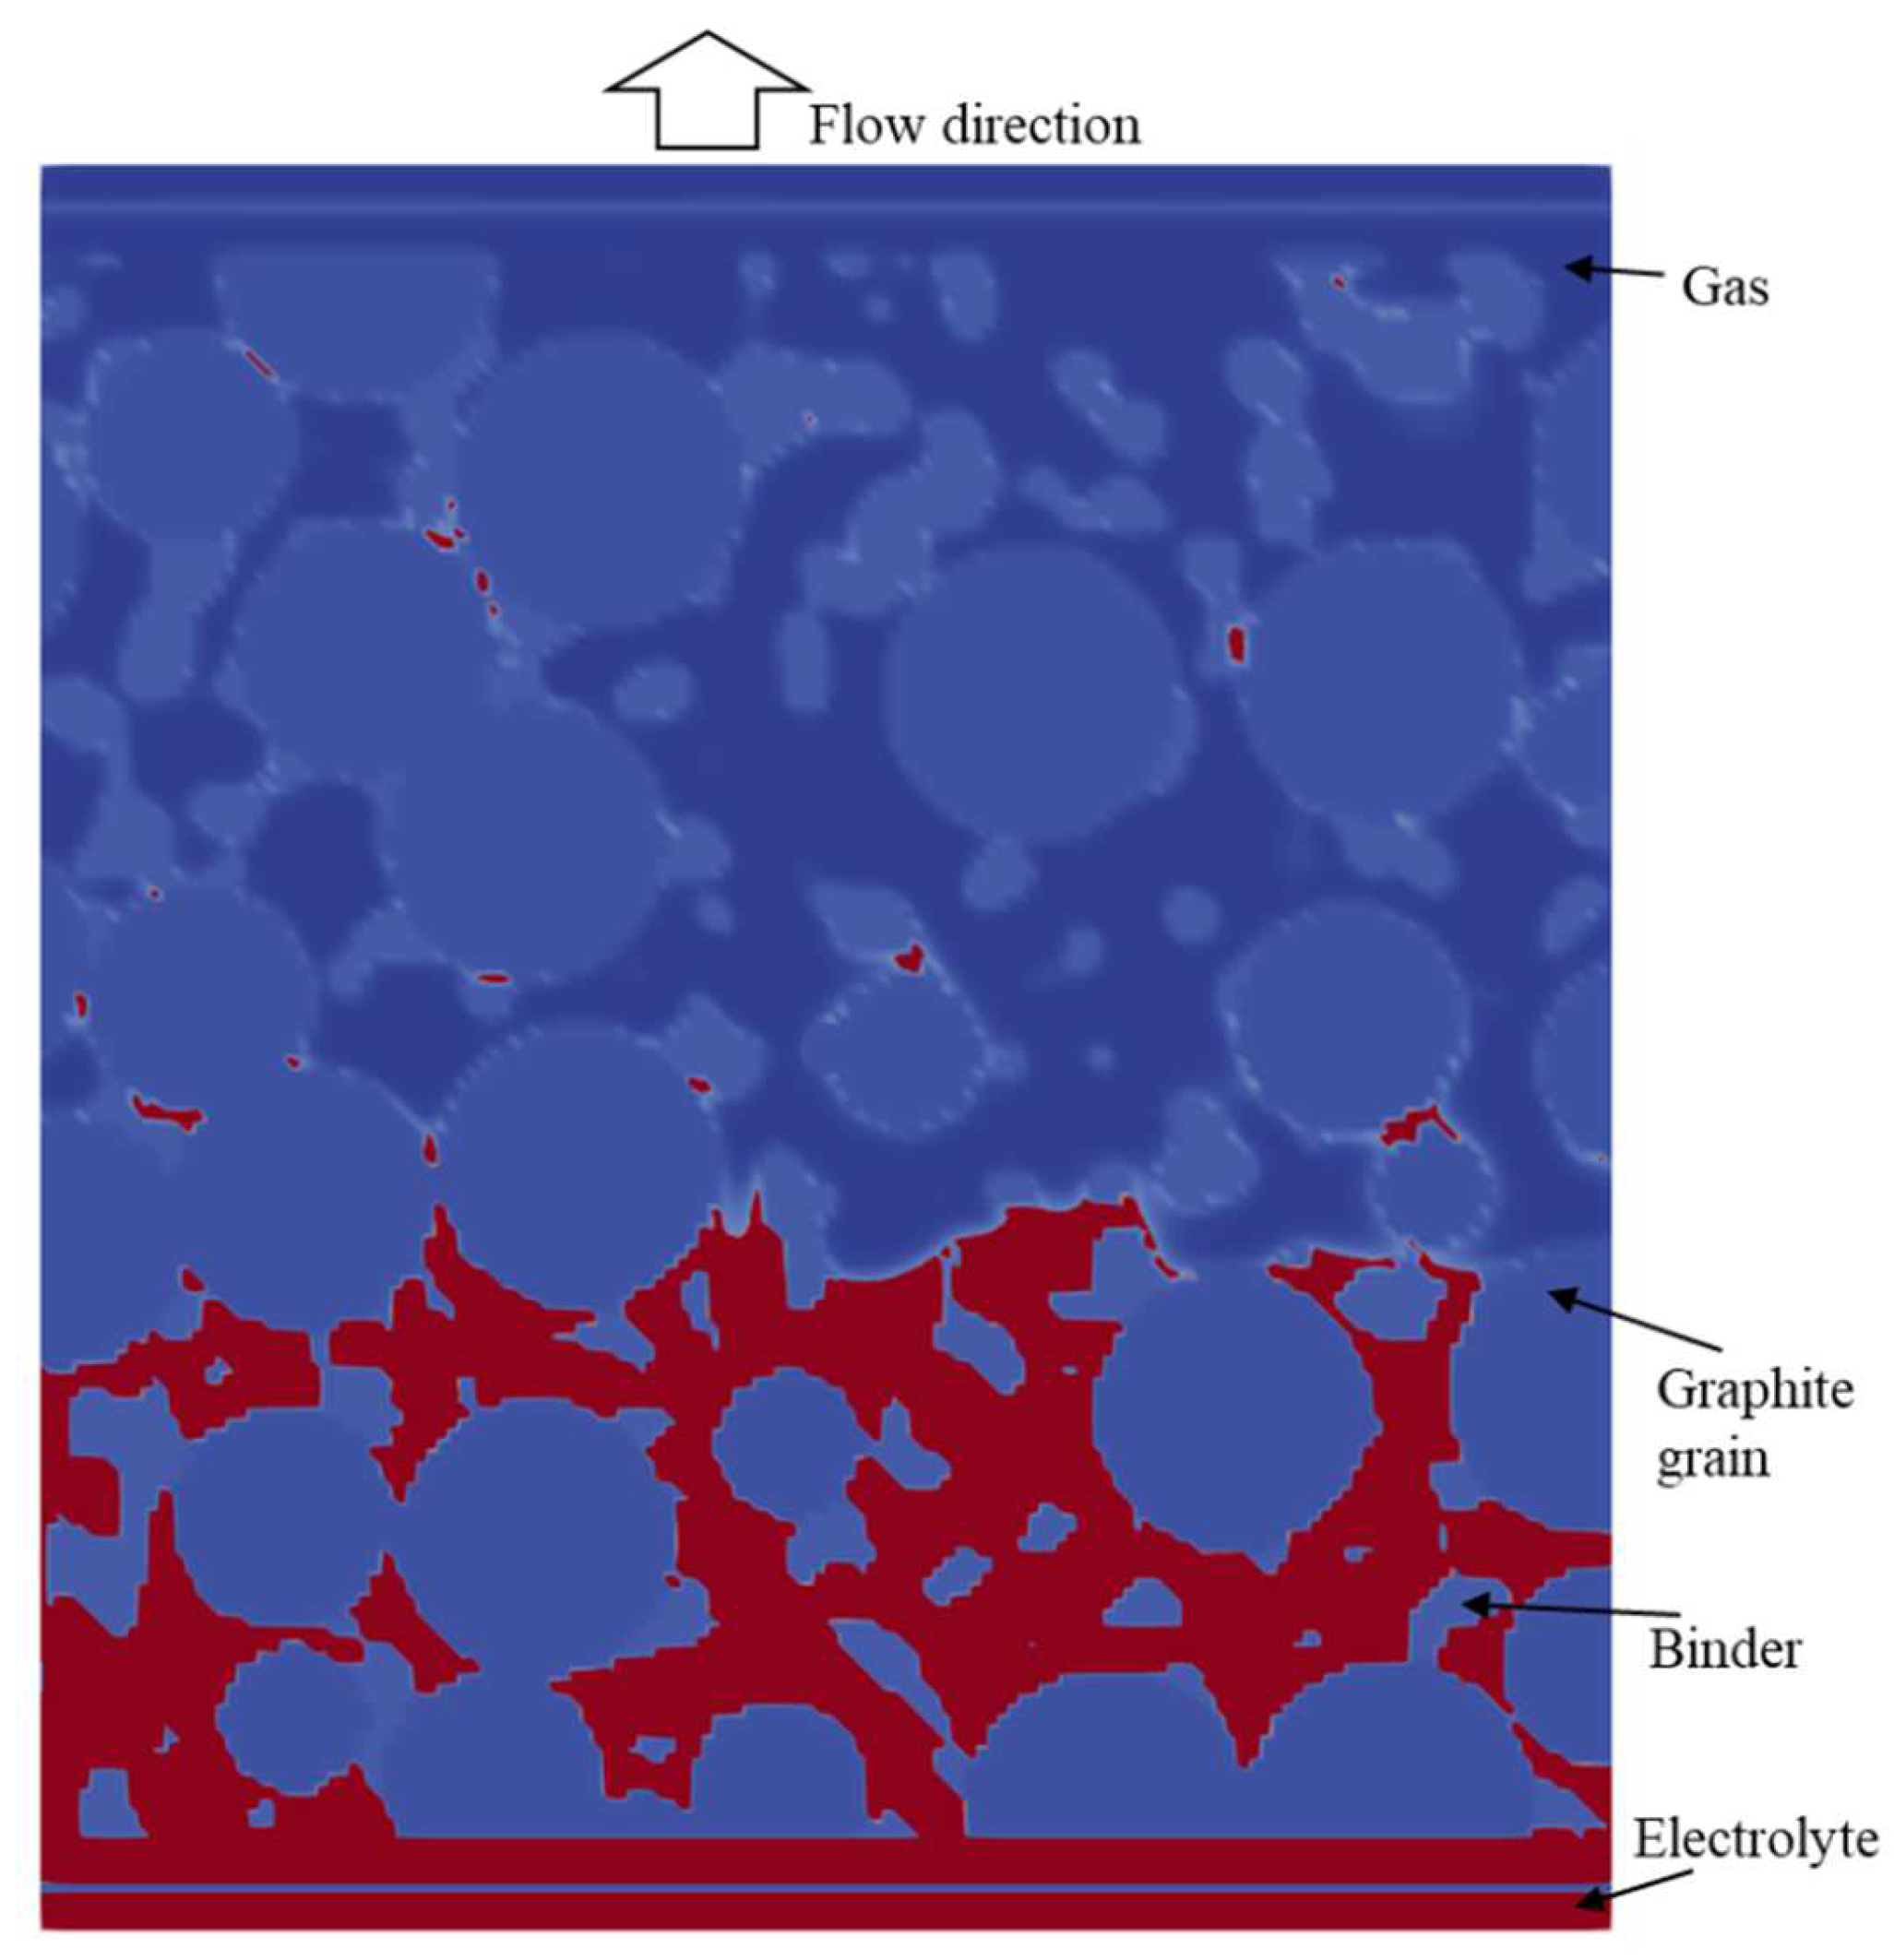
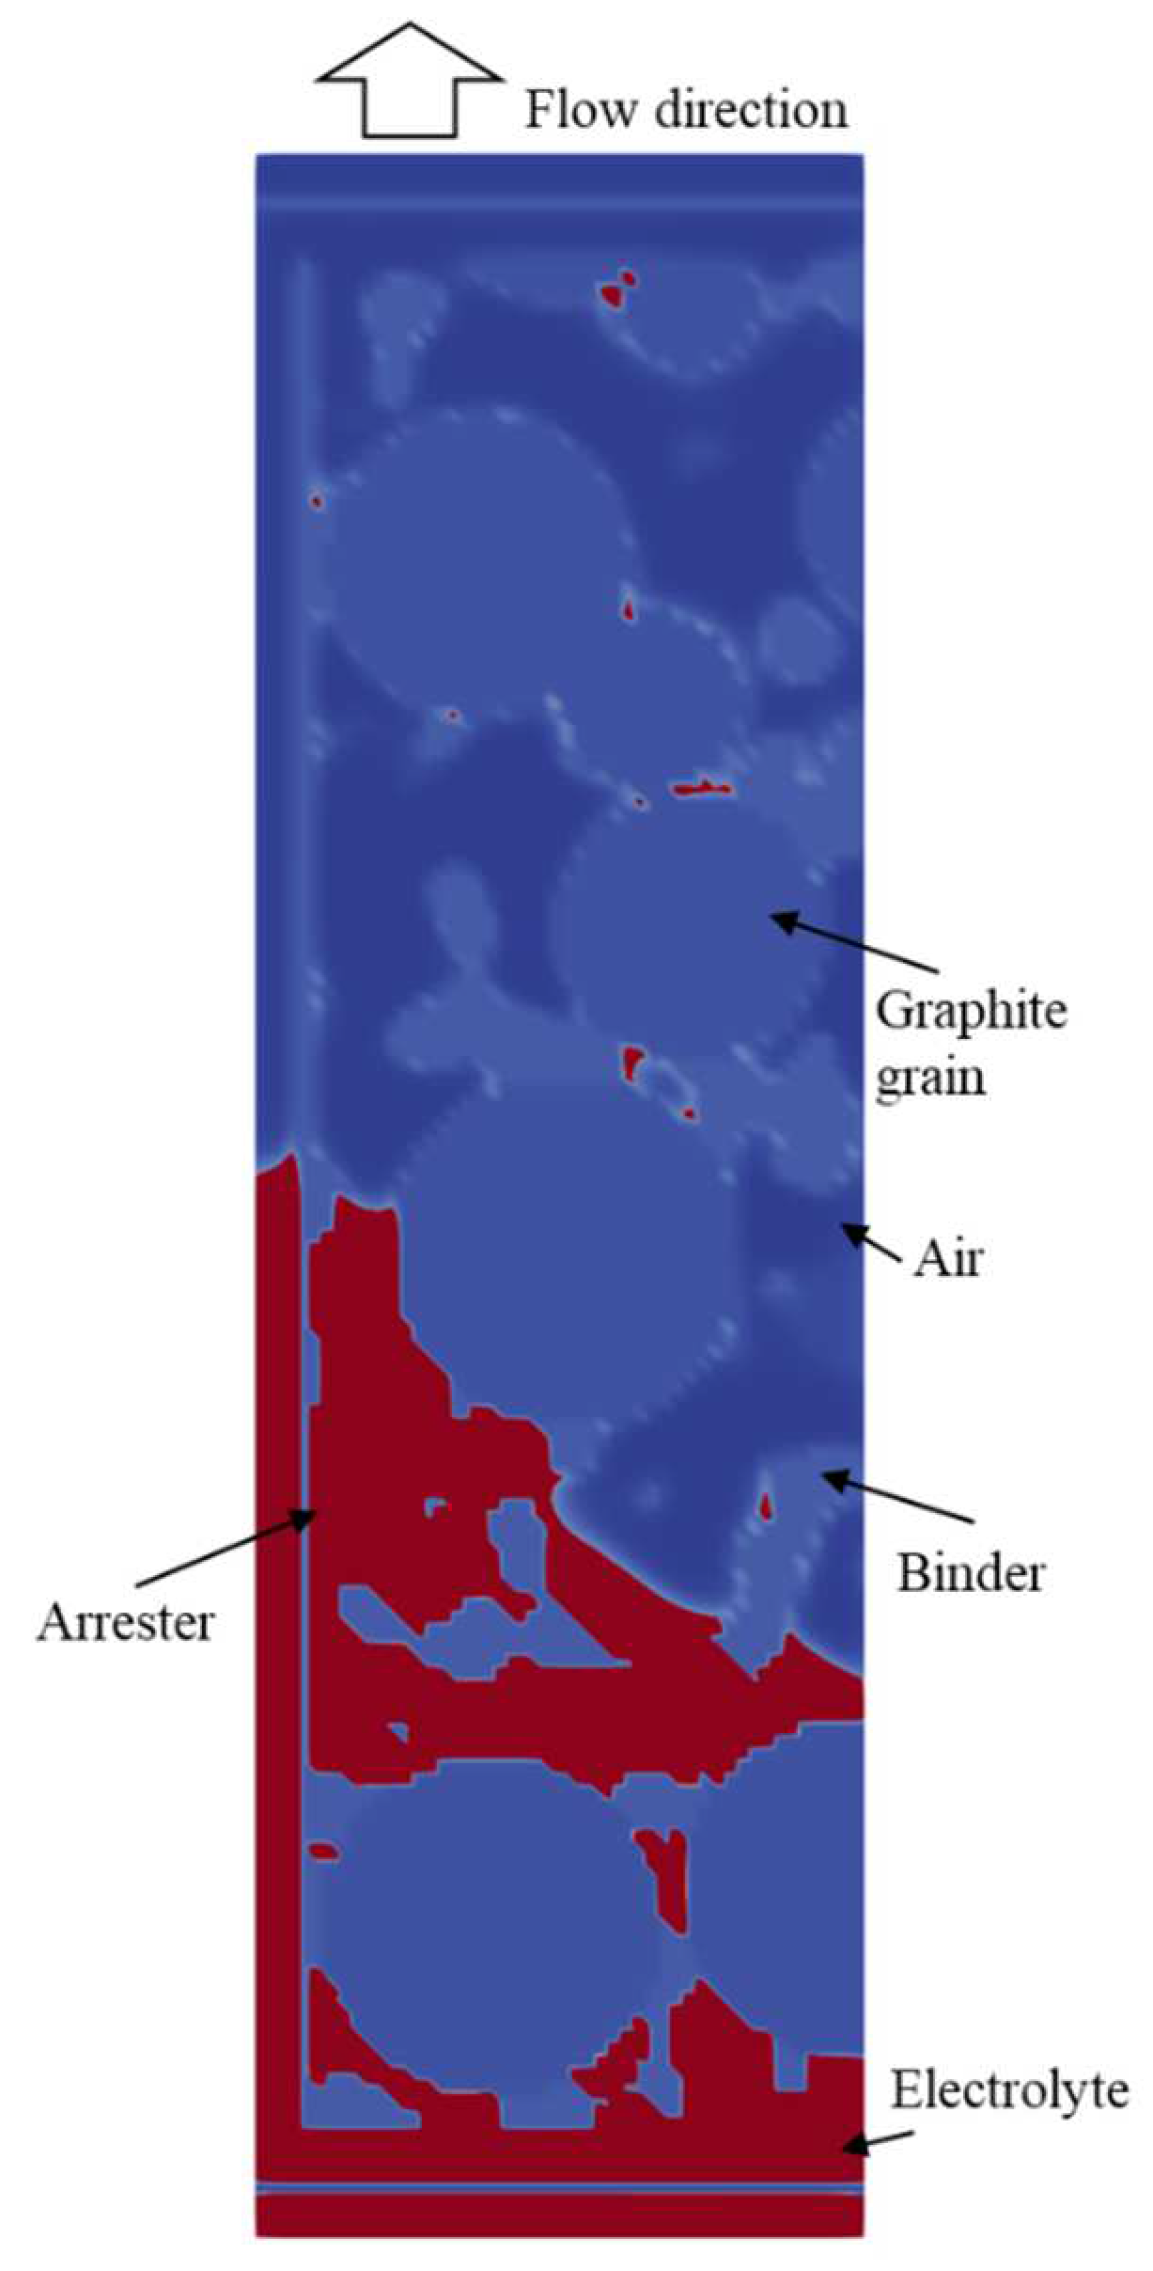
4.2. Simulation Results

In all simulations, the initial wetting occurs even without external force. Every 2000 iterations, the external force is increased by fy = 1.0 × 10⁻⁴ lu ts−2. The increasing external force over the duration of the simulation causes a pressure increase of the electrolyte at the inlet and thus increases the wetting progress. The results of the pressure increase are shown in the following Figure 7.
Figure 7 shows the individual wetting and pressure formations depending on the geometry. At the beginning of the simulation, the initial wetting of the geometry occurs around 14 kPa. At a differential pressure of 19–20 kPa, the saturation of the graphite electrode, the graphite electrode with the arrester and the combined approach increase significantly. Here, a significant increase in wetting is observed at constant pressure. This wetting stagnates at a wetting of about 80%, since the maximum wetting height is reached here. Increasing pressure causes the saturation to rise further from 24 kPa. Here, an escape of the gas entrapments at the edge of the geometry can be observed. Due to the non-periodic boundary conditions, the gas can escape in the z-direction at the appropriate pressure. This effect cannot be observed with gas entrapments wholly enclosed in the geometry. The wetting behavior of the separator deviates strongly and has a stepwise saturation increase with increasing differential pressure. Here, the different pore radii are successively wetted according to Equation (2) at different differential pressures. Due to the discrete pore radii in the geometry, this results in stepwise wetting. Between the steps, a wetting in the x- and z-direction can be observed, slightly increasing the saturation value. With a larger scale geometry, the wetting is expected to behave more linearly in its course. This converges to the maximum saturation of 88.7% with increasing pressure. The saturation between 20 and 80% for the graphite electrode with the arrester and the combined approach occurs at the same differential pressure. In addition, the saturation curve for the graphite electrode is similar to that for the graphite electrode with the arrester. In both cases, there is a wetting increase at the interface between the graphite electrode and the separator or the arrester. Here, unlike the graphite electrode, the geometry of the graphite electrode with the arrester and the combined approach is not cropped at the edges. Still, intact particles are placed at the interface with the arrester and with the separator. However, this calculated difference prevents a direct comparison between the graphite with the arrester, the combined approach and the pure graphite geometry. Thus, a locally increased porosity of the electrode can be seen at this interface. This effect explains the wetting at a lower capillary pressure, about 900 Pa, compared to the graphite electrode. Due to the smaller pores of the separator, the separator acts as a bottleneck in the combined approach, according to Equation (2). If the geometries are considered individually, this is also the case. In the combined approach, a steady electrolyte flow from the interface into the separator can be observed (Appendix B Figure A4). This explains the saturation properties of the combined approach. The graphite and separator geometries reproduce the wetting phenomena according to path 1. The geometry with the arrester and the combined approach represents path 2. The wetting of the separator occurs in the combined approach via the electrolyte flow in the z-direction, coming from the interface (path 3).
For the evaluation of the simulations, the pressure values shown in Figure 7 and the wetting times of the respective geometries are shown in the following Table 2. Analogous to in the experiments, the wetting rate and the wetting flow rate can be calculated according to Equations (1) and (3).
Analogous to the similar pressure values of the simulations of the graphite electrode, the graphite electrode with the arrester and the combined approach, similar wetting times of ~3.9 ms for the saturation of 80% can be evaluated for these simulations. This leads to similar wetting rates of k ~1.17 mm/s0.5 and wetting flow rates of ~18.5 mm/s. It can be seen in all values that the combined approach wets the fastest. The saturation of the separator is different from the other simulations. The longer wetting time leads to a lower wetting rate of 0.501 mm/s0.5 and a wetting flow rate of 3.46 mm/s, which are smaller by a factor of two to seven compared to the other saturation simulations.
After the completion of the simulations, the remaining gas entrapments are 7.3% for the graphite electrode, 5.84% for the graphite electrode with the arrester, 11.3% for the separator and 10.1% for the combined geometry. The gas entrapments are found in each case in the pores, which show no escape possibilities in the z-direction. The gas entrapments of the separator and combined geometry are shown in Appendix B Figure A5 and Figure A6.

5. Discussion

A qualitative correlation of the wetting rates between the simulation and the experiments can be identified. The graphite electrode wets faster than the separator in both. The influence of the wetting of path 2 in combination with other materials is also recognizable. In the simulation, wetting with an arrester is faster than without an arrester, even if only minimally. The combined approach in the simulation has almost the same saturation curve as the graphite electrode with the arrester. Here it can be concluded that wetting between the arrester and the graphite grains accelerates the wetting. Furthermore, the separator geometry in the interface with the graphite grains behaves similarly to an arrester. This effect is not seen in the experiments. Here, a clear wetting difference between the combined approach and the graphite electrode can be seen. The combined experimental approach shows that it is not the graphite electrode that dominates the wetting (see Figure 5c) but the transition between the layers (path 3). To better reproduce this interface effect of the combined approach in the simulation, future simulations must model the surface structures of the separator and the electrode more accurately. Shodiev et al., Lautenschlaeger et al. and Shin et al. also consider the transition between the electrode and the separator. Still, here the wetting is conducted from a perspective rotated by 90° (here the z axis). Therefore, the transfer wetting of the electrode and separator is considered, but not the interfacial phenomena [29,30,31]. In another publication, Shodiev et al. also simulate the combined approach of a separator and an electrode. Here, the wetting by the electrode dominates. As in this paper, Shodiev et al. also combine the individual geometries without further processing of the material transition [33].
Table 3 compares the wetting rates and the calculated effective pore radii of the experiments and the simulation.
The calculated effective pore radii of the experiments according to Equations (1) and (3) are comparable. Since the approximation of Equation (1) is more accurate than that of Equation (2), the deviations of the calculated pore radii can be explained. The wetting rate k of the graphite electrode and the separator from the simulation and the experiments are approximately the same. For the combined approach, a discrepancy is observed. The calculated effective pore radii differ strongly between the simulations and the experiments. Here, a deviation of 10 can be seen in the graphite electrode and by a factor of 100 in the separator, calculating with Equation (2). This deviation from the experiments’ actual pore radii to the simulation can be explained by the adoption of the literature values and the simplification of the generation of the separator and electrode geometries. Additionally, the surface roughness of the individual grains must be considered. Therefore, a revision of the electrode geometry and separator geometry is recommended in future work. In particular, calculating the effective pore radii by Equation (3) in the simulation gives very different and unrealistic results. This is due to the inaccurate calculation of the simulation’s wetting flow rate, which results in wetting rates that are 6–7 times too large. This is mainly due to the very small geometry section and the pressure increase during wetting, which influences the flow rate due to the density change of the electrolyte. Therefore, the calculation of the pore radii according to Equation (2) and not according to Equation (3) is recommended with this simulation setup. To assess the discrepancies of the simulated effective pore radii, Figure 8 shows the pores of the geometries.
The measured pore radii from Figure 8 confirm the graphite electrode’s and the separator’s calculated values according to Equation (2) from the simulation. The literature shows pore radii for comparable separator materials having sizes of between 0.028 and 0.064 µm [9,13]. This corresponds to the experimentally calculated pore radii, but not those from the simulation. According to Beyer et al., the pore radii for graphite anodes are between 0.2 and 0.9 µm [9]. Using a mercury intrusion, Sheng et al. measured effective pore radii ranging from 0.42 to 10.01 µm from variously calendered graphite electrodes [51]. This also corresponds to the experimentally recorded pore radii, but not to the pore radii from the simulation. The deviations of the calculated pore radius of the separator according to Equation (2) from the measured values in the geometry can possibly be explained by the too small geometry of the shapes of the separator strings. The resulting pore sizes of the separator are resolved to be very small. Thus, mainly numerical rather than physical effects are observed. This is also an explanation for the atypical shape of the pressure-saturation curve of the separator in Figure 7. Here, the design of the separator geometry must be revised for future work.
A comparison with the literature reviews the results of simulation and experiments for calculating the wetting rates and effective pore radii. Kaden et al. also wetted a separator using a simultaneous procedure, but with a different electrode and electrolyte. Here, the resulting wetting rate k of 1.363 mm/s0.5 is higher than the wetting rate of k = 0.648 mm/s0.5 presented in [14]. This result is due to a different sample holder. Therefore we achieve a more uniform wetting in this paper than Kaden et al. Here, the effective pore radius cannot be determined using the LWE because of missing information on the materials used. Günter et al. calculated an effective pore radius of 5.6 µm from their experimental wetting of a prismatic cell [6]. Here the LWE is extended and takes the dynamic boundary conditions, especially the effects at the beginning of the wetting, into account.
The determination of the wetting rates in the experimental part is already established in the literature. However, there is limited literature to date for determining the wetting rates from the simulation so as to take into account the 3D-dimensional geometries and the small geometry sections. Lautenschlaeger et al. use a different method to determine the wetting rate. Here, the wetting rate is not given in mm/s0.5 but in ms/% Sat [27,28]. This considers the three-dimensionality of the geometry but does not allow comparability with the experiments. Lautenschlaeger et al. and Lautenschlaeger et al. qualitatively confirm the simulation parameters and the saturation pressure results obtained in this work [28,29]. Davoodabadi et al. and Franken et al. introduce in Equation (2) a geometric capillary coefficient B equal to one for cylindrical pores and less than one for non-cylindrical pores [13,52]. This factor reduces the calculated effective pore radius and can also be used in this work as a correction value for determining the pore radii. For this purpose, this geometric capillary coefficient B must be determined before the experiment. However, the correct determination of the geometric capillary coefficient is not described [13,52].
The qualitative comparison between simulation and experiment has been successful. However, this publication cannot show a quantitative correlation of the pore radii between simulation and experiment. Several steps can be taken to reduce this discrepancy. The porosity of the geometries in the simulation must precisely reflect reality, as the literature shows. Shodiev’s procedure for wetting a cathode confirms this work’s calculated effective pore radii [31]. Shodiev et al. show an inverse-proportional relationship between the simulation duration and the electrode porosity. The electrode’s porosity has a more significant influence on the wetting rate than the size of the pores [31]. Additionally, the surface roughness of the grains must be considered since this greatly influences the wetting rate and the effective pore radius. Also, the considered electrode section significantly influences the determination of the wetting flow rate experimentally and by simulation. Since electrode sections are always considered in micrometer dimension in this simulation and in the literature, an extension into the centimeter dimension is recommended for comparison with the experiments. Since this involves a considerable increase in simulation time and resources, a 2D intermediate step considering porosity, surface roughness and pore sizes is recommended. Also, the constants of the electrolyte properties used in this study, such as the surface tension, contact angle and viscosity, must be made more specific for both the experiments and the simulation. Deviations caused, for example, by temperature must be taken into account. According to Lemmon et al. and Rodriguez et al., even minor temperature differences can enormously change the electrolyte properties [42,43]. In particular, changing the electrolyte properties significantly affects the simulation constants given in Appendix A.

6. Conclusions

The literature shows different approaches to describe the wetting behavior of battery materials through experiments and simulations. This paper shows how these phenomena can combine the two worlds of simulation and experimentation. This is demonstrated in the electrolyte wetting of anodes and separator materials and the combination of both materials by experiments and by simulation. The experimental wetting processes could be approximated by using different modifications of the Lucas–Washburn equation. From this, the wetting rates and the effective pore radii of the materials can be determined. LBM simulations can be used to determine the required capillary pressure for the respective geometry. These results can also be used to determine the wetting rates and effective pore radii per material. In this work, a qualitative correlation between the simulations and the experiments can be shown. In addition to studying the wetting of individual battery materials, this paper also shows the effects of material interfaces in experiments. Thus, a 43.3% faster wetting can be measured experimentally with the combination of a separator and a graphite electrode. Thus, especially a wetting between the material interfaces takes place. A replication of this effect cannot be adequately demonstrated in this work. In particular, a more precise generation of the surface structures for the graphite electrode and the separator is necessary.

Author Contributions

Conceptualization, J.W.; methodology, J.W.; software, J.W.; validation, J.W.; formal analysis, J.W.; resources, J.W.; writing—original draft preparation, J.W.; writing—review and editing, K.P.B.; visualization, J.W.; supervision, K.P.B.; project administration, K.P.B.; funding acquisition, J.W. and K.P.B. All authors have read and agreed to the published version of the manuscript.

Funding

This research was funded by the Federal Ministry of Education and Research (BMBF), funding code 03XP0374C. The authors thank the Federal Ministry of Education and Research, Germany, for funding this work as part of the accompanying research project “DigiBattPro 4.0-BMBF”.

Data Availability Statement

Data available on request from the authors.

Acknowledgments

The authors thank Alexander Kissel for setting up the first experimental setup and for his basic measurements. We also thank Fabian Trost for further improving the experimental setup and integrating the camera settings. In addition, we thank Moira Peter for the dialogue and support in setting up the lattice Boltzmann simulation.

Conflicts of Interest

The authors declare no conflict of interest. The funders had no role in the design of the study; in the collection, analyses, or interpretation of data; in the writing of the manuscript; or in the decision to publish the results.

Appendix A

Model Parametrization

Compared to the capillary or surface forces, the gravitational and viscous forces in porous media of this scale are negligible. Therefore, this LBM simulation does not consider gravitational forces [8,53]. Therefore, the correct parameterization of the density and viscosity ratios between the two components has minor effects on the simulation results [53]. Therefore, the density and viscosity ratio is set to unity to stabilize the multicomponent Shan–Chen method. The adhesion parameters G a d s σ can be calculated according to Huang et al., with the following formula, taking the contact angle between solid and fluid into account [54]:
cos θ = G a d s , n w G a d s , w G i n t e r ρ w ρ n w ,   d i s / 2
The remaining model parameters are shown in the following table and the conversion factors between the lattice and SI units. This parameterization was chosen to represent dimethyl carbonate (DMC) as the electrolyte and air as the gas.
Table A1. Conversion factors between SI units and LBM units (lu = length unit, ts = time step, mu = mass unit).
UnitConversion FactorUnit Conversion Factor
Length C l = 4.84   · 10 7   m lu Time C t = 2.85   · 10 8   s ts
Mass C m = 6.05   · 10 17   kg mu Pressure C P = 1.54   · 10 5   kg m   s 2 mu lu   ts 2
Kinematic viscosity C v = 8.22   · 10 6   m 2 s lu 2 ts Force density C f = 5.96   · 10 8   m s 2 lu ts 2
Dynamic viscosity C d = 4.39   · 10 3   kg m · s mu lu · ts Velocity C u = 1.7   · 10 1   m s lu ts
Surface tension C s = 7.46   · 10 2   kg s 2 mu ts 2
Table A2. Overview of the physical parametrization of the electrolyte (E) and gas (G).
SI UnitsLattice Units
Length l = 4.84   · 10 7   m l = 1   lu
Density ρ E = 1070   kg m 3 ρ E = ρ G = 2   mu lu 3
( ρ d i s E = ρ d i s G = 0.06   mu lu 3 )
ρ G = 1.18   kg m 3 [28]
Kinematic viscosity v E = 1.37 · 10 6   m 2 s v E = 1.667 · 10 1   lu 2 ts
v G = 1.57 · 10 5   m 2 s [28] v G = 1.667 · 10 1   lu 2 ts
Surface tension γ = 3.2 · 10 2   kg s 2 γ = 7.46 · 10 2   mu ts 2
Contact angle G i n t e r E G = G i n t e r G E = 0.9
G a d s , S e p e r a t o r G = G a d s , S e p a r a t o r E = 0.378
G a d s , B i n d e r G = G a d s ,   B i n d e r E = 0.3955
G a d s , G r a p h i t e G = G a d s ,   G r a p h i t e E = 0.2805
Relaxation coefficient τ ˜ E σ = τ ˜ G σ = 1
The dimensionless capillary number and Reynolds number are calculated to classify the simulation. The dynamic viscosity µ = 1.464 · 10 3 kg m · s , the kinematic viscosity v E = 1.37 · 10 6 m 2 s , the measured characteristic fluid velocity uch = 8.26 · 10 3 m s from the simulation, the characteristic length of a pore D = 1.45 · 10 6 m and the surface tension γ = 32.01   · 10 3 kg s 2 :
C a = μ · u c h γ = 3.78 · 10 4   · C d · C u C S = 3.78 · 10 4
R e = u c h · D v = 8.76 · 10 3 · C u · C l C v = 8.76 · 10 3

Appendix B

Figure A1. Wetting of the graphite geometry at iteration 50,000.
Batteries 08 00277 g0a1
Figure A2. Wetting of the graphite geometry with arrester at iteration 50,000.
Batteries 08 00277 g0a2
Figure A3. Wetting of the separator geometry at iteration 100,000.
Batteries 08 00277 g0a3
Figure A4. Wetting of the combined geometry at iteration 50,000.
Batteries 08 00277 g0a4
Figure A5. Wetting of the separator geometry at iteration 200,000 and ΔP = 47 kPa. The gas entrapments in the geometry are shown in red.
Batteries 08 00277 g0a5
Figure A6. Wetting of the combined approach at iteration 166,000 and ΔP = 19.3 kPa. The gas entrapments in the geometry are shown in red.
Batteries 08 00277 g0a6

References

  1. Birke, K.P.; Weeber, M.; Oberle, M. Handbook on Smart Battery Cell Manufacturing: The Power of Digitalization; World Scientific Publishing Co., Pte Ltd.: New Jersey, NJ, USA; London, UK; Singapore; Beijing, China; Shanghai, China; Hong Kong, China; Taipei, Taiwan; Chennai, India; Tokyo, Japan, 2022; ISBN 978-981-12-4561-9. [Google Scholar]
  2. Wanner, J.; Weeber, M.; Birke, K.P.; Sauer, A. Quality Modelling in Battery Cell Manufacturing Using Soft Sensoring and Sensor Fusion—A Review. In Proceedings of the 2019 9th International Electric Drives Production Conference (E|DPC), Esslingen, Germany, 3–4 December 2019; IEEE: Piscataway, NJ, USA, 2019; pp. 1–9, ISBN 978-1-7281-4319-4. [Google Scholar]
  3. Weeber, M.; Wanner, J.; Schlegel, P.; Birke, K.P.; Sauer, A. Methodology for the Simulation based Energy Efficiency Assessment of Battery Cell Manufacturing Systems. Procedia Manuf. 2020, 43, 32–39. [Google Scholar] [CrossRef]
  4. Wanner, J.; Weeber, M.; Birke, K.P.; Sauer, A. Production planning and process optimization of a cell finishing process in battery cell manufacturing. Procedia CIRP 2022, 112, 507–512. [Google Scholar] [CrossRef]
  5. Günter, F.J.; Burgstaller, C.; Konwitschny, F.; Reinhart, G. Influence of the Electrolyte Quantity on Lithium-Ion Cells. J. Electrochem. Soc. 2019, 166, A1709–A1714. [Google Scholar] [CrossRef]
  6. Günter, F.J.; Keilhofer, J.; Rauch, C.; Rössler, S.; Schulz, M.; Braunwarth, W.; Gilles, R.; Daub, R.; Reinhart, G. Influence of pressure and temperature on the electrolyte filling of lithium-ion cells: Experiment, model and method. J. Power Sources 2022, 517, 230668. [Google Scholar] [CrossRef]
  7. Günter, F.J.; Habedank, J.B.; Schreiner, D.; Neuwirth, T.; Gilles, R.; Reinhart, G. Introduction to Electrochemical Impedance Spectroscopy as a Measurement Method for the Wetting Degree of Lithium-Ion Cells. J. Electrochem. Soc. 2018, 165, A3249–A3256. [Google Scholar] [CrossRef] [Green Version]
  8. Weydanz, W.J.; Reisenweber, H.; Gottschalk, A.; Schulz, M.; Knoche, T.; Reinhart, G.; Masuch, M.; Franke, J.; Gilles, R. Visualization of electrolyte filling process and influence of vacuum during filling for hard case prismatic lithium ion cells by neutron imaging to optimize the production process. J. Power Sources 2018, 380, 126–134. [Google Scholar] [CrossRef]
  9. Beyer, S.; Kobsch, O.; Pospiech, D.; Simon, F.; Peter, C.; Nikolowski, K.; Wolter, M.; Voit, B. Influence of surface characteristics on the penetration rate of electrolytes into model cells for lithium ion batteries. J. Adhes. Sci. Technol. 2020, 34, 849–866. [Google Scholar] [CrossRef]
  10. Knoche, T.; Zinth, V.; Schulz, M.; Schnell, J.; Gilles, R.; Reinhart, G. In situ visualization of the electrolyte solvent filling process by neutron radiography. J. Power Sources 2016, 331, 267–276. [Google Scholar] [CrossRef]
  11. Schilling, A.; Wiemers-Meyer, S.; Winkler, V.; Nowak, S.; Hoppe, B.; Heimes, H.H.; Dröder, K.; Winter, M. Influence of Separator Material on Infiltration Rate and Wetting Behavior of Lithium-Ion Batteries. Energy Technol. 2020, 8, 1900078. [Google Scholar] [CrossRef] [Green Version]
  12. Pfleging, W.; Pröll, J. A new approach for rapid electrolyte wetting in tape cast electrodes for lithium-ion batteries. J. Mater. Chem. A 2014, 2, 14918–14926. [Google Scholar] [CrossRef]
  13. Davoodabadi, A.; Li, J.; Liang, Y.; Wood, D.L.; Singler, T.J.; Jin, C. Analysis of electrolyte imbibition through lithium-ion battery electrodes. J. Power Sources 2019, 424, 193–203. [Google Scholar] [CrossRef] [Green Version]
  14. Kaden, N.; Schlüter, N.; Leithoff, R.; Savas, S.; Grundmeier, S.; Dröder, K. Influence of the Lamination Process on the Wetting Behavior and the Wetting Rate of Lithium-Ion Batteries. Processes 2021, 9, 1851. [Google Scholar] [CrossRef]
  15. Chen, L.; Kang, Q.; Mu, Y.; He, Y.-L.; Tao, W.-Q. A critical review of the pseudopotential multiphase lattice Boltzmann model: Methods and applications. Int. J. Heat Mass Transf. 2014, 76, 210–236. [Google Scholar] [CrossRef]
  16. Latt, J.; Courbebaisse, G.; Chopard, B.; Falcone, J.L. Lattice Boltzmann Modeling of Injection Moulding Process. In International Conference on Cellular Automata; Springer: Berlin/Heidelberg, Germany, 2004; pp. 345–354. [Google Scholar]
  17. Latt, J.; Malaspinas, O.; Kontaxakis, D.; Parmigiani, A.; Lagrava, D.; Brogi, F.; Belgacem, M.B.; Thorimbert, Y.; Leclaire, S.; Li, S.; et al. Palabos: Parallel Lattice Boltzmann Solver. Comput. Math. Appl. 2021, 81, 334–350. [Google Scholar] [CrossRef]
  18. Sukop, M.C. Lattice Boltzmann Modeling: An Introduction for Geoscientists and Engineers; Springer: Berlin/Heidelberg, Germany, 2010; ISBN 9783642066252. [Google Scholar]
  19. Shan, X.; Chen, H. Lattice Boltzmann model for simulating flows with multiple phases and components. Phys. Rev. E 1993, 47, 1815–1819. [Google Scholar] [CrossRef] [Green Version]
  20. Tian, Y.; Ju, B.; Chen, X.; Chen, Z.; Dong, Y.; Wu, D. Pore-Scale Investigation of Waterflooding Based on Experiments and Numerical Simulations Considering the Change in Geometry and Wettability. Energy Fuels 2021, 35, 17617–17628. [Google Scholar] [CrossRef]
  21. Sarkezi-Selsky, P.; Schmies, H.; Kube, A.; Latz, A.; Jahnke, T. Lattice Boltzmann simulation of liquid water transport in gas diffusion layers of proton exchange membrane fuel cells: Parametric studies on capillary hysteresis. J. Power Sources 2022, 535, 231381. [Google Scholar] [CrossRef]
  22. García-Salaberri, P.A.; Hwang, G.; Vera, M.; Weber, A.Z.; Gostick, J.T. Effective diffusivity in partially-saturated carbon-fiber gas diffusion layers: Effect of through-plane saturation distribution. Int. J. Heat Mass Transf. 2015, 86, 319–333. [Google Scholar] [CrossRef] [Green Version]
  23. Lee, S.G.; Jeon, D.H.; Kim, B.M.; Kang, J.H.; Kim, C.-J. Lattice Boltzmann Simulation for Electrolyte Transport in Porous Electrode of Lithium Ion Batteries. J. Electrochem. Soc. 2013, 160, H258–H265. [Google Scholar] [CrossRef]
  24. Lee, S.G.; Jeon, D.H. Effect of electrode compression on the wettability of lithium-ion batteries. J. Power Sources 2014, 265, 363–369. [Google Scholar] [CrossRef]
  25. Mohammadian, S.K.; Zhang, Y. Improving wettability and preventing Li-ion batteries from thermal runaway using microchannels. Int. J. Heat Mass Transf. 2018, 118, 911–918. [Google Scholar] [CrossRef]
  26. Jeon, D.H. Wettability in electrodes and its impact on the performance of lithium-ion batteries. Energy Storage Mater. 2019, 18, 139–147. [Google Scholar] [CrossRef]
  27. Sauter, C.; Zahn, R.; Wood, V. Understanding Electrolyte Infilling of Lithium Ion Batteries. J. Electrochem. Soc. 2020, 167, 100546. [Google Scholar] [CrossRef]
  28. Lautenschlaeger, M.P.; Prifling, B.; Kellers, B.; Weinmiller, J.; Danner, T.; Schmidt, V.; Latz, A. Understanding Electrolyte Filling of Lithium-Ion Battery Electrodes on the Pore Scale Using the Lattice Boltzmann Method. Batter. Supercaps 2022, 5, e202200090. [Google Scholar] [CrossRef]
  29. Lautenschlaeger, M.P.; Weinmiller, J.; Kellers, B.; Danner, T.; Latz, A. Homogenized lattice Boltzmann model for simulating multi-phase flows in heterogeneous porous media. Adv. Water Resour. 2022, 170, 104320. [Google Scholar] [CrossRef]
  30. Shin, S.; Kim, H.; Maiyalagan, T.; Chul Yi, S. Sophisticated 3D microstructural reconstruction for numerical analysis of electrolyte imbibition in Li-ion battery separator and anode. Mater. Sci. Eng. B 2022, 284, 115878. [Google Scholar] [CrossRef]
  31. Shodiev, A.; Primo, E.; Arcelus, O.; Chouchane, M.; Osenberg, M.; Hilger, A.; Manke, I.; Li, J.; Franco, A.A. Insight on electrolyte infiltration of lithium ion battery electrodes by means of a new three-dimensional-resolved lattice Boltzmann model. Energy Storage Mater. 2021, 38, 80–92. [Google Scholar] [CrossRef]
  32. Hagemeister, J.; Günter, F.J.; Rinner, T.; Zhu, F.; Papst, A.; Daub, R. Numerical Models of the Electrolyte Filling Process of Lithium-Ion Batteries to Accelerate and Improve the Process and Cell Design. Batteries 2022, 8, 159. [Google Scholar] [CrossRef]
  33. Shodiev, A.; Zanotto, F.M.; Yu, J.; Chouchane, M.; Li, J.; Franco, A.A. Designing electrode architectures to facilitate electrolyte infiltration for lithium-ion batteries. Energy Storage Mater. 2022, 49, 268–277. [Google Scholar] [CrossRef]
  34. Singh, S.; Weeber, M.; Birke, K.P. Implementation of Battery Digital Twin: Approach, Functionalities and Benefits. Batteries 2021, 7, 78. [Google Scholar] [CrossRef]
  35. Knoche, T.; Surek, F.; Reinhart, G. A Process Model for the Electrolyte Filling of Lithium-ion Batteries. Procedia CIRP 2016, 41, 405–410. [Google Scholar] [CrossRef] [Green Version]
  36. Washburn, E.W. The Dynamics of Capillary Flow. Phys. Rev. 1921, 17, 273–283. [Google Scholar] [CrossRef] [Green Version]
  37. Fries, N.; Dreyer, M. An analytic solution of capillary rise restrained by gravity. J. Colloid Interface Sci. 2008, 320, 259–263. [Google Scholar] [CrossRef]
  38. Peter, C.; Nikolowski, K.; Reuber, S.; Wolter, M.; Michaelis, A. Chronoamperometry as an electrochemical in situ approach to investigate the electrolyte wetting process of lithium-ion cells. J. Appl. Electrochem. 2020, 50, 295–309. [Google Scholar] [CrossRef]
  39. Rokhforouz, M.R.; Akhlaghi Amiri, H.A. Effects of grain size and shape distribution on pore-scale numerical simulation of two-phase flow in a heterogeneous porous medium. Adv. Water Resour. 2019, 124, 84–95. [Google Scholar] [CrossRef]
  40. Dahbi, M.; Violleau, D.; Ghamouss, F.; Jacquemin, J.; Tran-Van, F.; Lemordant, D.; Anouti, M. Interfacial Properties of LiTFSI and LiPF 6 -Based Electrolytes in Binary and Ternary Mixtures of Alkylcarbonates on Graphite Electrodes and Celgard Separator. Ind. Eng. Chem. Res. 2012, 51, 5240–5245. [Google Scholar] [CrossRef] [Green Version]
  41. Nguyen, M.H.T.; Oh, E.-S. Improvement of the characteristics of poly(acrylonitrile–butylacrylate) water-dispersed binder for lithium-ion batteries by the addition of acrylic acid and polystyrene seed. J. Electroanal. Chem. 2015, 739, 111–114. [Google Scholar] [CrossRef]
  42. Lemmon, E.W. Thermodynamic Properties of Dimethyl Carbonate. J. Phys. Chem. Ref. Data 2011, 40, 43106. [Google Scholar] [CrossRef]
  43. Rodríguez, A.; Canosa, J.; Domínguez, A.; Tojo, J. Viscosities of Dimethyl Carbonate or Diethyl Carbonate with Alkanes at Four Temperatures. New UNIFAC−VISCO Parameters. J. Chem. Eng. Data 2003, 48, 146–151. [Google Scholar] [CrossRef]
  44. Merck KGaA. 803525 Sigma-Aldrich Dimethylcarbonat: Dimethyl Carbonate for Synthesis. CAS 616-38-6, Chemical Formula (CH3O)2CO. Available online: https://www.merckmillipore.com/DE/de/product/Dimethyl-carbonate (accessed on 1 August 2022).
  45. Gostick, J.; Khan, Z.; Tranter, T.; Kok, M.; Agnaou, M.; Sadeghi, M.; Jervis, R. PoreSpy: A Python Toolkit for Quantitative Analysis of Porous Media Images. J. Open Source Softw. 2019, 4, 1296. [Google Scholar] [CrossRef]
  46. Lu, G.; Wang, X.-D.; Duan, Y.-Y. Study on initial stage of capillary rise dynamics. Colloids Surf. A Physicochem. Eng. Asp. 2013, 433, 95–103. [Google Scholar] [CrossRef]
  47. Krüger, T. The Lattice Boltzmann Method: Principles and Practice; Springer: Cham, Switzerland, 2017; ISBN 9783319446493. [Google Scholar]
  48. Hansen, C.D.; Johnson, C.R. The Visualization Handbook, 1st ed.; Elsevier-Butterworth Heinemann: Amsterdam, The Netherlands; Boston, MA, USA, 2005; ISBN 012387582X. [Google Scholar]
  49. Xu, H.; Bae, C. Stochastic 3D microstructure reconstruction and mechanical modeling of anisotropic battery separators. J. Power Sources 2019, 430, 67–73. [Google Scholar] [CrossRef]
  50. Stange, M.; Dreyer, M.E.; Rath, H.J. Capillary driven flow in circular cylindrical tubes. Phys. Fluids 2003, 15, 2587–2601. [Google Scholar] [CrossRef]
  51. Sheng, Y.; Fell, C.R.; Son, Y.K.; Metz, B.M.; Jiang, J.; Church, B.C. Effect of Calendering on Electrode Wettability in Lithium-Ion Batteries. Front. Energy Res. 2014, 2, 56. [Google Scholar] [CrossRef] [Green Version]
  52. Franken, A.; Nolten, J.; Mulder, M.; Bargeman, D.; Smolders, C.A. Wetting criteria for the applicability of membrane distillation. J. Membr. Sci. 1987, 33, 315–328. [Google Scholar] [CrossRef] [Green Version]
  53. Landry, C.J.; Karpyn, Z.T.; Ayala, O. Relative permeability of homogenous-wet and mixed-wet porous media as determined by pore-scale lattice Boltzmann modeling. Water Resour. Res. 2014, 50, 3672–3689. [Google Scholar] [CrossRef] [Green Version]
  54. Huang, H.; Thorne, D.T.; Schaap, M.G.; Sukop, M.C. Proposed approximation for contact angles in Shan-and-Chen-type multicomponent multiphase lattice Boltzmann models. Phys. Rev. E 2007, 76, 66701. [Google Scholar] [CrossRef]
Figure 1. Schematic representation of the different wetting paths in a lithium-ion battery cell. The electrolyte penetrates through the material cross-section (path 1) or by rising at the interface between the electrodes and the separator or arrester (path 2). Subsequently, the electrolyte penetrates laterally into the material (path 3). Based on [38].
Batteries 08 00277 g001
Figure 2. Microscopy images of the graphite electrode used (a) and the separator (b).
Batteries 08 00277 g002
Figure 3. The experimental setup consists of an electrode sample, a sample holder, a pouch bag and a syringe for filling the electrolyte. A camera records the wetting progress of the materials.
Batteries 08 00277 g003
Figure 4. The simulation setup: The electrode consists of active material (light blue), in this case graphite. The pore space is filled with gas at the beginning and shown here in dark blue. The electrolyte reservoir is marked in red. During the simulation, a force is applied in the y-direction for wetting.
Batteries 08 00277 g004
Figure 5. Wetting state of the different experiments at t = 100 s. In (a), the wetting of the graphite electrode is shown, in (b) the separator experiment and in (c) the combined approach of overlapping separator and graphite electrode. Here, the separator rests on the graphite electrode. No external force was applied to press the two materials together. The experiments’ raw and processed binary images overlap in all figures. The corresponding wetting height is shown with the white line.
Batteries 08 00277 g005
Figure 6. The wetting height of the experiments is plotted in (a) versus time, in (b) versus the square root of time and in (c) derived versus time. In (d), the relevant area from (c) is shown as zoom. In (b), the fit of Equation (1) is shown in bold between 10 and 15 s0.5. In (c), the fit of Equation (3) is shown with a solid line.
Batteries 08 00277 g006
Figure 7. Result of the simulation as the saturation degree of the electrolyte over the differential pressure per simulated geometry.
Batteries 08 00277 g007
Figure 8. Cross-sections of the geometries and the determination of the actual pore sizes of the simulation. The pore sizes shown are in lu. The cross-section of the graphite electrode is shown in (a) and the separator in (b). The measured pore sizes can be calculated into effective pore radii reff = 1.02 to 2.59 µm for the graphite electrode and reff = 0.46 to 1.5 µm for the separator.
Batteries 08 00277 g008
Table 1. Properties of the electrode and separator used in this study.
AnodeSeparator
Thickness12 × 10−5 m
50%
25 × 10−6 m
Porosity40%
MaterialGraphite on AluminumBinderCellulose paper
Average grain
diameter
13.5 × 10⁻⁶ m1.45 × 10−6 m9.7 × 10−7 m
Contact angle25° [40]50° [41]30° [27,30]
Table 2. Simulation results of each simulation run.
Simulation RunΔP
@80% Sat.
Wetting Time
@80% Sat.
Wetting Rate
k
Wetting Flow Rate
Graphite electrode20.2 kPa3.92 ms1.16 mm/s0.518.5 mm/s
Graphite with arrester19.3 kPa3.87 ms1.17 mm/s0.518.7 mm/s
Separator49.2 kPa20.9 ms0.501 mm/s0.53.46 mm/s
Combined geometry19.3 kPa3.83 ms1.17 mm/s0.518.9 mm/s
Table 3. Comparison between experimental and simulation results.
Graphite ElectrodeSeparatorCombined
Approach
ExperimentalWetting rate k1.363 mm/s0.50.496 mm/s0.51.953 mm/s0.5
reff (Equation (1))0.187 µm0.026 µm0.385 µm
reff (Equation (3))0.233 µm0.085 µm0.371 µm
SimulatedWetting rate k1.16 mm/s0.50.501 mm/s0.51.17 mm/s0.5
reff (Equation (2)) @80% Sat2.88 µm1.13 µm3 µm
Wetting flow rate h ˙ 18.5 mm/s3.46 mm/s18.9 mm/s
reff (Equation (3))141.6 µm5.07 µm151.5 µm
GeometryMeasured reff1.02 to 2.59 µm0.46 to 1.5 µm
Publisher’s Note: MDPI stays neutral with regard to jurisdictional claims in published maps and institutional affiliations.

