1. Introduction
Lithium-ion technology is a key technology for storing electrical energy and thus for the energy transition, electromobility and numerous mobile devices [
1]. Lithium has the lowest reduction potential, it is the third lightest element and it has one of the smallest ionic radii of single charged ions [
2]. Thus, high energy densities can be achieved with this technology and a comparatively high nominal voltage can be reached. Furthermore, lithium ion cells have a low self-discharge rate, a high efficiency and no memory effect. Certain properties can also be optimized by varying the cell chemistry, composition and design.
The topic of charging plays a major role, especially as so-called “fast charging” becomes more and more important because a reduction in charging time contributes to the acceptance and user-friendliness of lithium-ion systems [
3]. However, accelerated charging can lead to an accelerated capacity and power fade [
4] and thus have a negative impact on its costs as well as on the ecological footprint. Today, lithium-ion cells are usually charged in a two-stage process: first with constant current (CC) until the maximum charging voltage is reached and then with constant voltage (CV) until the charge current reaches a low, defined value [
5] or until the defined, maximum charging time is reached. The utilization of the capacity depends mainly on the selection of the maximum charging voltage and the defined minimal current value of the CV section. The charging time depends mainly on the constant charging current. The constant current and the maximum charge voltage must be selected in such a way that no lithium plating and no decomposition of the electrolyte occurs [
6]. The rate-determining step of the charging process is the diffusion of the lithium-ions into the negative electrode [
7]. Therefore, high charging currents can lead to an accumulation of the lithium-ions on the surface of the negative electrode, resulting in concentration polarization. Lithium plating is likely to occur and the defined maximum voltage is reached faster, often resulting in the capacity not being fully utilized. Fill et al. [
8] show that with increasing current, the lithium gradients in the electrode particles and among electrode thickness increase, resulting in significantly increased lithium plating close to the separator. Therefore, acceleration of the CC part can lead to capacity loss and also to an extended duration of the CV part [
9,
10]. Furthermore, lithium plating can lead to safety issues due to the growths of dendrites which may pierce the separator and cause an internal short circuit [
11]. In case of Li-ion the impact of extreme charging should be counterbalanced by a strategy of preventing Li-plating. This is a function of the temperature and C-rate as well as state of health (SOH) and can be implemented in the BMS (Battery Management System). In case of pulse charging the strategy is to keep the pulses short so that lithium can be sufficiently intercalated before causing damage. Extreme self-discharge is usually limited by diffusion processes. However, if the root cause is a defect separator then only other safety measures such as choice of the electrolyte and cathodes such as LFP (lithium iron phosphate) can compensate.
Charging strategies can be extremely important in case of a serial connection of cells. This is highly important as the performance of Li-ion batteries tends to change when they are connected in series/parallel topologies, across a BMS (Battery Management System). Usually there is a voltage border where balancing starts, e.g., 50 mV. This voltage must be considered if a charge strategy is applied to a battery. One has to multiply the 50 mV with all cells in serial connection and to switch to the constant voltage charge mode once the reduced limit of overall voltage is approached.
In addition to lithium plating as one of the main components, there are different aging mechanisms that are partly dependent on each other that also result in capacity and power fade, such as the growth of the solid electrolyte interface (SEI), the decomposition of SEI, structural disordering, loss of electronic contact or electrode particle cracking [
12,
13,
14]. So, the maximum appropriated charging current depends on many factors associated with the chemistry and composition of a lithium-ion cell. The so-called high-power cells can basically be discharged and also charged with higher currents than the so-called high-energy cells. However, even within those categories, the properties of the cells, their chemistry and their cell design vary. Even cells with very similar specifications can show a different charging current capability. So, in order to predict the effects of different charging currents on different cells and their aging behavior, cycle tests are essential. There are different studies performing cycle life tests, whereby the CC CV charging nowadays is often used as a reference for the development of innovative charging procedures and often only one charging C-rate and one cell type is investigated, e.g., in [
15,
16]. In [
6] different charging protocols with different charging currents are analyzed and compared at 3 different cells, whereby the CC CV charging with different parameters is also taken into account. Other studies analyze the influence of CC CV charging at different temperatures [
17], whereby [
18] also examines different charging C-rates. In [
19] the different current capabilities at different temperatures for different cell types are investigated, but cycle test is only performed with one charging protocol. In [
20] high charging C-rates up to 8 C are analyzed. Other cycle life studies are model based, such as [
21]. Preger et al. [
22] focuses on other parameters including a variance of discharge currents, temperature and depth of discharge. All results show an accelerated decrease in the state of health (SOH) with increasing constant charge current and the different behavior of the investigated cells, if more than one cell type is analyzed. In [
23] cycle tests are performed with LiNi
0.8Co
0.15Al
0.05O
2 (NCA) and LiFePO
4 (LFP) cells with grid and electric vehicle duty cycle combination, also showing the different behavior of the different cell chemistries.
This study provides a comprehensive view on the CC CV charging method, which still can be seen as the standard charging procedure. Further, it gives information about how the increase in a constant charging current, still recommended by the manufacturers, influences the aging behavior of modern commercially available cylindrical cells of type 18650 and 21700. Both so-called high-power and high-energy cells are part of the investigation. It is clear that an increase in the charging current leads to accelerated aging, but how much different currents affect different cells seems to be very individual. Even cells with similar specification and design behave completely different by increasing the charging current. How the individual cells behave must be considered for the development of optimized charging protocols as well as for the development of digital twins. Besides the degradation of SOH during the cycle test, the charging times and temperatures are determined. Furthermore, this study gives interesting information about the role of the CC and the CV part. The dispersion of cells are also considered and show how important cycle life tests are to determine if cells are suitable for the desired amount of cycles under the defined conditions. For all investigated parameters, the exact shape of the curves are represented.
2. Materials and Methods
In this work, different charge currents are applied to various commercially available lithium-ion cylindrical cells from different manufacturers. Therefore, cycle tests are performed. Both the so-called high-energy and high-power cells are tested. High-energy cells are cells with a high capacity. High-power cells are optimized in terms of their current capability and power output. For the investigations, it is important to have cells with different cathode compositions. The composition of the anode is similar for the current commercially available cylindrical cells and consists of graphite with a small amount of silicon. The cells listed below are part of the study. These are cylindrical cells with 18650 format as well as 21700 format. Cells with the 18650 format have a length of 65 mm and a diameter of 18 mm. Cells with the 21700 format have a length of 70 mm and a diameter of 21 mm. Due to the larger format, higher capacities and power can be achieved. At the high energy cells, the Samsung 50E (Samsung, Suwon, Republic of Korea), Samsung 35E and LG M50T are investigated. The Samsung 50E as well as the LG M50T are cylindrical cells with 21700 format. They have a similar rated capacity of 4.9 and 4.85 Ah. The Samsung 35E has a 18650 format and a rated capacity of 3.4 Ah. At the high power cells, the Samsung 25R and the Sony VTC5A are investigated. Both cells have 18650 format and the same rated capacity of 2.5 Ah. The
Table 1 and
Table 2 give an overview of the structure and composition of the cells as reported in the literature [
24,
25,
26,
27,
28]. The tables were not created based on our own cell disassembling and analyses. It must be noted that the analysis in the literature refers to the LG M50, while in this work we worked with the M50T.
A great difference can be seen for the areal capacities and the thickness of the cathodes. The cathodes of the high power cells have a significantly lower areal capacity and thinner cathodes than the high-energy cells, which was to be expected. Even for the high-energy cells, the areas of the cathodes and their areal capacities differ. You could directly compare the LG M50 and the Samsung 50E, since both types are cells with the 21700 format and both have a comparable rated capacity. The cathode is thicker at the LG M50 than at the Samsung 50E and also the areal capacity of the M50 is higher. At the high-power cells, the area loadings are similar, but the electrodes of the Sony VTC5A are a little bit thicker and therefore slightly smaller in area.
The cathodes of the high-energy cells 50E and 35E consist of a Lithium-Nickel-Cobalt-Aluminium-Oxide (NCA) composition. For the Samsung 35E, [
25] indicates Li(Ni
0.78Co
0.20Al
0.02)O
2, while in [
28] the composition of the cathode is assumed to be Li(Ni
0.87Co
0.11Al
0.02)O
2. The cathode of the Samsung 50E is assumed to be Li(Ni
0.80Co
0.15Al
0.05)O
2 [
28]. The cathode of the LG M50 consists of a Lithium-Nickel-Manganese-Cobalt-Oxide (NMC) 811 composition and [
27] assumes that it is aluminium-doped Li(Ni
0.80Co
0.08Mn
0.08Al
0.04)O
2, while [
28] ascertains that the composition is Li(Ni
0.84Co
0.10Mn
0.06)O
2. The cathode of the LG M50 is thicker than the cathode of the Samsung 50E and also their areal capacity is larger. At the high power cells, the Sony VTC5A has a NCA cathode with the composition of Li(Ni
0.80Co
0.15Al
0.05)O
2 and the Samsung 25R has a NMC cathode. In [
24] it is assumed that the composition of the Samsung 25R cathode is mixed NCA/NMC 622. The anode of each cell consists of graphite and silicon.
4. Results and Discussion
4.1. Cycle Life
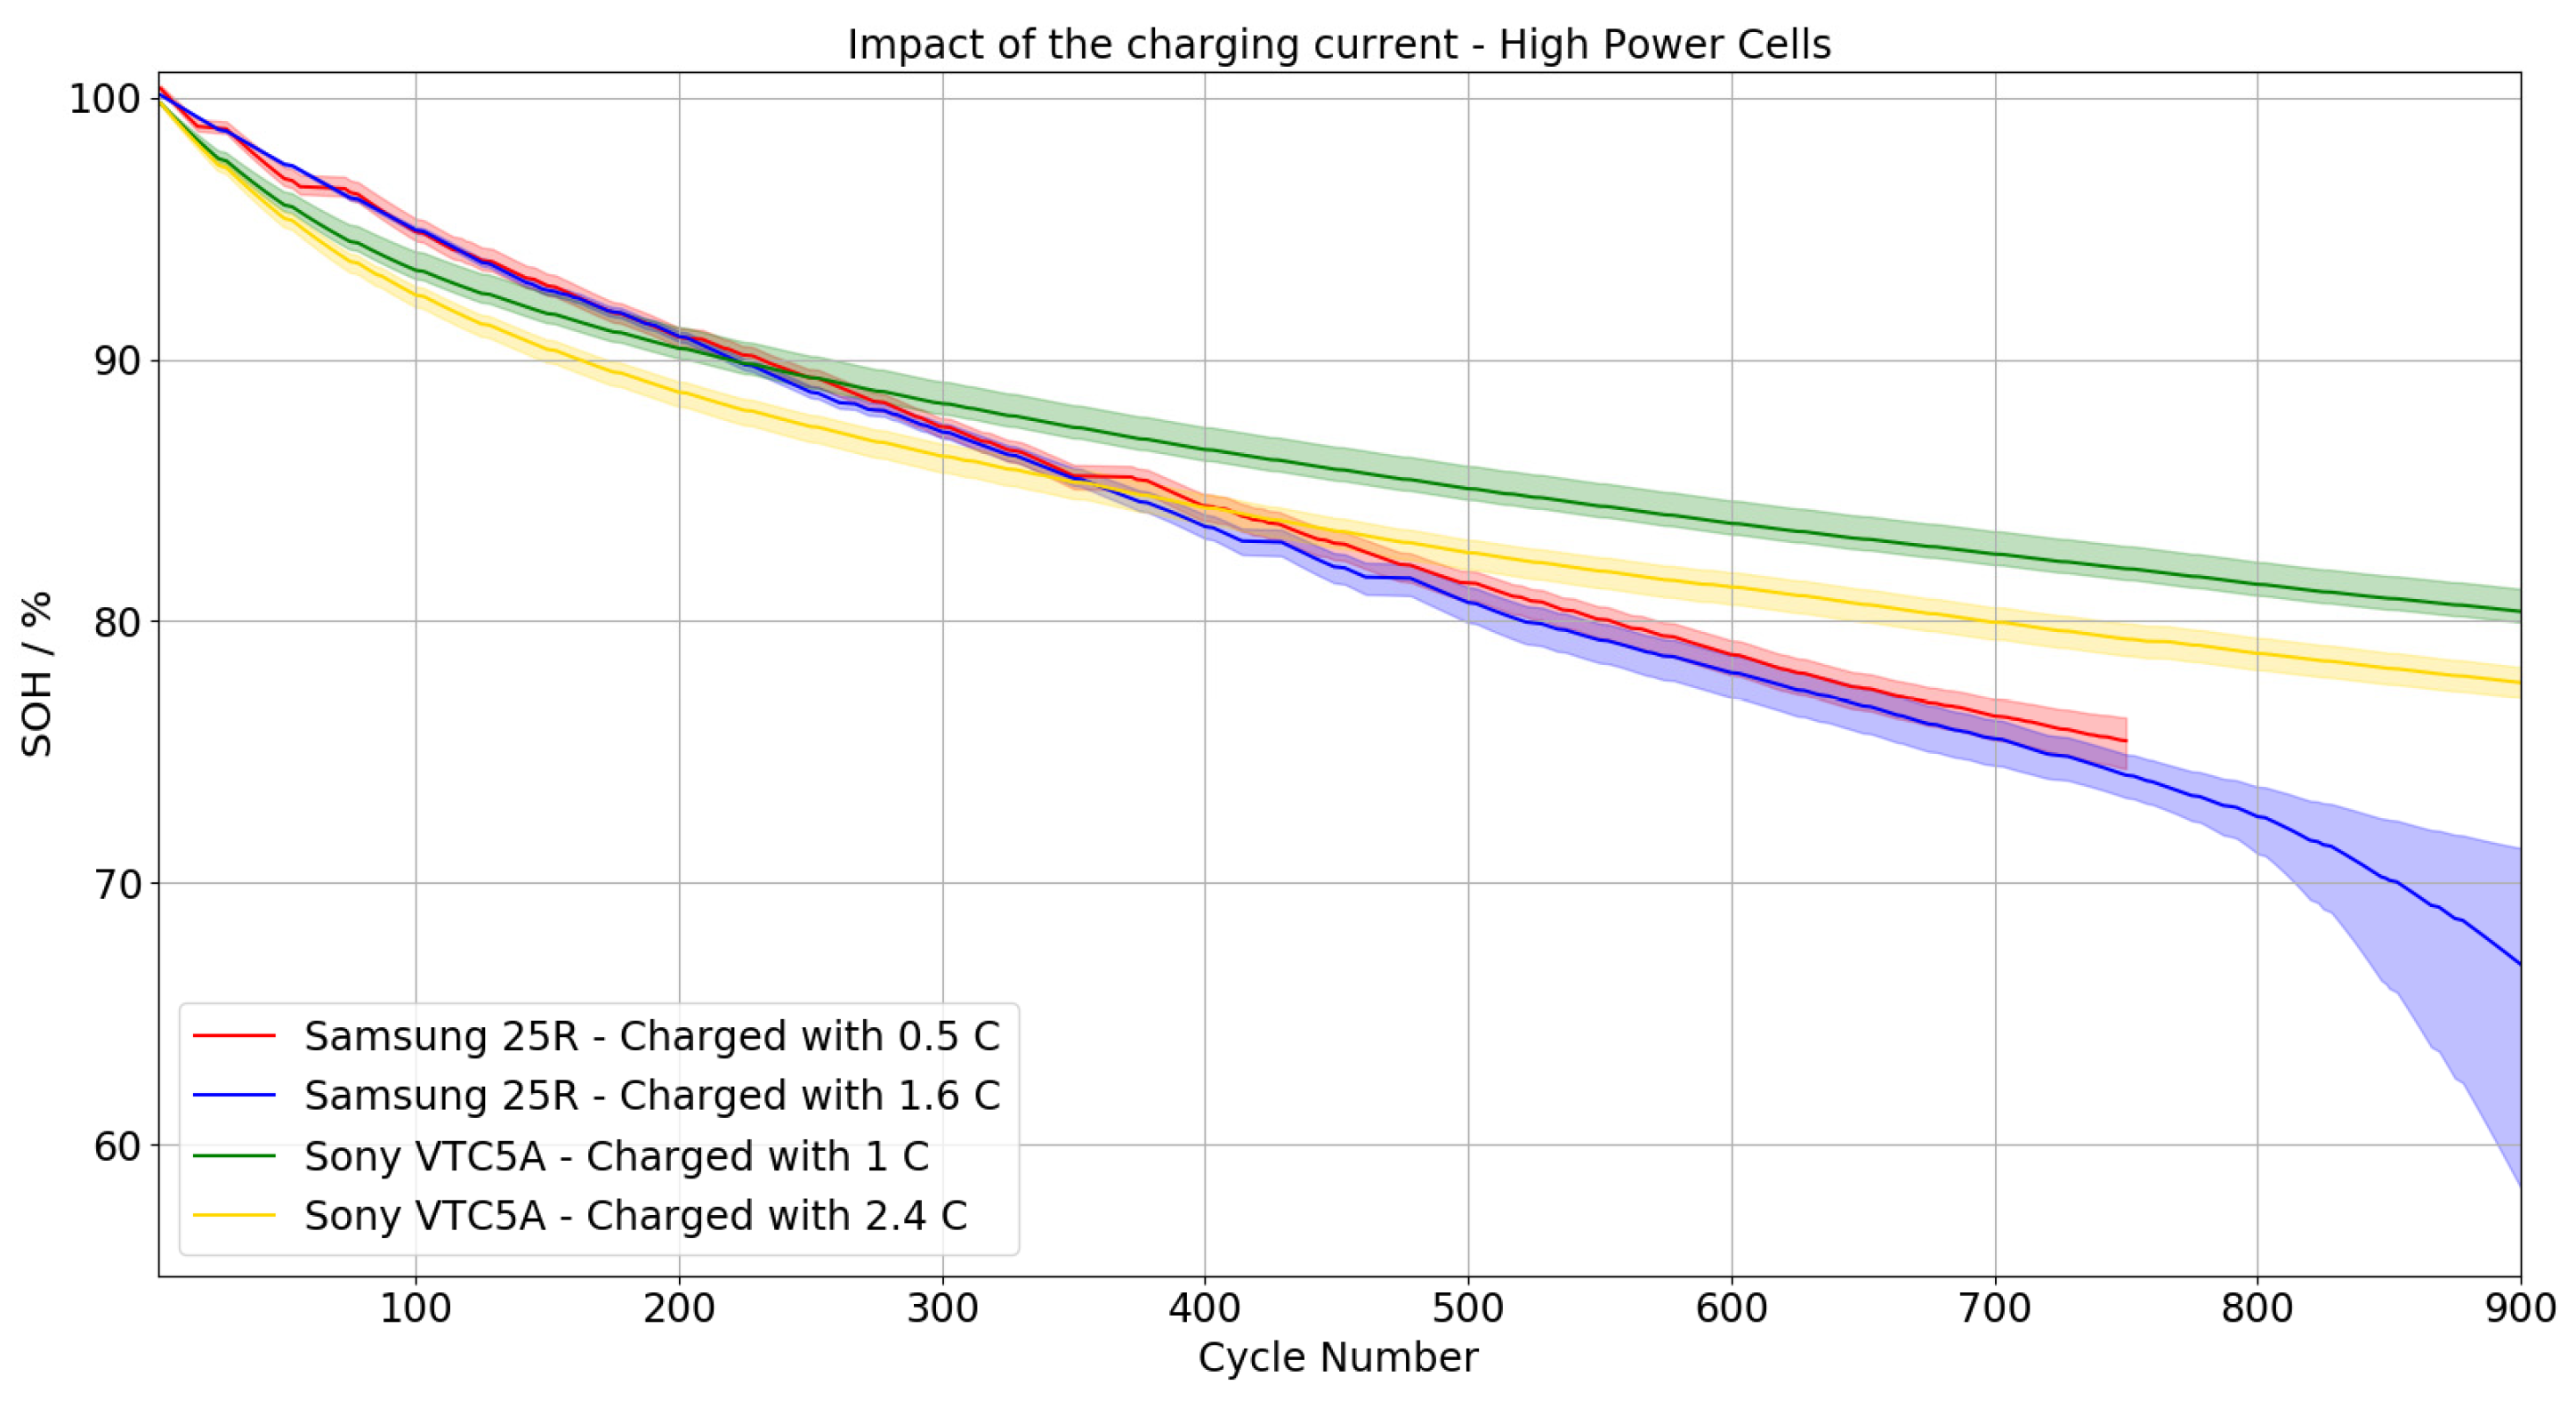
In the following diagrams, the relative state of health (SOH) is plotted against the number of cycles. In this work, the SOH refers to the discharge capacity of the first cycle. The solid lines are the mean values of 4 cells, the colored areas show the spread.
Figure 3 shows the SOH curve of the high-power cells, while
Figure 4 shows the SOH curve of the high-energy cells. The high-power cells can be discharged and charged with higher C-rates than the high-energy cells in general. This is obvious from the description “high power” and given for the cells tested.
Looking at the curves of the high-power cells, we see that the VTC5A and the 25R show a different course. The decrease of the SOH is almost linear for the Samsung 25R, the Sony VTC5A loses more capacity during the first few cycles. After about 250 cycles for standard and 350 cycles for rapid charge, the Sony VTC5A shows a better aging behavior and a lower decrease of the SOH. It has to be mentioned that the charging currents of the Sony VTC5A are higher. The value of the charge current defined for “standard charge“ is twice as high as the value for “standard charge“ of the Samsung 25R. The value defined for “rapid charge“ is even 50% higher. The different charge currents do not seem to have a big influence on the SOH development of the Samsung 25R, at least not over the first 750 cycles. In the case of the Sony VTC5A, a difference in the aging behavior depending on the charge current can be seen more clearly, although less than in the case of the high-energy cells. It is noticeable that the Samsung 25R charged with the rapid charge method shows a large scatter after approx. 800 cycles. Unfortunately, the Samsung 25R charged with the standard charge method was only tested until cycle 750, because of the longer charging times. Therefore, no direct comparison is possible. On a trial basis, the cycle test was continued after a time, but unfortunately the SOH decrease due to calendar aging during storage was too large to be connected to the curve. The decrease of the SOH was about 2%. Nevertheless, it became clear that the spread is lower. After 900 cycles the spread is about 3%, while the spread for the Samsung 25R charged with the rapid charge method is 13.5%. The Samsung 25R charged with the rapid charge method has lost 33% SOH after 900 cycles.
At the high-energy cells the Samsung 50E shows the smallest decrease of the SOH and thus the best aging behavior of the tested cells. The Samsung 35E shows a faster aging at this charge C-rate. Even at a lower charge C-rate of 0.3 C, the SOH of this cell decreases rather rapidly. The greatest dependence of the SOH on the charge current is evident for the LG M50T. However, the highest charge current of 0.7 C is also specified here. The LG M50T also shows a large spread of 10% after 500 cycles when charged with the rapid charge method, while the spread of the cells charged with the standard charge method is less then 1% after 500 cycles.
4.2. Charging Time
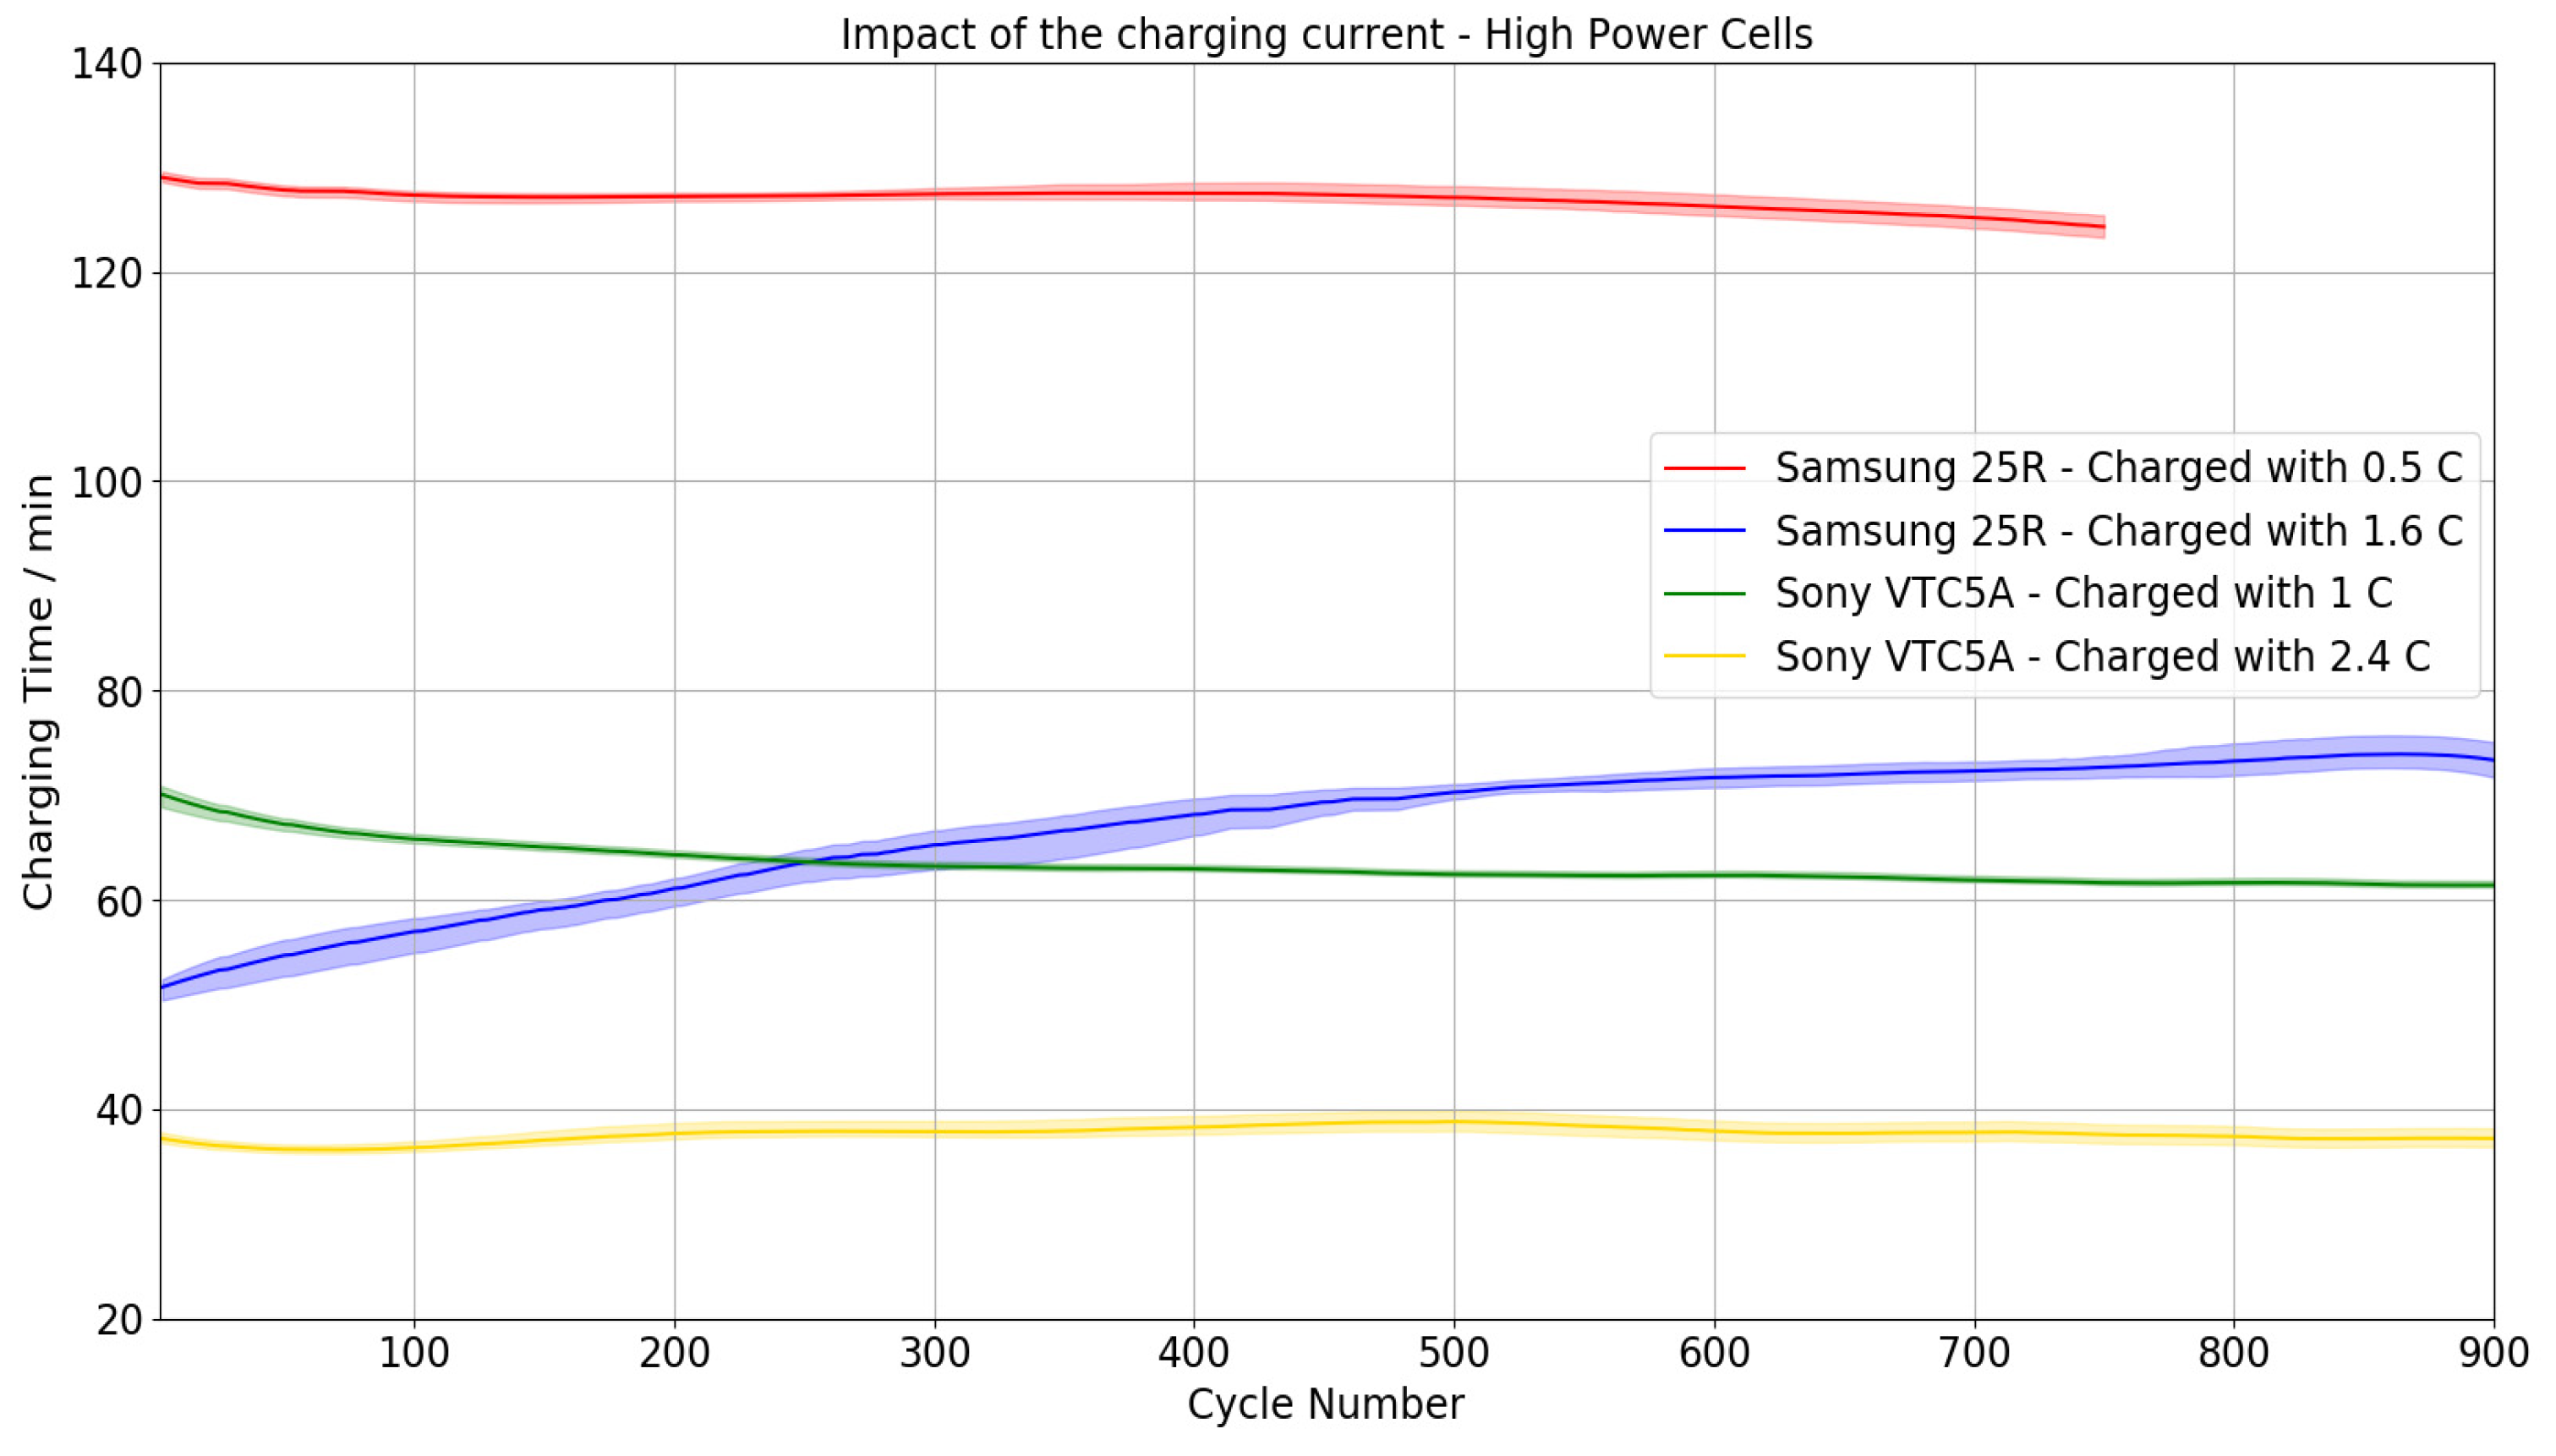
The charging times of the high-power cells are shown in
Figure 5 and the charging times of the high-energy cells are shown in
Figure 6. High-power cells can be charged much faster in general. The rated nominal capacity of the Samsung 25R and the Sony VTC5A is specified with 2.5 Ah and, therefore, only half of the capacities of the Samsung 50E and LG M50T which are specified with almost 5 Ah. In addition, higher charge C-rates are possible for the CC part.
Generally, the Sony VTC5A can be charged must faster than the Samsung 25R; higher charging C-rates are specified here, which has an appropriate impact on the charging times. For the standard charge process, the charging current of the Sony VTC5A is twice as big as the one of the Samsung 25R and, therefore, the charging time is nearly half. For the rapid charge process, the charging current of the Sony VTC5A is 50% bigger than the one of the Samsung 25R and, therefore, the charging time is nearly three quarters more. For the Samsung 25R as well as the Sony VTC5A, the charging time of the standard charge process stays more or less constant during the charging process. The highest change of the charging times can be seen for the Samsung 25R charged with rapid charge. The charging time increases and after 900 cycles it is about 43% higher than at the beginning. In contrast, the charging time of the Sony VTC5A charged with the standard charge method decreases slightly by 13%. To explain this, a closer look to the CC and CV parts is necessary.
At the high-energy cells, the longest charging time can be seen for the LG M50T charged with the standard charge method and for the Samsung 35E, also charged with standard charge. For both cells, there is a charging current of 0.3 C specified. Thereby, the charging time of the Samsung 35E stays constant over the cycle number, while the LG M50T starts with a higher charging time but decreases until the same level as the Samsung 35E is reached. When the Samsung 35E is charged with a two-thirds higher charging current of 0.5 C, the charging time drops about 32%, resulting in 150 min for the first cycle. Then, it increases over the first 150 cycles to 163 min, where it stays nearly constant until the end of the cycle test. For the Samsung 50E there is also a charging current of 0.5 C specified and the charging times are the same also—at least for the first cycle. Nevertheless, while the charging time of the 35E charged with the rapid charge method increases already during the first cycles, the charging time of the 50E decreases a bit and then increases linearly until it is equal after 400 cycles. For the LG M50T, the charge current defined for rapid charge is 0.7 C which means 130% higher than for standard charge and the charging time is 40% less—for the first cycle. Afterwards, it decreases before it starts to increase after about 150 cycles. After 500 cycles, the charging time is 165 min and therefore 17% higher than at the first cycle. The spread of the LG M50T cells, which is visible at the curves for cycle life, can also be seen for the charging time.
4.3. Heating during Charging
The temperature increase during the charging process is generally higher at the cells that were charged with the rapid charge method. The heating during the charging process is shown in
Figure 7 for the high power cells and in
Figure 8 for the high energy cells.
The Sony VTC5A shows the highest increase in temperature during the charging process for the high power cells. The highest C-rate is also specified here. The temperatures remain more or less constant over the number of cycles, which is true for all high-power cells. Except for the Samsung 25R which was charged with the rapid charge method. There is an average increase of about 6°C until cycle number 900. This suggests that an increase in the internal resistance has occurred. The LG M50T shows the strongest temperature increase during the charging process for the high energy cells. This is due to the high charge C-rate, the highest C-rate of all high-energy cells. However, there was no high increase of temperature with increasing the number of cycles. The temperature of the Samsung 35E charged with the rapid charge method and the temperature of the Samsung 50E increases slightly with an increasing cycle number. Assuming the temperature is proportional to the power dissipation, the results show that the cells have similar internal resistances.
4.4. Comparison of CC/CV Section
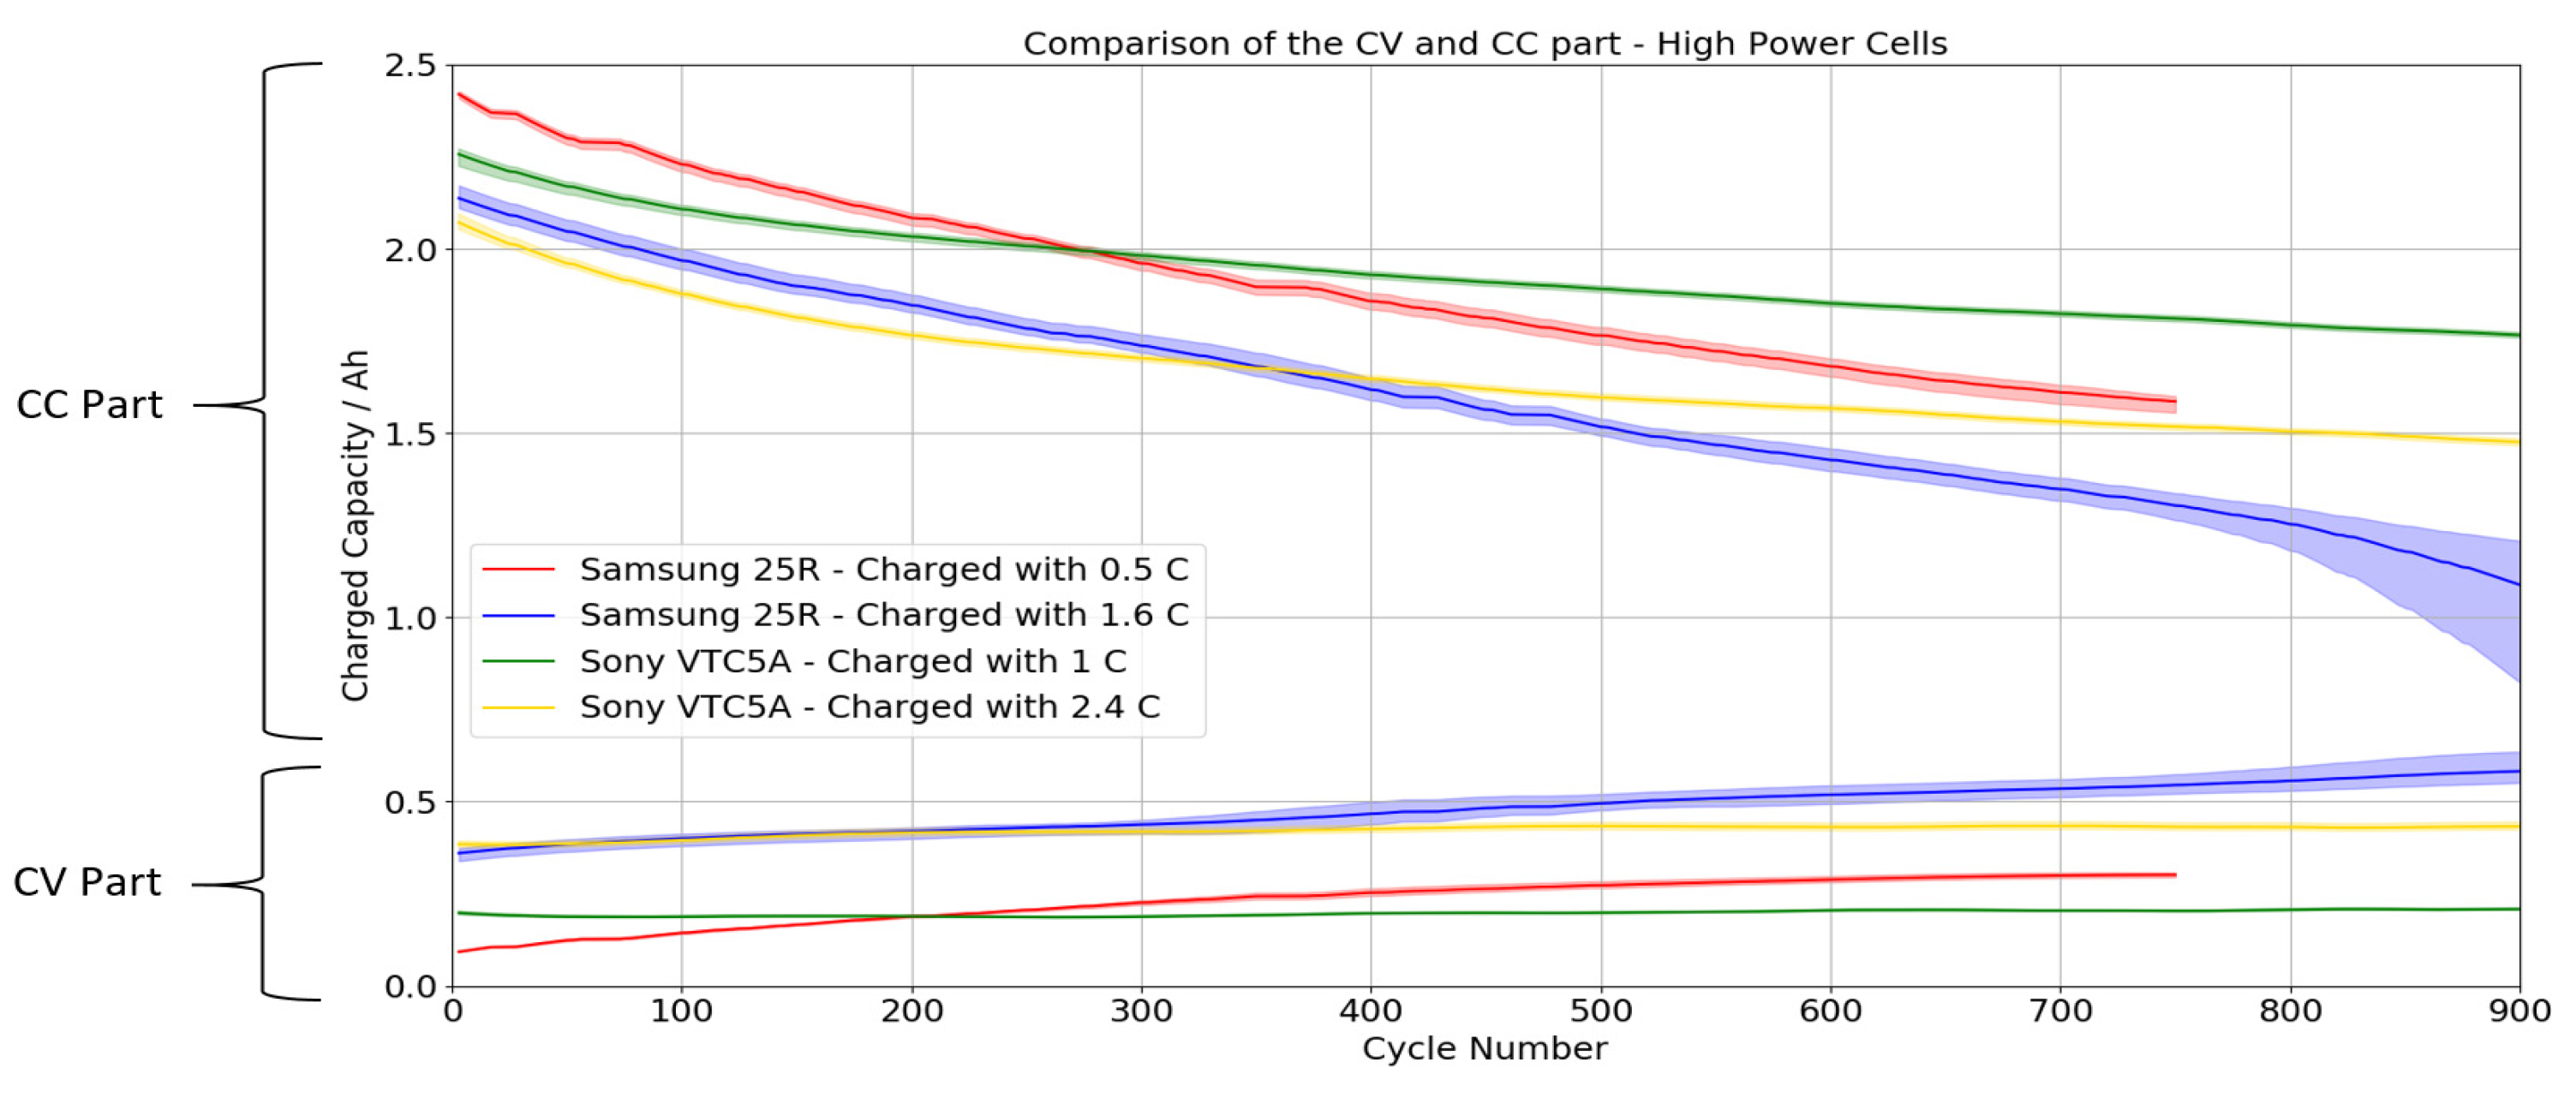
The previous diagrams show the results of the entire charging process, consisting of the CC and the CV part. For a better understanding of what happens during the charging process and the influence of the CC and CV parts, they are compared in the following diagrams. In
Figure 9 and
Figure 10, the charged capacity is shown according to the CC and CV parts.
For all cells, the duration of the CV part increases over the number of cycles, while the duration of the CC part decreases. The reason for this is probably a general increase in the internal resistance due to aging and also the concentration polarization. Thus, voltage limits are reached earlier and the CV phase begins sooner. The explanation assumes that the open circuit voltage (OCV) characteristic of the cell changes only insignificantly compared to the internal resistance. This principle applies to all cells, but is especially visible for the LG M50T, as shown in
Figure 11. The CV part takes more time than the CC part right from the start. However, this is also the case for the other cells that were charged with the rapid charge method after a certain time/number of cycles, as can be seen in
Figure 12,
Figure 13,
Figure 14 and
Figure 15. The proportion of the total load and the loading time of the CC part are listed in
Table 5,
Table 6 and
Table 7.
For the Samsung 50E, the CV part takes about as much time as the CC part after 500 cycles, as can be seen in
Figure 12. Only about 1/5 of the total capacity is charged during the CV part then. For the LG M50T charged with the rapid charge method, the CV part already takes a bit more time than the CC part at the beginning of the cycle test. During the CV part, approx. 1/5 of the capacity is charged. The contribution of the CV part to the total charging time increases significantly over the cycle test. After 500 cycles, the CV part takes up about 3/4 of the total charging time, while about 1/3 of the total capacity is charged. With the standard charging method, the CV part basically takes less time. At the start of the cycle test, the CV part takes approx. 22% of the total charging time, while 8% of the capacity are charged into the cell. After 500 cycles, the proportion of the capacity that is charged during the CV part has hardly changed to 11%. The percentage of the CV part of the total charge time has increased to 29%. For the Samsung 35E cells which were charged with the fast charge method, the CV part takes nearly the same time as the CC part after approx. 250 cycles, as can be seen in
Figure 13. After 500 cycles, the CV part even takes slightly more time than the CC part. Approx. 1/4 of the capacity is charged then. At the beginning, the duration of the CV part takes about 1/3 while 16% of the capacity is charged. In the case of the Samsung 35E which was charged with the so-called cycle life charging method, only 7% of the total capacity is charged during the CV part at the beginning and even after 500 cycles the charged capacity is comparatively low with 13%, compared to the fast charging method. At the beginning of the cycle test, the CV part needs 17% of the total charging time and 32% after 500 cycles.
For the Samsung 25R and the Sony VTC5A which were charged with the fast charging method, the CV part takes more time than the CC part after approx. 120 cycles. For the Samsung 25R which was charged with the fast charging method, the CV part takes 78% of the total charging time after approx. 900 cycles. Then, 35% of the capacity is charged. After 500 cycles, 24% of the total capacity are charged at 68% of the total charging time. During the first cycle, 14% of the capacity was charged at 39% of the total charging time. For the standard charging method, no data is available for 900 cycles. After 500 cycles, the duration of the CV part only takes about half the time in percentage terms as with the fast charging method. Then, 13% of the total capacity is charged. For the first cycle, the CV percentage of the total charge time is 11% for a charged capacity of 4%. For the Sony VTC5A which was charged using the fast charge method, after 900 cycles 60% of the total charge time is used for the CV part, while 23% of the capacity is charged. In the case of the cells charged using the standard charging method, the CV part only takes about half the time in percentage terms, while 11% of the capacity is charged then. Already at the beginning, the percentage of the charging time of the CV part of the cells charged with the standard charging method is 23%, while 8% of the capacity is charged. For the cells charged with the fast charging method, twice the percentage amount of the capacity is charged during the CV part. In this case, the percentage of the charging time is 45%.
5. Conclusions
The results of the study show how increasing the charging current affects the aging behavior of different cell types. As was to be expected, the different behavior of high-power and high-energy cells becomes clear. However, significant differences between supposedly similar cells also become visible. In principle, an increased charge current leads to a stronger decrease of the SOH in the course of the cycle test. This principle applies to all cells—even if it is more or less pronounced or only visible after a certain number of cycles. However, the shape of the curve that results when the capacity or SOH is plotted against the number of cycles also shows differences for the various cells. To get an even more detailed insight into the charging process, the charged capacity and the duration of the CC and CV sections are considered and also the scattering of the cells is analyzed.
The high-power cells can basically be charged with higher C-rates than the high-energy cells. However, they also differ in specification. Even higher charge currents are more possible for the Sony VTC5A than for the Samsung 25R. The curve of the SOH over the number of cycles is also different. The Sony VTC5A cells lose more capacity during the first few cycles, but the SOH of the Samsung 25R decreases more strongly during the cycle test, despite a lower C-rate. The charging time is correspondingly higher for the Samsung 25R. The charging times remain constant over the cycle test, while the charging rate decreases, except for the 25R, which was charged with the rapid charge method—here the charging time actually increases during the cycle test. This behavior can be analyzed in more detail by looking at the CC and CV parts. In the case of both, the Samsung 25R and the Sony VTC5A cells, the CV part takes more time than the CC part after less than 150 cycles and its proportion on the total charging time increases continuously, while comparatively little capacity is charged into the cells.
Different charge currents are also specified for the Samsung 35E, which can be seen in the SOH decrease curves. Here too, the charging time increases over the first approx. 150 cycles, while the charging time of the cells charged with the standard charging method remains constant.
The LG M50T and the Samsung 50E could be compared for the high-energy cells, but these cells also show different behavior and curves. The only charge current specified for the Samsung 50E is between the two currents specified for the LG M50T. Nevertheless, the 50E with 0.5 C shows a smaller decrease in SOH than the LG M50T charged with 0.3 C. The LG M50T shows a strong and fast decrease of the SOH as well as a pronounced scattering during the fast charging process. On the other hand, the charging time initially decreases but increases after about 250 cycles. After this time, the fraction of the total capacity that is charged into the cell during the CC part decreases strongly. Then, more capacity is charged during the time-intensive CV part.

 ,
, 


