Article

Tunable Iron–Cobalt Thin Films Grown by Electrodeposition

1
IFIMUP—Institute of Physics for Advanced Materials, Nanotechnology and Photonics of the University of Porto, Departamento de Física e Astronomia, Faculdade de Ciências da Universidade do Porto, Rua do Campo Alegre s/n, 4169-007 Porto, Portugal
2
LaPMET—Laboratory of Physics for Materials and Emergent Technologies, Rua do Campo Alegre s/n, 4169-007 Porto, Portugal
3
Centro da Tecnologia da Informação Renato Archer, Dom Pedro I, Chácaras Campos dos Amarais, Campinas 13069-901, Brazil
4
Departamento de Física Aplicada, Facultad de Ciencias, Universidad Autónoma de Madrid (UAM), Campus de Cantoblanco, C/Francisco Tomás y Valiente 11, 28049 Madrid, Spain
*
Author to whom correspondence should be addressed.
Magnetochemistry 2023, 9(7), 161; https://doi.org/10.3390/magnetochemistry9070161
Submission received: 29 April 2023 / Revised: 31 May 2023 / Accepted: 17 June 2023 / Published: 21 June 2023

Abstract

:
Iron–cobalt (FeCo) alloys are highly desirable for their exceptional and adjustable physicochemical properties, particularly in the form of thin films. This study focuses on the growth of iron–cobalt (FeCo) alloy thin films using potentiostatic electrodeposition. The effects of applied voltage and FeCo stoichiometry on the morphology, structure, and magnetic properties of the films are investigated. The results indicate that the electrodeposition potential does not affect the overall stoichiometry or the structural and magnetic properties. However, it does impact film thickness and grain sizes. Higher applied potentials lead to thicker films with faster growth rates, as well as smoother and more homogeneous films with smaller grains. Films with different Fe:Co ratios (Fe90Co10, Fe50Co50, and Fe10Co90) are obtained, and their compositions have a direct impact on morphology, with the amount of Fe influencing film thickness, growth rates, and grain sizes. Increasing Fe content (50, 90%) leads to thicker films and smaller grains. Films with low Fe content (10%) exhibit a face-centered cubic (fcc) structural phase instead of the typical body-centered cubic (bcc) structure. All FeCo alloys display soft magnetic properties with characteristic coercivities, and the low Fe (10%) sample with the fcc structure exhibits the highest coercivity among all the samples. The nucleation and growth mechanisms are investigated using electrodeposition curves and the Scharifker and Hills model. Increasing the applied potential leads to thicker films and higher growth rates, with the nucleation mechanism identified as instantaneous nucleation in the diffusion-controlled regime.

1. Introduction

Soft magnetic materials play a crucial role in electromagnetic devices, making the research on soft magnetic films vital. FeCo alloys, known for their high saturation magnetization, high permeability, low coercivity [1,2,3,4,5,6], and excellent thermal stability [1,3], are considered important magnetic materials. These properties are unmatched by any other alloy system, making it essential to precisely control them for both innovative and new applications. These unique properties make them useful in various technological applications, such as magnetic recording heads, magnetic sensors [1,4], magnetic tunnelling junctions (MTJs) like tunnelling magnetoresistance (TMR) heads and magnetic random-access memory (MRAM) [7], microelectromechanical systems (MEMS) [8,9], 3D racetrack memory devices [10], wave absorbing [3], and microactuators [2]. Moreover, FeCo films have good corrosion resistance and can be used in electronic devices and sensor applications, with protective coatings [9] showing long-term durability. They are also the perfect candidates for high-frequency electronic devices [6].
Recently, FeCo alloy-based films have attracted great interest due to their low cost and environmental friendliness, making them suitable for biomedical and energy conversion applications. FeCo films are biocompatible and can be used in biomedical applications such as drug delivery and tissue engineering [11]. Additionally, FeCo alloys have been developed as novel catalysts for energy conversion equipment, including fuel cells, photoelectrochemical cells, and metal–air batteries [12,13,14,15].
At the nanoscale, various techniques have resulted in FeCo nanomaterials with different shapes and architectures, including nanoparticles [16,17,18], nanowires [19,20], nanorods [21,22,23], nanotubes [24], and 2D thin films [6,25]. These materials have a wide range of applications, and precise control over the properties of FeCo alloys in terms of stoichiometry, structure, magnetic properties, and morphology is of great importance.
So far, FexCo1−x alloy thin films have been successfully fabricated by several physical deposition techniques, such as molecular beam epitaxy [1,3,4,7,25,26,27], sputtering [1,3,4,5,28,29], and evaporation [4,6,25], as well by electrochemical routes using electrodeposition [1,3,4,5,30,31]. Among them, electrodeposition stands out as a very attractive technique since it is the simplest, most reliable, lowest-cost, scalable, and very versatile method, allowing a straightforward thin film fabrication in conducting substrates [1,5,31]. Moreover, the FeCo alloys have been electrodeposited for almost 100 years, starting with the work of Glasstone and Speakman in the early 1930s [32,33,34].
Electrodeposited thin films are grown by different electrodeposition techniques, including potentiostatic (constant voltage) [3], galvanostatic (constant current), [2,3] or pulsed electrodeposition [3,30]. Furthermore, by changing the electrodeposition conditions, such as electrolyte type [30], Fe and Co ionic concentration [2,8,35,36], temperature [1,9,37], deposition potential [37]/current [9], or electrodeposition type [3], one can obtain FeCo thin films with different properties and/or characteristics.
The composition of FexCo1−x can be easily adjusted by changing parameters, such as temperature [37], electrolyte concentration [36], or the electrodeposition technique [38]. However, these adjustments have been reported to work effectively only at low potentials, typically not exceeding −1.5 V (vs. Ag/AgCl), which leads to low growth rates [38]. Furthermore, varying the Fe:Co ratio in bulk alloys results in different crystalline phases, ranging from body-centered cubic (bcc) to face-centered cubic (fcc) or hexagonal closest packed (hcp) [39,40]. Interestingly, the crystalline phase of FeCo thin films can also change from bcc to fcc by modifying the electrodeposition conditions, such as temperature or Fe:Co ratio, and sometimes mixed crystallographic phases can emerge [5,9].
The nucleation and growth mechanisms of various metals have been extensively studied at low potentials, typically below −1.3 V (vs. SCE) [41,42,43,44,45,46]. However, despite numerous studies on FeCo electrodeposition, many have not optimized the potentiostatic potential to achieve higher growth rates or establish correlations with the nucleation and growth mechanisms observed in the electrodeposition curves.
The electrodeposition curves play a crucial role in distinguishing and determining the type of nucleation and growth mechanisms. They also allow us to establish correlations between these mechanisms and the resulting physical properties, structures, and magnetic nature of the films, thereby enabling us to tailor the films for specific applications. Interestingly, there are only a few works focused on analyzing the electrodeposition curve of FeCo alloys [38,47,48]. Among them, variations in the solution composition, including sulfate [48], chloride [47], chloride/sulfate [38] based solutions, or the Fe:Co ratio in the electrolyte, have led to divergent outcomes when establishing the type of nucleation growth mechanism and the Fe:Co ratio in the films. As such, a thorough understanding of the influence different electrodeposition parameters have on the growth mechanisms of Fe:Co films is still lacking.
In this work, FeCo thin films were synthesized using the potentiostatic electrodeposition method. By varying electrodeposition parameters, such as the applied potential (ranging from −1.0 to −1.8 V vs. Ag/AgCl) and the concentrations of Co and Fe ions in the electrolyte, FeCo thin films were obtained at high potentials. These parameters were thoroughly investigated as they greatly influence the composition, microstructure, and thickness (growth rate) of the films. The study focused on understanding the nucleation and growth mechanisms underlying the electrodeposition process. By analyzing the transient current density during electrodeposition, we gained a better understanding of the impact of applied voltage and of the Fe:Co ratio during the nucleation stage, as well as their influence on growth rates and final thickness. The synthesized films were further characterized in terms of their morphological, structural, and magnetic properties, which were correlated with the electrodeposition curves.

2. Materials and Methods

The potentiostatic electrodeposition occurred in a three-electrode set-up. It was performed using a home-made cell consisting of a Teflon container, where the metallic copper substrate (working electrode) was placed in its bottom in contact with a Cu plate, used as the anode, a Pt mesh (counter electrode) was inserted at the top that acts as the cathode, and an Ag/AgCl reference electrode was placed between the working and counter electrodes.
In this process, a constant potential is applied between the working electrode and the counter electrode, both immersed in an ionic electrolyte solution [31], and the electrodeposition occurred at constant room temperature (~20 °C). The electrodeposition curves were controlled using the chronoamperometry procedure in AutoLab NOVA software. The reagents used for the electrolytes are: FeSO4·7H2O (Acros Organic, Geel, Belgium, 99.5%) CoSO4·7H2O (Fisher Chemical, Waltham, MA, USA, 99+%), H3BO3 (Ficher Chemical, ≥99.5%), and C6H8O6, (Sigma Aldrich, St. Louis, MO, USA, 99.7% min). Table 1 summarizes the electrolytes used [49] throughout this work.
Two groups of samples were prepared by varying the electrodeposition parameters, the electrolyte Fe:Co ratio, and applied potential (Vdep), as shown in Table 2. In the first group of samples, the electrodeposition was performed using the electrolyte 1 [Fe20Co80] under different potentiostatic voltages of −1.0, −1.4, −1.8 V. Aiming to obtain FeCo thin films with different stoichiometries, a second group of samples was prepared using three different electrolytes with different Fe:Co ratios: electrolyte 2 [Fe90Co10], electrolyte 3 [Fe50Co50], and electrolyte 4 [Fe10Co90]. These were electrodeposited at −1.8 V.
The morphological and chemical characterization of the thin films was carried out by scanning electron microscopy (SEM) and energy dispersive spectroscopy (EDS) (FEI Quanta 400FEG Field Emission, at CEMUP, University of Porto). The structural evaluation was performed using X-ray diffraction (XRD) measurements (BB geometry, 2θ range from 40 to 90, step 0.01) (Rigaku SmartLab, IFIMUP). The magnetic measurements were achieved by using a superconducting quantum interference device (SQUID) (Quantum Design MPMS 3 SQUID in VSM mode, IFIMUP).
All samples were peeled off from the substrate in order to perform XRD and SQUID measurements. From the XRD pattern analysis, the average crystallite size, DScherrer, of the obtained thin films could be estimated using the Scherrer [50] equation given by:
D Scherrer = 0.9 λ β cos θ
where β is the most intense peak full width at half maximum obtained from the Pseudo-Voight profile fit, θ corresponds to the peak position, and λ is the X-ray wavelength (λCu = 1.540560 Å). From the XRD pattern, the characteristic peaks of a bcc or fcc structure were identified for produced films, depending on their stoichiometry. The lattice parameter, a, could also be estimated through Bragg’s Law [50] for a cubic structure:
a = λ h 2 + k 2 + l 2 2 sin θ
where (hkl) corresponds to the Miller index of the peak positions.

3. Results

The nucleation and growth mechanisms of the electrodeposited films can be evaluated by the electrodeposition curves and by current density (potentiostatic electrodeposition) as a function of time [j(t)] during the electrodeposition. The electrodeposition curves have a characteristic behavior that are presented in Figure 1. A rapid j decrease is firstly observed (stage I), which corresponds to the rapid formation of a double layer charge on the electrode surface. After reaching a minimum, jmin, j increases and reaches a maximum (jmax) in a period of time (tmax). This subsequent increase of j (stage II) corresponds to the growth and/or to an increase of the nuclei number. During this stage, the nuclei develop diffusion zones around themselves. These zones grow and the overlap of the hemispherical mass transfer occurs, resulting in a linear mass-transfer diffusion zone. Finally, a third stage (III) comes into play, where j decreases along the electrodeposition time, corresponding to the slow growth rate of the thin film due to the species linear diffusion from the bulk electrolyte to the electrolyte/electrode interface [47,51].

3.1. Fe20Co80 Film Growth at Different Electrodeposition Applied Potentials (Vdep)

3.1.1. Analysis of the Current Transients

Figure 2a shows the current transients of the electrodeposition of electrolyte 1 [Fe20Co80] on the Cu substrate at different potentials, −1.0, −1.4 and −1.8 V. It can be observed that the j(t) curves differ substantially from each other in two critical aspects: (i) the mean value of j is higher for higher Vdep (ii) and the typical stage III after the nucleation region, with the j(t) slow decay more pronounced with increasing Vdep. While (i) is obviously due to the proportionality of the deposition of the strength of the electric field, the phenomenon (ii) is related to side reactions [41]. Accordantly, while jmax increases linearly with Vdep, the nucleation time tmax decreases (Figure 2b) (Figure S1 in the Supplementary Information (S.I.) shows this phenomenon more clearly). This is due to the rapid enlargement and growth of the nuclei centers caused by the larger electric-field-driven forces associated with a larger deposition potential, resulting in a larger surface area. By analyzing the rising portion of the experimental current transients, it is possible to obtain some kinetic information about the electrodeposition process. Considering that only isolated nuclei are formed in the surface, Scharifker and Hills [52] proposed two types of nucleation that can be explained by the following current–time relationships:
j = π 1 / 2 z F D 3 / 2 c 1 / 2 N k t 1 / 2 ,   k = 8 π c M ρ 1 / 2
for instantaneous nucleation (all nuclei are formed at the beginning of the pulse), and:
j = 1 2 π 1 / 2 z F D 3 / 2 c 1 / 2 A N k t 3 / 2 ,   k = 4 3 8 π c M ρ 1 / 2
for progressive nucleation (nuclei are continuously formed).
In Equations (3) and (4), j is current density, t is time, D is the diffusion coefficient, c is the bulk concentration, zF is the molar charge transferred during electrodeposition, M is the molecular weight, ρ is the density of the material, N is the number of nuclei, A is the steady state nucleation rate constant per site, and N∞ is the number density of sites. Classifying the nucleation process as instantaneous or progressive is possible by representing the initial current transients as j vs. t1/2 for instantaneous (Equation (3)) and j vs. t3/2 for progressive nucleation (Equation (4)). Figure 2c,d show the plots of j vs. t1/2 and j vs. t3/2 for the experimental data with the respective R2 (R-squared value), which shows the quality of curve fitting to the experimental data. Since the plots of j vs. t1/2 present a higher R2, one can conclude that, under the experimental conditions of this work, an instantaneous FeCo nucleation process occurs. Furthermore, considering Equation (4) and the slope of j vs. t1/2 (Figure 2), we can estimate the number of nuclei (N) for each sample:
Slope = π 1 / 2 z F D 3 / 2 c 1 / 2 N k t 1 / 2
where D = 1.5 × 10⁻⁵ cm2 s−1. Although, the diffusion coefficient of FeCo alloys depends on many factors, such as composition, temperature, and microstructure, here we considered an experimental estimated valued [47].
For each Vdep, we obtained different number of nuclei, N1.0V = 6.5 × 10², N1.4V = 1.9 × 10³, and N1.8V = 4.9 × 103 cm−2. By increasing the voltage, the number of nuclei formed is much larger (Figure S2 in S.I.) in a shorter period time (since for Vdep = −1.8 V tmax is shorter), which is normal behavior [47]. While the growth mechanism depends on the applied potential and electrolyte conditions, the nucleation process is usually attributed mainly to the nature of the substrate (i.e., surface roughness) and the density of the active sites [53]. In this work, it can be observed that different applied potentials have a major impact on the nucleation and film formation stages. For higher potentials (Vdep = −1.8 V), the conditions for the emergence of a higher density of nucleation sites are present, as a larger number of nuclei are formed during the faster nucleation period of time. This ultimately leads to, and probably results in, a more uniform and homogeneous film.
The transferred charge (Q) as a function of time can be determined by integrating the j(t) electrodeposition curves, as shown in Figure 3. Q(t) plots with a linear trend are representative of a constant and uniform growth rate of the thin film, indicating that the electrodeposition after jmax is a steady-state process that proceeds at a constant rate represented by the slope of Q(t) for each sample. As Vdep increases, higher Q(t) slopes are obtained, corresponding to higher growth rates. This means that more charge transfer occurs throughout the deposition time, which ultimately allows for thicker films. A higher final value of Q(t) indicates a greater film thickness (L), one expects L (−1.8 V) > L (−1.4 V) > L (−1.0 V).

3.1.2. Morphology, Structural, and Magnetic Characterization of Fe20Co80 Thin Films

Figure 4a–c displays the top-view SEM images of the thin films in the first group of samples, while Figure 4e–g shows the cross-section view (Table 1). The film prepared with a lower Vdep (−1.0 V) exhibits significantly larger grains (Figure 4a) than with increasing Vdep (up to −1.4 and −1.8 V), with the film surface having a less granular (smaller grains) and more homogeneous morphology (Figure 4b,c). Figure 5 shows the particle size distribution histograms estimated for all samples in group I. As observed, the grains (particle size) diminish with Vdep from 0.73 ± 0.17 μm to 0.089 ± 0.023 μm. Notice that Vdep of −1.4 V (Figure 4b) film reveals nonuniform film growth, where some larger sporadic grains appear, also composed of FeCo, on top of the initial film. Certain areas of the sample exhibit a higher concentration of these agglomerated particles, covering the initial film (Figure S3a,b in the S.I.). Furthermore, for Vdep = −1.8 V, a uniform film with much smaller grains (0.089 ± 0.023 μm) is obtained, confirming the observations made previously, where the j(t) curves indicated a faster, more uniform, and optimized nucleation mechanism.
Additionally, the cross-section views revealed that the films show a tubular cauliflowerlike morphology for higher Vdep, −1.4 and −1.8 V, (Figure 4f,g, respectively), while for low Vdep = −1.0 V (Figure 4e), these features were not found. For each sample, the thickness of the thin film was estimated (Figure 4h). It was observed that as Vdep increased, the film thickness (L) decreased. The film thickness ranged from 0.63 ± 0.10 μm, at Vdep = 1.0 V to 1.62 ± 0.12 μm, at Vdep = 1.8 V, leading to growth rates of 0.7 nm/s and 1.8 nm/s, respectively. Thicker films were found to be proportional to Vdep, as expected, since larger deposition potentials are associated with stronger electric-field-driven forces. However, it is important to emphasize that at Vdep = −1.8 V, characteristics such as film uniformity, smaller grain size, and rapid nucleation are achievable at a higher deposition rate.
EDS analysis (Figure 4d) revealed stoichiometries of Fe23Co77, Fe22Co78, and Fe25Co75 for Vdep of −1.0, −1.4, and −1.8 V, respectively. Accordingly, for different Vdep, the average stoichiometry is Fe23Co77, showing that Vdep does not significantly affect the composition of the thin films. These observations show that increasing or adjusting Vdep to −1.8 V leads to an increase in the deposition rate (Figure 4h) while maintaining stoichiometry (Figure 4d). Therefore, by keeping the stoichiometry constant, we can effectively adjust the deposition rate by controlling the applied voltage.
The crystalline structure analysis of the first group of FeCo thin films was evaluated by X-ray diffraction (Figure 6a). For all diffractograms, two peaks are seen at 45° and 83°, corresponding to (110) and (211) crystallographic directions, which is characteristic of a bcc structural phase.
The lattice parameter was determined using Equation (2) and the crystallite size was determined using the Scherrer relation (Equation (1)). The lattice parameter increases slightly with increasing Vdep, ranging from 2.837 ± 0.007 Å (for Vdep = −1.0 V) to 2.844 ± 0.005 Å (for Vdep = −1.8 V), typical values for bcc FeCo alloys [1,8,9,38] (Figure 6b). The values for the crystallite sizes of the films did not change significantly and ranged from 7.7 ± 0.2 nm, 8.9 ± 0.3 nm, and 7.23 ± 0.2 nm for the samples with Vdep of −1.0, −1.4, and −1.8 V, respectively (Figure 5b).
Figure 7a shows the magnetization moment versus the magnetic field, M(H), at 300 K for the first group of samples. The data show hysteresis loops with low coercive field (Hc), strengths which are clear indications of the presence of the soft ferromagnetic contribution of the FeCo alloy with Hc strengths between 16 and 26 Oe (Figure 7b), typical values in the range of those reported [8].
Overall, the higher Vdep (−1.8 V) leads to larger growth rates, more homogeneous morphology film, and reduced crystallite sizes. Thus, to further produce films with good quality, homogeneity level, and higher deposition rates, a Vdep of −1.8 V parameter was chosen to be applied for the second group of samples (Table 2).

3.2. Varying FeCo Films Stoichiometry by Using Different Fe:Co Ions Concentrations Electrolyte for High Voltage Deposition

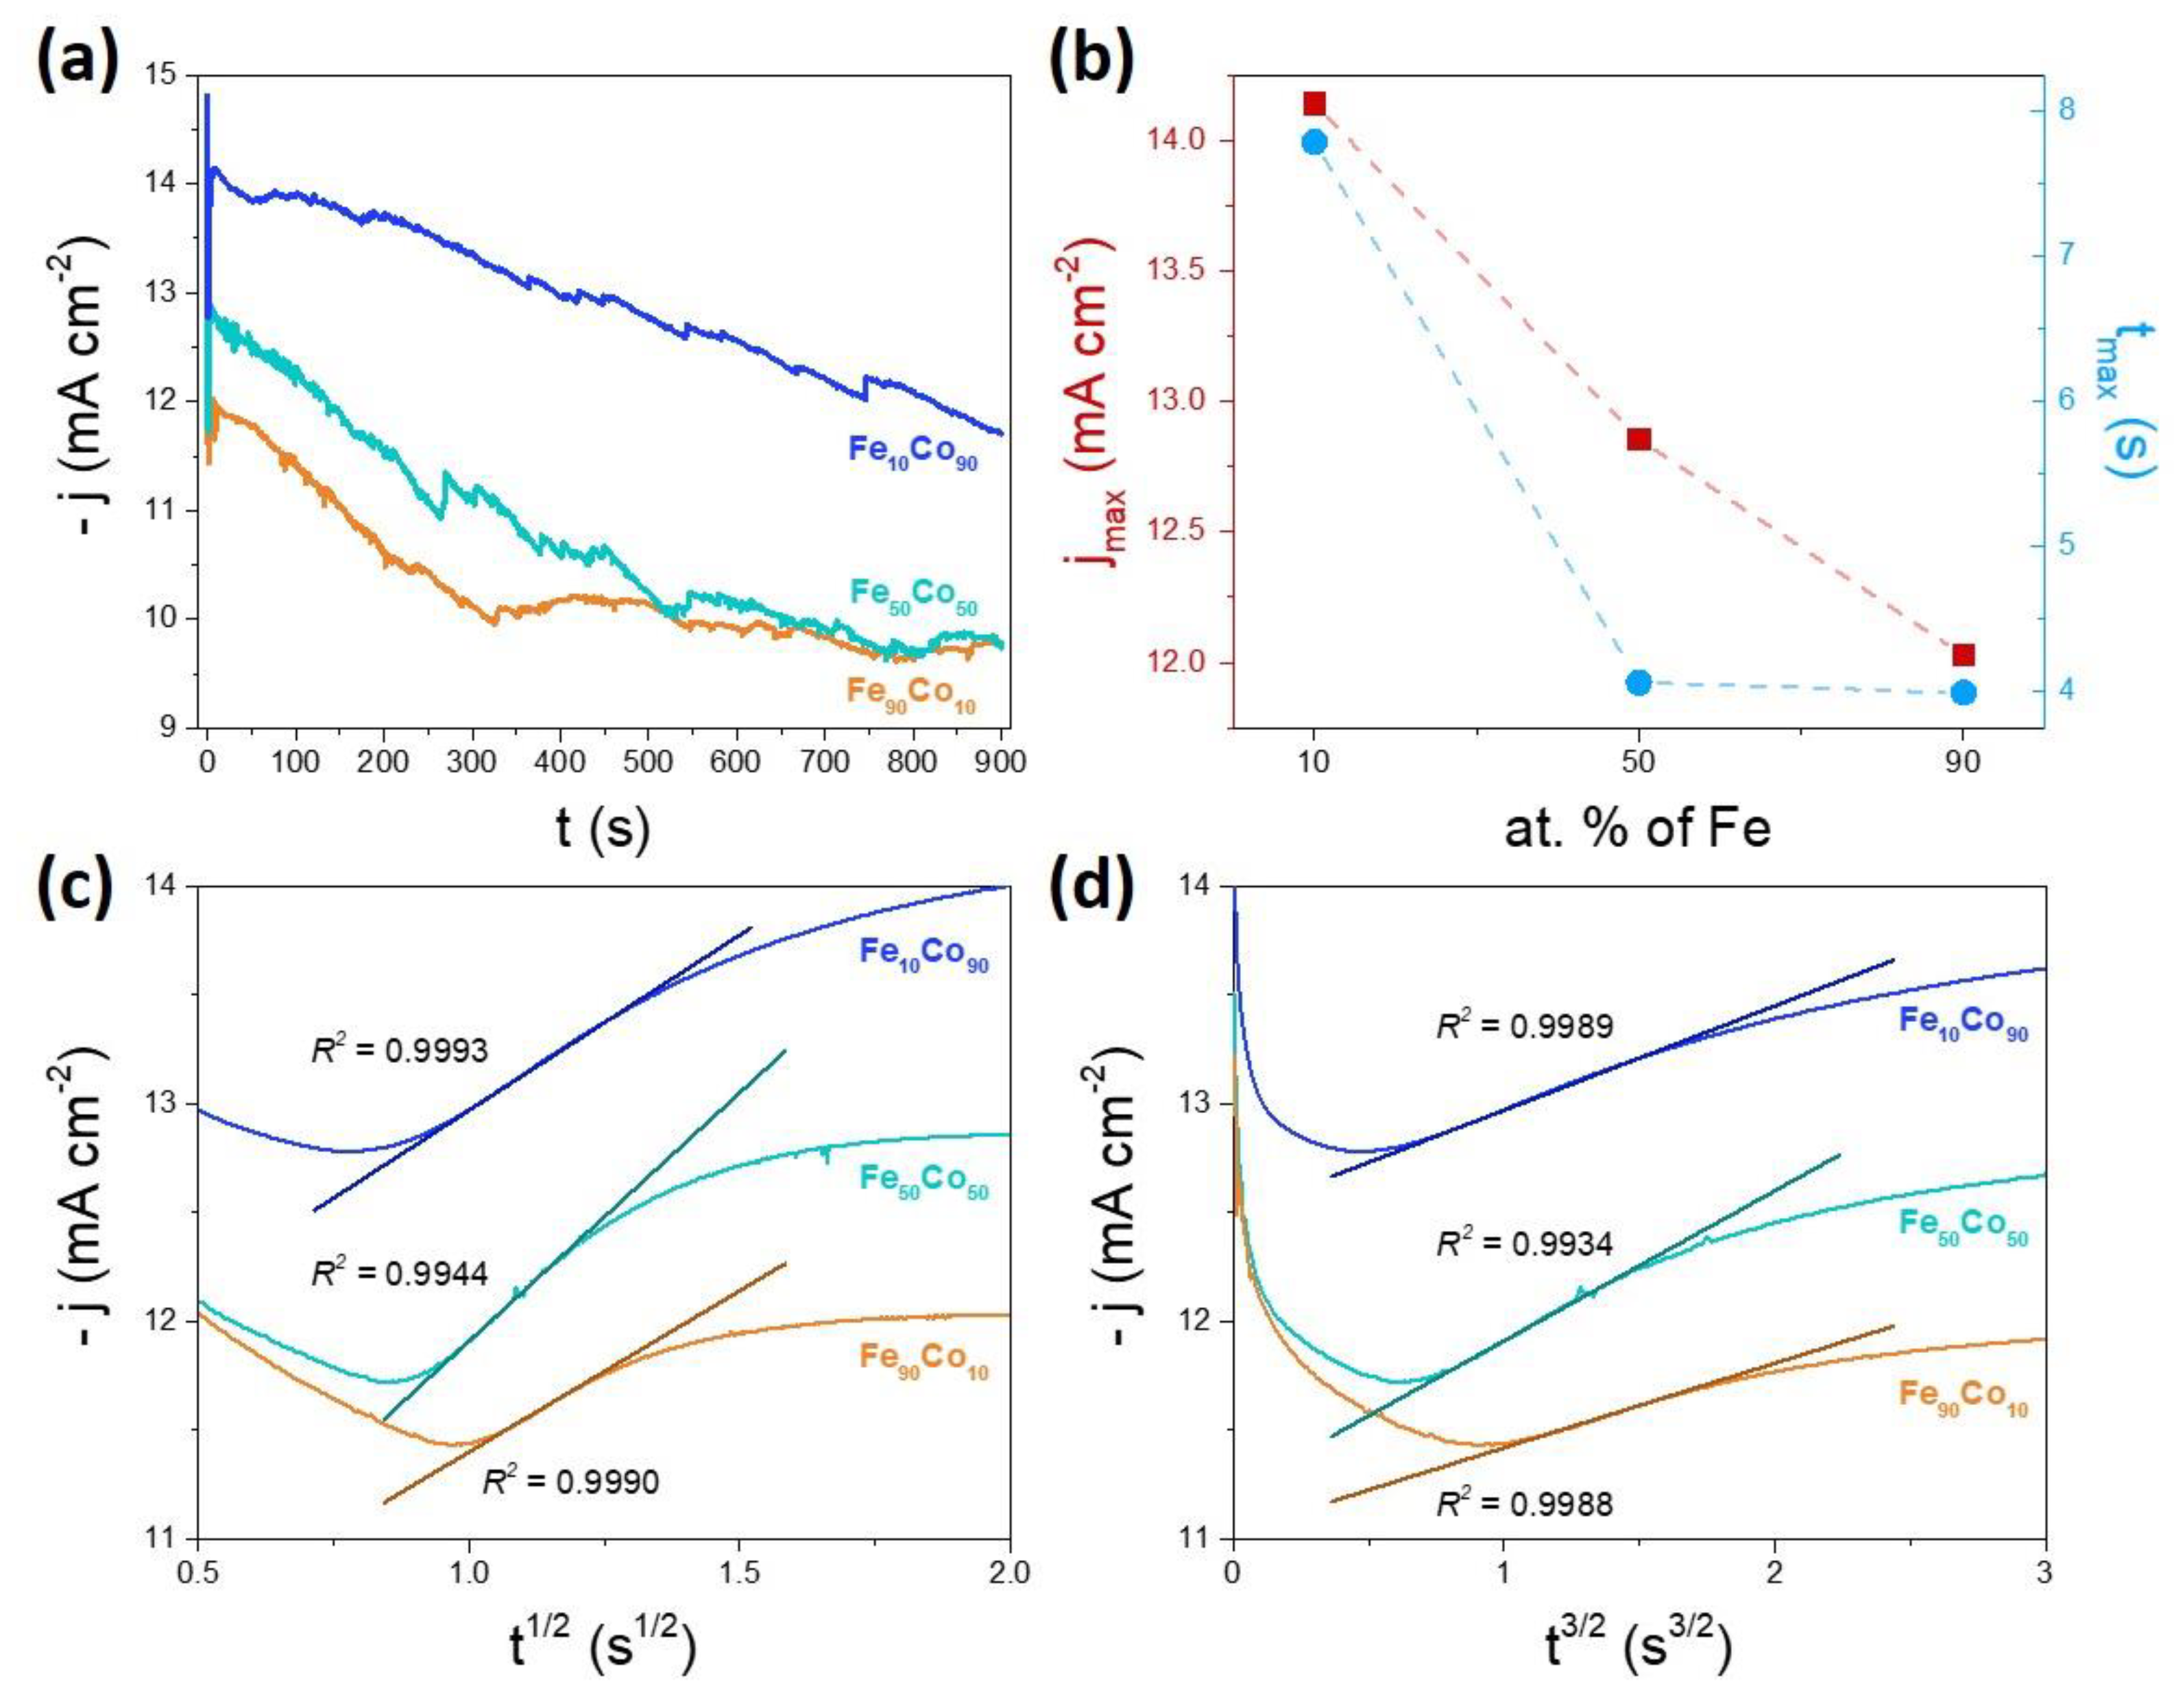
3.2.1. Analysis of the Current Transients

To evaluate the role of the Fe:Co ionic concentration in the alloy stoichiometry, thin films were grown using different electrolytes: electrolyte 2 [Fe90Co10], 3 [Fe50Co50], and 4 [Fe10Co90] on Cu substrate at Vdep of −1.8 V.
In order to understand the nucleation and growth kinetics of the second group of samples with three different Fe:Co ratios (Table 2), the electrodeposition current transients were analyzed, as shown in Figure 8a. For the different electrolytes, one can notice: (i) the magnitude of j mean values or final value of j, ranging from 10 to 14 mA cm−2, have the same order of magnitude as the sample of the first group for Vdep of −1.8 V; and (ii) the typical j(t) slow decay with time, characteristic of a diffusion-limited deposition, is more evident for samples with more Fe content (50 and 90 at. % of Fe). In addition, a noisy background is observed in the curves in all current transients (more pronounced for 50 and 90 at. % of Fe) associated with the hydrogen evolution that is usually observed for these high deposition voltages.
jmax decreases with at. % of Fe whereas tmax decreases with at. % of Fe and seems to remain constant for at. % of Fe higher than 50%, see Figure 8b. Figure 8c,d show the results of applying the Scharifker and Hills model [52] (Equations (3) and (4)) to the current transients obtained for the electrodeposition of electrolyte 2 [Fe90Co10], 3 [Fe50Co50], and 4 [Fe10Co90] on Cu substrate with applied potential of −1.8 V. As previously noted for the first group of samples, the R2 value is higher in the plots of j vs. t1/2 leading to the conclusion that, once again, the FexCo1−x (x = 10, 50, 90) presents an instantaneous nucleation.
Furthermore, we can estimate the number of nuclei (N) for each sample, as previously described, given more or less the same order of magnitude of N for all the samples, with a mean N = 2.8 × 103 cm−2, as observed in Figure S2 in S.I. Although the atomic content of the electrolyte has changed, the number of nuclei did not change significantly, as the nucleation time was in the same order of magnitude. This leads us to conclude that the electrolyte’s Fe:Co content is not the driving force of the nucleation mechanism. The Vdep parameter is the key factor that has the most significant impact on the number of nuclei and the time of their growth and film formation.
Figure 9 shows the charge transferred as a function of time for each thin film, yielding an approximately linear relation as observed for the first group of samples. In all cases, the same Vdep (−1.8 V) was applied, resulting in approximately similar slopes that suggest comparable growth rates at different Fe:Co ratios under the same Vdep conditions.

3.2.2. Morphology, Structural, and Magnetic Characterization of FexCo1−x (x = 10, 50, 90) Thin Films

Figure 10a–c display the top SEM images of the second group of samples (Table 2) and Figure 10d shows the EDS spectra for all the samples. The analyses of EDS revealed stoichiometries of Fe88Co12, Fe54Co46, and Fe15Co85, for electrolyte 2, 3 and 4, respectively, proving that the FeCo thin film composition can be tuned by altering the Fe:Co ratio within the electrolyte for high electrodeposition applied voltages (Vdep = −1.8 V). Sample Fe90Co10 (Figure 10a) exhibits a rough and disordered granular morphology with larger grains of 0.34 ± 0.13 μm (Figure 11a). As the Fe content increases up to 50%, for Fe50Co50 sample (Figure 10b), the film shows a smoother morphology with much smaller grains of 0.11 ± 0.04 μm (Figure 11b). Conversely, the sample with Fe10Co90 (Figure 10c) exhibits needle-like grain shapes with long and small axes, which are characteristic of this specific stoichiometry [34]. Particle size distribution histograms were obtained for the different directions, yielding small dimensions of 0.27 ± 0.05 μm for the long axis (length) and 0.083 ± 0.018 μm for the small axis (width) (Figure 11c,d, respectively).
Figure 10e–g illustrates the cross-sections of the samples from Group II. The Fe90Co10 (Figure 10e) sample exhibits similar characteristics to those observed in the top-view images, displaying a rough morphology without a discernible regular growth trend structure. Conversely, the films with increased at. Fe content of 50% or 90%, showcase a continuous tubular morphology (Figure 10f,g, respectively).
Figure 10h presents the estimated L of the thin films from Group II as a function of the at. % of Fe content. It can be observed that as the at. % of Fe content increases, there is a linear increase in L, even when the same applied potential (Vdep = −1.8 V) is maintained. It is noteworthy that L values for the Fe10Co90 (Group II) and Fe20Co80 (Group I) samples, both at Vdep = −1.8 V, are in the same order of magnitude, with L = 1.30 ± 0.05 μm (1.4 nm/s) and L = 1.62 ± 0.12 μm (1.8 nm/s), respectively. However, when the Fe content is increased to 50% and 90%, the growth rate sharply increases to 3.6 nm/s and 4.5 nm/s, respectively, resulting in final thicknesses of L = 3.26 ± 0.11 μm and L = 4.51 ± 0.16 μm. Furthermore, a linear relationship can be estimated between the film thickness (L) and the atomic percentage of Fe content, given by: L = 0.043 ∙ at. % of Fe + 0.9. This relationship allows for the fabrication of tunable FeCo films within the range of high electrodeposition voltages.
This result is not what would be expected for two reasons. First, as discussed earlier, the j(t) and Q(t) curves (Figure 8a and Figure 9) were in the same order of magnitude, indicating similar growth rates under the applied voltage (Vdep = −1.8 V). Second, SEM images revealed films with varying L and growth rates, where samples with larger amounts of Fe lead to higher deposition rates and greater film thickness, with the Fe90Co10 sample standing out among the others. One might expect the opposite trend since the reduction of Fe is more difficult than that of Co (with reduction potentials of −0.44 V and −0.28 V, respectively) [54,55]. Hence, the greater the amount of Fe, the more difficult the deposition and growth. However, SEM cross-section images revealed that during the electrodeposition process, the Fe90Co10 sample exhibited film liftoff from the substrate while still being electrically connected in some areas. Due to the conducting nature of the FeCo thin film, it continued to deposit in the free-standing films on both sides. This curling behavior during film detachment seemed to be more pronounced with higher Fe amounts (samples 50 and 90% of Fe) during electrodeposition (Figure S4 in S.I.).
Nevertheless, a direct explanation for the relationship between the amount of Fe in the electrolyte and the different resulting deposition rates and film thickness at the same applied potential is not possible at this stage. Other factors, such as the formation of complexes and oxides during electrodeposition as parallel reactions, may play a role. Additionally, changes in pH during alloy depositions could influence the process, as the optimal reduction potential for a given applied potential might no longer be suitable [56]. Finally, the parasitic hydrogen evolution reaction has been reported to be favored over iron electrodeposition [57]. This feature has been shown to be more pronounced in j(t) curves for samples with higher Fe amounts, samples 50 and 90% of Fe (Figure 8a)).
Figure 12a shows the X-ray diffraction diffractograms for the second group of samples with different Fe:Co ratios. The XRD diffraction patterns of the Fe90Co10 and Fe50Co50 thin films present three peaks at 45°, 65° and 83° corresponding to (110), (200), and (211) crystallographic directions, respectively, similar to the first group of samples (Fe20Co80 for Vdep = −1.0 to −1.8 V). Conversely, by decreasing Fe content to 10% (Fe10Co90) the face-centered cubic (fcc) structural phase arises with pronounced diffraction peaks at (111), (200), and (220) crystallographic directions corresponding to 44°, 52° and 76°, respectively.
Furthermore, associated with the arising of fcc structural change for lower amounts of Fe (10 at. % of Fe) is the increase of the lattice parameter extracted from Fe10Co90 diffractogram, revealing the largest lattice parameter of 3.57 ± 0.06 Å, characteristic of the fcc structural phase (Figure 12b) [27,38]. The other two sample compositions, both with the bcc structural phase, presented a similar lattice parameter of ~2.8 Å, in the same range of the previously studied group of samples with Fe20Co80 composition that also presented a bcc structure. Additionally, as the structural phase changes, the particle shape also changes, as observed in SEM images for Group II.
The crystallite size obtained for the thin films Fe90Co10, Fe50Co50, and Fe10Co90 were 10.8 ± 0.1 nm, 12.2 ± 0.2 nm, and 11.5 ± 0.3 nm, respectively. For this group of samples, a small increase in crystallite size is obtained for sample Fe50Co50.
Figure 13a displays magnetization versus the magnetic field, M(H), at 300 K for the second group of samples, where similar hysteresis loops to the precious group of samples are observed. Low Hc strengths are once again obtained. However, Hc (Figure 13b) shows a minimum for the alloy Fe50Co50, a result consistently reported in the literature [2,35,36]. It is worth reinforcing, that once again, the Fe10Co90 sample stands out from the other considered sample, in this case, for the larger Hc in the group.
Overall, the sample with lower Fe content (Fe10Co90) stands out from the others in terms of nucleation time and growth, as it shows shorter nucleation times and higher growth rates, resulting in a larger final size (L). In addition, the structural analysis indicates that the sample has an fcc structure, which results in a larger lattice parameter and volume expansion compared to the other samples. Regarding magnetic characterization, although the differences are not very significant, this sample displays higher coercivity field values compared to the others. It is worth noting that these properties are likely related to the unique nucleation and growth behavior and structural characteristics of this sample.

4. Conclusions

In this work, the fabrication of FeCo alloy films by potentiostatic electrodeposition was performed, and parameters, such as the applied voltage (Vdep) and FeCo stoichiometry, were studied. It was verified that the Vdep (−1.0, −1.4, and −1.8 V), for the same electrolyte, does not affect the overall stoichiometry of the thin film, where an average of Fe23Co77 was obtained. Furthermore, adjusting Vdep allows producing granular films with varying growth rates, which directly affects the film’s morphology in terms of grain size, final thickness, and growth rates. Increasing Vdep results in smaller grains, while simultaneously increasing both the film’s thickness and growth rate. Thus, optimized films with a smoother and more homogeneous surface, characterized by smaller grains, were obtained for higher Vdep (−1.8 V). Additionally, we used Vdep = −1.8 V to investigate films with varying Fe:Co ratios in the electrolyte. This resulted in films confirmed by EDS analysis to have Fe10Co90, Fe50Co50, and Fe90Co10 compositions. The FexCo1−x alloy composition influenced the morphology at the same high Vdep (−1.8 V): (i) the grain size, (ii) the shape of the grain (ii), and (iii) the film thickness and growth rate. The composition influenced the grain morphology, resulting in larger, shapeless grains (for 90% of Fe) and smaller grains with varying shapes, ranging from round to needle-shaped (for 50% and 10% of Fe, respectively). Decreasing the Fe content in the alloy led to these variations in grain size and shape. Furthermore, increasing the at. % of Fe the film growth rate and final thickness increases.
The nucleation and growth mechanisms were inspected in detail for the two groups of samples: variation of Vdep and Fe:Co content. This was carried out by analyzing the electrodeposition curves. By increasing Vdep (for the same electrolyte), higher growth rates (and thicker films) with shorter nucleation periods were obtained. Conversely, for samples with different Fe:Co stoichiometries, the curves showed similar growth rates, film thicknesses, and nucleation periods within the same order of magnitude. However, these findings were not supported by SEM images, which revealed that thicker films (indicating higher deposition rates) were achieved when electrodepositions included larger amounts of Fe, exhibiting a linear dependence on Vdep. Notably, features such as the curvy nature and detachment of films with higher Fe content suggested the possibility of promoting double deposition, potentially affecting the final film characteristics.
An underlying analysis was performed by applying, for example, the SH model. It was verified that the nucleation stage of formation, independent of the conditions (Vdep or Fe:Co ratio), shows a nucleation of the instantaneous type. Through the same model, it was possible to calculate the number of nuclei (N). It was realized that for samples with different Vdep, higher potentials lead to a larger number of N. However, for samples with different stoichiometries, no substantial differences were obtained. Thus, while Vdep is a key feature to achieve high-rate films, with larger numbers of N leading to homogeneous and smooth films, varying the stoichiometry does not figuratively affect N.
Analyzing the XRD structural results, it was noticed that all groups of samples reveal a bcc structure with a lattice parameter of the order of 2.8 Å. However, the Fe10Co90 sample for group II shows a fcc with a lattice parameter of the order of 3.9 Å, as expected according to the bulk FeCo alloys phase diagram.
Closely correlated with structure are the results of magnetic measurements. For all groups of samples, the alloys revealed having characteristics of soft magnetic elements with coercivities within the expected literature. However, the low-Fe sample with fcc structure will have the highest coercivity (approximately twice the mean) when compared to all other samples in both groups. In summary, this sample has unique properties in terms of nucleation and growth, structure, and magnetic behavior, which distinguish it from the other samples.

Supplementary Materials

The following supporting information can be downloaded at: https://www.mdpi.com/article/10.3390/magnetochemistry9070161/s1, Figure S1: Overall j-jmin as a function of time to illustrate that the tmax increases with Vdep; Figure S2: Number of nuclei vs. applied potential (blue squares) and vs. applied potential (red circles) for the electrodeposition of FeCo on Cu substrate; Figure S3: (a,b) Top view of the thin film electrodeposited on Cu substrate using the electrolyte 1 at electrodeposition potentials of −1.4 V, and its corresponding (c) particle size distribution histogram; Figure S4: Cross-section SEM image (secondary electrons) of the thin film electrodeposited in Cu substrate using the electrolyte 4 [Fe10Co90], at electrodeposition potentials of −1.8 V.

Author Contributions

Conceptualization, S.G. and A.A.; Validation, A.A.; Formal analysis, S.G.; Investigation, S.G.; Resources, J.P.A.; Project administration, A.A.; Writing—original draft preparation S.G.; Writing—review and editing, V.A., C.T.S., J.H.B. and A.A.; Visualization, S.G.; Supervision, J.H.B. and A.A.; Funding acquisition, A.A., C.T.S. and J.P.A. All authors have read and agreed to the published version of the manuscript.

Funding

A.A. acknowledges FCT—Fundação para a Ciência e a Tecnologia, contract DL57/2016 (ref. SFRH/BPD/82010/2011) and project H2FlexiPECs’s (ref. 2022.07332.PTDC); J.H.B. acknowledges FCT, the contract DL57/2016 (ref. SFRH-BPD-87430/2012), project PTDC/FISMAC/31302/2017, PARSUK BRF project SMARTX, project NORTE-01-0145-FEDER-022096, and project PTDC/EMETED/3099/2020; C.T.S. aknowledges IF/01159/2015 and program Atraccion de Talento (CAM), ref. 2020-T1/IND-19889; The authors also acknowledges the funding by FCT and projects NORTE-01-0145-FEDER-000076 (H2INNOVATE), NORTE-01-0145-FEDER-022096 (NECL), CERN/FIS-TEC/0003/2021, POCI-01-0141-FEDER-032527, PTDC/FIS-MAC/31302/2017, PTDC/CTM-CTM/28676/2017, POCI-01-0145-FEDER-031575 and POCI-01-0145-FEDER-032257 MSCA-RISE-734801-MAGNAMED; Strategic Funding contract IFIMUP—Institute of Physics for Advanced Materials, Nanotechnology and Photonics—University of Porto, UIDB/04968/2020, UIDB/04968/2021, and Laboratory of Physics for Materials and Emergent Technologies contract LA/P/0095/2020. VMA thanks CNPq for the PCI grant 301641/2023-4.

Data Availability Statement

The data presented in this study are available on request from the corresponding author.

Conflicts of Interest

The authors declare no conflict of interest.

References

  1. Lu, W.; Huang, P.; He, C.; Yan, B. Compositional and Structural Analysis of FeCo Films Electrodeposited at Different Temperatures. Int. J. Electrochem. Sci. 2012, 7, 12262–12269. [Google Scholar]
  2. Shao, I.; Vereecken, P.M.; Chien, C.L.; Cammarata, R.C.; Searson, P.C. Electrochemical Deposition of FeCo and FeCoV Alloys. J. Electrochem. Soc. 2003, 150, C184–C188. [Google Scholar] [CrossRef]
  3. Zhou, D.; Zhou, M.; Zhu, M.; Yang, X.; Yue, M. Electrodeposition and magnetic properties of FeCo alloy films. J. Appl. Phys. 2012, 111, 07A319. [Google Scholar] [CrossRef]
  4. Redjdal, N.; Salah, H.; Hauet, T.; Menari, H.; Chérif, S.M.; Gabouze, N.; Azzaz, M. Microstructural, electrical and magnetic properties of Fe35Co65 thin films grown by thermal evaporation from mechanically alloyed powders. Thin Solid Film. 2014, 552, 164–169. [Google Scholar] [CrossRef] [Green Version]
  5. Cao, D.; Cheng, X.; Hongmei, F.; Chendong, J.; Zengtai, Z.; Pan, L.; Zhenkun, W.; Wang, J.; Liu, Q. Investigation on the structure and dynamic magnetic properties of FeCo films with different thicknesses by vector network analyzer and electron spin resonance spectroscopy. J. Alloys Compd. 2016, 688, 917–922. [Google Scholar] [CrossRef]
  6. Yang, W.; Liu, J.; Yu, X.; Wang, G.; Zheng, Z.; Guo, J.; Chen, D.; Qiu, Z.; Zeng, D. The Preparation of High Saturation Magnetization and Low Coercivity FeCo Soft Magnetic Thin Films via Controlling the Thickness and Deposition Temperature. Materials 2022, 15, 7191. [Google Scholar] [CrossRef]
  7. Ohtake, M.; Nishiyama, T.; Shikada, K.; Kirino, F.; Futamoto, M. Epitaxial growth of bcc–FexCo100−x thin films on MgO(1 1 0) single-crystal substrates. J. Magn. Magn. Mater. 2010, 322, 1947–1951. [Google Scholar] [CrossRef]
  8. Wu, Y.; Zong, B.Y.; Ng, W.B.; Li, Z.-W. Microstructure and Magnetic Anisotropy of ELectro-Deposited FeCo Thin Films. IEEE Trans. Magn. 2013, 50, 1000204. [Google Scholar] [CrossRef]
  9. Lu, W.; Huang, P.; He, C.; Yan, B. XRD, SEM and XAS studies of FeCo films electrodeposited at different current density. Int. J. Electrochem. Sci. 2013, 8, 914–923. [Google Scholar]
  10. Andrade, V.; Caspani, S.; Rivelles, A.; Bunyaev, S.; Golub, V.; Araujo, J.; Kakazei, G.; Sousa, C.; Proenca, M. Bilayered soft/hard magnetic nanowires as in-line writing heads. Mater. Des. 2022, 222, 111024. [Google Scholar] [CrossRef]
  11. Koroleva, E.; Shabalkin, I.; Krivoshapkin, P. Monometallic and alloy nanoparticles: A review of biomedical applications. J. Mater. Chem. B. 2023, 11, 3054–3070. [Google Scholar] [CrossRef] [PubMed]
  12. Fu, X.; Liu, Y.; Cao, X.; Jin, J.; Liu, Q.; Zhang, J. Feco–Nx embedded graphene as high-performance catalysts for oxygen reduction reaction. Appl. Catal. B Environ. 2013, 130, 143–151. [Google Scholar] [CrossRef]
  13. Wu, Q.; Li, T.; Wang, W.; Xiao, Y. High-throughput chainmail catalyst FeCo@C nanoparticle for oxygen evolution reaction. Int. J. Hydrog. Energy 2020, 45, 26574–26582. [Google Scholar] [CrossRef]
  14. Sun, C.; Wang, H.; Ji, S.; Wang, X.; Linkov, V.; Tian, X.; Yao, L.; Zhao, J.; Wang, R. Layer-structured FeCo bihydroxide as an ultra-stable bifunctional electrocatalyst for water splitting at high current densities. Sustain. Energy Fuels 2021, 5, 3247. [Google Scholar] [CrossRef]
  15. Zhu, M.; Zhang, C. FeCo nanoalloys encapsulated in pod-like N-doped carbon nanotubes as efficient oxygen reduction reaction electrocatalysts for zinc-air batteries. J. Alloys Compd. 2022, 921, 166122. [Google Scholar] [CrossRef]
  16. Zhu, G.; Yang, H.; Jiang, Y.; Sun, Z.; Li, X.; Yang, J.; Wang, H.; Zou, R.; Jiang, W.; Qiu, P.; et al. Modulating the Electronic Structure of FeCo Nanoparticles in N-Doped Mesoporous Carbon for Efficient Oxygen Reduction Reaction. Adv. Sci. 2022, 9, 2200394. [Google Scholar] [CrossRef] [PubMed]
  17. Song, G.; Kenney, M.; Chen, Y.-S.; Zheng, X.; Deng, Y.; Chen, Z.; Wang, S.X.; Gambhir, S.S.; Dai, H.; Rao, J. Carbon-coated FeCo nanoparticles as sensitive magnetic-particle-imaging tracers with photothermal and magnetothermal properties. Nat. Biomed. Eng. 2020, 4, 325–334. [Google Scholar] [CrossRef]
  18. Park, J.; Ro, J.; Suh, S. FeCo nanoparticles with different compositions as electrocatalysts for oxygen evolution reaction in alkaline solution. Appl. Surf. Sci. 2022, 589, 153041. [Google Scholar] [CrossRef]
  19. Nemati, R.; Abbas, M.; Ramazani, A.; Almasi, K.M. Tuning magnetostatic interaction and coercivity distributions of FeCo/Cu multilayer nanowire arrays by variation of magnetic and nonmagnetic layer aspect ratios. Phys. B Condens. Matter. 2022, 651, 414578. [Google Scholar] [CrossRef]
  20. Inyea, K.; Kim, J.; Lee, B.; Lim, J. Fabrication and Characteristics of a Conductive FeCo@Au Nanowire Alloy for Semiconductor Test Socket Connectors. Materials 2022, 16, 381. [Google Scholar] [CrossRef]
  21. Arief, I.; Biswas, S.; Bose, S. Tuning the Shape Anisotropy and Electromagnetic Screening Ability of Ultra-High Magnetic Polymer and Surfactant-Capped FeCo Nanorods and Nanocubes in Soft Conducting Composites. ACS Appl. Mater. Interfaces 2016, 8, 26285–26297. [Google Scholar] [CrossRef] [PubMed]
  22. Wang, Y.; Gao, C.; Zhang, Y.; Leung, M.K.H.; Liu, J.; Huang, S.; Liu, G.; Li, J.; Zhao, H. Bimetal-Organic Framework Derived CoFe/NC Porous Hybrid Nanorods as High-Performance Persulfate Activators for Bisphenol A Degradation. Chem. Eng. J. 2020, 421, 127800. [Google Scholar] [CrossRef]
  23. Hu, H.; Xie, Y.; Kazim, F.; Qu, K.; Li, M.; Xu, Z.; Yang, Z. Synergetic FeCo nanorods embedded in nitrogen doped carbon nanotubes with abundant metal-NCNT heterointerfaces as efficient air electrocatalyst for rechargeable zinc-air batteries. Sustain. Energy Fuels 2020, 4, 5188–5194. [Google Scholar] [CrossRef]
  24. Kozlovskiy, A.; Zdorovets, M.; Kadyrzhanov, K. FeCo nanotubes: Possible tool for targeted delivery of drugs and proteins. Appl. Nanosci. 2019, 9, 1091–1099. [Google Scholar] [CrossRef]
  25. Singh Dev, A.; Bera, A.; Gupta, P.; Srihari, V.; Pandit, P.; Betker, M.; Schwartzkopf, M.; Roth, S.; Kumar, D. Oblique angle deposited FeCo multilayered nanocolumnar structure: Magnetic anisotropy and its thermal stability in polycrystalline thin films. Appl. Surf. Sci. 2022, 590, 153056. [Google Scholar] [CrossRef]
  26. Nickel, B.; Donner, W.; Dosch, H.; Detlefs, C.; Grubel, G. Critical Adsorption and Dimensional Crossover in Epitaxial FeCo Films. Phys. Rev. Lett. 2000, 85, 134–137. [Google Scholar] [CrossRef]
  27. Ambrose, T.; Krebs, J.; Bussmann, K.; Prinz, G.A. Magnetic and structural properties of face-centered-cubic FexCo1−x alloys on diamond. J. Appl. Phys. 1999, 85, 5066–5068. [Google Scholar] [CrossRef]
  28. Hunter, D.; Osborn, W.; Wang, K.; Kazantseva, N.; Hattrick-Simpers, J.; Suchoski, R.; Takahashi, R.; Young, M.; Mehta, A.; Bendersky, L.; et al. Giant magnetostriction in annealed Co1−xFex thin-films. Nat. Commun. 2011, 2, 518. [Google Scholar] [CrossRef] [Green Version]
  29. Jung, H.S.; Doyle, W.D.; Matsunuma, S. Influence of underlayers on the soft properties of high magnetization FeCo films. J. Appl. Phys. 2003, 93, 6462–6464. [Google Scholar] [CrossRef]
  30. Takahashi, Y.K.; Hono, K.; Miyake, Y.; Kaneko, D.; Kanai, H. 3DAP analysis of FeCo electrodeposited soft magnetic films with high Bs. In Proceedings of the IEEE International Magnetic Conference (INTERMAG), Nagoya, Japan, 17 October 2005; pp. 565–566. [Google Scholar] [CrossRef]
  31. Sousa, C.T.; Leitao, D.L.; Proenca, M.P.; Ventura, J.; Pereira, A.M.; Araujo, J.P. Nanoporous alumina as templates for multifunctional applications. Appl. Phys. Rev. 2014, 1, 031102. [Google Scholar] [CrossRef]
  32. Glasstone, S.; Speakman, J.C. The electro-deposition of Iron-Cobalt Alloys. Parte, I. Trans. Faraday Soc. 1933, 29, 426–429. [Google Scholar] [CrossRef]
  33. Glasstone, S.; Speakman, J.C. The electro-deposition of Iron-Cobalt Alloys. Parte II. Trans. Faraday Soc. 1932, 28, 733–740. [Google Scholar] [CrossRef]
  34. Cheung, C.K.S. Synthesis and microstructural characterization of electrodeposited nanocrystalline soft magnets. Ph.D. Thesis, Queens University, Kingston, ON, Canada, 2011. [Google Scholar]
  35. Cooke, M.; Wang, L.-C.; Watts, R.; Zuberek, R.; Heydon, G.; Rainforth, W.; Gehring, G. The effect of thermal treatment, composition and substrate on the texture and magnetic properties of FeCo thin films. J. Phys. D Appl. Phys. 2000, 33, 1450. [Google Scholar] [CrossRef]
  36. Yang, F.; Yao, J.; Min, J.J.; Li, J.H.; Chen, X. Synthesis of high saturation magnetization FeCo nanoparticles by polyol reduction method. Chem. Phys. Lett. 2016, 648, 143–146. [Google Scholar] [CrossRef] [Green Version]
  37. Sides, W.; Kassouf, N.; Huang, Q. Electrodeposition of Ferromagnetic FeCo and FeCoMn Alloy from Choline Chloride Based Deep Eutectic Solvent. J. Electrochem. Soc. 2019, 166, D77–D85. [Google Scholar] [CrossRef]
  38. Aguirre, M.d.C.; Farías, E.; Abraham, J.; Urreta, S.E. Co100−xFex magnetic thick films prepared by electrodeposition. J. Alloys Compd. 2015, 627, 393–401. [Google Scholar] [CrossRef]
  39. Okamoto, H. Co-Fe (Cobalt-Iron). J. Phase Equilibria Diffus. 2008, 29, 383–384. [Google Scholar] [CrossRef]
  40. Ustinovshikov, Y.; Pushkarev, B. Ordering and phase separation in alloys of the Fe–Co system. J. Alloys Compd. 2006, 424, 145–151. [Google Scholar] [CrossRef]
  41. Pise, M.; Muduli, M.; Chatterjee, A.; Kashyap, B.; Singh, R.; Tatiparti, S.S. Instantaneous-Progressive nucleation and growth of palladium during electrodeposition. Results Surf. Interfaces 2022, 6, 100044. [Google Scholar] [CrossRef]
  42. Mentar, L. Early stages of cobalt-copper alloys electrodeposition onto fluorine-doped tin oxide electrodes in sulfate solution. Orient. J. Chem. 2011, 27, 477–483. [Google Scholar]
  43. D’Ajello, P.C.T.; Munford, M.L.; Pasa, A.A. Transient equations for multiple nucleation on solid electrodes: A stochastic description. J. Chem. Phys 1999, 111, 4267. [Google Scholar] [CrossRef]
  44. Alvarez, A.E.; Salinas, D.R. Formation of Cu/Pd bimetallic crystals by electrochemical deposition. Electrochim. Acta 2010, 55, 3712–3720. [Google Scholar] [CrossRef]
  45. Mashreghi, A.; Zare, H. Investigation of nucleation and growth mechanism during electrochemical deposition of nickel on fluorine doped tin oxide substrate Current. Appl. Phys. 2016, 16, 599–604. [Google Scholar] [CrossRef] [Green Version]
  46. Razei, M.; Ghorbani, M.; Dolati, A. Electrochemical investigation of electrodeposited Fe–Pd alloy thin films. Electrochim. Acta 2010, 56, 483–490. [Google Scholar] [CrossRef]
  47. Bento, R.; Mascaro, L. Analysis of the initial stages of electrocrystallization of Fe, Co and Fe-Co alloys in chloride solutions. J. Braz. Chem. Soc. 2002, 13, 502–509. [Google Scholar] [CrossRef]
  48. Bertazzoli, R.; Pletcher, D. Studies of the mechanism for electrodeposition of Fe-CO alloys. Electrochim. Acta 1993, 38, 671–676. [Google Scholar] [CrossRef]
  49. Bran, C.; Palmero, E.; Li, Z.-A.; Real, R.P.; Spasova, M.; Farle, M.; Vázquez, M. Correlation between structure and magnetic properties in CoxFe100−x nanowires: The roles of composition and wire diameter. J. Phys. D Appl. Phys. 2015, 48, 145304. [Google Scholar] [CrossRef]
  50. Patterson, A.L. The Scherrer Formula for X-ray Particle Size Determination. Phys. Rev. 1939, 56, 978–982. [Google Scholar] [CrossRef]
  51. Zhou, X.; Wang, Y.; Zhipeng, L.; Jin, H. Electrochemical Deposition and Nucleation/Growth Mechanism of Ni–Co–Y2O3 Multiple Coatings. Materials 2018, 11, 1124. [Google Scholar] [CrossRef] [Green Version]
  52. Scharifker, B.; Graham, H. Theoretical and experimental studies of multiple nucleation. Electrochim. Acta 1983, 28, 879–889. [Google Scholar] [CrossRef]
  53. Gamburg, Y.D.; Zangari, G. Theory and Practice of Metal Electrodeposition; Springer: New York, NY, USA, 2011. [Google Scholar]
  54. Petrucci, R.H.; Harwood, W.S.; Herring, G.F.; Madura, J.D. General Chemistry: Principles and Modern Applications, 9th ed.; Pearson Prentice Hall: Upper Saddle River, NJ, USA, 2007. [Google Scholar]
  55. Diaz, S.; Calderón, J.; Barcia, O.; Mattos, O.R. Electrodeposition of iron in sulphate solutions. Electrochim. Acta 2008, 53, 7426–7435. [Google Scholar] [CrossRef]
  56. Matlosz, M. Competitive Adsorption Effects in the Electrodeposition of Iron-Nickel Alloys. J. Electrochem. Soc. 1993, 140, 2272–2279. [Google Scholar] [CrossRef]
  57. Jayathilake, B.; Plichta, E.; Hendrickson, M.; Narayanan, S. Improvements to the Coulombic Efficiency of the Iron Electrode for an All-Iron Redox-Flow Battery. J. Electrochem. Soc. 2018, 165, A1630–A1638. [Google Scholar] [CrossRef]
Figure 1. Potentiostatic current transients for the electrodeposition of electrolyte 1 [Fe20Co80] on Cu substrate at −1.0 V. Different stages of electrodeposition are represented: (I) charge of the electric double layer at the electrode; (II) nucleation/growth; (III) and continuous deposition.
Magnetochemistry 09 00161 g001
Figure 2. (a) Potentiostatic current transients for the electrodeposition of electrolyte 1 [Fe20Co80] on Cu substrate at different potentials. (b) Maximum current density, jmax (red squares), and the corresponding time, tmax (blue circles) as a function of applied potential. Dependence between (c) j vs. t1/2 and (d) j vs. t3/2 for early stages of current transient curves of the electrodeposition.
Magnetochemistry 09 00161 g002
Figure 3. Charge transferred density during the potentiostatic electrodeposition of the electrolyte 1 [Fe20Co80] as a function of time for different applied potentials, Vdep = −1.0, −1.4, and −1.8 V.
Magnetochemistry 09 00161 g003
Figure 4. (ac) Top view and (eg) cross-section view obtained by SEM (secondary electrons) of the thin films electrodeposited on Cu substrate using the electrolyte 1 at electrodeposition potentials of −1.0 V, −1.4 V, and −1.8 V, for a mean Fe23Co77 stoichiometry obtained by (d) EDS and (h) thickness (L) of the thin films as a function of the applied potential (Vdep).
Magnetochemistry 09 00161 g004
Figure 5. Particle size distribution histograms of the thin films electrodeposited in Cu substrate using the electrolyte 1 at electrodeposition potentials of (a) −1.0 V, (b) −1.4 V, and (c) −1.8 V.
Magnetochemistry 09 00161 g005
Figure 6. (a) XDR diffraction patterns showing a single bcc structural phase and the (b) crystallite size (green circles) and lattice parameter (blue squares) of the thin films synthesized with the electrolyte 1 [Fe20Co80] at different applied potentials of −1.0, −1.4, and −1.8 V.
Magnetochemistry 09 00161 g006
Figure 7. (a) Magnetic hysteresis loops and (b) coercive magnetization at 300 K of the thin films synthesized with the electrolyte 1 [Fe20Co80] at different applied potentials of −1.0, −1.4, and −1.8 V.
Magnetochemistry 09 00161 g007
Figure 8. (a) Potentiostatic current transients for the electrodeposition of electrolyte 2 [Fe90Co10], 3 [Fe50Co50], and 4 [Fe10Co90] on Cu substrate with applied potential of −1.8 V. (b) Maximum current density, jmax (red squares), and the corresponding time, tmax (blue circles) as a function of applied potential. Dependence between (c) j vs. t1/2 and (d) j vs. t3/2 for early stages of current transient curves of the electrodeposition.
Magnetochemistry 09 00161 g008
Figure 9. Charge transferred density during the potentiostatic electrodeposition of the electrolyte 2 [Fe90Co10], 3 [Fe50Co50], and 4 [Fe10Co90] as a function of time for different at. % of Fe:Co composition.
Magnetochemistry 09 00161 g009
Figure 10. (ac) Top view and (eg) cross-section view obtained by SEM (secondary electrons) of the thin films electrodeposited on Cu substrate using electrolytes 2 [Fe90Co10], 3 [Fe50Co50], and 4 [Fe10Co90] at electrodeposition potentials of −1.8 V, and (d) the respective stoichiometries obtained by EDS. (h) Length of the thin films.
Magnetochemistry 09 00161 g010
Figure 11. Particle size distribution histograms of the thin films electrodeposited at applied potential of −1.8 V, for the different electrolytes compositions Fe:Co: (a) electrolyte 2 [Fe90Co10], (b) electrolyte 3 [Fe50Co50], electrolyte 4 [Fe10Co90] along the (c) length and the (d) width of the needle-type particles.
Magnetochemistry 09 00161 g011
Figure 12. (a) XDR diffraction patterns and (b) crystallite size (green dots) and lattice parameter (blue dots) of the thin films synthesized with electrolytes 2 [Fe90Co10], 3 [Fe50Co50] and 4 [Fe10Co90] at applied potential of −1.8 V.
Magnetochemistry 09 00161 g012
Figure 13. (a) Magnetic hysteresis loops and (b) coercive magnetization at 300 K of the thin films synthesized with the electrolyte 2 [Fe90Co10], 3 [Fe50Co50], and 4 [Fe10Co90] at applied potentials of −1.8 V.
Magnetochemistry 09 00161 g013
Table 1. Electrolytes used, including electrolyte name, theoretical stoichiometry and molar concentrations of FeSO4·7H2O, CoSO4·7H2O, H3BO3, and C6H8O6.
Electrolyte Name1234
Theoretical StoichiometryFe20Co80Fe90Co10Fe50Co50Fe10Co90
FeSO4·7H2O0.036 M0.16 M0.09 M0.02 M
CoSO4·7H2O0.16 M0.02 M0.09 M0.16 M
H3BO30.16 M
C6H8O60.06 M
Table 2. Groups of samples prepared with the respective electrolyte, theoretical stoichiometry, and applied potential.
Electrolyte NameTheoretical StoichiometryApplied Potential (V)
Group I1Fe20Co80−1.0
−1.4
−1.8
Group II2Fe90Co10−1.8
3Fe50Co50
4Fe10Co90
Disclaimer/Publisher’s Note: The statements, opinions and data contained in all publications are solely those of the individual author(s) and contributor(s) and not of MDPI and/or the editor(s). MDPI and/or the editor(s) disclaim responsibility for any injury to people or property resulting from any ideas, methods, instructions or products referred to in the content.

