Article

Integrative Metabolome and Transcriptome Analyses Reveal the Molecular Mechanism of Yellow-Red Bicolor Formation in Kalanchoe blossfeldiana Petals

1
College of Agriculture and Forestry Science, Linyi University, Linyi 276000, China
2
College of Landscape Architecture, Beijing Forestry University, Beijing 100083, China
*
Author to whom correspondence should be addressed.
Horticulturae 2023, 9(7), 844; https://doi.org/10.3390/horticulturae9070844
Submission received: 25 June 2023 / Revised: 19 July 2023 / Accepted: 19 July 2023 / Published: 24 July 2023

Abstract

:
The winter pot kalanchoe (Kalanchoe blossfeldiana) is an ornamental plant with succulent leaves and clustered flowers in Crassulaceae, widely used as a potted flower or garden decoration. In nature, the bicolor petal is an interesting phenomenon, and breeders have succeeded in cultivating the winter pot kalanchoe with bicolored petals. However, its potential molecular mechanism of pigmentation is poorly understood. This study collected a yellow-red colored winter pot kalanchoe to investigate the molecular mechanism underlying its bicolor formation using the integrative analyses of metabolome and transcriptome. The metabolome results showed that both flavonoid and carotenoid co-existed in the winter pot kalanchoe petals, whereas only anthocyanin accumulation showed significant differences—about nineteen times higher in the red region than that in the yellow region. The differentially expressed genes were significantly enriched in the anthocyanin biosynthesis pathway, and the expression level of biosynthetic genes, including KbCHS, KbCHI, KbF3H, KbDFR, KbANS and KbGTs, were significantly upregulated in the red region. Moreover, transcription factors potentially regulating anthocyanin biosynthesis were predicted, and KbMYB2 and KbbHLH1 might play important roles in positively regulating anthocyanin biosynthesis in the red region. The findings reported here provide new insights into the understanding of petal bicolor formation mechanisms and will assist cultivar innovation in winter pot kalanchoe.

1. Introduction

Flower color is one of the most attractive traits in ornamental plants. In nature, most ornamental plants possess single and pure flower colors, but a few exhibit two colors in the same petal, such as Senecio cruentus, Paeonia rockii, Viola × wittrockiana, Clarkia gracilis and Lilium, which often exhibit color differences at the basal section of petals [1,2,3,4,5]. The bicolor patterns can be obtained through natural selection, artificial hybridization, radiation mutation, genetic engineering and viral infection [6,7]. From the perspective of evolution, the bicolor pattern of flowers is more attractive for pollinators to help plants spread pollen. Meanwhile, this kind of pigmentation increases ornamental value to attract customers and becomes a key goal for breeders in cultivar innovation.
The accumulation of certain compounds accounts for diverse flower color formation, and there are mainly four pigments endowing flower colors, including chlorophylls, carotenoids, betalains and flavonoids [8,9,10]. Commonly, chlorophylls confer green color, carotenoids and betalains confer yellow–red colors, and flavonoids confer colors varying from orange or red to violet or blue. Flavonoids, characterized by a C6-C3-C6 structure, are widely found in higher plant organs with 9000 types and are classified into seven subgroups including anthocyanidins, flavones, flavonols, flavanones, flavanols, isoflavones and chalcones, which have antioxidant effects to promote human health [11,12,13,14,15].
Anthocyanins, a water-soluble subgroup, can be further divided into pelargonidin, cyanidin, delphinidin, petunidin, peonidin and malvidin according to the diverse modifications of the B-ring [16]. Its biosynthesis pathway is sequentially catalyzed by phenylalanine ammonia lyase (PAL), cinnamate-4-hydroxylase (C4H), 4-coumarate: CoA ligase (4CL), chalcone synthase (CHS), chalcone isomerase (CHI), flavanone-3-hydroxylase (F3H), flavonoid 3′-hydroxylase (F3’H), dihydroflavonol 4-reductase (DFR), anthocyanidin synthase (ANS), glucosyltransferase (GT), acyltransferase (AT) and methyltransferase (MT) [8,17]. The expression levels of these structural genes are synergistically regulated by the MYB-bHLH-WDR complex [18,19,20,21].
The space-specific anthocyanin accumulation in different regions on the same petal commonly accounts for the formation of bicolor patterns. On the one hand, biosynthetic genes as well as upstream transcription factors influence anthocyanin accumulation in different regions on the same petal. In cineraria, two MADS-box transcription factors, ScAG and ScAGL11, act as inhibitors in anthocyanin biosynthesis, and the colorless region on the bicolored ray-floret becomes smaller once ScAG and ScAGL11 are knocked down [1]. On the other hand, post-transcriptional gene silencing also leads to anthocyanin loss. In lotus, the transcribed NnUFGT2 is degraded, leading to the failure of the glycosylation of anthocyanidin accumulating in the white part [22]. Moreover, the post-transcriptional silencing of CHS is also involved in the bicolor formation in dahlias, Camellia japonica, Petunia hybrida and gentian [7,23,24,25].
Recently, the integrative analyses of metabolome and transcriptome have been widely used to screen out differentially accumulated metabolites and expressed genes in a high throughput manner, which efficiently prompts the exploration of potential mechanisms underlying main traits, such as flower coloration [22,26,27,28], fruit quality [29,30,31,32] and stress resistance [33,34,35,36]. In Lagerstroemia indica, the different accumulation of malvidin-3,5,-di-O-glucoside was found to lead to its color diversity using metabolomic analysis, which could be addressed by the differential expression of F3′5′H and F3′H through further transcriptomic analysis [37]. Furthermore, the higher abundance of seven anthocyanidin derivatives accounts for the deeper coloration in miniature roses, which is consistent with its higher expression level of thirteen anthocyanin biosynthetic genes observed using integrative metabolome and transcriptome analyses [38]. To conclude, these findings will provide insights into the cultivar innovation of novel flower colors in ornamental plants.
Kalanchoe blossfeldiana, often known as winter pot kalanchoe, is a kind of popular succulent plant belonging to the Crassulaceae family with vivid petal colors, such as pink, red, orange, white, yellow, etc. In addition to these pure colors, breeders have also innovated bicolored cultivars with yellow and red colors on the same petal. However, the underlying metabolic and genetic mechanisms of its bicolor formation remain unclear. In the present study, the winter pot kalanchoe with yellow and red regions on the same petal was used to explore the molecular mechanism of bicolor formation. Twelve metabolomes and six transcriptomes were synthetically conducted to screen out the differentially accumulated metabolites and dig out key candidate genes involved in the bicolor formation. This work will provide new insights into the understanding of the petal bicolor formation mechanism in the winter pot kalanchoe.

2. Materials and Methods

2.1. Plant Material

The plants of bicolored Kalanchoe blossfeldiana were purchased from the local market (Figure 1A). The yellow and red color regions in the outer petal of the bud (Figure 1B) were cut separately, precooled in liquid nitrogen, then stored at −80 °C immediately for metabolome and transcriptome analyses.

2.2. Petal Color Description

The Royal Horticultural Society Color Chart (RHSCC) was used to describe the phenotypes of different color regions qualitatively; meanwhile, a precise quantitative analysis was also performed by use of a colorimeter (Avantes AvaSpec-2048 L, Amsterdam, The Netherlands) according to our previous method [39] and eight measurements were repeated for each color region.

2.3. Metabolic Analysis

A total of 50 mg of the samples was grounded into powder using a grinder (DHS Life Science and Technology Co., Ltd., Beijing, China) at 45 Hz for 10 min, then dissolved in 1000 μL extraction liquid (CH3OH:CH3CN:H2O = 2:2:1, v:v:v) mixed with 20 mg/L internal standard, processed ultrasonically for 10 min (Xiao Mei Chao Sheng Instrument Co., Ltd., Kunshan, China), followed by extraction at −20 °C for 1 h, and centrifuged at 12,000 rpm for 15 min (Shanghai Nonin Biological Technology Co., Ltd., Shanghai, China); 500 μL supernate was transferred into a new centrifuge tube and then dried in a vacuum concentrator (Beijing JM Technology Co., Ltd., Beijing, China). The obtained dry metabolite was then re-dissolved in 160 μL extract liquid (CH3CN:H2O = 1:1, v:v) and centrifuged at 12,000 rpm for 15 min. Then 120 μL supernate was filtered into a 2 mL sample bottle for later detection. Six replicates were performed for each color region. The metabolite was separated and identified using a Waters Acquity I-Class PLUS ultra-high performance liquid tandem Waters Xevo G2-XS QTOF high resolution mass spectrometer. The analysis was performed with gradient elution using 0.1% formic acid aqueous solution (solvent A) and 0.1% formic acid acetonitrile (solvent B) as the mobile phase at a flow of 400 μL/min. The gradient conditions were as follows: 98% A at 0.00 and 0.25 min, 2% A at 10.00 and 13.00 min, followed by 98% A at 13.10 and 15.00 min. A 1 μL sample was injected for the detection.
The Waters Xevo G2-XS QTOF high resolution mass spectrometer was used to collect the primary and secondary mass spectrometry data in MSe mode using the MassLynx V4.2 software. The parameters were set as follows: the low collision energy, 2 V; the high collision energy, 10–40 V; capillary voltage, 2000 V (+)/−1500 V(−); cone voltage, 30 V; ion source temperature, 150 °C; desolvent gas temperature, 500 °C; backflush gas flow rate, 50 L/h; desolventizing gas flow rate, 800 L/h. The Progenesis QI software was applied to process the raw data for peak extraction, peak alignment, etc. The metabolites were identified according to the Progenesis QI software online METLIN database and Biomark’s library. Meanwhile, the theoretical fragment identification and mass deviation AII were within 100 ppm.

2.4. RNA-Sequencing, Assembly and Gene Functional Annotation

The Quick RNA Isolation Kit (Huayueyang Biotechnology Co., Ltd., Beijing, China) was used for RNA extraction with three biological replicates for each color region, followed by purity and concentration detection using the NanoDrop 2000 spectrophotometer as well as integrity detection using the Agient2100/LabChip GX. The NEBNext®Ultra™ RNA Library Prep Kit for Illumina ®(NEB, Boston, MA, USA) was used to prepare the libraries following the manufacturer’s recommendations. A total of six libraries were sequenced on an Illumina Hiseq 2000 platform, followed by transcriptome assembly and gene functional annotation conducted as described previously [40].

2.5. Differential Expression Analysis, qRT-PCR Verification and Protein Interaction Prediction

The differential expression genes between the two color regions were screened out using the DESeq R package. Genes with an adjusted p-value < 0.05 were considered as differentially expressed, followed by real-time quantitative reverse transcription polymerase chain reaction (qRT-PCR) to verify the gene expression level obtained from the transcriptome using SYBR Premix Ex Taq (Takara, Shiga, Japan). All primers used in the present study are listed in Table S1, and Actin was used to normalize the gene expression level. Moreover, an online software STRING was performed to predict the interaction network of candidate transcription factors.

3. Results

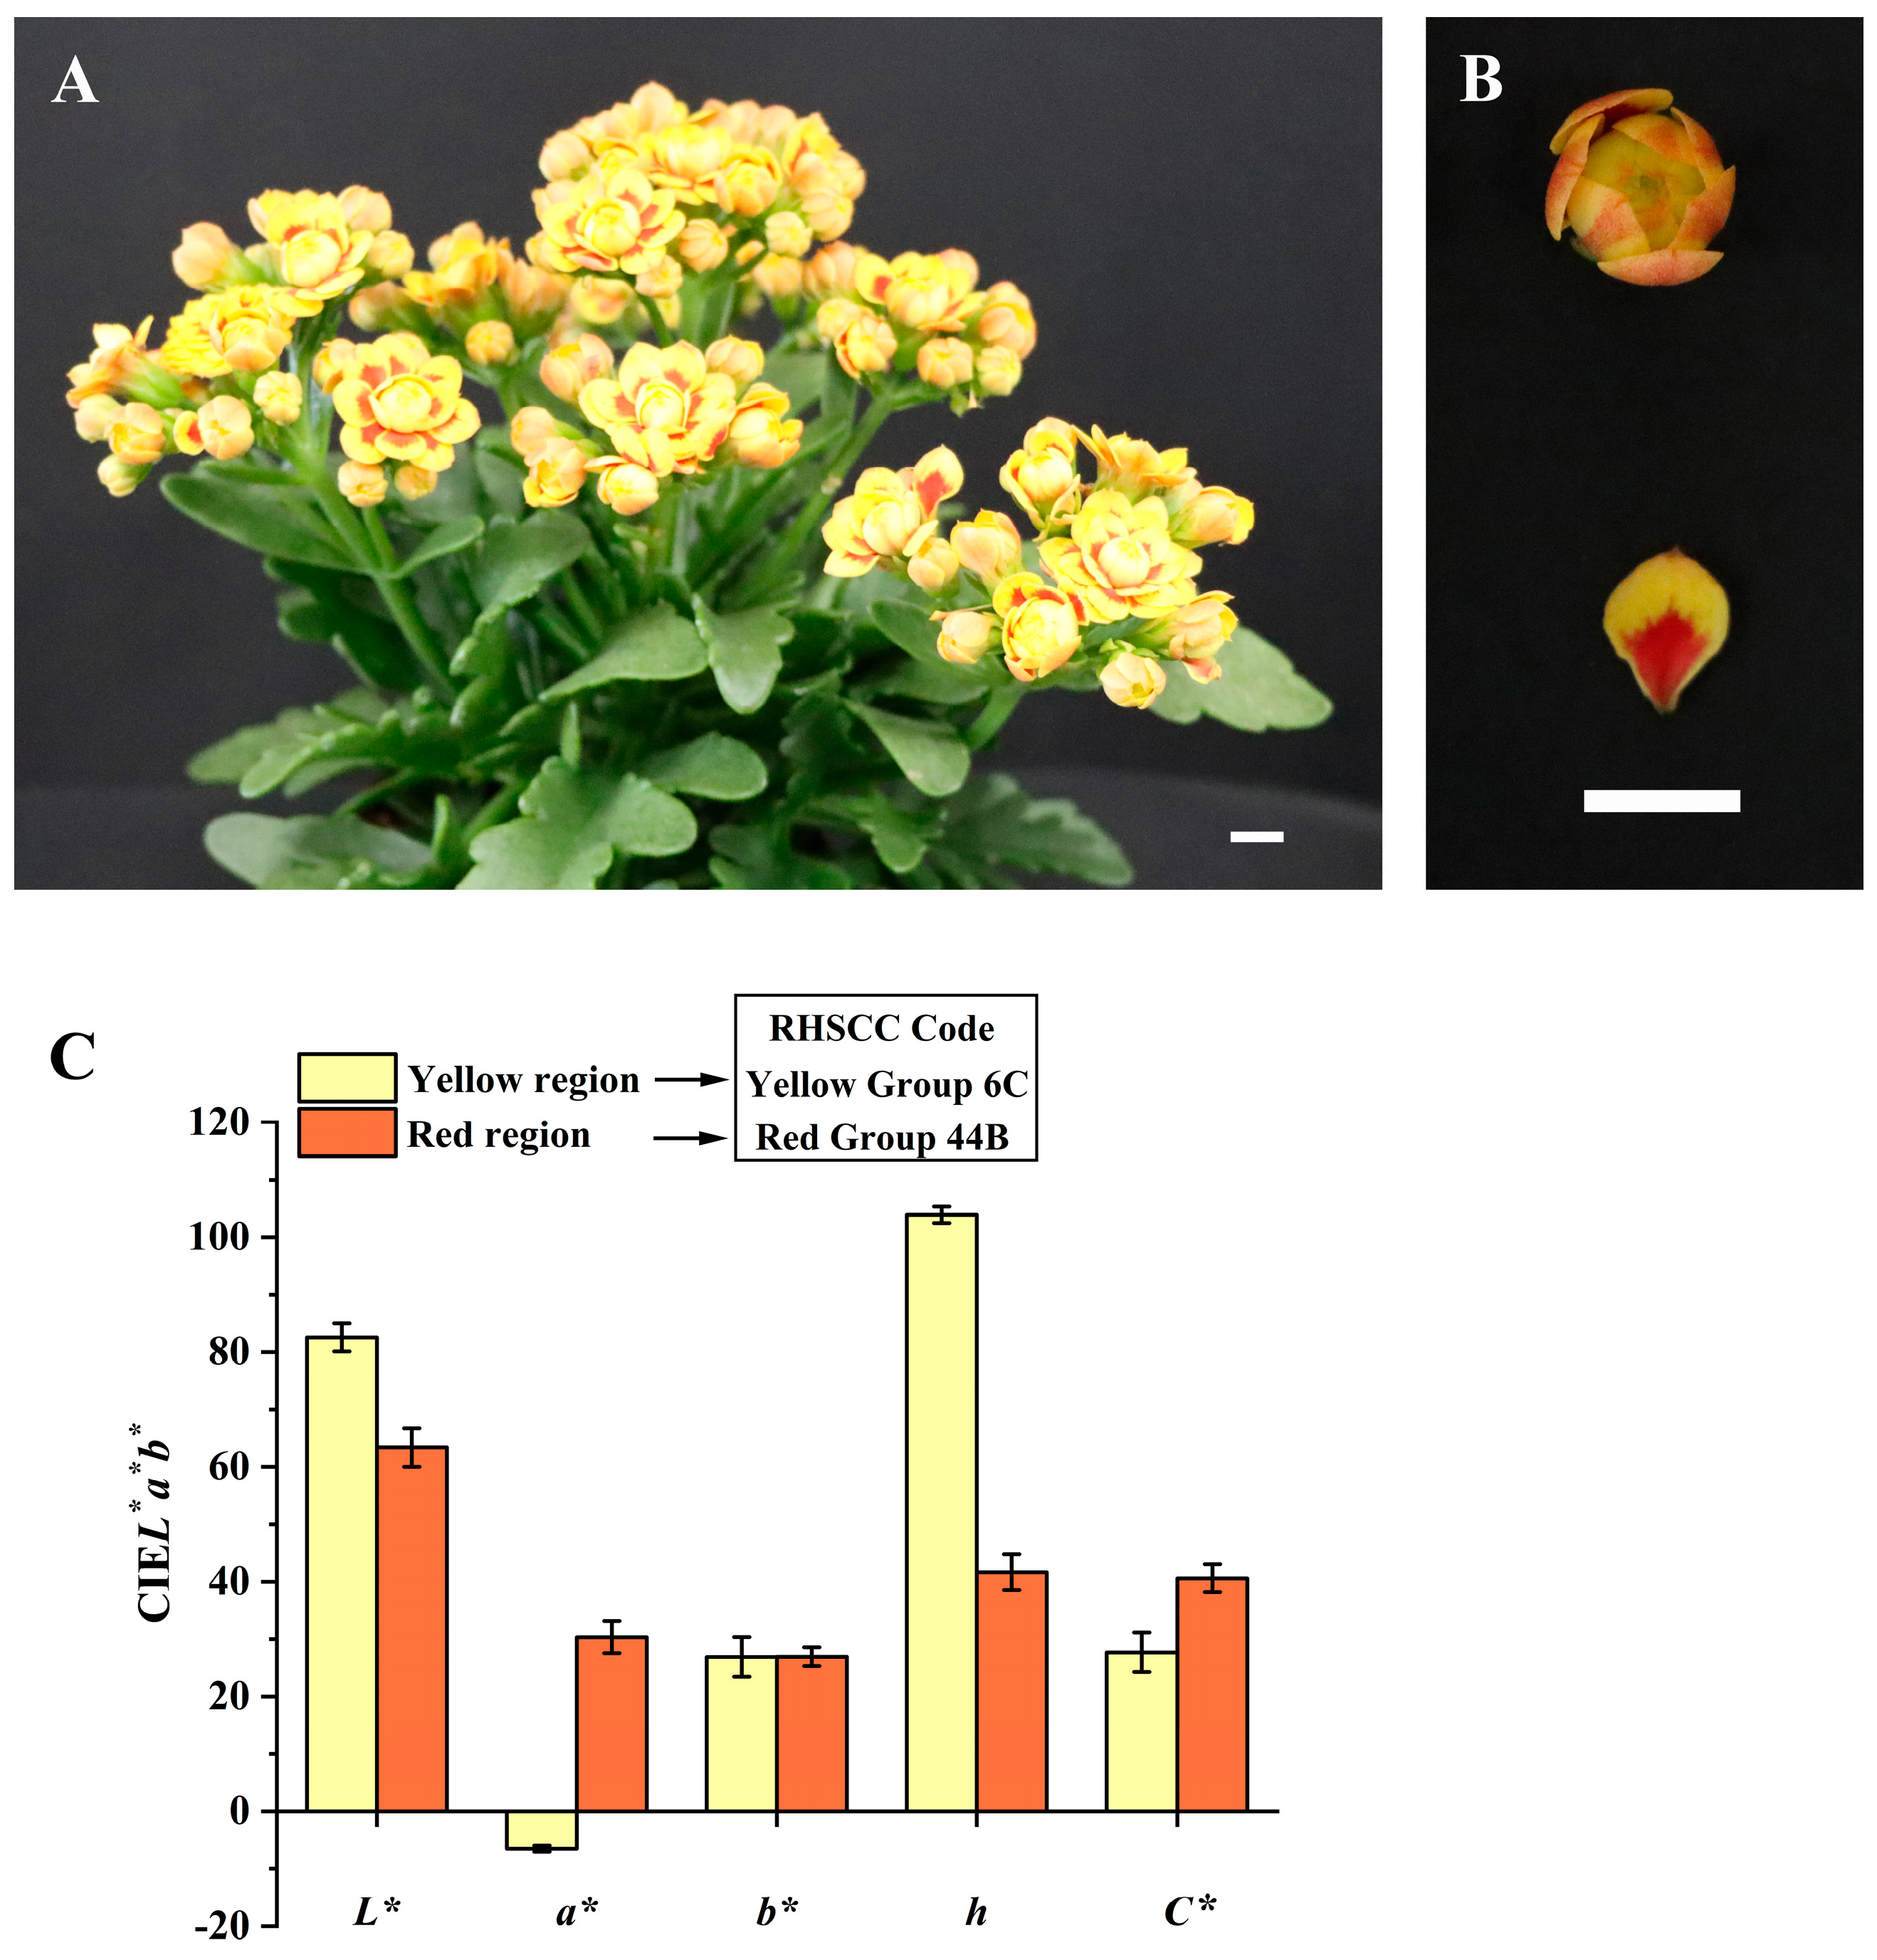
3.1. Petal Color Phenotypes

Both RHSCC and colorimeter were used to precisely describe the color phenotypes of the different color regions in bicolored petals. According to the RHSCC, the yellow and red regions belong to the yellow group 6C and red group 44B, respectively. The quantitative description detected by the colorimeter showed that the values of L* and h in the yellow region were higher than those in the red region while the values of a* and C* in the red region were higher than those in the yellow region (Figure 1C).

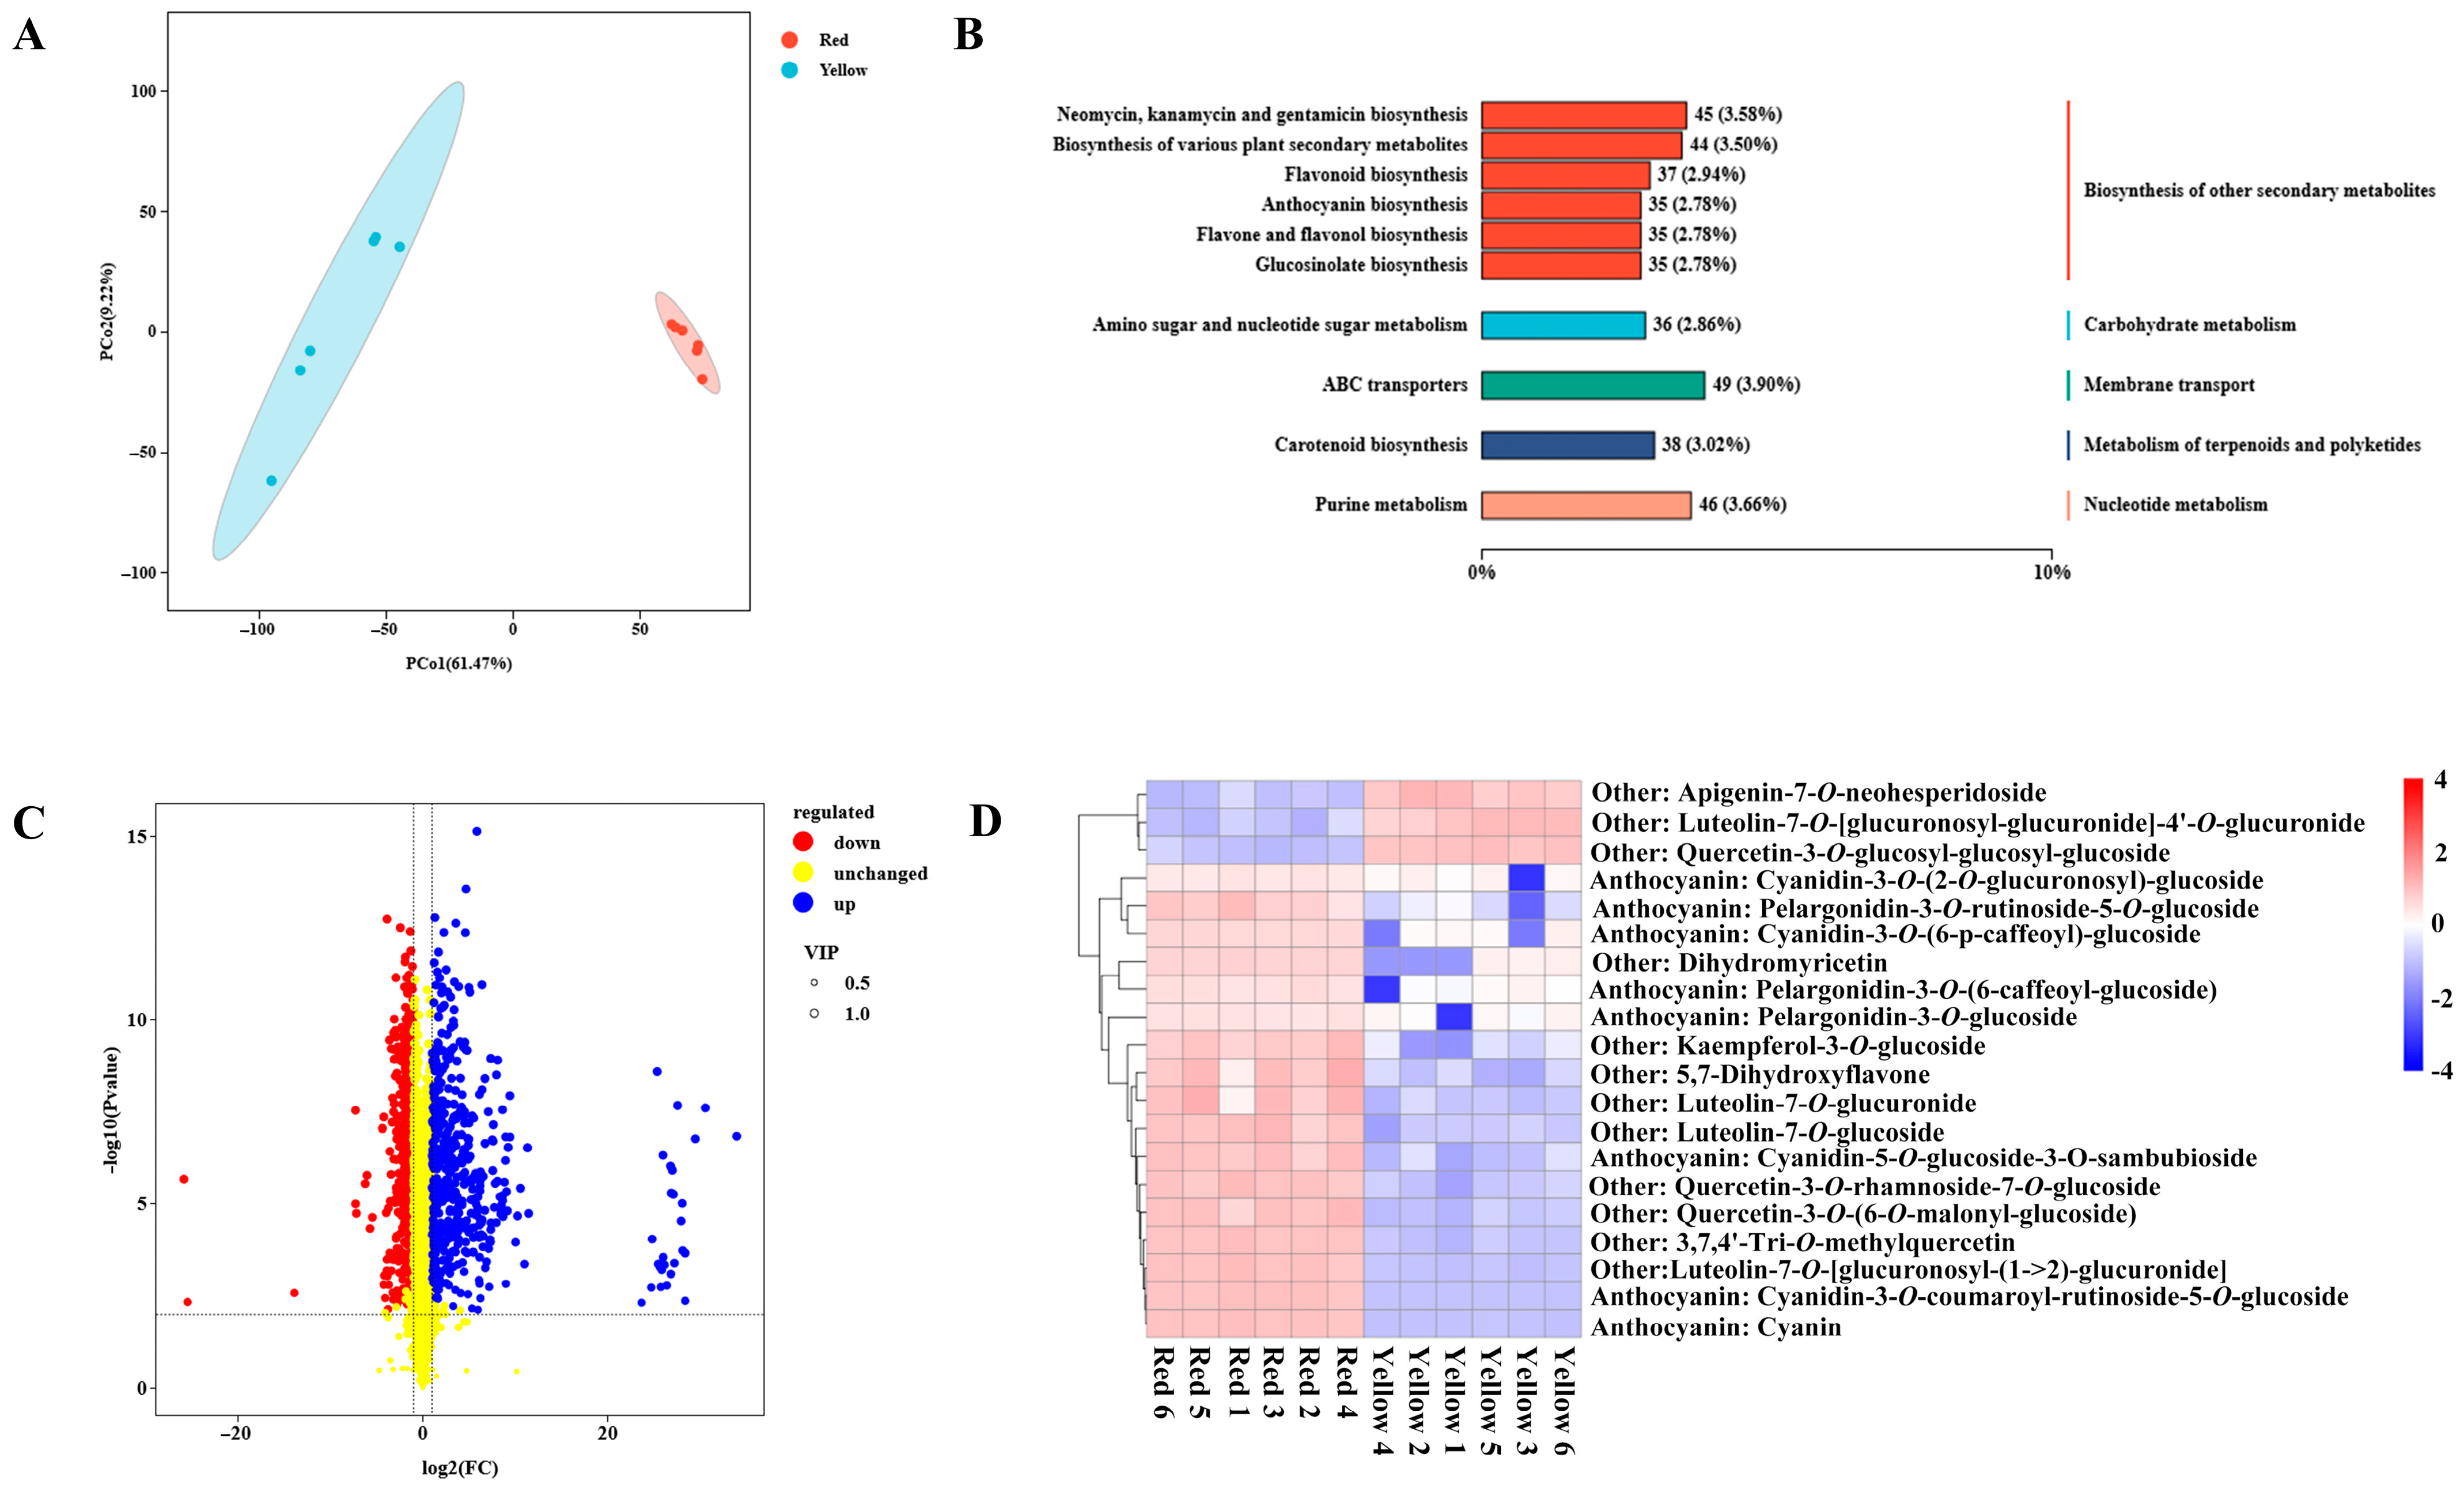
3.2. Global View of Metabolic Differences between Two Color Regions

UPLC-MS/MS analysis was performed to compare metabolic differences between the yellow and red regions in the petals of the winter pot kalanchoe. Two principal components (PC1 and PC2) were recovered from the PCoA score plot, each accounting for 61.47% and 9.22% of the variance, respectively (Figure 2A). The two accessions were segregated clearly, and six replicates of each color region were brought together. Moreover, the correlation analysis also exhibited a strong relationship among the six replicates, with the value of the Spearman rank correlation higher than 0.96 (Figure S1). These results illustrate that the repeatability was of high quality among the six replicates, which satisfied the standard for further analysis. In total, 3410 metabolites were successfully annotated, which were mainly involved in five ko pathways, including biosynthesis of other secondary metabolites, carbohydrate metabolism, membrane transport, metabolism of terpenoids and polyketides, and nucleotide metabolism (Figure 2B). Notably, pathways of carotenoid, flavonoid, anthocyanin, flavone and flavonol biosynthesis were significantly enriched (Figure 2B), suggesting that two main pigments, flavonoid and carotenoid, played important roles in the petal coloration in Kalanchoe blossfeldiana.

3.3. Differentially Accumulated Metabolites Involved in Pigment Biosynthesis

A total of 970 metabolites appeared significantly different (FC ≥ 2 or FC ≤ 0.5, p-value < 0.01, VIP ≥ 1), including 477 up-regulated and 493 down-regulated in the yellow vs. red comparison (Figure 2C). In order to explore the chemical mechanism underlying the coloration differences, we further focused on the differentially accumulated metabolites (DAMs), mainly including derivatives of flavonoid and carotenoid. Finally, a total of 20 DAMs were found, including eight anthocyanins, one flavonoid, six flavones, and five flavonols (Table S2). The KEGG enrichment analysis indicated that pathways of flavone and flavonol biosynthesis (ko00944), anthocyanin biosynthesis (ko00942) and flavonoid biosynthesis (ko00941) were significantly enriched (Figure S2). It is well known that anthocyanin plays a crucial role in deciding petal coloration; therefore, our research focused on comparing the anthocyanin accumulation in the yellow and red regions. In total, there were eight anthocyanins identified, including five cyanidin derivatives and three pelargonidin derivatives, and the accumulation level of all these anthocyanins was significantly higher in the red region than that in the yellow region (Figure 2D; Table S2). Moreover, the anthocyanins accumulating in the yellow region were probably from the sporadically distributed red stripes or spots.

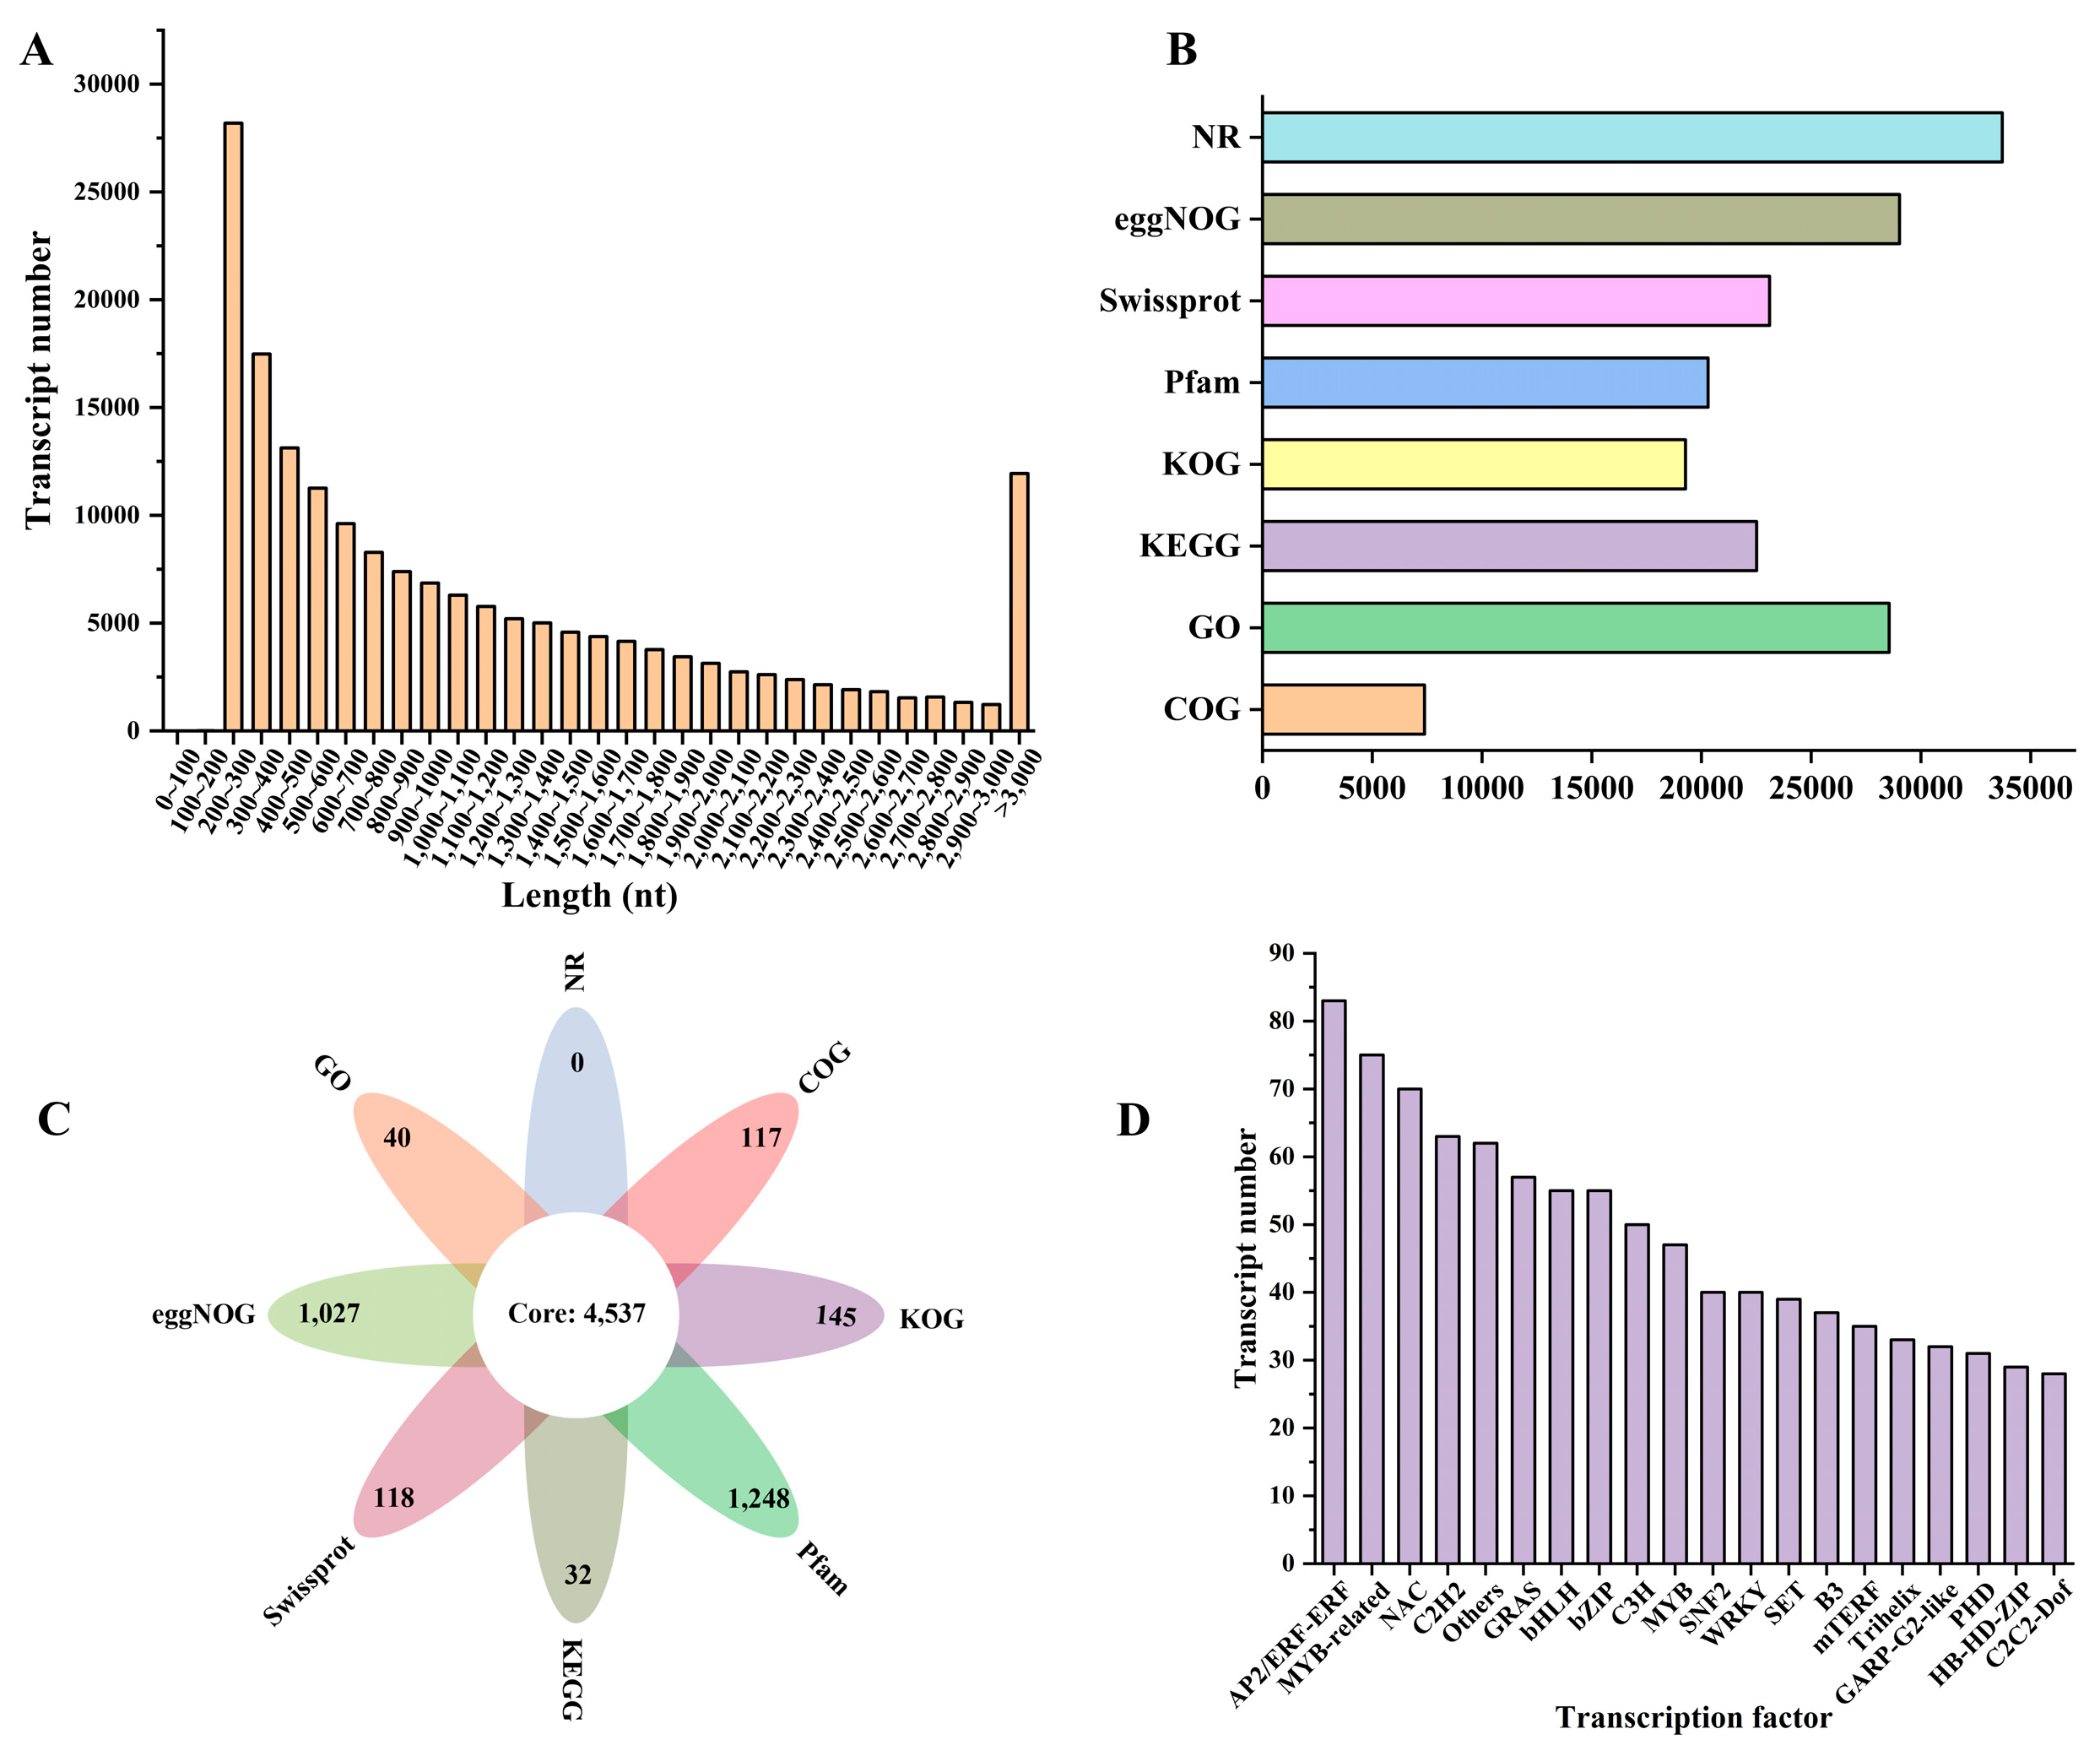
3.4. Transcriptome Sequencing, Assembly and Annotation

Transcriptome sequencing was conducted with three biological replicates for each sample to further elucidate the genetic regulating mechanism underlying petal coloration in Kalanchoe blossfeldiana petals. After removing low-quality reads, a total of 37.62 Gb of clean data was obtained with a Q30 percentage of 95.60% and a GC percentage of 47.64%. After assembling, a total of 179,113 transcripts and 69,204 unigenes were generated with mean lengths of 1184 bp and 900 bp, respectively, and N50 lengths of 1839 bp and 1726 bp, respectively. In total, there were 39,770 transcripts and unigenes with sequence lengths higher than 2000 bp (Figure 3A; Table S3). A total of 34,991 unigenes were successfully annotated using eight public databases (COG, GO, KEGG, KOG, Pfam, Swissprot, eggNOG and NR), and 49% of unigenes were annotated using the NR database (Figure 3B; Table S4). There was a total of 4537 unigenes annotated using all eight databases (Figure 3C). Moreover, a total of 961 transcription factors were predicted from all annotated transcription factors (Figure 3D). All these results show that the transcriptome data were of a high enough quality to ensure further analysis.

3.5. Differential Expression Genes and Enrichment Analysis

As for different groups with biological replicates, the DESeq2 Software was used to analyze differentially expressed genes (DEGs) with the parameters set as |Log2FC| ≥ 1 and FDR < 0.01 [41]. In total, there were 976 DEGs found in the yellow and red comparison, including 662 up-regulated DEGs and 314 down-regulated DEGs (Figure S3A). As shown in the volcano plot, the |Log2FC| values were mainly focused within five, whereas the values of −log10(FDR) were within ten (Figure S3B). In addition, GO enrichment analysis indicated that the GO terms were abundantly enriched in the cellular process and the metabolic process within the biological process, in the cellular anatomical entity and the intracellular within the cellular component, as well as in the catalytic activity and binding within the molecular function (Figure S3C). Moreover, the pathways involved in flavonoid biosynthesis and anthocyanin biosynthesis were significantly enriched (Figure S3D). These results exhibit a global view of the potentially different life processes between two color regions in Kalanchoe blossfeldiana petals.

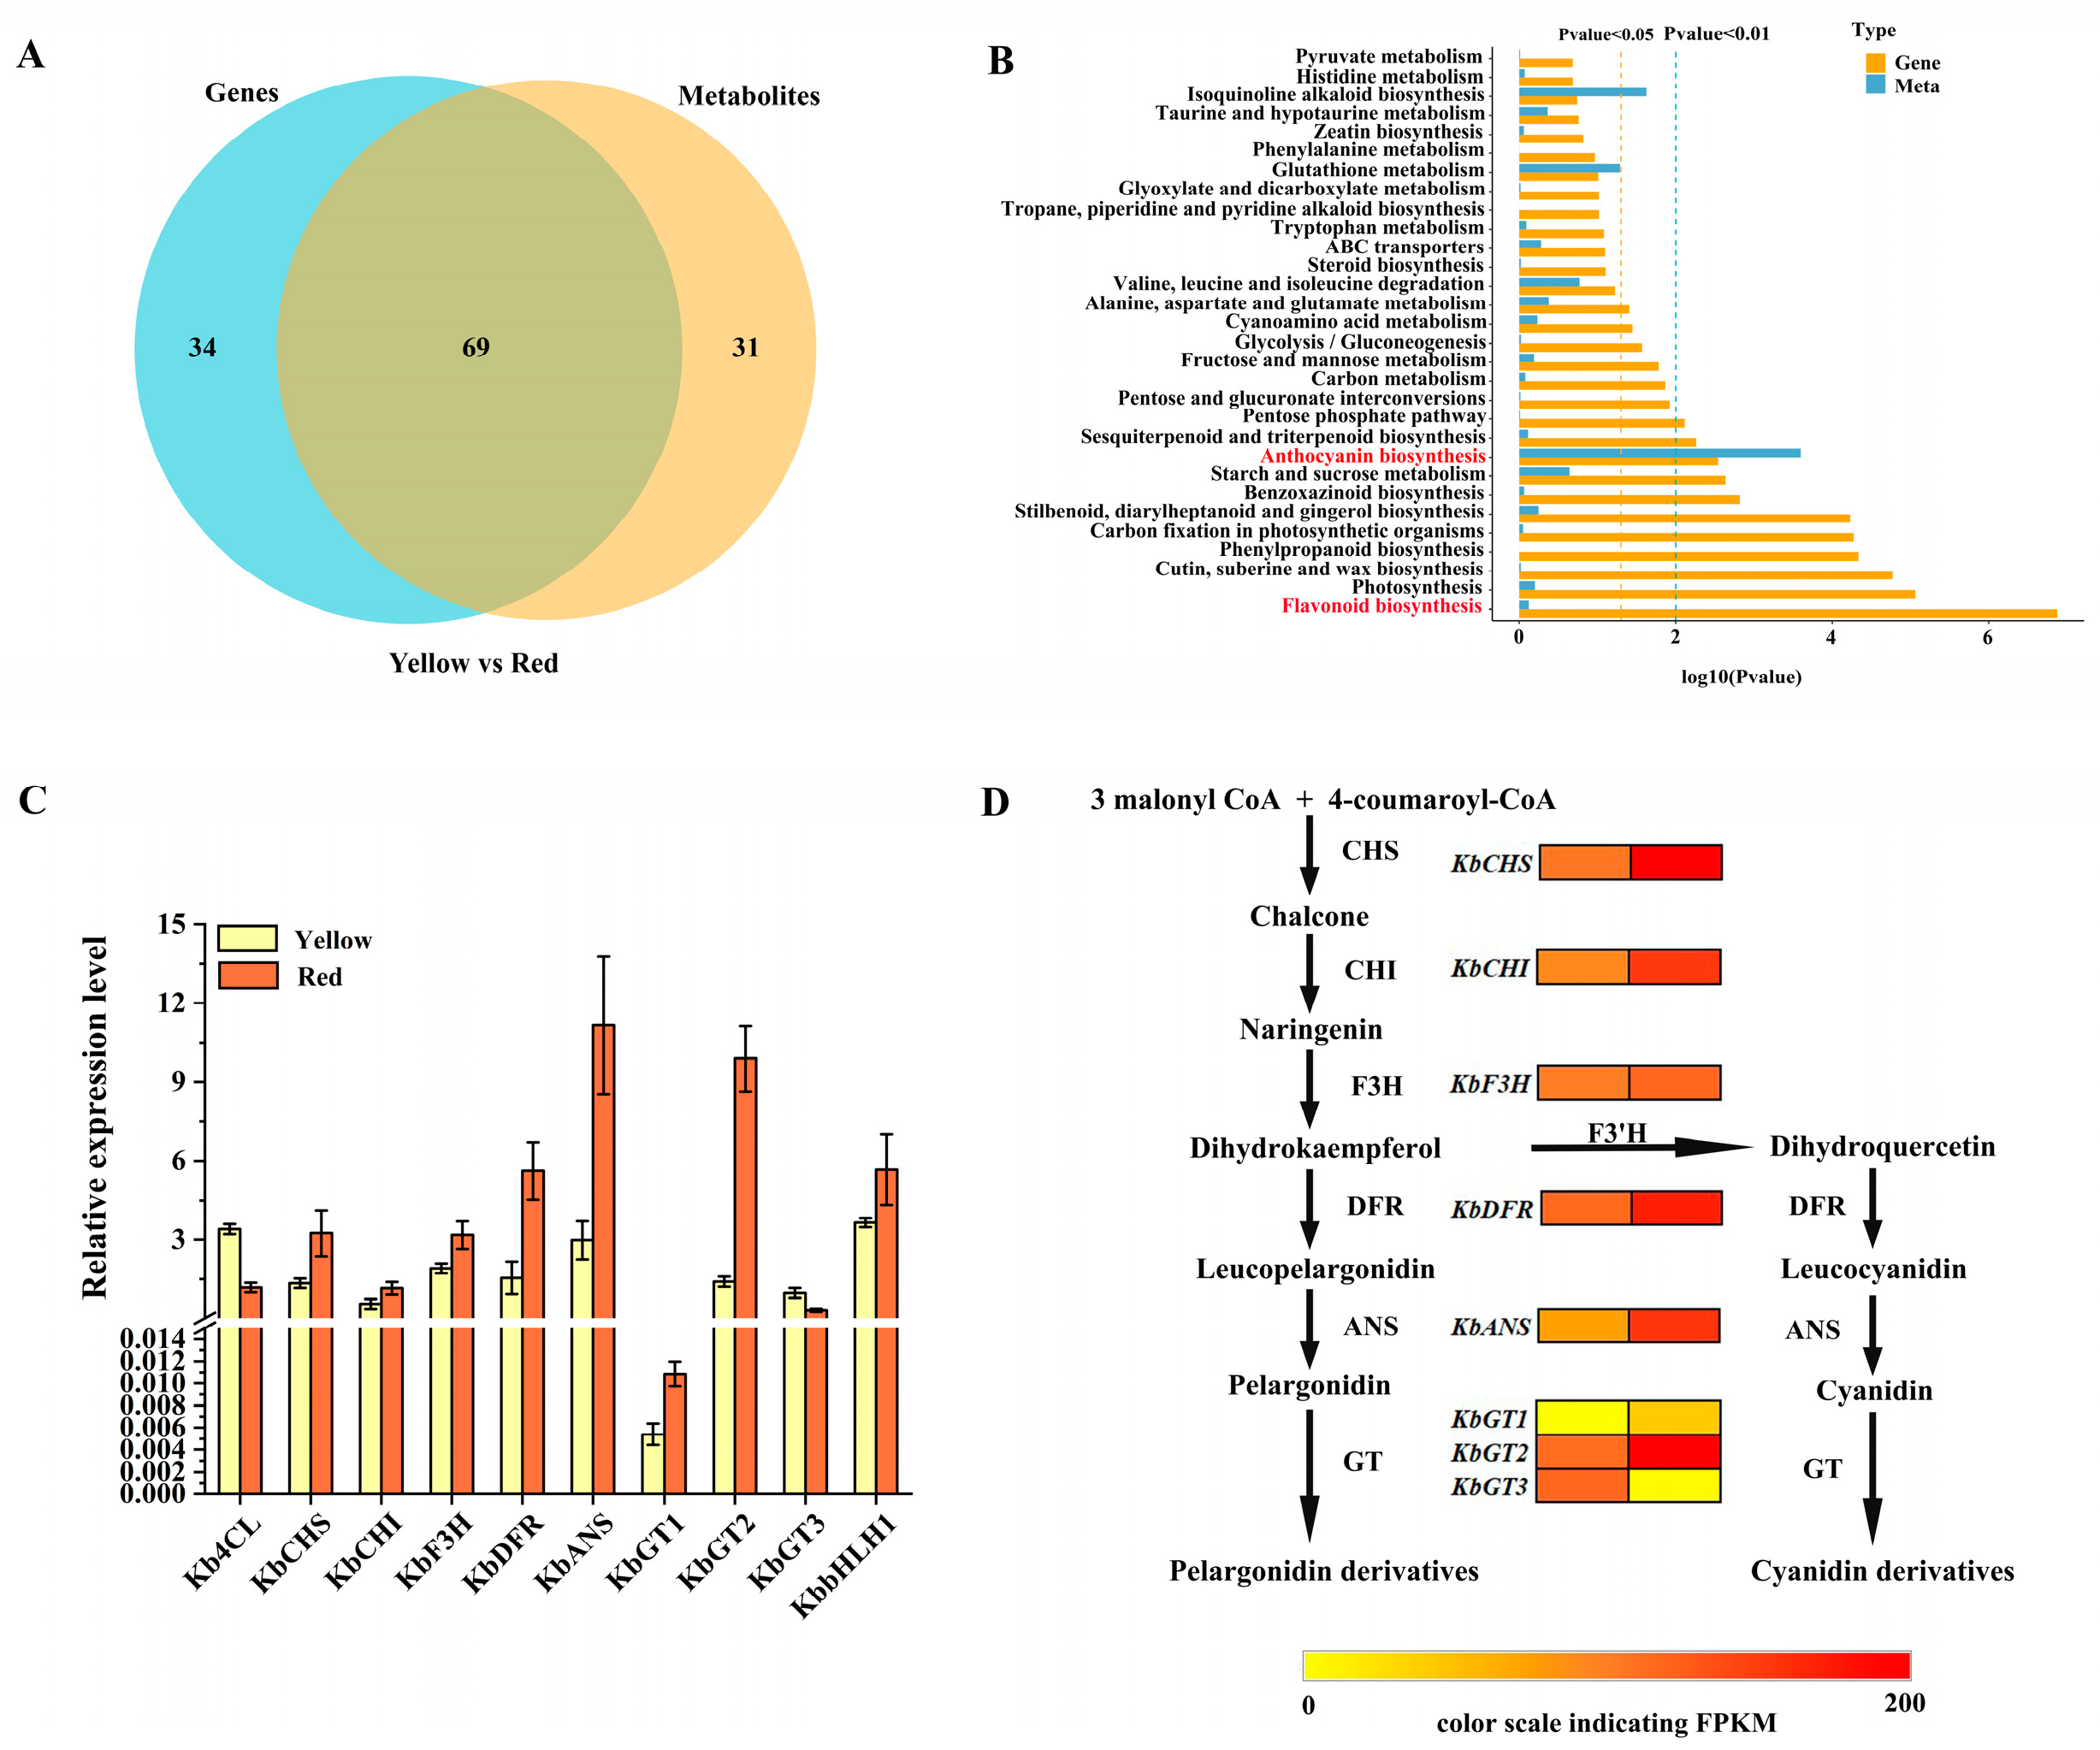
3.6. Integrative Analysis of Transcriptome and Metabolome

In total, there were 69 pathways jointly possessed in both the transcriptome and metabolome (Figure 4A), in which the pathways of anthocyanin and flavonoid biosynthesis were significantly enriched (Figure 4B). Therefore, we further screened out DEGs related to anthocyanin and flavonoid biosynthesis. The unigene sequences were initially obtained from the transcriptome database and then verified using BLAST analysis. Finally, there were nine structural genes found differentially expressed between the yellow and red regions, including Kb4CL, KbCHS, KbCHI, KbF3H, KbDFR, KbANS and three KbGTs, in which the expressional levels of most genes in the red region were significantly higher than those in the yellow region (Table S5), which may account for the more abundant accumulation of anthocyanins in the red region. The qRT-PCR result was consistent with the transcriptome data, suggesting the expression level in the transcriptome was reliable (Figure 4C). Based on the anthocyanins detected in metabolome and biosynthetic genes isolated from transcriptome, there were mainly two anthocyanin biosynthesis pathways, namely the cyanidin and pelargonidin flux, in Kalanchoe blossfeldiana (Figure 4D).

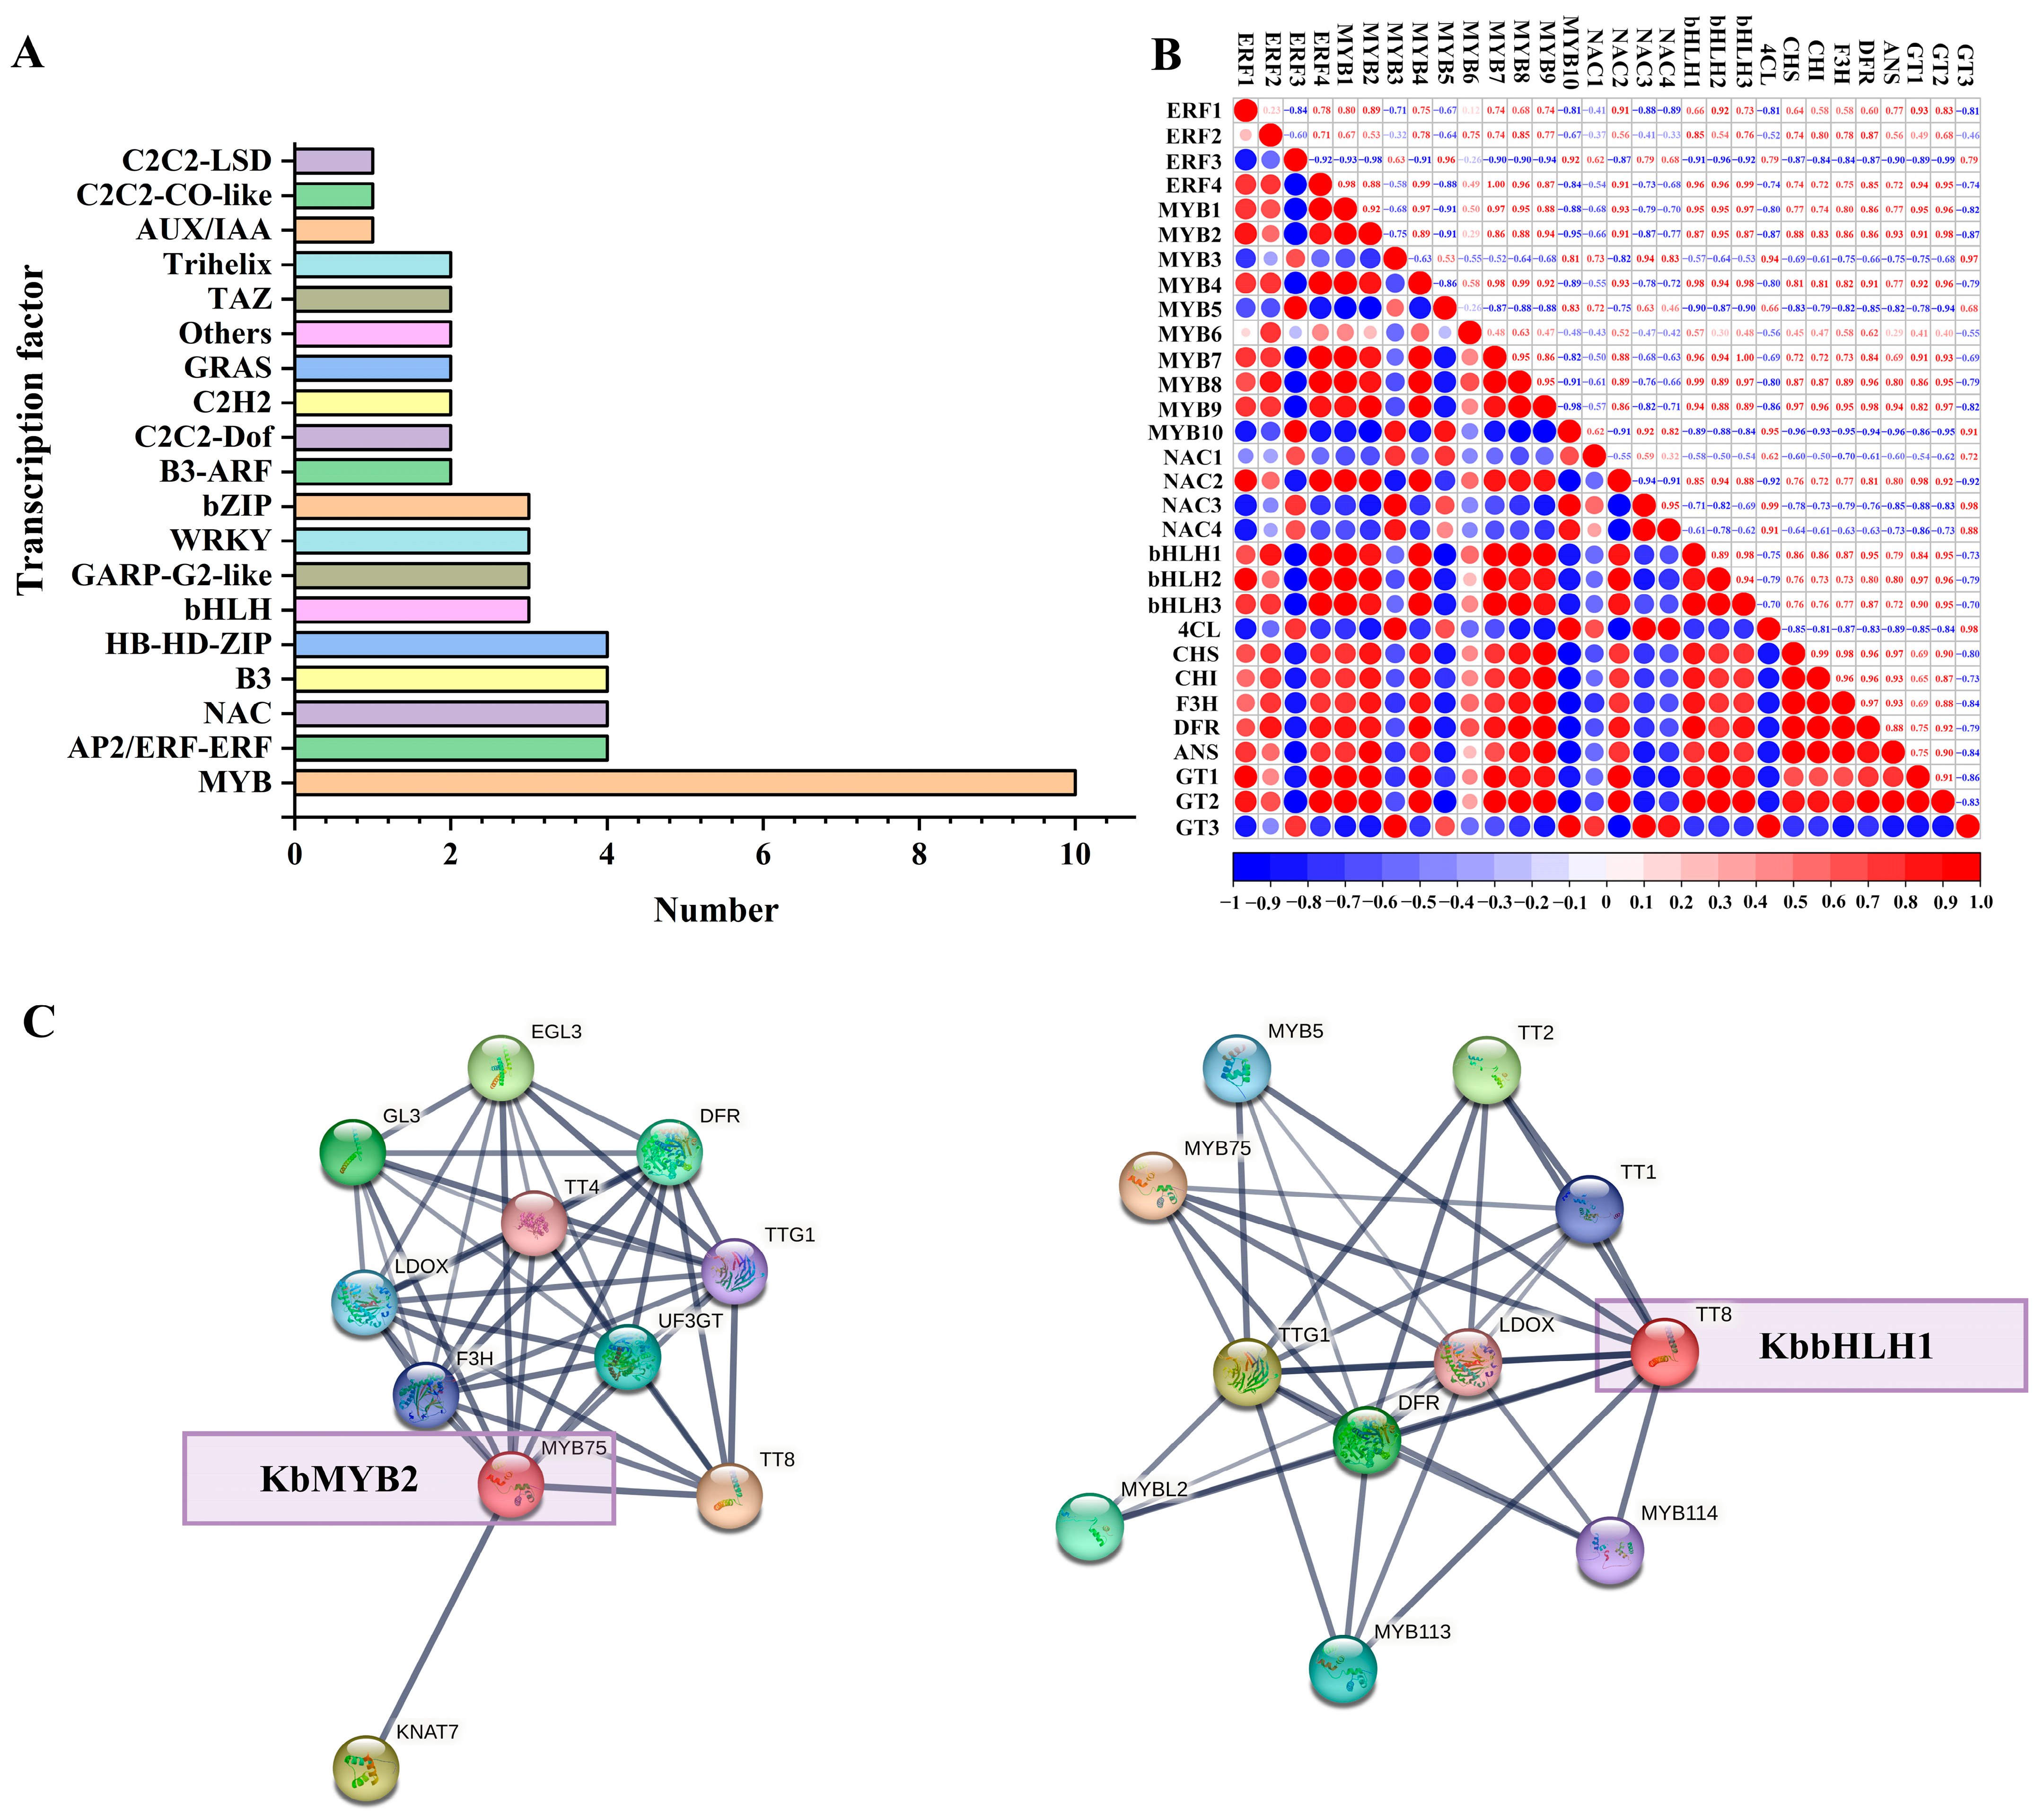
3.7. Transcription Factors Potentially Regulating Anthocyanin Biosynthesis

In order to explore the transcriptional regulation mechanism of anthocyanin biosynthesis in the winter pot kalanchoe, we further screened out potential transcription factors (TFs). In total, there were 58 TFs differentially expressed (Figure 5A). Then, the correlation analysis was conducted to predict the relationship between target TFs and structural genes (Figure 5B). TFs KbMYB2 and KbbHLH1 showed positive correlations with most anthocyanin biosynthetic genes, suggesting they may function as anthocyanin biosynthesis activators, which was further verified by the STRING analysis that the amino acid sequences of KbMYB2 and KbbHLH1 were highly homologous to Arabidopsis MYB75 and TT8, two typical TFs involved in anthocyanin biosynthesis (Figure 5C). These results suggest KbMYB2 and KbbHLH1 might account for the red color formation by positively regulating anthocyanin biosynthesis in K. blossfeldiana petals. In addition, some ERF(KbERF1, KbERF2, KbERF4) and NAC(NAC2) TFs also exhibited high positive correlations with anthocyanin biosynthetic genes. Apart from the potential anthocyanin biosynthesis activators, there were some TFs which showed negative correlations with anthocyanin biosynthetic genes, including KbERF3, KbMYB3, KbMYB5, KbMYB10, KbNAC1, KbNAC3 and KbNAC4 (Figure 5B), which might function in down-regulating anthocyanin biosynthesis in K. blossfeldiana.

4. Discussion

Usually, petals of higher plants exhibit a single color, while some species or cultivars could develop multiple colors on the same petal, such as that seen in monkeyflowers, Ipomoea nil, P. hybrida and so on [25,42]. To a great degree, multicolored petals enrich the pigmentation patterns and improve flower ornamental value. The pigments accumulating in petals play crucial roles in the coloration process. In this study, we collected a bicolored K. blossfeldiana with both yellow and red regions on the same petal (Figure 1). A total of twelve metabolomes, with six replicates for each color region, were conducted to identify the pigments. Both carotenoids and flavonoids were detected in K. blossfeldiana petals (Figure 2), whereas anthocyanins accumulating in the red region, mainly pelargonidin and cyanidin glycosides, were almost nineteen times higher than that in the yellow region (Figure 2, Table S2), suggesting the different anthocyanin content was the main cause for the bicolor formation, similar to the cases in blue petunia with white margins and stars as well as blue cineraria with white bases [1,25].
Anthocyanins are orderly catalyzed by a series of enzymes; therefore, the expression levels of key genes directly influence anthocyanin accumulation in plant petals. It is well known that the MYB-bHLH-WDR complex synergistically regulates anthocyanin biosynthesis in higher plants [21]. To date, a lot of MYB transcription factors have been identified, including R2R3-MYBs, such as CmMYB6, PsMYB12 and CcMYB6-1, found in chrysanthemum, Paeonia suffruticosa and cornflower, respectively, which play positive roles in regulating anthocyanin biosynthesis [40,43,44]. Moreover, bHLH transcription factors that interact with MYBs to regulate anthocyanin biosynthesis have also been screened out, such as CcbHLH1 in cornflower, AcbHLH42 in kiwifruit and DcTT8 in Dendrobium candidum [40,45,46]. In the present study, six cDNA libraries were prepared to perform RNA-seq to identify anthocyanin biosynthetic genes based on the significant variation of anthocyanin accumulation in the yellow and red regions on the same K. blossfeldiana petal. The KEGG pathways were significantly enriched in anthocyanin biosynthesis and flavonoid biosynthesis (Figure 4), and the biosynthetic genes, including KbCHS, KbCHI, KbF3H, KbDFR, KbANS, KbGT1 and KbGT2, were significantly up-regulated in the red region (Figure 4; Table S5), which is consistent with its higher anthocyanin accumulation. Moreover, KbMYB2 and KbbHLH1 were up-regulated in the red region and highly homologous to MYB75 and TT8 (Figure 5), respectively—two transcription factors regulating anthocyanin biosynthesis in Arabidopsis [47]—suggesting they might play positive roles in regulating anthocyanin biosynthesis in the red region. In addition, previous studies indicated that the ethylene response factor and the NAC transcription factor, like activators ERF5 in mulberry, PyERF3 in pear, MdERF1B and MdNAC52 in apple and PpNAC1 in peach, as well as inhibitors PyERF4.1 and PyERF4.2 in pear, were also involved in regulating anthocyanin biosynthesis [48,49,50,51,52]. In this study, we also found that KbERFs and KbNACs showed a strong correlation with anthocyanin biosynthetic genes (Figure 5) and speculated that they were possibly involved in regulating anthocyanin biosynthesis in the winter pot kalanchoe.
In addition to the activators, there are also inhibitors that down-regulate anthocyanin biosynthesis, such as MYB165 and MYB194, CmMYB#7 and RED TONGUE found in Populus tremula × tremuloides, chrysanthemum and monkeyflower, respectively [42,53,54]. A previous study identified two MADS-box inhibitors in Senecio cruentus, ScAG and ScAGL11, which could inhibit the transcription of ScF3H1 and ScDFR3, respectively, leading to the loss of anthocyanin accumulation in the basal part of ray-florets and the formation of bicolor [1]. In this study, we also found that some differentially expressed transcription factors are negatively correlated with anthocyanin biosynthetic genes, including KbERF3, KbMYB3, KbMYB5, KbMYB10, KbNAC1, KbNAC3 and KbNAC4 (Figure 5), which might function as inhibitors in anthocyanin biosynthesis in the bicolor formation of K. blossfeldiana petals. Although we screened out several key candidate genes possibly involved in anthocyanin biosynthesis by integrative analyses of the metabolome and the transcriptome, their concrete function remains to be further verified in the near future.

5. Conclusions

In conclusion, anthocyanin accumulation was significantly higher in the red region of winter pot kalanchoe petals, which is consistent with its higher expression level of anthocyanin biosynthetic genes including KbCHS, KbCHI, KbF3H, KbDFR, KbANS and KbGTs. Moreover, KbMYB2 and KbbHLH1, homologues of Arabidopsis MYB75 and TT8, were screened out as potential anthocyanin activators and might account for the bicolor formation in the winter pot kalanchoe. These findings provide new insights into the understanding of petal bicolor formation mechanisms and will assist cultivar innovation in winter pot kalanchoe.

Supplementary Materials

The following supporting information can be downloaded at: https://www.mdpi.com/article/10.3390/horticulturae9070844/s1, Figure S1: Correlation analysis among different samples; Figure S2: KEGG enrichment analysis of differentially accumulated pigments; Figure S3: DEG analysis of yellow and red regions in K. blossfeldiana petals, (A) Statistics of DEGs, (B) Volcano plot of DEGs represented by log2(FC) and −log10(FDR), (C) The GO enrichment analysis of DEGs, (D) The KEGG enrichment analysis of DEGs; Table S1: Primers used in the qRT-PCR; Table S2: Differentially accumulated flavonoids of yellow and red regions in K. blossfeldiana petals; Table S3: Summary of sequencing and assembly quality in RNA-Seq; Table S4: Summary of annotated unigenes; Table S5: DEGs involved in anthocyanin biosynthesis in K. blossfeldiana petals.

Author Contributions

Project design, C.D.; materials collection, Z.P.; scientific experiments, G.F. and J.W.; writing—original draft preparation, G.F. and J.W.; writing—review and editing, G.F. and C.D. All authors have read and agreed to the published version of the manuscript.

Funding

This work was supported by the Doctoral Initiating Project of Linyi University, China (No. LYDX2021BS046) and National Natural Science Foundation, China (No. 32101579).

Data Availability Statement

Sequence data from this work can be found in the NCBI database (SRA data: PRJNA988950).

Acknowledgments

Thanks to Meng Xu for his guidance in plotting the figures.

Conflicts of Interest

The authors declare no conflict of interest.

References

  1. Qi, F.; Liu, Y.; Luo, Y.; Cui, Y.; Lu, C.; Li, H.; Huang, H.; Dai, S. Functional analysis of the ScAG and ScAGL11 MADS-box transcription factors for anthocyanin biosynthesis and bicolour pattern formation in Senecio cruentus ray florets. Hortic. Res. 2022, 9, uhac071. [Google Scholar] [CrossRef]
  2. Bai, Z.; Yu, R.; Zheng, T.; Sun, D.; Zhou, Y.; Tang, J.; Zhu, H.; Li, G.; Niu, L.; Cui, L.; et al. A novel strategy for unveiling spatial distribution pattern of gallotannins in Paeonia rockii and Paeonia ostii based on LC–QTRAP–MS. Metabolites 2022, 12, 326. [Google Scholar] [CrossRef]
  3. Wang, T.; Li, J.; Li, T.; Zhao, Y.; Zhou, Y.; Shi, Y.; Peng, T.; Song, X.; Zhu, Z.; Wang, J. Comparative transcriptome analysis of anthocyanin biosynthesis in pansy (Viola × wittrockiana Gams.). Agronomy 2022, 12, 919. [Google Scholar] [CrossRef]
  4. Martins, T.R.; Berg, J.J.; Blinka, S.; Rausher, M.D.; Baum, D.A. Precise spatio-temporal regulation of the anthocyanin biosynthetic pathway leads to petal spot formation in Clarkia gracilis (Onagraceae). New Phytol. 2013, 197, 958–969. [Google Scholar] [CrossRef] [PubMed] [Green Version]
  5. Xu, L.; Yang, P.; Feng, Y.; Xu, H.; Cao, Y.; Tang, Y.; Yuan, S.; Liu, X.; Ming, J. Spatiotemporal transcriptome analysis provides insights into bicolor tepal development in Lilium “Tiny Padhye”. Front. Plant Sci. 2017, 8, 398. [Google Scholar] [CrossRef] [PubMed] [Green Version]
  6. Zhang, X.; Xu, Z.; Wang, W.; Mu, D.; Meng, X.; Lu, M.; Li, C. Advances on the coloring mechanism of double-color flowers in plants. Hortscience 2022, 57, 1120–1127. [Google Scholar] [CrossRef]
  7. Ohta, Y.; Atsumi, G.; Yoshida, C.; Takahashi, S.; Shimizu, M.; Nishihara, M.; Nakatsuka, T. Post-transcriptional gene silencing of the chalcone synthase gene CHS causes corolla lobe-specific whiting of Japanese gentian. Planta 2022, 255, 29. [Google Scholar] [CrossRef]
  8. Tanaka, Y.; Sasaki, N.; Ohmiya, A. Biosynthesis of plant pigments: Anthocyanins, betalains and carotenoids. Plant J. 2008, 54, 733–749. [Google Scholar] [CrossRef]
  9. Zhao, D.; Tao, J. Recent advances on the development and regulation of flower color in ornamental plants. Front. Plant Sci. 2015, 6, 261. [Google Scholar] [CrossRef] [Green Version]
  10. Narbona, E.; del Valle, J.C.; Whittall, J.B. Painting the green canvas: How pigments produce flower colours. Biochemistry 2021, 43, 6–12. [Google Scholar] [CrossRef]
  11. Buer, C.S.; Imin, N.; Djordjevic, M.A. Flavonoids: New roles for old molecules. J. Integr. Plant Biol. 2010, 52, 98–111. [Google Scholar] [CrossRef]
  12. Tohge, T.; de Souza, L.P.; Fernie, A.R. Current understanding of the pathways of flavonoid biosynthesis in model and crop plants. J. Exp. Bot. 2017, 68, 4013–4028. [Google Scholar] [CrossRef] [Green Version]
  13. Shen, N.; Wanag, T.; Gan, Q.; Liu, S.; Wang, L.; Jin, B. Plant flavonoids: Classification, distribution, biosynthesis, and antioxidant activity. Food Chem. 2022, 383, 132531. [Google Scholar] [CrossRef] [PubMed]
  14. Fan, X.; Fan, Z.; Yang, Z.; Huang, T.; Tong, Y.; Yang, D.; Mao, X.; Yang, M. Flavonoids—Natural gifts to promote health and longevity. Int. J. Mol. Sci. 2022, 23, 2176. [Google Scholar] [CrossRef] [PubMed]
  15. Li, M.; Qian, M.; Jiang, Q.; Tan, B.; Yin, Y.; Han, X. Evidence of flavonoids on disease prevention. Antioxidants 2023, 12, 527. [Google Scholar] [CrossRef]
  16. Zhang, Y.; Butelli, E.; Martin, C. Engineering anthocyanin biosynthesis in plants. Curr. Opin. Plant Biol. 2014, 19, 81–90. [Google Scholar] [CrossRef]
  17. Sunil, L.; Shetty, N.P. Biosynthesis and regulation of anthocyanin pathway genes. Appl. Microbiol. Biot. 2022, 106, 1783–1798. [Google Scholar] [CrossRef]
  18. Hichri, I.; Barrieu, F.; Bogs, J.; Kappel, C.; Delrot, S.; Lauvergeat, V. Recent advances in the transcriptional regulation of the flavonoid biosynthetic pathway. J. Exp. Bot. 2011, 62, 2465–2483. [Google Scholar] [CrossRef] [Green Version]
  19. Xu, W.; Dubos, C.; Lepiniec, L. Transcriptional control of flavonoid biosynthesis by MYB-bHLH-WDR complexes. Trends Plant Sci. 2015, 20, 176–185. [Google Scholar] [CrossRef] [PubMed]
  20. Cappellini, F.; Marinelli, A.; Toccaceli, M.; Tonelli, C.; Petroni, K. Anthocyanins: From mechanisms of regulation in plants to health benefits in foods. Front. Plant Sci. 2021, 12, 748049. [Google Scholar] [CrossRef]
  21. Kellenberger, R.T.; Glover, B.J. The evolution of flower colour. Curr. Biol. 2023, 33, 484–488. [Google Scholar] [CrossRef]
  22. Deng, J.; Su, M.; Zhang, X.; Liu, X.; Damaris, R.N.; Lv, S.; Yang, P. Proteomic and metabolomic analyses showing the differentially accumulation of NnUFGT2 is involved in the petal red-white bicolor pigmentation in lotus (Nelumbo nucifera). Plant Physiol. Biochem. 2023, 198, 107675. [Google Scholar] [CrossRef]
  23. Ohno, S.; Hosokawa, M.; Kojima, M.; Kitamura, Y.; Hoshino, A.; Tatsuzawa, F.; Doi, M.; Yazawa, S. Simultaneous post-transcriptional gene silencing of two different chalcone synthase genes resulting in pure white flowers in the octoploid dahlia. Planta 2011, 234, 945–958. [Google Scholar] [CrossRef] [PubMed] [Green Version]
  24. Tateishi, N.; Ozaki, Y.; Okubo, H. White marginal picotee formation in the petals of Camellia japonica ‘Tamanoura’. J. Jpn. Soc. Hortic. Sci. 2010, 79, 207–214. [Google Scholar] [CrossRef] [Green Version]
  25. Morita, Y.; Hoshino, A. Recent advances in flower color variation and patterning of Japanese morning glory and petunia. Breed. Sci. 2018, 68, 128–138. [Google Scholar] [CrossRef] [Green Version]
  26. Yin, X.; Lin, X.; Liu, Y.; Irfan, M.; Chen, L.; Zhang, L. Integrated metabolic profiling and transcriptome analysis of pigment accumulation in diverse petal tissues in the lily cultivar ‘Vivian’. BMC Plant Biol. 2020, 20, 446. [Google Scholar] [CrossRef] [PubMed]
  27. Geng, F.; Nie, R.; Yang, N.; Cai, L.; Hu, Y.; Chen, S.; Cheng, X.; Wang, Z.; Chen, L. Integrated transcriptome and metabolome profiling of Camellia reticulata reveal mechanisms of flower color differentiation. Front. Genet. 2022, 13, 1059717. [Google Scholar] [CrossRef] [PubMed]
  28. Dong, B.; Zheng, Z.; Zhong, S.; Ye, Y.; Wang, Y.; Yang, L.; Xiao, Z.; Fang, Q.; Zhao, H. Integrated transcriptome and metabolome analysis of color change and low-temperature response during flowering of Prunus mume. Int. J. Mol. Sci. 2022, 23, 12831. [Google Scholar] [CrossRef]
  29. Zhang, X.; Wang, J.; Li, P.; Sun, C.; Dong, W. Integrative metabolome and transcriptome analyses reveals the black fruit coloring mechanism of Crataegus maximowiczii C. K. Schneid. Plant Physiol. Biochem. 2023, 194, 111–121. [Google Scholar] [CrossRef]
  30. Shu, P.; Zhang, Z.; Wu, Y.; Chen, Y.; Li, K.; Deng, H.; Zhang, J.; Zhang, X.; Wang, J.; Liu, Z.; et al. A comprehensive metabolic map reveals major quality regulations in red-flesh kiwifruit (Actinidia chinensis). New Phytol. 2023, 238, 2064–2079. [Google Scholar] [CrossRef]
  31. Lin, Y.; Hou, G.; Jiang, Y.; Liu, X.; Yang, M.; Wang, L.; Long, Y.; Li, M.; Zhang, Y.; Wang, Y.; et al. Joint transcriptomic and metabolomic analysis reveals differential flavonoid biosynthesis in a high-flavonoid strawberry mutant. Front. Plant Sci. 2022, 13, 919619. [Google Scholar] [CrossRef]
  32. Bi, X.; Liao, L.; Deng, L.; Jin, Z.; Huang, Z.; Sun, G.; Xiong, B.; Wang, Z. Combined transcriptome and metabolome analyses reveal candidate genes involved in tangor (Citrus reticulata × Citrus sinensis) fruit development and quality formation. Int. J. Mol. Sci. 2022, 23, 5457. [Google Scholar]
  33. Fan, W.; Xia, Z.; Liu, C.; Ma, S.; Liu, S.; Wu, Y.; Zhu, B.; Xu, C.; Zhao, A. Ionomics, transcriptomics and untargeted metabolomics analyses provide new insights into the Cd response and accumulation mechanisms of mulberry. Environ. Exp. Bot. 2022, 196, 104821. [Google Scholar]
  34. Zhang, J.; Liang, L.; Xie, Y.; Zhao, Z.; Su, L.; Tang, Y.; Sun, B.; Lai, Y.; Li, H. Transcriptome and metabolome analyses reveal molecular responses of two pepper (Capsicum annuum L.) cultivars to cold stress. Front. Plant Sci. 2022, 13, 975330. [Google Scholar] [PubMed]
  35. Singh, V.; Gupta, K.; Singh, S.; Jain, M.; Garg, R. Unravelling the molecular mechanism underlying drought stress response in chickpea via integrated multi-omics analysis. Front. Plant Sci. 2023, 14, 1156606. [Google Scholar]
  36. Wang, Z.; Xiao, Y.; Chang, H.; Sun, S.; Wang, J.; Liang, Q.; Wu, Q.; Wu, J.; Qin, Y.; Chen, J.; et al. The regulatory network of sweet corn (Zea mays L.) seedlings under heat stress revealed by transcriptome and metabolome analysis. Int. J. Mol. Sci. 2023, 24, 10845. [Google Scholar]
  37. Hong, S.; Wang, J.; Wang, Q.; Zhang, G.; Zhao, Y.; Ma, Q.; Wu, Z.; Ma, J.; Gu, C. Decoding the formation of diverse petal colors of Lagerstroemia indica by integrating the data from transcriptome and metabolome. Front. Plant Sci. 2022, 13, 970023. [Google Scholar]
  38. Lu, J.; Zhang, Q.; Lang, L.; Jiang, C.; Wang, X.; Sun, H. Integrated metabolome and transcriptome analysis of the anthocyanin biosynthetic pathway in relation to color mutation in miniature roses. BMC Plant Biol. 2021, 21, 257. [Google Scholar]
  39. Deng, C.; Li, S.; Feng, C.; Hong, Y.; Huang, H.; Wang, J.; Wang, L.; Dai, S. Metabolite and gene expression analysis reveal the molecular mechanism for petal colour variation in six Centaurea cyanus cultivars. Plant Physiol. Biochem. 2019, 142, 22–33. [Google Scholar]
  40. Deng, C.; Wang, J.; Lu, C.; Li, Y.; Kong, D.; Hong, Y.; Huang, H.; Dai, S. CcMYB6-1 and CcbHLH1, two novel transcription factors synergistically involved in regulating anthocyanin biosynthesis in cornflower. Plant Physiol. Biochem. 2020, 151, 271–283. [Google Scholar]
  41. Love, M.I.; Huber, W.; Anders, S. Moderated estimation of fold change and dispersion for RNA-seq data with DESeq2. Genome Biol. 2014, 15, 550. [Google Scholar] [CrossRef] [Green Version]
  42. Ding, B.; Patterson, E.L.; Holalu, S.V.; Li, J.; Johnson, G.A.; Stanley, L.E.; Greenlee, A.B.; Peng, F.; Bradshaw, H.D.; Blinov, M.L.; et al. Two MYB proteins in a self-organizing activator-inhibitor system produce spotted pigmentation patterns. Curr. Biol. 2020, 30, 802–814. [Google Scholar] [CrossRef]
  43. Tang, M.; Xue, W.; Li, X.; Wang, L.; Wang, M.; Wang, W.; Yin, X.; Chen, B.; Qu, X.; Li, J.; et al. Mitotically heritable epigenetic modifications of CmMYB6 control anthocyanin biosynthesis in chrysanthemum. New Phytol. 2022, 236, 1075–1088. [Google Scholar] [CrossRef] [PubMed]
  44. Gu, Z.; Zhu, J.; Hao, Q.; Yuan, Y.W.; Duan, Y.W.; Men, S.; Wang, Q.; Hou, Q.; Liu, Z.A.; Shu, Q.; et al. A novel R2R3-MYB transcription factor contributes to petal blotch formation by regulating organ-specific expression of PsCHS in tree peony (Paeonia suffruticosa). Plant Cell Physiol. 2019, 60, 599–611. [Google Scholar] [CrossRef] [PubMed]
  45. Wang, L.; Tang, W.; Hu, Y.; Zhang, Y.; Sun, J.; Guo, X.; Lu, H.; Yang, Y.; Fang, C.; Niu, X.; et al. A MYB/bHLH complex regulates tissue-specific anthocyanin biosynthesis in the inner pericarp of red-centered kiwifruit Actinidia chinensis cv. Hongyang. Plant J. 2019, 99, 359–378. [Google Scholar] [CrossRef]
  46. Jia, N.; Wang, J.J.; Liu, J.; Jiang, J.; Sun, J.; Yan, P.; Sun, Y.; Wan, P.; Ye, W.; Fan, B. DcTT8, a bHLH transcription factor, regulates anthocyanin biosynthesis in Dendrobium candidum. Plant Physiol. Biochem. 2021, 162, 603–612. [Google Scholar] [CrossRef]
  47. Qin, J.; Zhao, C.; Wang, S.; Gao, N.; Wang, X.; Na, X.; Wang, X.; Bi, Y. PIF4-PAP1 interaction affects MYB-bHLH-WD40 complex formation and anthocyanin accumulation in Arabidopsis. J. Plant Physiol. 2022, 268, 153558. [Google Scholar] [CrossRef]
  48. Mo, R.; Han, G.; Zhu, Z.; Essemine, J.; Dong, Z.; Li, Y.; Deng, W.; Qu, M.; Zhang, C.; Yu, C. The ethylene response factor ERF5 regulates anthocyanin biosynthesis in ‘Zijin’ mulberry fruits by interacting with MYBA and F3H genes. Int. J. Mol. Sci. 2022, 23, 7615. [Google Scholar] [CrossRef] [PubMed]
  49. Sun, H.; Hu, K.; Wei, S.; Yao, G.; Zhang, H. ETHYLENE RESPONSE FACTORS 4.1/4.2 with an EAR motif repress anthocyanin biosynthesis in red-skinned pears. Plant Physiol. 2023, 192, 1892–1912. [Google Scholar] [CrossRef]
  50. Zhang, J.; Xu, H.; Wang, N.; Jiang, S.; Fang, H.; Zhang, Z.; Yang, G.; Wang, Y.; Su, M.; Xu, L.; et al. The ethylene response factor MdERF1B regulates anthocyanin and proanthocyanidin biosynthesis in apple. Plant Mol. Biol. 2018, 98, 205–218. [Google Scholar] [CrossRef]
  51. Sun, Q.; Jiang, S.; Zhang, T.; Xu, H.; Fang, H.; Zhang, J.; Su, M.; Wang, Y.; Zhang, Z.; Wang, N.; et al. Apple NAC transcription factor MdNAC52 regulates biosynthesis of anthocyanin and proanthocyanidin through MdMYB9 and MdMYB11. Plant Sci. 2019, 289, 110286. [Google Scholar] [CrossRef] [PubMed]
  52. Zhou, H.; Lin-Wang, K.; Wang, H.; Gu, C.; Dare, A.P.; Espley, R.V.; He, H.; Allan, A.C.; Han, Y. Molecular genetics of blood-fleshed peach reveals activation of anthocyanin biosynthesis by NAC transcription factors. Plant J. 2015, 82, 105–121. [Google Scholar] [CrossRef] [PubMed]
  53. Ma, D.; Reichelt, M.; Yoshida, K.; Gershenzon, J.; Constabel, C.P. Two R2R3-MYB proteins are broad repressors of flavonoid and phenylpropanoid metabolism in poplar. Plant J. 2018, 96, 949–965. [Google Scholar] [CrossRef] [PubMed] [Green Version]
  54. Xiang, L.; Liu, X.; Li, H.; Yin, X.; Grierson, D.; Li, F.; Chen, K. CmMYB#7, an R3 MYB transcription factor, acts as a negative regulator of anthocyanin biosynthesis in chrysanthemum. J. Exp. Bot. 2019, 70, 3111–3123. [Google Scholar]
Figure 1. Kalanchoe blossfeldiana flower and its petal color phenotype. (A) The overview of whole plants. Bar = 1 cm. (B) The flower bud (upper) and outer petal (lower). Bar = 1 cm. (C) Petal color phenotype described by RHSCC and colorimeter. L* describes color lightness; the positive and negative values of a* describe red and green, respectively; the positive and negative values of b* describe yellow and blue, respectively; the hue angle (h) and chroma (C*) were obtained using the formulae of h = tan−1(b*/a*) and C* = (a*2 + b*2)0.5, respectively.
Horticulturae 09 00844 g001
Figure 2. Metabolome analysis of yellow and red regions in Kalanchoe blossfeldiana petals. (A) Principal component analyses plots. The interpretation rate of the data set was represented by percentage values. (B) The top ten pathways by KEGG enrichment analysis. (C) Volcano plot of the metabolites with red dots representing down-regulated metabolites, blue dots representing up-regulated metabolites, and yellow dots representing unchanged metabolites in yellow vs. red comparison. (D) Heat map of differentially accumulated flavonoids in yellow and red regions with six replicates, respectively.
Horticulturae 09 00844 g002
Figure 3. Transcriptome analysis of yellow and red regions in Kalanchoe blossfeldiana petals. (A) Length distribution of all transcripts. (B) Multi-database annotation of unigenes. (C) Flower figure of annotated unigene numbers in different databases. (D) The type and number of predicted transcription factors.
Horticulturae 09 00844 g003
Figure 4. Integrative analyses of transcriptome and metabolome. (A) Venn diagram of the pathway numbers obtained in the transcriptome and metabolome. (B) The top 30 pathways significantly enriched. (C) qRT-PCR verification of unigene expression. (D) Anthocyanin biosynthetic pathway in K. blossfeldiana. The expression level of each unigene is presented on two grids, with the left and right representing FPKM values in the yellow and red regions, respectively.
Horticulturae 09 00844 g004
Figure 5. The screening of transcription factors that might regulate anthocyanin biosynthesis. (A) Statistics of differentially expressed transcription factors. (B) Correlation analysis of transcription factors and structural genes. (C) Interaction network of candidate transcription factors.
Horticulturae 09 00844 g005
Disclaimer/Publisher’s Note: The statements, opinions and data contained in all publications are solely those of the individual author(s) and contributor(s) and not of MDPI and/or the editor(s). MDPI and/or the editor(s) disclaim responsibility for any injury to people or property resulting from any ideas, methods, instructions or products referred to in the content.

