Article

Quantitatively Determine the Iron Content in the Fruit of ‘Huangguan’ Pear Using Near-Infrared Spectroscopy

1
School of Horticulture, Anhui Agricultural University, 130 Changjiang West Road, Hefei 230036, China
2
School of Information and Computer Science, Anhui Agriculture University, 130 Changjiang West Road, Hefei 230036, China
*
Author to whom correspondence should be addressed.
Horticulturae 2023, 9(7), 773; https://doi.org/10.3390/horticulturae9070773
Submission received: 19 June 2023 / Revised: 3 July 2023 / Accepted: 4 July 2023 / Published: 6 July 2023

Abstract

:
‘Huangguan’ pear has excellent quality, strong adaptability, and good socioeconomic value. Iron is one of the important trace elements in plants, and iron imbalance seriously affects the growth and development of pear trees and reduces their economic benefits. If the iron content in pear fruit can be easily and non-destructively detected using modern technology during the critical period of fruit development, it will undoubtedly help guide actual production. In this study, ‘Huangguan’ pear fruit was used as the research object, and the possibility of using the more convenient near-infrared spectroscopy (900~1700 nm) technology for nondestructive detection of the iron content in the peel and pulp of ‘Huangguan’ pear was explored. First, 12 algorithms were used to preprocess the original spectral data, and based on the original and the preprocessed spectral data, partial least squares regression and gradient boosting regression tree algorithms were used. A full-band prediction model of the iron content in the peel and pulp of ‘Huangguan’ pear was established, and the genetic algorithm was used to extract characteristic wavelengths, establish a characteristic wavelength prediction model, and evaluate the prediction effect of each model according to the coefficient of determination R² and the relative analysis error RPD. After comparison, we found that the prediction model with the best prediction of the iron content in the peel and pulp of ‘Huangguan’ pear reaches class A, and the prediction effect is good and meets expectations. This experiment shows that the use of near-infrared spectroscopy can achieve better prediction of the iron content in the peel and pulp of ‘Huangguan’ pear.

1. Introduction

‘Huangguan’ pear has excellent quality, and its fruit yield is high. The fruit is rich in minerals and vitamins, making it delicious and juicy, so it is widely enjoyed by consumers. ‘Huangguan’ pear has good economic benefits, and now China and even the rest of the world have a large area of cultivation, with good development prospects. As one of the irreplaceable trace elements in plants [1], iron plays an important role in the growth and development of ‘Huangguan’ pear trees and the quality of pear fruit. Iron participates in the respiration of plants because it is a component of some enzymes related to respiration, such as peroxidase and catalase, which are often in the active site of the enzyme structure. So, if plants lack iron, these enzymes’ activities are affected, respiration is blocked, and ATP synthesis reduces, so the growth and development of plants and their yield are significantly affected. Iron is closely related to plant photosynthesis, and the synthesis of chlorophyll requires the participation of iron. The growth and development of pear trees are hindered by iron deficiency, and pear trees may develop a variety of physiological diseases, such as yellow leaf disease [2]. Iron-deficiency yellow leaf disease of pear trees is caused by the lack of iron in the trees or an imbalance between iron and other nutrients. The lack of iron makes the pear trees grow slowly, the fruit yield decreases, and the fruit is deformed, has a poor color, etc., which seriously affects the quality of the fruit [3,4]. The soil of orchards in northern China is mostly calcareous yellow tide soil or chestnut calcium soil [5]. Some orchards also have a low terrain and a high groundwater table, so the phenomenon of iron deficiency and green loss of pear trees is common [2,6], which seriously affects the quality and yield of pear fruit. The diagnosis of yellow leaf disease in production practice mainly depends on external morphological indicators, but characterization alone cannot confirm the cause and extent of onset of yellow leaf disease [7]. Moreover, the iron content in a single leaf is difficult to detect directly, but the iron content in the fruit can be used to indirectly reflect the iron content in the leaf and the rest of the pear tree. If the iron content in the fruit can be easily measured using nondestructive testing techniques during the critical period of ripening of the ‘Huangguan’ pear, it will help tailor agricultural management methods, effectively prevent and help treat yellow leaf disease, guide actual production, and help improve the yield and quality of ‘Huangguan’ pear fruit in the ‘Huangguan’ pear industry.
For the detection of the mineral element content in pear fruit, the methods commonly used in laboratories include inductively coupled plasma-mass spectrometry (ICP-MS) [8,9] atomic absorption spectrometry [10], and ultraviolet-visible spectrophotometer measurement. Although these methods can determine the mineral element content in the fruit more accurately, all require destructive sampling. In addition, they can only be carried out in the laboratory and cannot be directly performed in the field, which is time-consuming and labor-intensive and is difficult for farmers to grasp and apply in practice. At present, the detection of the mineral element content in ‘Huangguan’ pear fruit is mainly conducted during product quality tests carried out in the laboratory, and there is no relevant application that can provide real-time detection data for the growth and development of the fruit. If the iron content in pear fruit can be measured quickly and nondestructively in the field at the critical stage of pear fruit development, it can not only effectively prevent the occurrence of iron-deficiency yellow leaf disease in pear trees but also help carry out quantitative fertilization according to the iron content in pear fruit, adjust the fertilization strategy, and guide production.
Compared with traditional mineral element detection and analysis methods, near-infrared spectroscopy detection technology is convenient and fast, does not require destructive sampling, and can detect multiple components at the same time, which has good application prospects. In 1986, scientists Batten and Blakeney pioneered the use of near-infrared spectroscopy to analyze nitrogen in rice tissue to determine optimized fertilization strategies. Rossa et al. used near-infrared spectroscopy to measure macronutrients C, N, P, K, Ca, and Mg and micronutrients Na and Fe in Paraguayan tea and the concentrations of Mn, Cu, and Zn, and good results were achieved [11]. Mir-Marques et al. used near-infrared spectroscopy to establish a multivariate correction model for predicting Ca, K, Mg, Fe, Mn, and Zn in artichoke [12], and the prediction worked well. Lastras et al. used near-infrared spectroscopy combined with the improved partial-positive partial least squares regression algorithm to predict the content of major mineral elements Ca, Fe, and Mg and the content of fatty acids in lentils [13]. A large number of experiments have proven that the use of near-infrared spectroscopy technology can achieve nondestructive testing of the mineral element content in fruits and vegetables.
Based on near-infrared spectroscopy, taking ‘Huangguan’ pear fruit as the research object, this paper modeled and predicted the iron content in pear peel and pulp and established a full-band prediction model of the iron content according to the iron content detection value, original spectral data, and preprocessed spectral data of the samples. The prediction model with a good fitting effect was selected, and the genetic algorithm [14,15,16] was used to extract the characteristic wavelength and establish a characteristic wavelength prediction model. By comparing the coefficient of determination (R²) and the relative analysis error (RPD) of each model, the prediction model of the peel and pulp of ‘Huangguan’ pear was screened, which provided guidance for actual production practice.

2. Materials and Methods

2.1. Test Pear Fruit Samples

The pear fruit samples in this experiment were obtained from 18 ‘Huangguan’ pear trees from the fourth team of the Dangshan County Horticultural Farm in Suzhou City, Anhui Province (34.442516° N, 116.367097° E), and the plants were in good condition and free of obvious diseases and pests. In early August, the pear fruits were picked and transported back to the laboratory; 65 samples with good fruit shape, no diseases and pests, and no mechanical damage were selected; and the surface of the fruits was scrubbed and numbered for later use.

2.2. Near-Infrared Spectral Data Acquisition

In this experiment, a reflective miniature handheld near-infrared spectrometer was used to acquire 228 bands in the wavelength range of 900–1700 nm, with a spectral resolution of 3.89 nm. The signal-to-noise ratio was 5000:1 [17,18,19].
To accurately reflect the phosphorus content in pear fruit samples, it was necessary to reasonably divide the sampling area. Taking the equatorial line of the fruit as the reference line, the long axis was selected evenly about 7.5 cm, three elliptical regions with a minor axis of about 5.5 cm were selected, and 5 spectral acquisition points were uniformly selected within each elliptical region, as shown in Figure 1. Spectral data were collected sequentially, and the average of the 5 reflection spectral data was used as the original modeled spectral data of a single elliptical region. After acquisition, the spectral data were exported and numbered for later modeling.

2.3. Near-Infrared Spectroscopy Data Preprocessing

Raw spectral data are susceptible to environmental interference, so the original spectral data needed to be processed using pretreatment methods, including Savitzky-Golay convolutional smoothing (SG) [20,21], multiple scattering correction (MSC)), logarithmic transformation (LG) [22], first derivative (FD) [23], second derivative (SD) [24], and combinations of two or three single pretreatment methods (SG + MSC, SG + SNV, SG + MSC + SD, SG + MSC + FD, SG + SNV + FD, SG + SNV + SD). The raw spectral data were preprocessed, and the effects of each pretreatment method were analyzed using trial-and-error comparison.

2.4. Characteristic Wavelength Extraction

The original spectral data contained a large amount of information from inside the pear fruit, but there could be were inevitably some wavelengths that were weak or irrelevant to the target chemical composition of the samples, and environmental factors, such as noise and light, could have inevitably interfered with the process of collecting the spectrum, affecting the accuracy of later modeling. This experiment was based on the genetic algorithm (GA). The characteristic wavelength extraction process was carried out on the full-band model that met the prediction standard, and a characteristic wavelength prediction model was established to further optimize the model. The genetic algorithm was first proposed by Professor John Holland of the United States in 1975, which has a wide range of applications, is easy to mix with other technologies, and has advantages over traditional algorithms in dealing with some complex combinatorial optimization problems [25,26,27].

2.5. Detection of the Iron Content in Pear Peel and Pulp

After collecting the spectral data of all pear fruit samples, the peel and pulp were sampled within the delimitation range of each pear fruit skin mentioned in Figure 1, packed in Ziplock bags, marked with numbers, and sent to the Anhui Geological Experiment Institute for iron content detection. The detection method used was inductively coupled plasma-mass spectrometry.

2.6. Establishment of a Prediction Model for the Iron Content in the Peel and Pulp of ‘Huangguan’ Pear

In this experiment, partial least squares regression (PLSR) [28,29] and gradient boosting regression tree (GBRT) [30,31] algorithms were used to establish a quantitative prediction model of the iron content in pear peel and pulp. The PLSR algorithm has fewer sample requirements, can handle multi-faceted complex models, can process reflection indicators and formation indicators at the same time, and can realize multiple linear regression analyses, principal component analyses, and correlation analyses between two sets of variables at the same time, which is suitable for establishing predictive models. The GBRT algorithm is a decision-tree-based boosting algorithm, which can process various numerical and categorical large features as well as continuous and discrete target variables; has a certain robustness to abnormal data and outliers; and can better predict the target variable.

2.7. Model Effect Evaluation Indicators

The coefficient of determination (R2) and residual predictive deviation (RPD) were the model evaluation indices used in this study. The coefficient of determination (R²) has a range of values between 0 and 1, and the closer it is to 1, the less the error, the greater the model fitting effect, and the closer the distribution of prediction points to the regression line. The opposite is also true, showing a poor model prediction effect. The ratio of the standard deviation (SD) and the root mean square error of prediction (RMSEP), also known as the relative analysis error (RPD) or residual prediction bias, is a key indicator for assessing the benefits and drawbacks of the model.
The RPD assessment level suggested by Chang et al. [32] was used to assess the model’s ability to forecast. When ERPD ≥ 2 and R2 ≥ 0.8, the model’s prediction effect is good and the model belongs to class A, which can be applied to the corresponding quantitative prediction. When 1.4 ≤ ERPD < 2 and 0.5 ≤ R² < 0.8, the predictive ability of the model is medium and the model belongs to class B. When ERPD < 1.4 and R2 < 0.5, the model’s prediction effect is relatively poor and the model belongs to class C and cannot be applied to quantitative prediction.

3. Results

3.1. Analysis of the Iron Content Detection in the Peel and Pulp of ‘Huangguan’ Pear

The reasonable division of samples had an important impact on the accuracy of the later model. In this paper, 65 test samples were randomly divided into modeling sets and prediction sets at a ratio of 8:2, with a total of 52 samples in the modeling set and a total of 13 samples in the prediction set. The specific breakdown data of the samples are shown in Table 1. The table shows that the data distribution of the sample set had a certain gradient, and the mean and standard deviation of the samples in the modeling set and the prediction set were relatively close, which shows that the data distribution structure of the modeling set and the prediction set was similar, which is conducive to the rational interpretation of the prediction results.

3.2. Raw Spectral Data Analysis

After the spectrum was acquired, original spectral curves (Figure 2a) and average spectral curves (Figure 2b) were obtained. Overall, the original spectral curves reflected similarity in the reflectance spectral data of all samples, with small differences from sample to sample, indicating that the mineral content in the samples was generally similar. The reflectance spectral data reached the maximum and minimum values at wavelengths of approximately 900 nm and 1450 nm, respectively, and there were obvious curve troughs near 980 nm, 1200 nm, 1440 nm, and 1660 nm and obvious peaks at 1050 nm, 1260 nm, and 1680 nm, which may be related to compounds in pear fruit [33,34]. The primary peaks of water absorption, according to the literature, are 980 nm and 1450 nm. About 1660 nm corresponds to the first frequency-doubling information of the methyl C-H bond tensile vibration about related carbohydrate O-H bonds. The main chemical components in pear fruit include flavonoids, triterpenes, phenolic acids, luminolates, and polysaccharides [35,36]. The entire spectral curve is a rich reflection of the pear fruit’s interior data.

3.3. Analysis of Spectral Data Preprocessing Results

Figure 3 displays the spectral curve that was obtained following 12 pretreatment techniques. Compared with the initial spectral curve, the spectral curve after pretreatment underwent a significant alteration. First, the baseline shift phenomenon improved, and the signal-to-noise ratio also improved in the spectral image after reciprocal processing. However, at the same time, the influence of noise on the spectrum increased, and the second-derivative algorithm processing had a greater noise impact than the first-derivative algorithm processing. Second, there were no noticeable changes in the spectral picture following MSC and SNV pretreatments. The MSC transformation mostly removed the scattering impact brought on by an uneven particle distribution and varied particle sizes on the sample surface, while SNV was primarily used to remove the effects of these factors. Third, LG pretreatment was beneficial in highlighting the characteristic spectrum, emphasizing some spectral peaks. Fourth, at the same time, the spectral curve after the superposition of multiple pretreatments was not simply the superposition of a single processing effect but also had an impact between various pretreatments, and further experiments are needed to explore which pretreatment is most conducive to improving the accuracy of the model.

3.4. Full-Band Modeling

In this paper, the classic single algorithm partial least squares regression (PLSR) [37] and the ensemble algorithm the gradient boosting regression tree (GBRT) were used to establish a predictive model for iron content.

3.4.1. Full-Band Modeling of the Iron Content in the Peel of ‘Huangguan’ Pear

The R2 and RPD of the modeling set and the prediction set were used as evaluation indices. A total of 26 prediction models for predicting the iron content in pear peel were established based on the original spectral data and 12 preprocessed spectral data items according to the PLSR and GBRT algorithms. Table 2 displays the specific outcomes.
According to the results of the 26 prediction models, it can be seen that after Raw-PLRS, R² = 0.955 and RPD = 3.371 for the modeling set and R² = 0.547 and RPD = 1.195 for the prediction set. After Raw-GBRT, R² = 0.999 and RPD = 22.366 for the modeling set, R² = 0.449 and RPD = 1.119 for the prediction set, and the model class is C. So, the modeling results of the original spectral curve do not meet the modeling requirements and cannot be used as a predictive model. Among the 13 models established using PLSR, the SG + MSC + FD-PLSR model and the SG + SNV + FD-PLSR model reached class B, which met the requirements of preliminary modeling accuracy, and the remaining 11 models did not meet the modeling requirements. The modeling effect of the spectral curve after 12 preprocessing steps was better than the modeling effect of the original spectral curve, indicating that under the condition of the PLSR algorithm, preprocessing has a positive effect on improving the accuracy of the model. However, this does not mean that the more preprocessing that is stacked, the better. Among the 13 models established using GBRT, none met the requirements of modeling accuracy. Although the fitting effect of the modeling set was better, the fitting effect of the prediction set was poor, so it cannot be used as a predictive model, indicating that under these experimental conditions, the GBRT algorithm is not suitable for establishing the model. Overall, the modeling effect of the PLSR algorithm is better than that of the GBRT algorithm for predicting the iron content in the peel of ‘Huangguan’ pear.

3.4.2. Full-Band Modeling of the Iron Content in the Pulp of ‘Huangguan’ Pear

According to the PLSR and GBRT algorithms, a total of 26 prediction models for predicting the iron content in pear pulp were established based on the original spectral data and the spectral data after 12 preprocessing steps. The R2 and RPD of the prediction set and the modeling set were used as evaluation indices. Table 3 displays the specific outcomes.
For the 13 models established using the PLSR algorithm, R² = 0.840 and RPD = 1.846 for the modeling set of the SG + MSC + FD-PLSR model, R² = 0.721 and RPD = 1.445 for the prediction set of the SG + MSC + FD-PLSR model, R² = 0.854 and RPD = 1.923 for the SG + SNV + FD-PLSR model modeling set, and R² = 0.725 and RPD = 1.451 for the SG + SNV + FD-PLSR model prediction set. These two models reached class B, which meets the accuracy requirements of preliminary modeling. The 13 prediction models established using the GBRT algorithm all met the modeling requirements and cannot be used as predictive models. Overall, the modeling results of the preprocessed spectral data are not completely better than the modeling results of the original spectral data, the modeling effect of the PLSR algorithm is better than the modeling effect of the GBRT algorithm, and the GBRT algorithm is not suitable for model establishment for the iron content in the pulp of ‘Huangguan’ pear under these experimental conditions.

3.5. Extraction of Characteristic Wavelengths

According to the above-mentioned research results, through SNV, FD, MSC, SD, SG, LG, SG + MSC, SG + SNV, and SG + MSC + SD, the PLSR models established using the 10 pretreatments of SG + SNV + SD did not meet the quantitative prediction criteria and were not suitable for the prediction of the iron content in the peel and pulp of ‘Huangguan’ pear, while none of the 26 prediction models established using the GBRT algorithm met the prediction criteria and was not suitable for iron content prediction. For the two models that initially met the prediction criteria, SG + MSC + FD-PLSR and SG + SNV + FD-PLSR, and for the two models that predicted the iron content in pear pulp that initially met the prediction criteria, SG + MSC-FD-PLSR and SG + SNV-FD-PLSR, characteristic wavelength processing was carried out using the genetic algorithm. To further optimize the prediction model, the characteristic wavelengths extracted by the four models are shown in Table 4 and Table 5.

3.5.1. Characteristic Wavelength Extraction of the Iron Content Prediction Model for Pear Peel

Using the genetic algorithm, 106 and 107 characteristic spectra were extracted from the spectral curves after SG + MSC + FD and SG + SNV + FD pretreatments, respectively, and the distribution of extraction points on the spectral curve is shown in Figure 4.
According to the figure, the extracted spectral points had no obvious regular distribution on the original spectral curve, but most of them were concentrated between 920 and 1100 nm, 1150 and 1300 nm, and 1450 and 1650 nm. Although the characteristic wavelength points extracted by the two spectra were different, most of them were concentrated in these three regions, indicating that these wavelength intervals can reflect most of the spectral information.

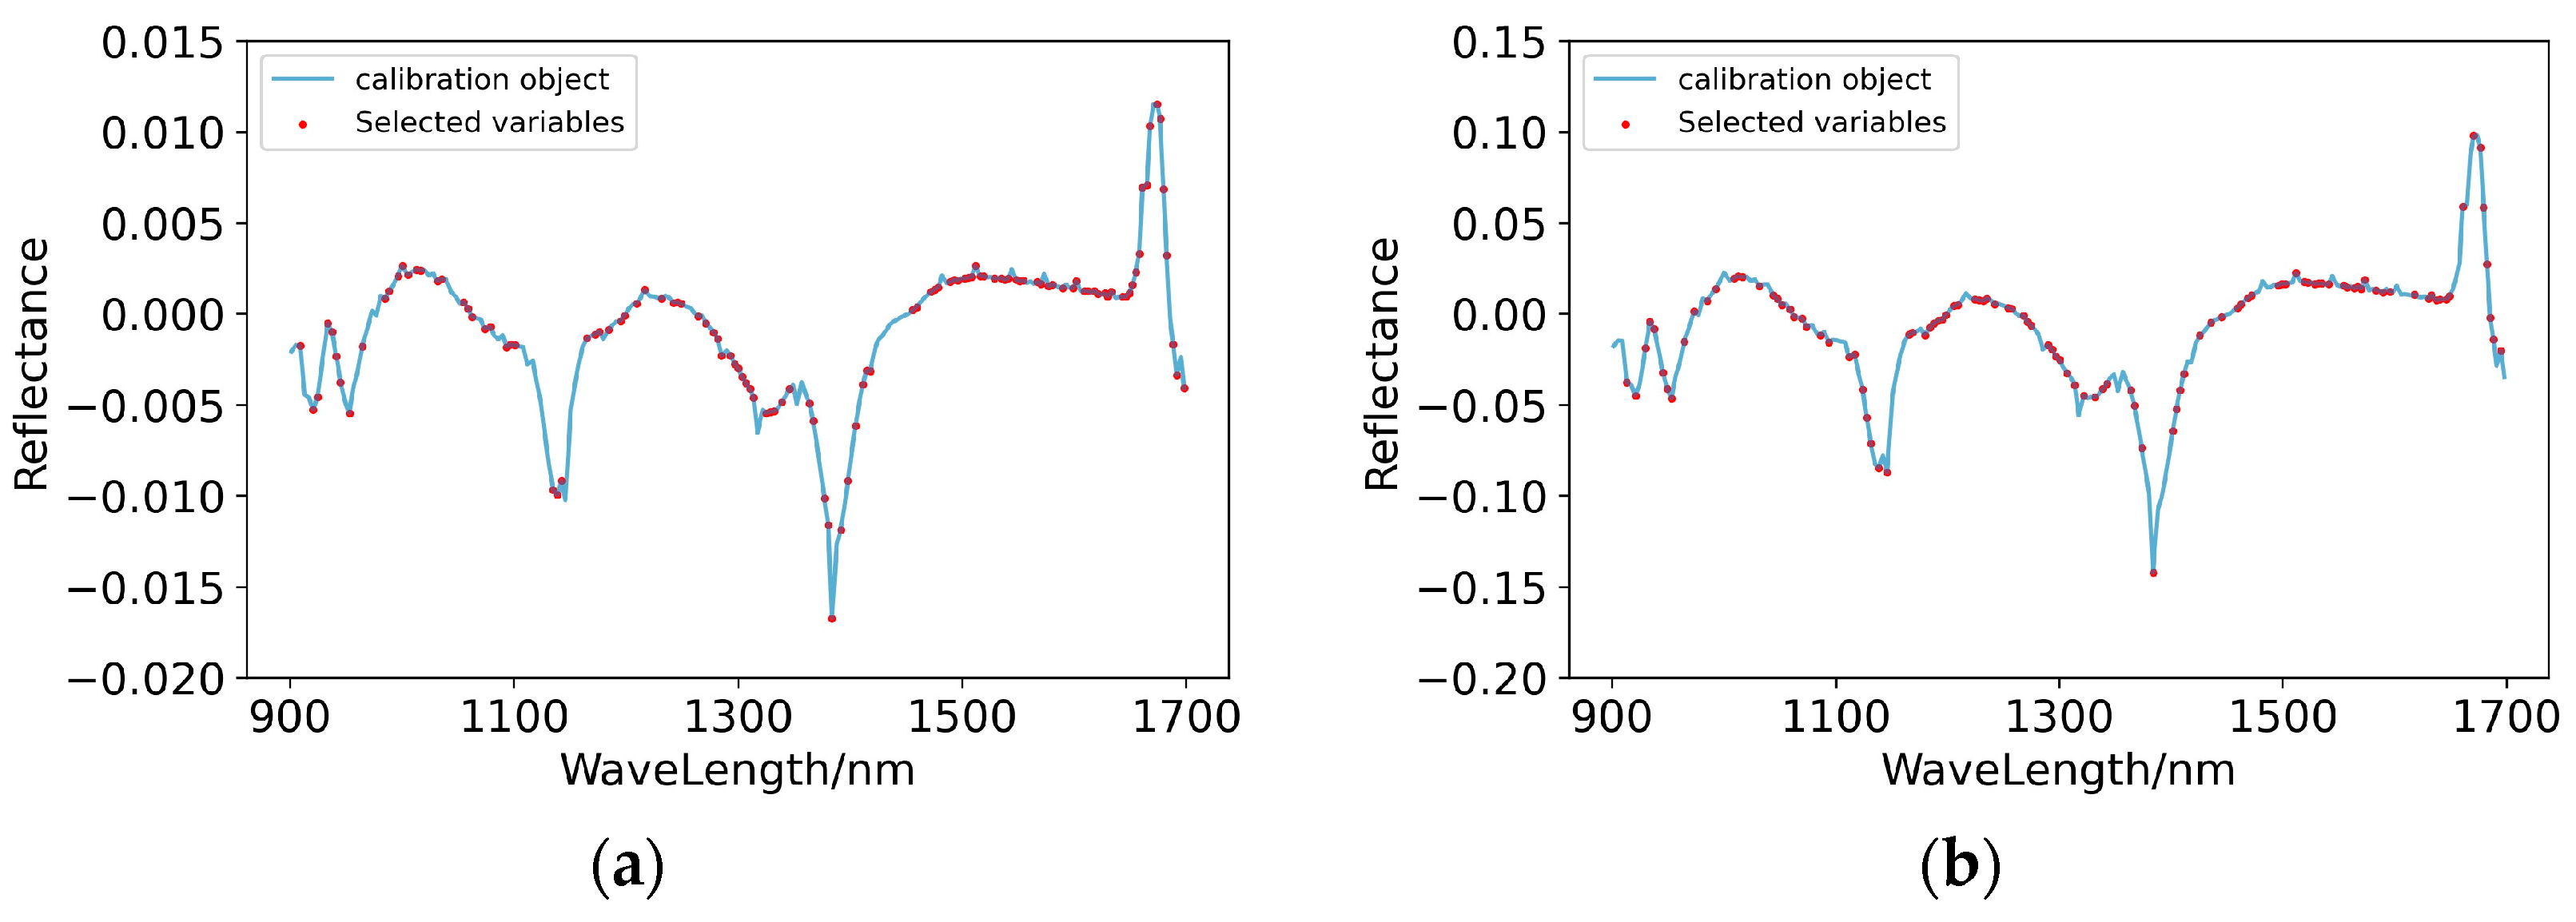
3.5.2. Characteristic Wavelength Extraction of the Iron Content Prediction Model for Pear Pulp

Using the genetic algorithm [14], spectral data with a good effect of predicting the iron content in the pulp of ‘Huangguan’ pear were extracted at the characteristic wavelength, 120 characteristic spectral points were extracted from the spectral data after SG + MSC + FD pretreatment, and 111 characteristic spectral points were extracted from the spectral data after SG + SNV + FD pretreatment. The distribution of extraction points on the entire spectral curve is shown in Figure 5.
According to Figure 5, the distribution of characteristic spectral points on the spectral curve had no obvious regularity, and the distribution of characteristic spectral points in the iron content prediction model for pear pulp was similar to that for pear peel, mainly concentrated between 920 and 1100 nm, 1150 and 1300 nm, and 1450 and 1650 nm.

3.6. Characteristic Wavelength Modeling

Modeling treatment of the iron content predicted in the peel of ‘Huangguan’ pear based on characteristic wavelength extraction (SG + MSC + FD-GA, SG + SNV + FD-GA) and modeling treatment of the iron content predicted in pear pulp (SG + MSC + FD-GA, SG + SNV + FD-GA) were performed using the PLSR algorithm again, and the models were evaluated. The results obtained are shown in Table 6 and Table 7.

3.6.1. Based on the Characteristic Wavelength, a Model for Predicting the Iron Content in Pear Peel was Established

This is shown in Figure 6, after the two models were extracted using the GA algorithm, the model class was further improved to reach class A, which can be used to predict the iron content in the peel of ‘Huangguan’ pear.

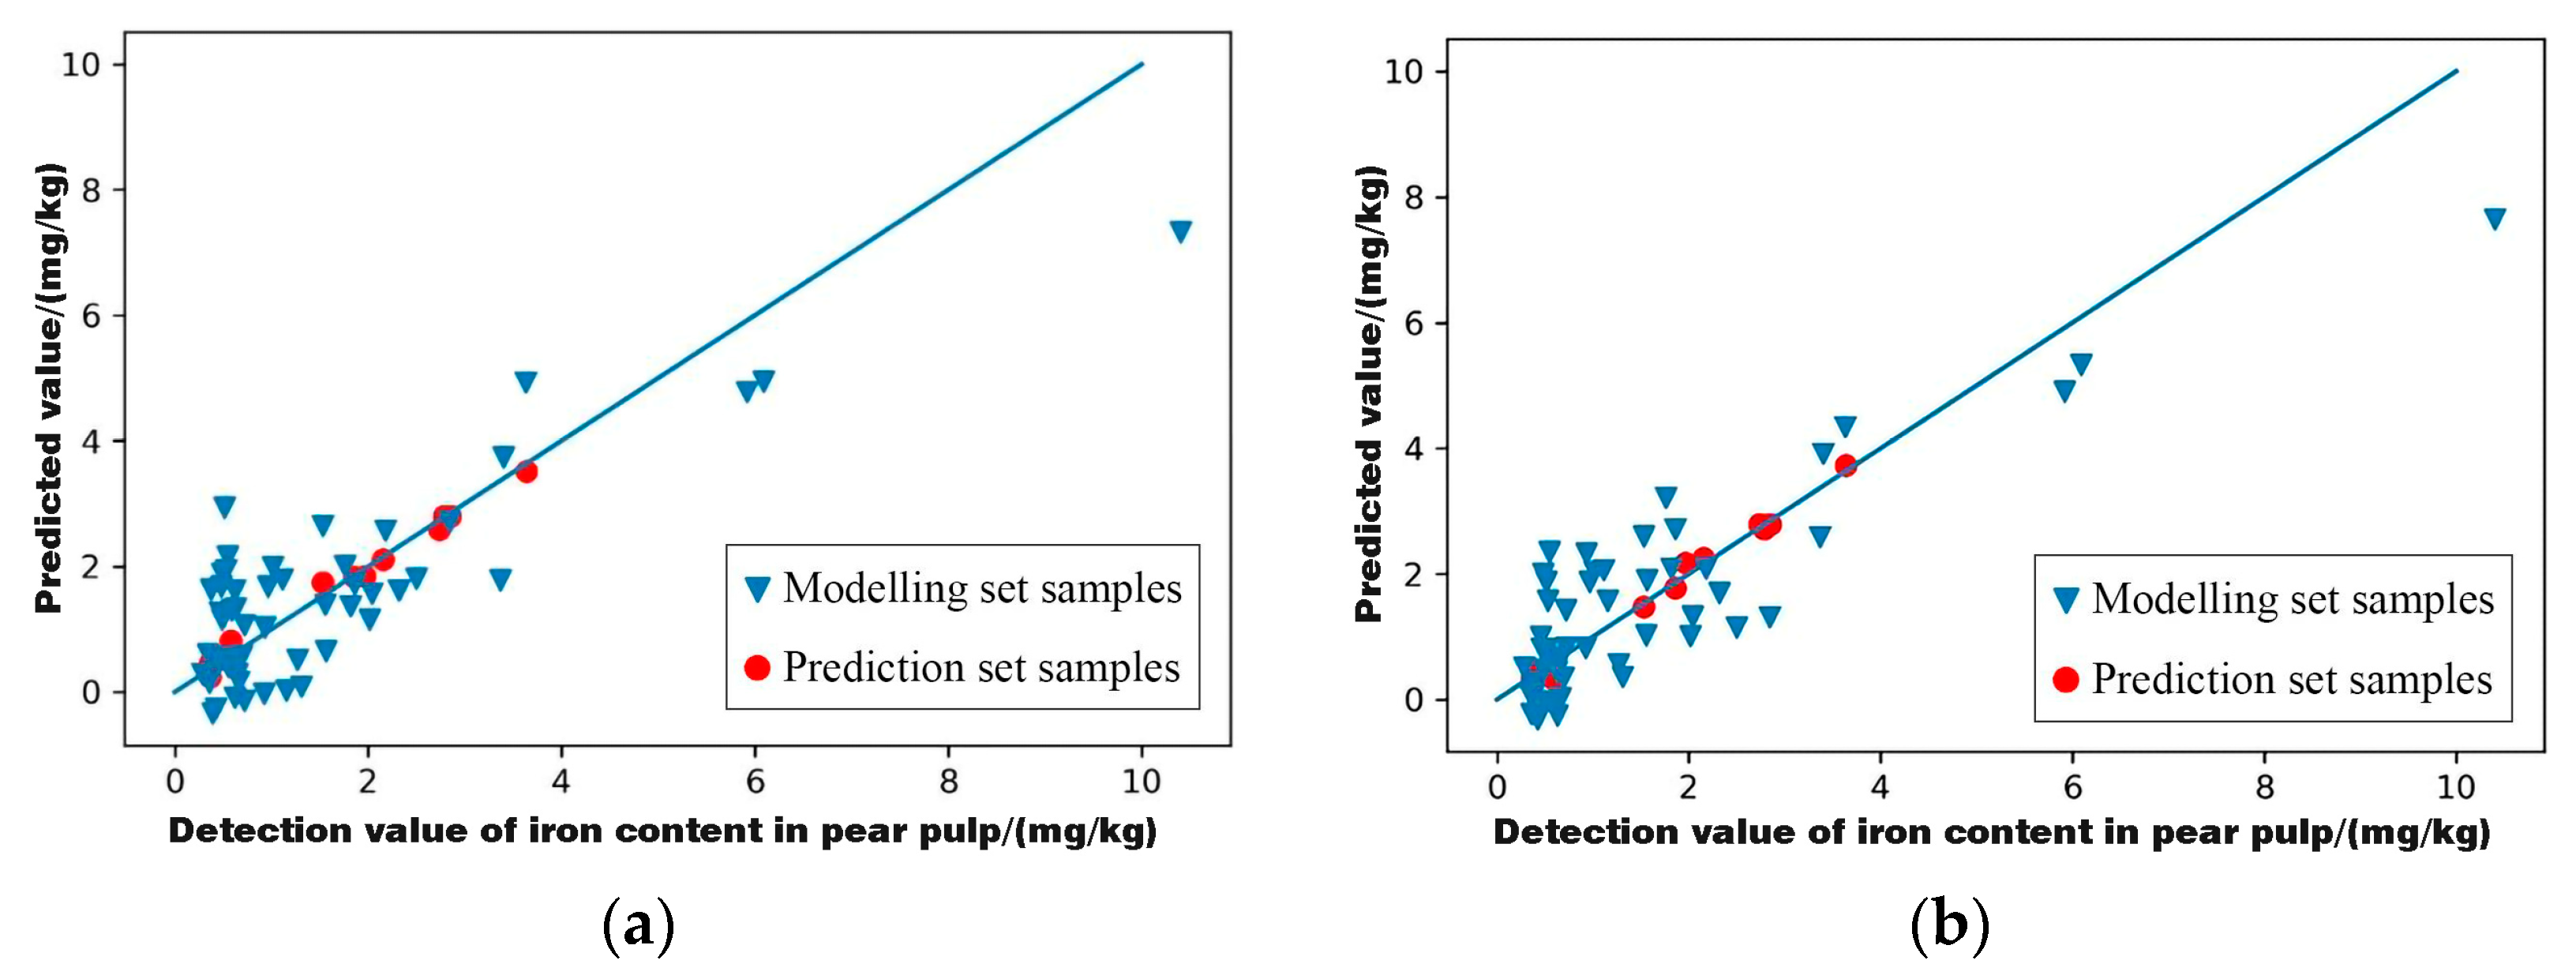
3.6.2. Based on the Characteristic Wavelength, a Model for Predicting the Iron Content in Pear Pulp was Established

This is shown in Figure 7, after GA feature extraction, the two prediction models obtained reached the A prediction level, which can be used to predict the iron content in the pulp of ‘Huangguan’ pear. The GA algorithm has a positive significance for improving the fitting effect of the model.

3.7. Model Effect Evaluation

From the above-mentioned experimental analysis, it can be seen that under the conditions of this experiment, the optimal prediction model for the iron content in the peel and pulp of ‘Huangguan’ pear is to use the GA algorithm to extract characteristic wavelengths from the spectral data curve preprocessed using SG + MSC + FD and then combine the prediction model established using the PLSR algorithm—SG + SNV + FD-GA-PLSR. The model satisfactorily predicts the iron content in pear peel, R² = 0.998 and RPD = 15.819 for the modeling set, R² = 0.987 and RPD = 6.222 for the prediction set, the fitting effect of the modeling set is slightly better than that of the prediction set, and the model effect meets the prediction standard of the class A model. The model also satisfactorily predicts the iron content in pear pulp and fits well, R² = 0.753 and RPD = 1.521 for the modeling set, R² = 0.989 and RPD = 6.793 for the prediction set, and the model effect meets the prediction standard of a class A model.

4. Discussion

As one of the important trace elements in plants, iron is essential for the growth of the ‘Huangguan’ pear tree. Iron belongs to a prosthetic group of a variety of enzymes in plants and is an important carrier of the electron transport chain. The presence of iron in pear trees is a necessary condition for achieving an abundant and excellent fruit yield, and timely detection of the iron content in fruits and targeted adjustment of agricultural methods, such as fertilization and irrigation, are of high significance to the nutritional growth and fruit quality improvement of pear trees in the later stage [3,38,39]. At the same time, because pear trees absorb iron, which is preferentially transported to new leaves, young shoots, developing fruits, etc., whether the iron content in pear fruits is normal can be used as a reference to judge whether the plant is iron deficient. Combined with some lesion characteristics of pear trees, this can help determine the physiological diseases afflicting pear trees, such as iron-deficiency yellow leaf disease. Rapid detection of the mineral element content in fruits has a variety of applications in agriculture. Based on the rapidly developing near-infrared spectroscopy (900 nm~1700 nm) technology in recent years, this paper took 65 ‘Huangguan’ pear fruits with good growth from Dangshan County, Anhui Province, as test samples and detected the iron content in the pear peel and pulp after near-infrared spectra acquisition. The 12 methods included Savitzky-Golay convolutional smoothing (SG), multiple scattering correction (MSC), standard normal variety (SNV), logarithmic transformation (LG), first derivative (FD), and second derivative (SD). Combinations of two single preprocessing algorithms (SG + SNV and SG + MSC) and combinations of three single preprocessing methods (SG + MSC + SD, SG + MSC + FD, SG + SNV + FD, SG + SNV + SD, and SG + SNV + SD) were used to preprocess the original spectral data [40]. Next, partial least squares regression (PLSR) [41] and gradient boosting regression tree (GBRT) algorithms were used to establish a prediction model for mineral element content, establish a full-band prediction model, and preliminarily screen out two models that meet the criteria for predicting the iron content in pear peel and two models that meet the criteria for predicting the iron content in pear pulp. The genetic algorithm (GA) was used to extract the characteristic wavelength, and a characteristic wavelength prediction model was established to further improve the accuracy of the model.
After research evaluation, the SG + SNV + FD-GA-PLSR model was found to have the best predictive effect on the iron content in pear peel and pulp among all established models, and the model predicted the iron content in pear peel with R² = 0.998, RPD = 15.819, R² = 0.987, and RPD = 6.222 for the prediction set of ‘Huangguan’ pear peel. In predicting the iron content in the pulp of ‘Huangguan’ pear, the model had values of R² = 0.753, RPD = 1.521, R² = 0.989, and RPD = 6.793 for the prediction set. The predictive models all reach class A, the fitting effect is good, and they can be used as predictive models. The experimental data show that under the experimental conditions, the prediction model established using the PLSR algorithm is generally better than the prediction model established using the GBRT algorithm, and the GBRT algorithm is not suitable for the prediction of the mineral element content in the fruit of ‘Huangguan’ pear. In the extraction of feature wavelengths, we can see that the extraction after different pretreatments was slightly different, but most of the extracted feature wavelengths were concentrated between 920 and 1100 nm, 1150 and 1300 nm, and 1450 and 1650 nm, which is similar to the ‘Huangguan’ pear’s spectral information related to the iron content, which may be concentrated between these three bands, and the literature shows that in the range of 900~1700 nm, there are some chemical bonds with saturated activity, such as X-H bonds, C=O bonds of esters, C=N bonds of amines, etc. [42]. At the same time, in addition to using the genetic algorithm to extract feature wavelengths, this experiment also tried to use a differential evolution algorithm to extract feature wavelengths, but the modeling results in the later stage were poor, and the model fitting effect even had a downwards trend. It can be seen that the specific method has an improvement effect on the establishment of a prediction model for mineral element content in pear fruit but still needs to be further verified. In view of the lack of research on the detection of mineral elements in pear fruit, this experiment can provide some theoretical reference for the detection of mineral elements in pear fruit using near-infrared spectroscopy.

5. Conclusions

In summary, the results of this paper prove that the nondestructive prediction of the iron content in the peel and pulp of ‘Huangguan’ pear can be quickly and accurately realized by using a miniature near-infrared spectrometer, the model fitting effect is good, and actual production practice can be carried out, which can help identify difficult physiological diseases, such as yellow leaf disease, and guide practical agricultural methods. This study can provide part of the theoretical basis for near-infrared spectroscopy in the nondestructive detection of mineral elements in ‘Huangguan’ pear fruit, and subsequent research will further expand the number and range of samples and further improve the universality and accuracy of the model. Using a variety of pear fruit samples, the contents of N, K, Ca, and other mineral elements were determined to construct a wide and comprehensive pear fruit mineral element detection model. Combined with a computer, a small, portable near-infrared spectroscopy mineral element detection instrument was developed to further realize direct detection in the field and apply the test theory to actual production.

Author Contributions

Conceptualization, L.L. (Liangjun Li) and J.F.; methodology, L.L. (Li Liu); software, X.J.; validation, C.L. and H.Z.; formal analysis, J.X.; investigation, B.J.; resources, L.L. (Li Liu); data curation, X.C.; writing—original draft preparation, L.L. (Li Liu); writing—review and editing, J.F. and W.H.; visualization, L.L. (Li Liu); supervision, W.Q.; project administration, L.L. (Li Liu); funding acquisition, L.L. (Liangjun Li). All authors have read and agreed to the published version of the manuscript.

Funding

This research was supported by the Anhui Agricultural University Talent Project (rc322213), the China Agriculture Research System of MOF and MARA, and the Key Research Project of Natural Science in colleges and universities of the Anhui Provincial Department of Education in 2021 (KJ2021A0188).

Institutional Review Board Statement

Not applicable.

Informed Consent Statement

Not applicable.

Data Availability Statement

Not applicable.

Conflicts of Interest

The authors declare no conflict of interest.

References

  1. Higuchi, K.; Saito, A. Elucidation of efficient photosynthesis in plants with limited iron. Soil Sci. Plant Nutr. 2022, 68, 505–513. [Google Scholar] [CrossRef]
  2. Zhao, Y.; Liu, S.; Li, F.; Sun, M.; Liang, Z.; Sun, Z.; Yu, F.; Li, H. The low ferric chelate reductase activity and high apoplastic pH in leaves cause iron deficiency chlorosis in ‘Huangguan’ pears grafted onto quince A grown in calcareous soil. Sci. Hortic. 2023, 310, 111754. [Google Scholar] [CrossRef]
  3. Sorrenti, G.; Toselli, M.; Marangoni, B. Use of compost to manage Fe nutrition of pear trees grown in calcareous soil. Sci. Hortic. 2012, 136, 87–94. [Google Scholar] [CrossRef]
  4. Ikinci, A.; Bolat, I.; Ercisli, S.; Esitken, A. Response of Yield, Growth and Iron Deficiency Chlorosis of ‘Santa Maria’ Pear Trees on Four Rootstocks. Not. Bot. Horti Agrobot. Cluj-Napoca 2016, 44, 563–567. [Google Scholar] [CrossRef] [Green Version]
  5. Zhang, W.; Wang, X.; Lu, T.; Shi, H.; Zhao, Y. Influences of soil properties and hydrological processes on soil carbon dynamics in the cropland of North China Plain. Agric. Ecosyst. Environ. 2020, 295, 106886. [Google Scholar] [CrossRef]
  6. Zhao, Y.; Sun, M.; Liang, Z.; Li, H.; Yu, F.; Liu, S. Analysis of contrast iron chlorosis tolerance in the pear cv. ‘Huangguan’ grafted onto pyres betulifolia and quince A grown in calcareous soils. Sci. Hortic. 2020, 271, 109488. [Google Scholar] [CrossRef]
  7. Jia, B.; Chang, X.; Fu, Y.; Heng, W.; Ye, Z.; Liu, P.; Liu, L.; Al Shoffe, Y.; Watkins, C.B.; Zhu, L. Metagenomic analysis of rhizosphere microbiome provides insights into occurrence of iron deficiency chlorosis in field of Asian pears. BMC Microbiol. 2022, 22, 18. [Google Scholar] [CrossRef]
  8. Wang, X.-Z.; Chang, Y.-Y.; Chen, Y.; Wu, H.-L.; Wang, T.; Ding, Y.-J.; Yu, R.-Q. Geographical origin traceability of medicine food homology species based on an extract-and-shoot inductively coupled plasma mass spectrometry method and chemometrics. Microchem. J. 2022, 183, 107937. [Google Scholar] [CrossRef]
  9. Li, C.; Cui, Z.-H.; Li, Z.; Gao, L.; Zhang, C.-Y.; Li, D.-X.; Zhang, Z.-M.; Huang, X.-Z. Determination of Mineral Elements in Nanyang Mugwort (Artemisia argyi) Leaves Harvested from Different Crops by Inductively Coupled Plasma Mass Spectrometry and Inductively Coupled Plasma Atomic Emission Spectrometry. Chem. Pharm. Bull. 2021, 69, 411–413. [Google Scholar] [CrossRef]
  10. Zhang, J.; Yuan, T.; Wang, Y.; Zhao, Y.; Zhang, J.; Jin, H. Determination of Mineral Elements in Gentiana rigescens from Different Zones of Yunnan, China. Biol. Trace Elem. Res. 2012, 147, 329–333. [Google Scholar] [CrossRef]
  11. Rossa, U.B.; Angelo, A.C.; Nisgoski, S.; Westphalen, D.J.; Tobaldini Frizon, C.N.; Hoffmann-Ribani, R. Application of the NIR Method to Determine Nutrients in Yerba Mate (Ilex paraguariensis A. St.-Hill) Leaves. Commun. Soil Sci. Plant Anal. 2015, 46, 2323–2331. [Google Scholar] [CrossRef]
  12. Mir-Marques, A.; Martinez-Garcia, M.; Garrigues, S.; Luisa Cervera, M.; de la Guardia, M. Green direct determination of mineral elements in artichokes by infrared spectroscopy and X-ray fluorescence. Food Chem. 2016, 196, 1023–1030. [Google Scholar] [CrossRef]
  13. Lastras, C.; Revilla, I.; Gonzalez-Martin, M.I.; Vivar-Quintana, A.M. Prediction of fatty acid and mineral composition of lentils using near infrared spectroscopy. J. Food Compos. Anal. 2021, 102, 104023. [Google Scholar] [CrossRef]
  14. Greenhall, J.; Sinha, D.N.; Pantea, C. Genetic algorithm-wavelet transform feature extraction for data-driven acoustic resonance spectroscopy. IEEE Trans. Ultrason. Ferroelectr. Freq. Control 2023, 70, 736–747. [Google Scholar] [CrossRef] [PubMed]
  15. Sota-Uba, I.; White, C.G.G.; Booksh, K.; Lavine, B.K.K. Authentication of edible oils using an infrared spectral library and digital sample sets: A feasibility study. J. Chemom. 2023, 37, e3469. [Google Scholar] [CrossRef]
  16. Caredda, M.; Mara, A.; Ciulu, M.; Floris, I.; Pilo, M.I.; Spano, N.; Sanna, G. Use of genetic algorithms in the wavelength selection of FT-MIR spectra to classify unifloral honeys from Sardinia. Food Control 2023, 146, 109559. [Google Scholar] [CrossRef]
  17. Ba, W.; Jin, X.; Lu, J.; Rao, Y.; Zhang, T.; Zhang, X.; Zhou, J.; Li, S. Research on predicting early Fusarium head blight with asymptomatic wheat grains by micro-near infrared spectrometer. Spectrochim. Acta Part A Mol. Biomol. Spectrosc. 2023, 287, 122047. [Google Scholar] [CrossRef]
  18. Jin, X.; Wang, L.; Zheng, W.; Zhang, X.; Liu, L.; Li, S.; Rao, Y.; Xuan, J. Predicting the nutrition deficiency of fresh pear leaves with a miniature near-infrared spectrometer in the laboratory. Measurement 2022, 188, 110553. [Google Scholar] [CrossRef]
  19. Wang, Y.-J.; Jin, S.-S.; Li, M.-H.; Liu, Y.; Li, L.-Q.; Ning, J.-M.; Zhang, Z.-Z. Onsite nutritional diagnosis of tea plants using micro near-infrared spectrometer coupled with chemometrics. Comput. Electron. Agric. 2020, 175, 105538. [Google Scholar] [CrossRef]
  20. Liu, H.; Zhang, Z.; Yang, Y.; Chen, T.; Zhang, C. Identification terahertz spectra for the dyestuffs based on principal component analysis and Savitzky-Golay filter. Optik 2018, 172, 668–673. [Google Scholar] [CrossRef]
  21. Antonov, L. An alternative for the calculation of derivative spectra in the near-infrared spectroscopy. J. Near Infrared Spectrosc. 2017, 25, 145–148. [Google Scholar] [CrossRef]
  22. Shang, T.-H.; Chen, R.-H.; Zhang, J.-H.; Wang, Y.-J. Estimation of soil organic matter content in Yinchuan Plain based on fractional derivative combined with spectral indices. Ying Yong Sheng Tai Xue Bao J. Appl. Ecol. 2023, 34, 717–725. [Google Scholar] [CrossRef]
  23. Ayman, A.; Zeid, A.M.; Wahba, M.E.K.; El-Shabrawy, Y. Simultaneous determination of ergotamine, caffeine and dipyrone in their ternary mixture by applying double divisor and first derivative ratio spectra methods. Ann. Pharm. Françaises 2022, 80, 718–729. [Google Scholar] [CrossRef] [PubMed]
  24. Zhang, X.; Nie, L.; Gao, H.; Yu, H.; Liu, D. Applying second derivative synchronous fluorescence spectroscopy combined with Gaussian band fitting to trace variations of DOM fractions along an urban river. Ecol. Indic. 2023, 146, 109872. [Google Scholar] [CrossRef]
  25. Li, Q.; Tu, G.; Zhang, X.; Cheng, S.; Yang, T. Application of a back propagation neural network model based on genetic algorithm to in situ analysis of marine sediment cores by X-ray fluorescence core scanner. Appl. Radiat. Isot. 2022, 184, 110191. [Google Scholar] [CrossRef] [PubMed]
  26. Chrysouli, C.; Tefas, A. Spectral clustering and semi-supervised learning using evolving similarity graphs. Appl. Soft Comput. 2015, 34, 625–637. [Google Scholar] [CrossRef]
  27. El-Zeiny, M.B.; Zawbaa, H.M.; Serag, A. An evaluation of different bio-inspired feature selection techniques on multivariate calibration models in spectroscopy. Spectrochim. Acta Part A Mol. Biomol. Spectrosc. 2021, 246, 119042. [Google Scholar] [CrossRef] [PubMed]
  28. Vera-Velez, R.; Grover, S.A.; Bischoff, B.K.; Carlyle, C.N.; Lamb, E.G. Wildfire-Grazing Impact on Forage Quality Assessed with Near-Infrared Spectroscopy and Generalized Partial Least Squares Regression. Rangel. Ecol. Manag. 2023, 87, 132–140. [Google Scholar] [CrossRef]
  29. Shan, P.; Bi, Y.; Li, Z.; Wang, Q.; He, Z.; Zhao, Y.; Peng, S. Unsupervised model adaptation for multivariate calibration by domain adaptation-regularization based kernel partial least square. Spectrochim. Acta Part A Mol. Biomol. Spectrosc. 2023, 292, 122418. [Google Scholar] [CrossRef]
  30. Sagar, C.; Singh, D.K.; Sharma, N. A Gradient Boosted Regression Tree Ensemble Model Using Wavelet Features for Post-acquisition Macromolecular Baseline Isolation from Brain MR Spectra. Appl. Magn. Reson. 2023, 54, 637–655. [Google Scholar] [CrossRef]
  31. Wei, L.; Yuan, Z.; Zhong, Y.; Yang, L.; Hu, X.; Zhang, Y. An Improved Gradient Boosting Regression Tree Estimation Model for Soil Heavy Metal (Arsenic) Pollution Monitoring Using Hyperspectral Remote Sensing. Appl. Sci. 2019, 9, 1943. [Google Scholar] [CrossRef] [Green Version]
  32. Chang, C.W.; Laird, D.A.; Mausbach, M.J.; Hurburgh, C.R. Near-infrared reflectance spectroscopy-principal components regression analyses of soil properties. Soil Sci. Soc. Am. J. 2001, 65, 480–490. [Google Scholar] [CrossRef] [Green Version]
  33. Shi, S.; Zhao, D.; Pan, K.; Ma, Y.; Zhang, G.; Li, L.; Cao, C.; Jiang, Y. Combination of near-infrared spectroscopy and key wavelength-based screening algorithm for rapid determination of rice protein content. J. Food Compos. Anal. 2023, 118, 105216. [Google Scholar] [CrossRef]
  34. Zhu, H.; Yang, L.; Han, Z. Quantitative aflatoxin B1 detection and mining key wavelengths based on deep learning and hyperspectral imaging in subpixel level. Comput. Electron. Agric. 2023, 206, 107561. [Google Scholar] [CrossRef]
  35. Li, X.; Wang, T.; Bin, Z.; Gao, W.; Cao, J.; Huang, L. Chemical composition and antioxidant and anti-inflammatory potential of peels and flesh from 10 different pear varieties (Pyrus spp.). Food Chem. 2014, 152, 531–538. [Google Scholar] [CrossRef] [PubMed]
  36. Fang, J.; Jin, X.; Wu, L.; Zhang, Y.; Jia, B.; Ye, Z.; Heng, W.; Liu, L. Prediction Models for the Content of Calcium, Boron and Potassium in the Fruit of ‘Huangguan’ Pears Established by Using Near-Infrared Spectroscopy. Foods 2022, 11, 3642. [Google Scholar] [CrossRef]
  37. Grgic, F.; Jurina, T.; Valinger, D.; Kljusuric, J.G.; Tusek, A.J.; Benkovic, M. Near-Infrared Spectroscopy Coupled with Chemometrics and Artificial Neural Network Modeling for Prediction of Emulsion Droplet Diameters. Micromachines 2022, 13, 1876. [Google Scholar] [CrossRef]
  38. Sorrenti, G.; Toselli, M. Post-harvest foliar-applied Fe(II)-sulfate promotes Fe nutrition of pear trees grown in calcareous soil. J. Plant Nutr. 2020, 43, 3020–3034. [Google Scholar] [CrossRef]
  39. Morales, F.; Belkhodja, R.; Abadia, A.; Abadia, J. Photosystem II efficiency and mechanisms of energy dissipation in iron-deficient, field-grown pear trees (Pyrus communis L.). Photosynth. Res. 2000, 63, 9–21. [Google Scholar] [CrossRef] [Green Version]
  40. Tsagkaris, A.S.; Bechynska, K.; Ntakoulas, D.D.; Pasias, I.N.; Weller, P.; Proestos, C.; Hajslova, J. Investigating the impact of spectral data pre-processing to assess honey botanical origin through Fourier transform infrared spectroscopy (FTIR). J. Food Compos. Anal. 2023, 119, 105276. [Google Scholar] [CrossRef]
  41. Aparatana, K.; Naomasa, Y.; Sano, M.; Watanabe, K.; Mitsuoka, M.; Ueno, M.; Kawamitsu, Y.; Taira, E. Predicting sugarcane quality using a portable visible near infrared spectrometer and a benchtop near infrared spectrometer. J. Near Infrared Spectrosc. 2023, 31, 14–23. [Google Scholar] [CrossRef]
  42. Mills, J.D. Mitochondria-Targetable Ratiometric Time-Gated Luminescence Probe Activated by Selenocysteine for the Visual Monitoring of Liver Injuries. J. Phys. Chem. A 2023, 95, 4024–4032. [Google Scholar] [CrossRef]
Figure 1. Schematic diagram of the surface spectral acquisition point of pear fruit.
Horticulturae 09 00773 g001
Figure 2. (a) Original spectral reflectance map and (b) average spectral reflectance map of all tested ‘Huangguan’ pears.
Horticulturae 09 00773 g002
Figure 3. Spectral curves after different pretreatments: (a) FD, (b) SD, (c) MSC, (d) SNV, (e) SG, (f) LG, (g) SG + MSC, (h) SG + SNV, (i) SG + MSC + FD, (j) SG + MSC + SD, (k) SG + SNV + FD, and (l) SG + SNV + SD.
Horticulturae 09 00773 g003
Figure 4. Location distribution of characteristic wavelength extraction points of the iron content prediction model for pear peel: (a) SG + MSC + FD-GA-PLSR and (b) SG + SNV + FD-GA-PLSR.
Horticulturae 09 00773 g004
Figure 5. Location distribution of characteristic wavelength extraction points of the iron content prediction model for pear pulp: (a) SG + MSC + FD-GA-PLSR and (b) SG + SNV + FD-GA-PLSR.
Horticulturae 09 00773 g005
Figure 6. Model prediction of the iron content in pear peel samples (scatter plot): (a) SG + MSC + FD-GA-PLSR and (b) SG + SNV + FD-GA-PLSR.
Horticulturae 09 00773 g006
Figure 7. Model prediction of the iron content in pear pulp samples (scatter plot): (a) SG + MSC + FD-GA-PLSR and (b) SG + SNV + FD-GA-PLSR.
Horticulturae 09 00773 g007
Table 1. Classification of iron content detection samples in pear peel and pulp and parameter statistics.
SetsSample
Size
Maximum
(mg/kg)
Minimum
(mg/kg)
Average
(mg/kg)
Standard Deviation
Modeling set (Peel)5295.958.7529.7919.42
Prediction set (peel)1366.577.4825.0818.86
Modeling set (pulp)5210.400.281.521.77
Prediction set (pulp)133.640.371.681.08
Table 2. Full-band modeling and prediction results of the iron content in pear peel based on PLSR and GBRT algorithms.
Modeling MethodsPreprocessing MethodsModeling SetsPrediction SetsClass of Models
RPDRPD
PLSRRaw (not preprocessed)0.9553.3710.5471.195C
SNV0.9222.5830.6031.254C
FD0.9392.9080.6971.395C
MSC0.8712.0350.6571.326C
SD0.6481.3130.6311.289C
SG0.9553.3710.5471.195C
LG0.9222.5830.6781.360C
SG + MSC0.8712.0350.6571.326C
SG + SNV0.9222.5830.6031.254C
SG + MSC + FD0.7671.5580.7331.470B
SG + MSC + SD0.8381.8330.6511.317C
SG + SNV + FD0.7731.5760.7331.470B
SG + SNV + SD0.8381.8330.6501.316C
GBRTRaw (not preprocessed)0.99922.3660.4491.119C
SNV0.99922.3660.4271.106C
FD0.9352.8200.4271.106C
MSC0.9433.0050.4691.132C
SD0.8992.2830.4081.095C
SG0.99922.3660.4981.153C
LG0.7641.5500.5301.179C
SG + MSC0.99922.3660.4691.132C
SG + SNV0.99922.3660.4241.104C
SG + MSC + FD0.8651.9930.4631.128C
SG + MSC + SD0.99922.3660.4021.092C
SG + SNV + FD0.99922.3660.5181.169C
SG + SNV + SD0.7991.6630.5241.174C
Table 3. Full-band modeling and prediction results of iron content in pear pulp based on PLSR and GBRT algorithms.
Modeling MethodsPreprocessing MethodModeling SetsPrediction SetClass of Models
RPDRPD
PLSRRaw (not preprocessed)0.9917.640.1671.014C
SNV0.0871.0040.0151.000C
FD0.8191.7430.6331.291C
MSC0.0871.0040.0151.000C
SD0.8842.1420.6111.264C
SG0.9917.640.1671.014C
LG0.99954.940.3931.087C
SG + MSC0.0871.0040.0151.000C
SG + SNV0.0871.0040.0151.000C
SG + MSC + FD0.8401.8460.7211.445B
SG + MSC + SD0.8722.040.541.188C
SG + SNV + FD0.8541.9230.7251.451B
SG + SNV + SD0.8732.050.541.188C
GBRTRaw (not preprocessed)0.9855.7670.4121.098C
SNV0.5921.2410.2621.036C
FD0.997.0890.611.262C
MSC0.5921.2410.1771.016C
SD0.997.0890.21.021C
SG0.9855.7660.4131.098C
LG0.8942.2330.3941.088C
SG + MSC0.5921.2410.1771.016C
SG + SNV0.5921.2410.2621.036C
SG + MSC + FD0.9422.9910.5191.170C
SG + MSC + SD0.997.0890.2561.034C
SG + SNV + FD0.9422.9910.5191.170C
SG + SNV + SD0.997.0780.2091.022C
Table 4. Extraction results of characteristic spectral data of the iron content prediction model for pear peel.
Characteristic Wavelength Extraction MethodModelsExtract the Number of Characteristic WavelengthsSpecific Characteristic Bands (nm)
GASG + MSC + FD
-PLSR
106901.57, 909.36, 933.92, 945.50, 949.35, 957.03, 960.87, 964.70, 969.80, 973.63, 977.45, 981.26, 996.48, 1000.27,1009.10,
1012.88, 1020.43, 1024.19, 1039.22, 1044.21, 1051.68, 1059.14,1082.65, 1090.04, 1093.72, 1104.76, 1108.43, 1116.98, 1124.29,1135.22, 1138.85, 1150.94, 1154.56, 1165.38, 1168.98, 1176.17,1198.82, 1202.38, 1205.93, 1209.49, 1213.03, 1216.58, 1224.83,1228.36, 1231.88, 1242.44, 1249.45, 1254.11, 1261.10, 1268.06,
1271.54, 1278.48, 1285.41, 1303.79, 1310.66, 1314.08, 1317.50,1322.06, 1339.07, 1373.89, 1380.58, 1404.96, 1414.87, 1429.11,1438.93, 1453.04, 1456.28, 1462.76, 1478.88, 1482.09, 1486.36,1489.56, 1492.76, 1516.07, 1522.39, 1525.54, 1528.69, 1531.84,1534.98, 1538.11, 1541.25, 1548.54, 1551.65, 1557.88, 1567.18
1573.36, 1586.69, 1589.76, 1592.82, 1598.93, 1601.98, 1606.04,1615.14, 1618.17, 1624.21, 1627.22, 1643.22, 1646.21, 1649.19,1658.11, 1667.98, 1670.93, 1685.63, 1691.47, 1695.36, 1698.27.
SG + SNV + FD
-PLSR
107901.57, 909.36, 941.64, 969.80, 985.07, 996.48, 1000.27,1012.88,1031.71, 1039.22, 1044.21, 1051.68, 1055.42, 1059.14, 1078.95
1082.65, 1086.34, 1090.04, 1097.41, 1104.76, 1138.85, 1142.48, 1150.94, 1168.98, 1176.17, 1184.53, 1195.25, 1198.82, 1202.38, 1205.93, 1213.03, 1216.58, 1221.30, 1224.83, 1228.36, 1235.41, 1245.94, 1249.45, 1261.10, 1264.58, 1268.06, 1275.02, 1278.48, 1290.02, 1300.36, 1303.79, 1307.23, 1310.66, 1314.08, 1317.50
1322.06, 1328.87, 1339.07, 1342.46, 1357.10, 1360.47, 1363.83, 1370.54, 1377.24, 1383.92, 1388.36, 1391.69, 1395.02, 1398.34, 1404.96, 1422.55, 1425.83, 1438.93, 1442.19, 1453.04, 1478.88, 1486.36, 1492.76, 1495.95, 1502.32, 1505.50, 1511.85, 1516.07, 1519.23, 1525.54, 1528.69, 1531.84, 1541.25, 1544.37, 1548.54
1557.88, 1564.08, 1573.36, 1577.47, 1592.82, 1595.88, 1606.04, 1615.14, 1621.19, 1637.23, 1640.23, 1643.22, 1655.14, 1658.11, 1661.08, 1665.02, 1673.88, 1679.76, 1685.63, 1688.55, 1695.36, 1698.27
Table 5. Extraction results of the characteristic spectral data of the iron content prediction model for pear pulp.
Characteristic Wavelength Extraction MethodModelsExtract the Number of Characteristic WavelengthsSpecific Characteristic Bands (nm)
GASG + MSC + FD
-PLSR
120909.36, 921.02, 924.89, 933.92, 937.78, 941.64, 945.50, 953.19 964.70, 985.07, 988.88, 996.48, 1000.27, 1005.32, 1012.88 1016.66, 1031.71, 1035.47, 1055.42, 1059.14, 1062.87, 1074.01 1078.95, 1093.72, 1097.41, 1101.08, 1135.22, 1138.85, 1142.48 1165.38, 1172.58, 1176.17, 1184.53, 1195.25, 1198.82, 1209.49 1216.58, 1231.88, 1242.44, 1245.94, 1249.45, 1264.58, 1271.54 1278.48, 1281.95, 1285.41, 1293.47, 1296.91, 1300.36, 1303.79 1307.23, 1310.66, 1314.08, 1325.47, 1328.87, 1332.28, 1339.07 1345.85, 1363.83, 1367.19, 1377.24, 1380.58, 1383.92, 1391.69 1398.34, 1404.96, 1411.57, 1414.87, 1418.16, 1456.28, 1459.52 1472.44, 1475.66, 1478.88, 1489.56, 1492.76, 1495.95, 1502.32 1505.50, 1508.68, 1511.85, 1516.07, 1519.23, 1528.69, 1534.98 1538.11, 1541.25, 1548.54, 1551.65, 1554.77, 1567.18, 1570.27 1577.47, 1580.55, 1589.76, 1598.93, 1601.98, 1609.08, 1612.11 1618.17, 1621.19, 1627.22, 1630.23, 1633.23, 1643.22, 1646.21 1649.19, 1652.17, 1655.14, 1658.11, 1661.08, 1665.02, 1667.98 1673.88, 1676.82, 1679.76, 1682.70, 1688.55, 1691.47, 1698.27
SG + SNV + FD
-PLSR
111913.25, 921.02, 930.06, 933.92, 937.78, 945.50, 949.35, 953.19 964.70, 973.63, 985.07, 992.68, 1009.10, 1012.88, 1016.66 1031.71, 1044.21, 1047.95, 1051.68, 1059.14, 1062.87, 1070.30 1074.01, 1086.34, 1093.72, 1112.10, 1116.98, 1124.29, 1127.93 1131.58, 1138.85, 1146.11, 1165.38, 1168.98, 1179.76, 1184.53 1188.11, 1191.68, 1195.25, 1198.82, 1205.93, 1209.49, 1224.83 1228.36, 1231.88, 1235.41, 1242.44, 1254.11, 1257.61, 1268.06 1271.54, 1275.02, 1290.02, 1293.47, 1296.91, 1300.36, 1307.23 1314.08, 1322.06, 1332.28, 1339.07, 1342.46, 1363.83, 1367.19 1373.89, 1383.92, 1401.65, 1404.96, 1408.27, 1411.57, 1425.83 1435.66, 1445.45, 1459.52, 1462.76, 1469.22, 1472.44, 1495.95 1499.14, 1502.32, 1511.85, 1519.23, 1522.39, 1528.69, 1531.84 1534.98, 1541.25, 1554.77, 1557.88, 1564.08, 1567.18, 1570.27 1573.36, 1583.62, 1589.76, 1595.88, 1618.17, 1630.23, 1633.23 1637.23, 1640.23, 1646.21, 1649.19, 1661.08, 1670.93, 1676.82 1679.76
Table 6. Modeling results of the iron content in pear peel based on characteristic wavelengths.
ModelsModeling SetsPrediction SetClass of Models
RPDRPD
SG + MSC + FD-GA-PLSR0.99712.9200.9764.592A
SG + SNV + FD-GA-PLSR0.9985.8190.9876.222A
Table 7. Modeling results of the iron content in pear pulp based on characteristic wavelengths.
ModelsModeling SetsPrediction SetClass of Models
R2RPDR2RPD
SG + MSC + FD-GA-PLSR0.7011.4030.9876.405A
SG + SNV + FD-GA-PLSR0.7531.5210.9896.793A
Disclaimer/Publisher’s Note: The statements, opinions and data contained in all publications are solely those of the individual author(s) and contributor(s) and not of MDPI and/or the editor(s). MDPI and/or the editor(s) disclaim responsibility for any injury to people or property resulting from any ideas, methods, instructions or products referred to in the content.

