Article

Sensory Evaluation and Spectra Evolution of Two Kiwifruit Cultivars during Cold Storage

1
CEOT, Universidade do Algarve, Campus de Gambelas, 8005-189 Faro, Portugal
2
Departamento de Física, FCT, Universidade do Algarve, Campus de Gambelas, 8005-189 Faro, Portugal
3
ESCAD, IPULSO, 1950-396 Lisboa, Portugal
4
MED, FCT, Universidade do Algarve, Campus de Gambelas, 8005-189 Faro, Portugal
*
Author to whom correspondence should be addressed.
Horticulturae 2023, 9(7), 772; https://doi.org/10.3390/horticulturae9070772
Submission received: 25 May 2023 / Revised: 22 June 2023 / Accepted: 3 July 2023 / Published: 6 July 2023
(This article belongs to the Collection Postharvest Handling of Horticultural Crops)

Abstract

:
Kiwifruit consumption has increased due to its rich nutritional properties. Although ‘Hayward’ continues to be the main cultivar, others, such as yellow fleshed ‘Jintao’, are of increasing interest. The objective of this research was to evaluate the acceptability and storage performance of these two cultivars. Sensory evaluation of green ‘Hayward’ and yellow ‘Jintao’ kiwifruit were performed along cold storage for three seasons/years to follow the organoleptic characteristics through ripening, as well as the acquisition of their spectra by Vis-NIR. For ‘Jintao’ were performed two sensory evaluations per year at 2.5- and 4.5-months’ storage and for ‘Hayward’ at 2.5-, 4.5- and 5.5-months’ storage. The nonparametric Mann–Whitney test and Kruskal–Wallis ANOVA were performed to test the significant differences between the mean ranks among the storage time. A non-metric multidimensional scaling plot method using the ALSCAL algorithm in a seven-point Likert scale was applied to determine the relationships in the data, and a new approach using the receiver operating characteristic (ROC) analysis was tested. The last revealed that, for both cultivars, sweetness, acidity and texture were the variables with better scores for General flavor. Aroma was also important on ‘Jintao’. A strong correlation between soluble solids content (SSC) and reflectance was found for both cultivars, with the 635–780 nm range being the most important. Regarding firmness, a good correlation with reflectance spectra was observed, particularly in ‘Hayward’ kiwifruit. Based on these results, Vis-NIR can be an objective alternative to explore for determination of the optimum eating-ripe stage.

1. Introduction

Kiwifruit is an economically important crop due to its taste and high nutritional properties [1,2]. The green fleshed Actinidia deliciosa cv. Hayward is the most commercialized cultivar on the international market, because of its size, taste and long storage life [3,4], maintaining good quality in terms of texture, flavour and freedom from disorders [5]. In fact, approximately 90% of the kiwifruit commercialized is ‘Hayward’ [6]. However, in recent years, yellow-fleshed A. chinensis var. chinensis cultivars ‘Hort16A’ ‘Jintao’, ‘Zesy002′, ‘Zesy003′, ‘Soreli’ and ‘Dori’ are becoming more popular [7]. The ‘Jintao’ cultivar selected at the Wuhan Institute of Botany (WIB), China, was introduced into Europe for evaluation in 1998, and as increased the growing area and interest, since then [8].
The aroma of kiwifruit is the result of a subtle mixture of volatile compounds [9]. ‘Hayward’ has a more acidic taste, described as grassy and sulphurous with a melon and sweet candy flavour at eating-ripe [10], while the yellow-fleshed kiwifruit has an intense tropical flavour [11], sweeter and with a higher commercial value than the green fleshed ones [3]. As climacteric fruit, during storage, mature kiwifruit ripens to an acceptable eating state by several changes including conversion of starch to soluble sugars and the softening of the flesh [12,13].
Organoleptic evaluation by consumers is a practical and cost-effective method to evaluate the freshness of agricultural products; however, the sensory information is affected by personal preferences, experiences and subjective feelings [14] and in fruit that ripen rapidly there is the risk that its quality can deteriorated prior to sensory and consumer assessments [15].
The use of a low-cost, reliable [16] and chemical-free method [17], that could provide useful information to predict the optimum eating-ripe phase would be a plus to fulfil consumers’ preference. An obvious option is the use of the visible-near infrared (Vis-NIR) spectroscopy, since it is one of the most successful non-destructive methods for quality assessment of fruits [18,19] and has been applied to assess the sensory attributes of different products such as apples [20], chicory [21], olive oil [22], cheese [23,24], coffee [25], grapes [26] and tea [27].
The goals of this paper were to use a new approach, the receiver operating characteristic (ROC) analysis, to evaluate and analyse the organoleptic characteristics during storage of two different cultivars, the yellow-fleshed ‘Jintao’ and the green-fleshed ‘Hayward’, in three years (seasons); and, besides that, follow-up their spectra evolution along the storage and investigate, attending future work, if typical Vis-NIR spectroscopy could be useful to determine optimum eating-ripe phase, considering the results of the sensory evaluation performed.

2. Material and Methods

2.1. Fruit

Yellow-fleshed kiwifruit (Actinidia chinensis Planch cv. Jintao) were harvested from two commercial orchards (41°39′23.6″ N, 8°18′21.6″ W and 41°38′58.2″ N, 8°18′26.0″ W), while kiwifruit Actinidia deliciosa (A. Chev.) C.F. Liang et A.R. Ferguson cv. Hayward were harvested in another two (41°37′46.9″ N, 8°23′16.5″ W and 41°37′29.9″ N, 8°19′47.5″ W). All four orchards were located in the Braga region, north Portugal.
After the commercial harvest season, fruit were shipped to the University of Algarve within 2 days and stored at 0 °C in normal atmosphere and relative humidity of 90–95%.

2.2. Sensory Evaluation

The taste panels were carried out by people recruited from faculty staff and students, which were trained to be familiar with such type of panels. These are people which usually participate in the taste panels carried out at the faculty. Groups with 15 to 32 elements, according to their availability due to COVID-19 times, performed the sensory evaluations based on a 7-point hedonic scale (1 = dislike extremely, 2 = dislike, 3 = slightly dislike, 4 = neither like nor dislike, 5 = slightly like, 6 = like, 7 = like very much) [28], for the following parameters: fruit appearance, pulp appearance, aroma, texture, sweetness, acidity, and general taste. In general, all parameters were evaluated after 2.5 and 4.5 months of storage for ‘Jintao’ kiwifruit and after 2.5, 4.5 and 5.5 months for ‘Hayward’ kiwifruit. In 2020, ‘Hayward’ kiwifruit parameters were only evaluated once due to COVID-19 pandemic. The storage time considered for both cultivars was according to their usual storage capacity, up to 5 months for ‘Jintao’ and 6 for ‘Hayward’ [29]. All fruit presented to the sensory panellists were at room temperature.

2.3. Spectroscopy

To follow-up spectra evolution during storage, eight fruit, from each cultivar, were drawn every 15 days. The temperature was registered with an infrared handheld digital thermometer EEM100 (Perel, Velleman, Belgium) and three Vis-NIR spectra acquired from each unpeeled kiwifruit, along the equatorial area, in a setup similar to the one described by Cavaco et al. [30], using a Vis-NIR spectrometer USB4000 (Ocean Optics, Orlando, FL, USA), working in the range 345–1037 nm, with an integration time of 20 msec and 50 averages, a light source LS-1-LL (Ocean Optics, Orlando, FL, USA), a bifurcated fibre with an interactance probe FCR-7UVIR400–2-BX/ME (Avantes, Apeldoorn, The Netherlands) held at a constant height above the fruit flesh (0.47 mm, through the use of a spacer) and a disk of Spectralon white surface (WS-1, Ocean Optics, Orlando, FL, USA) used as reference material.
Due to unavailability of the previous equipment, in 2019 and 2020, the spectrometer was replaced by AvaSpec-Mini2048CL (Avantes, Apeldoorn, The Netherlands), working in the range 145–1100 nm, integration time 1.2 msec and 50 averages, the light source by AvaLight-HAL-S-Mini (Avantes, Apeldoorn, The Netherlands) and the reference material by WS-2 reference tile (Avantes, Apeldoorn, The Netherlands).
It is essential to inquire about the impact of changing the spectrometer model on result consistency. In the realm of quantitative predictions in regression, it is widely recognized that replacing the spectrometer necessitates a process known as calibration transfer. Calibration transfer is a common procedure in chemometrics [31] and is frequently employed in fruit models, including kiwifruit [32,33]. This is due to the fact that even minor variations in the spectral shape can result in significant shifts in predictions. However, the purpose of the spectroscopic measurements in this study is to identify patterns and correlations in reflectance. Consequently, slight variations introduced by the spectrometer model do not alter the shape of the plots.

2.4. Internal Quality Attributes

After spectroscopic measurements, pulp firmness was determined by puncture with a texturometer (Chatillon TCD200, Digital Force Gauge DFIS 50, John Chatillon & Sons, Inc., Somerset Drive Largo, FL, USA) using a cylinder probe of 8 mm at a depth of 7 mm, at equatorial level in both sides. Then, 3 mm thick kiwifruit equatorial slices (1 per fruit) were cut, weighed and dried at 105 °C until constant weight for determination of dry matter (DM), expressed as percentage of dry weight relatively to fresh weight (%). The remaining of the kiwifruit were peeled and squeezed. The juice filtered by a cotton cloth was used for the measurements of SSC and titratable acidity (TA).
The SSC was determined by using a digital refractometer HI 96801 (Hanna Instruments, Woonsocket, RI, USA) and expressed as %. Total TA, expressed as mass percentage of citric acid per 100 mL juice (%), was determined by a TitroLine 6000 (SI Analytics, Mainz, Germany), using 2 mL kiwifruit juice diluted with 8 mL distilled water, and titrated with 0.1 M NaOH until a pH of 8.2.
Quality measurements were performed according to the AOAC [34].

2.5. Data Analysis

The descriptive statistical analysis of the quality attributes and sensory evaluation was performed in IBM SPSS Statistics 27 (IBM Corp., Armonk, NY, USA). Mann–Whitney independent nonparametric test was applied and a Kruskal–Wallis the non-parametric ANOVA was performed to test the significant differences between the mean ranks among the storage time, in different years. Pairwise comparisons to observe the differences and descriptive statistics based on median, minimum, maximum, range and interquartile range were also performed.
A non-metric multidimensional scaling plot method using the ALSCAL algorithm in a 7-point Likert scale was applied. This method performs multidimensional scaling of proximity or distance-like [35], and the results are represented in a cartesian plane, where each axis may be used for representing the overall position in the panellists’ mind. Multidimensional scaling refers to models that analyse distances between objects, having applied the Euclidian distances algorithm. Points are arranged in such a way that the geometrical distance between them will reflect empirical relationships in the data.
The most desirable property of receiver operating characteristic (ROC) analysis is that the accuracy indices derived from this technique are not distorted by fluctuations caused by decision criteria. For the application of this procedure, the “General taste” variable, evaluated by the panellist’s questionnaire, was considered in binary terms (1 = 7-point attribute of the maximum value and 0 = others). A model with a value above 0.5 is considered good, while a value less than 0.5 is no better than random prediction. This classification method is presented only as an accessory and complementary analysis tool.
The spectral data analysis was performed in MATLAB R2019a, version 9.6 (The MathWorks, Inc., Natick, MA, USA). Normalization procedure was used to pre-process the spectra acquired from the kiwifruit.

3. Results and Discussion

3.1. Sensory Evaluation

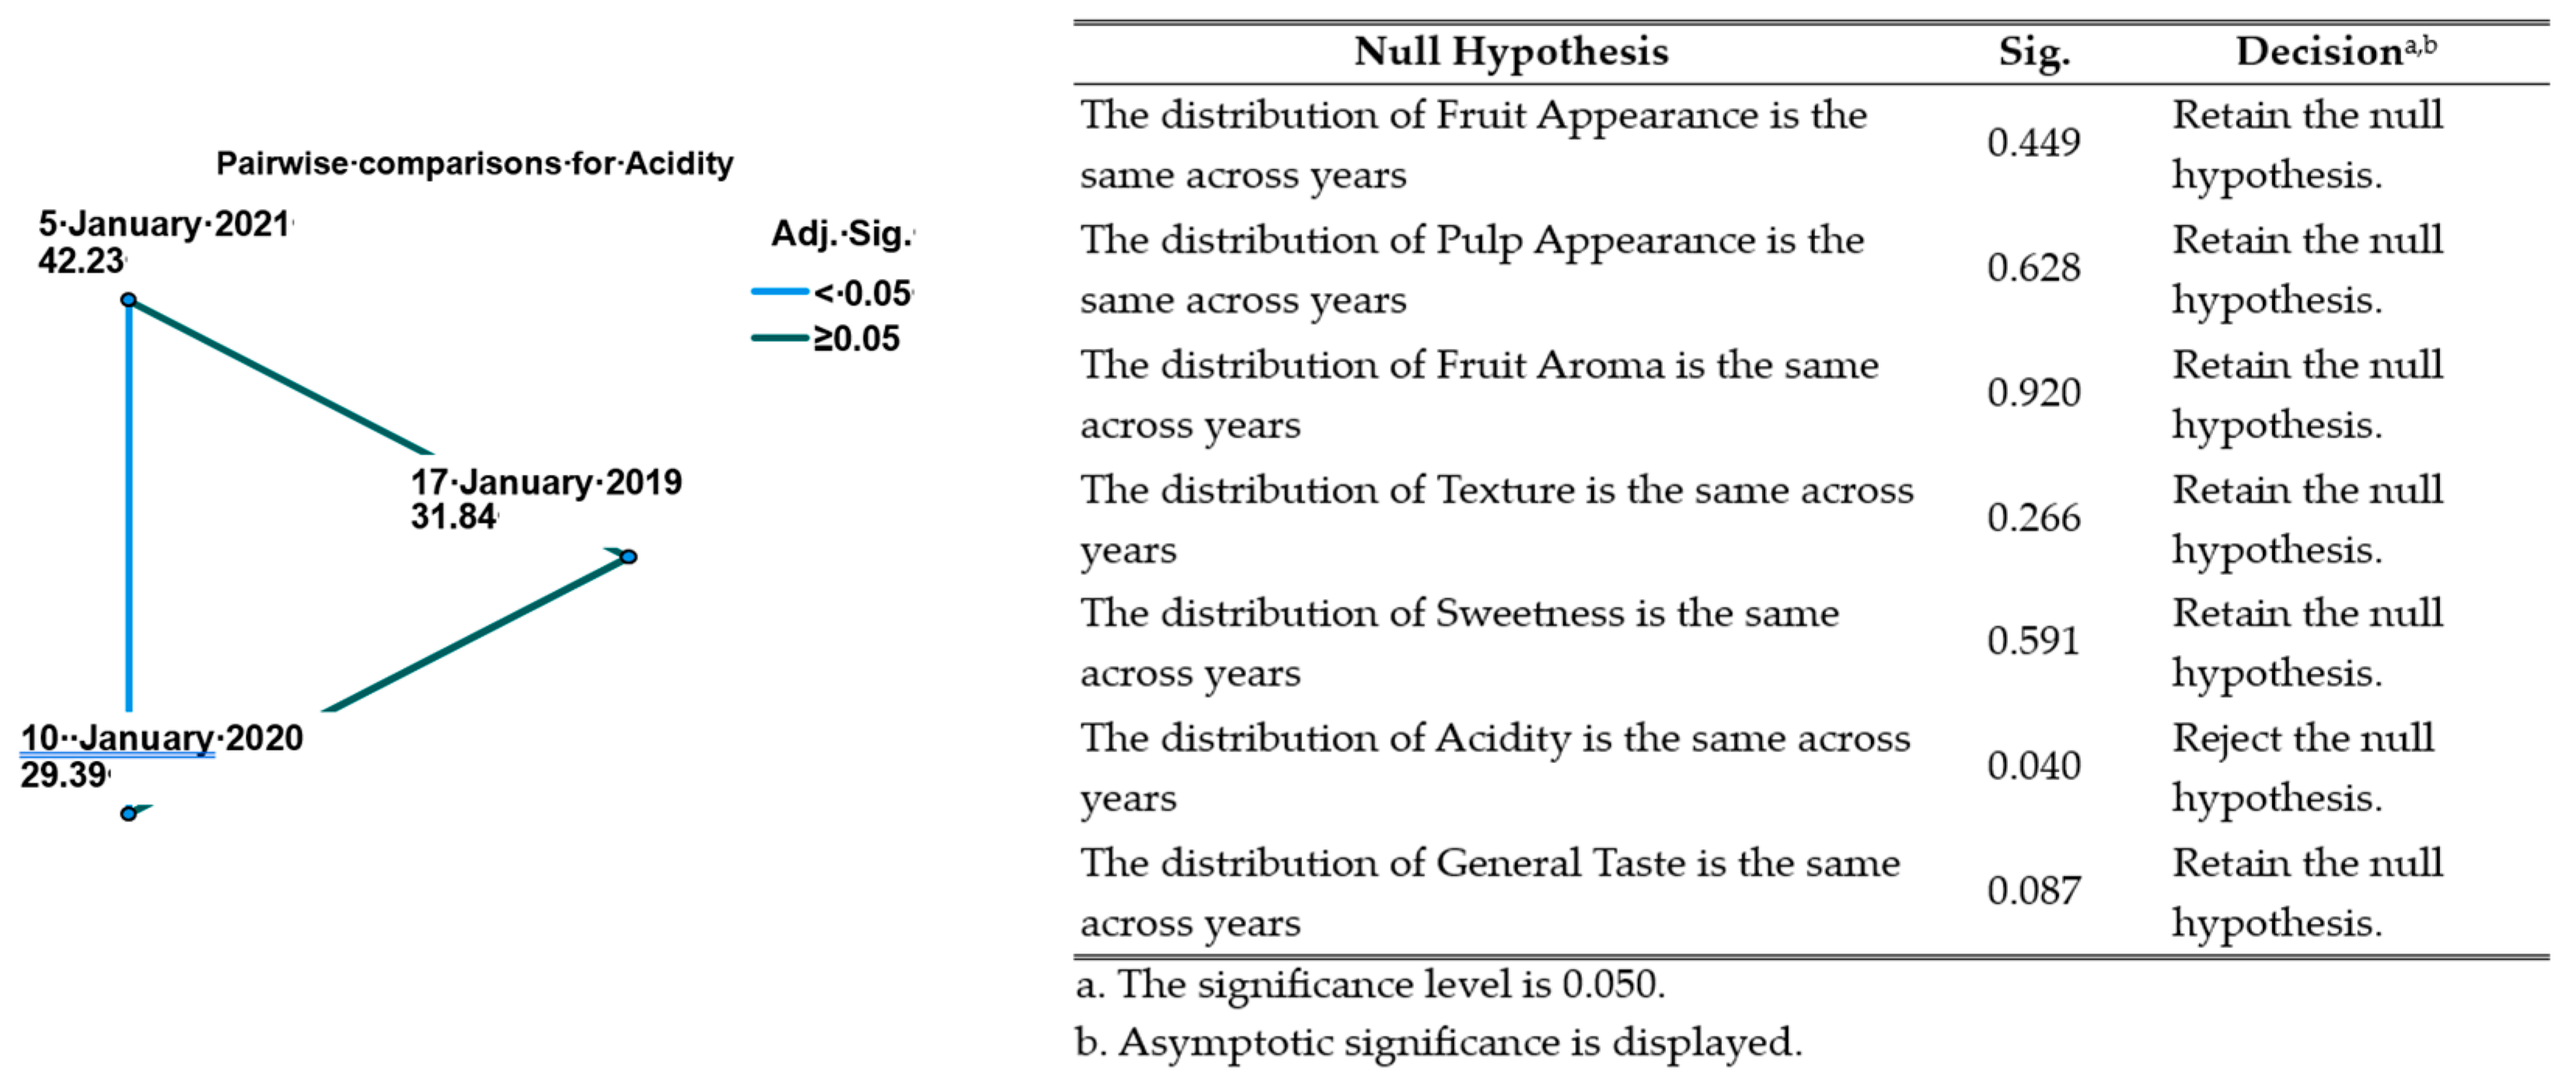
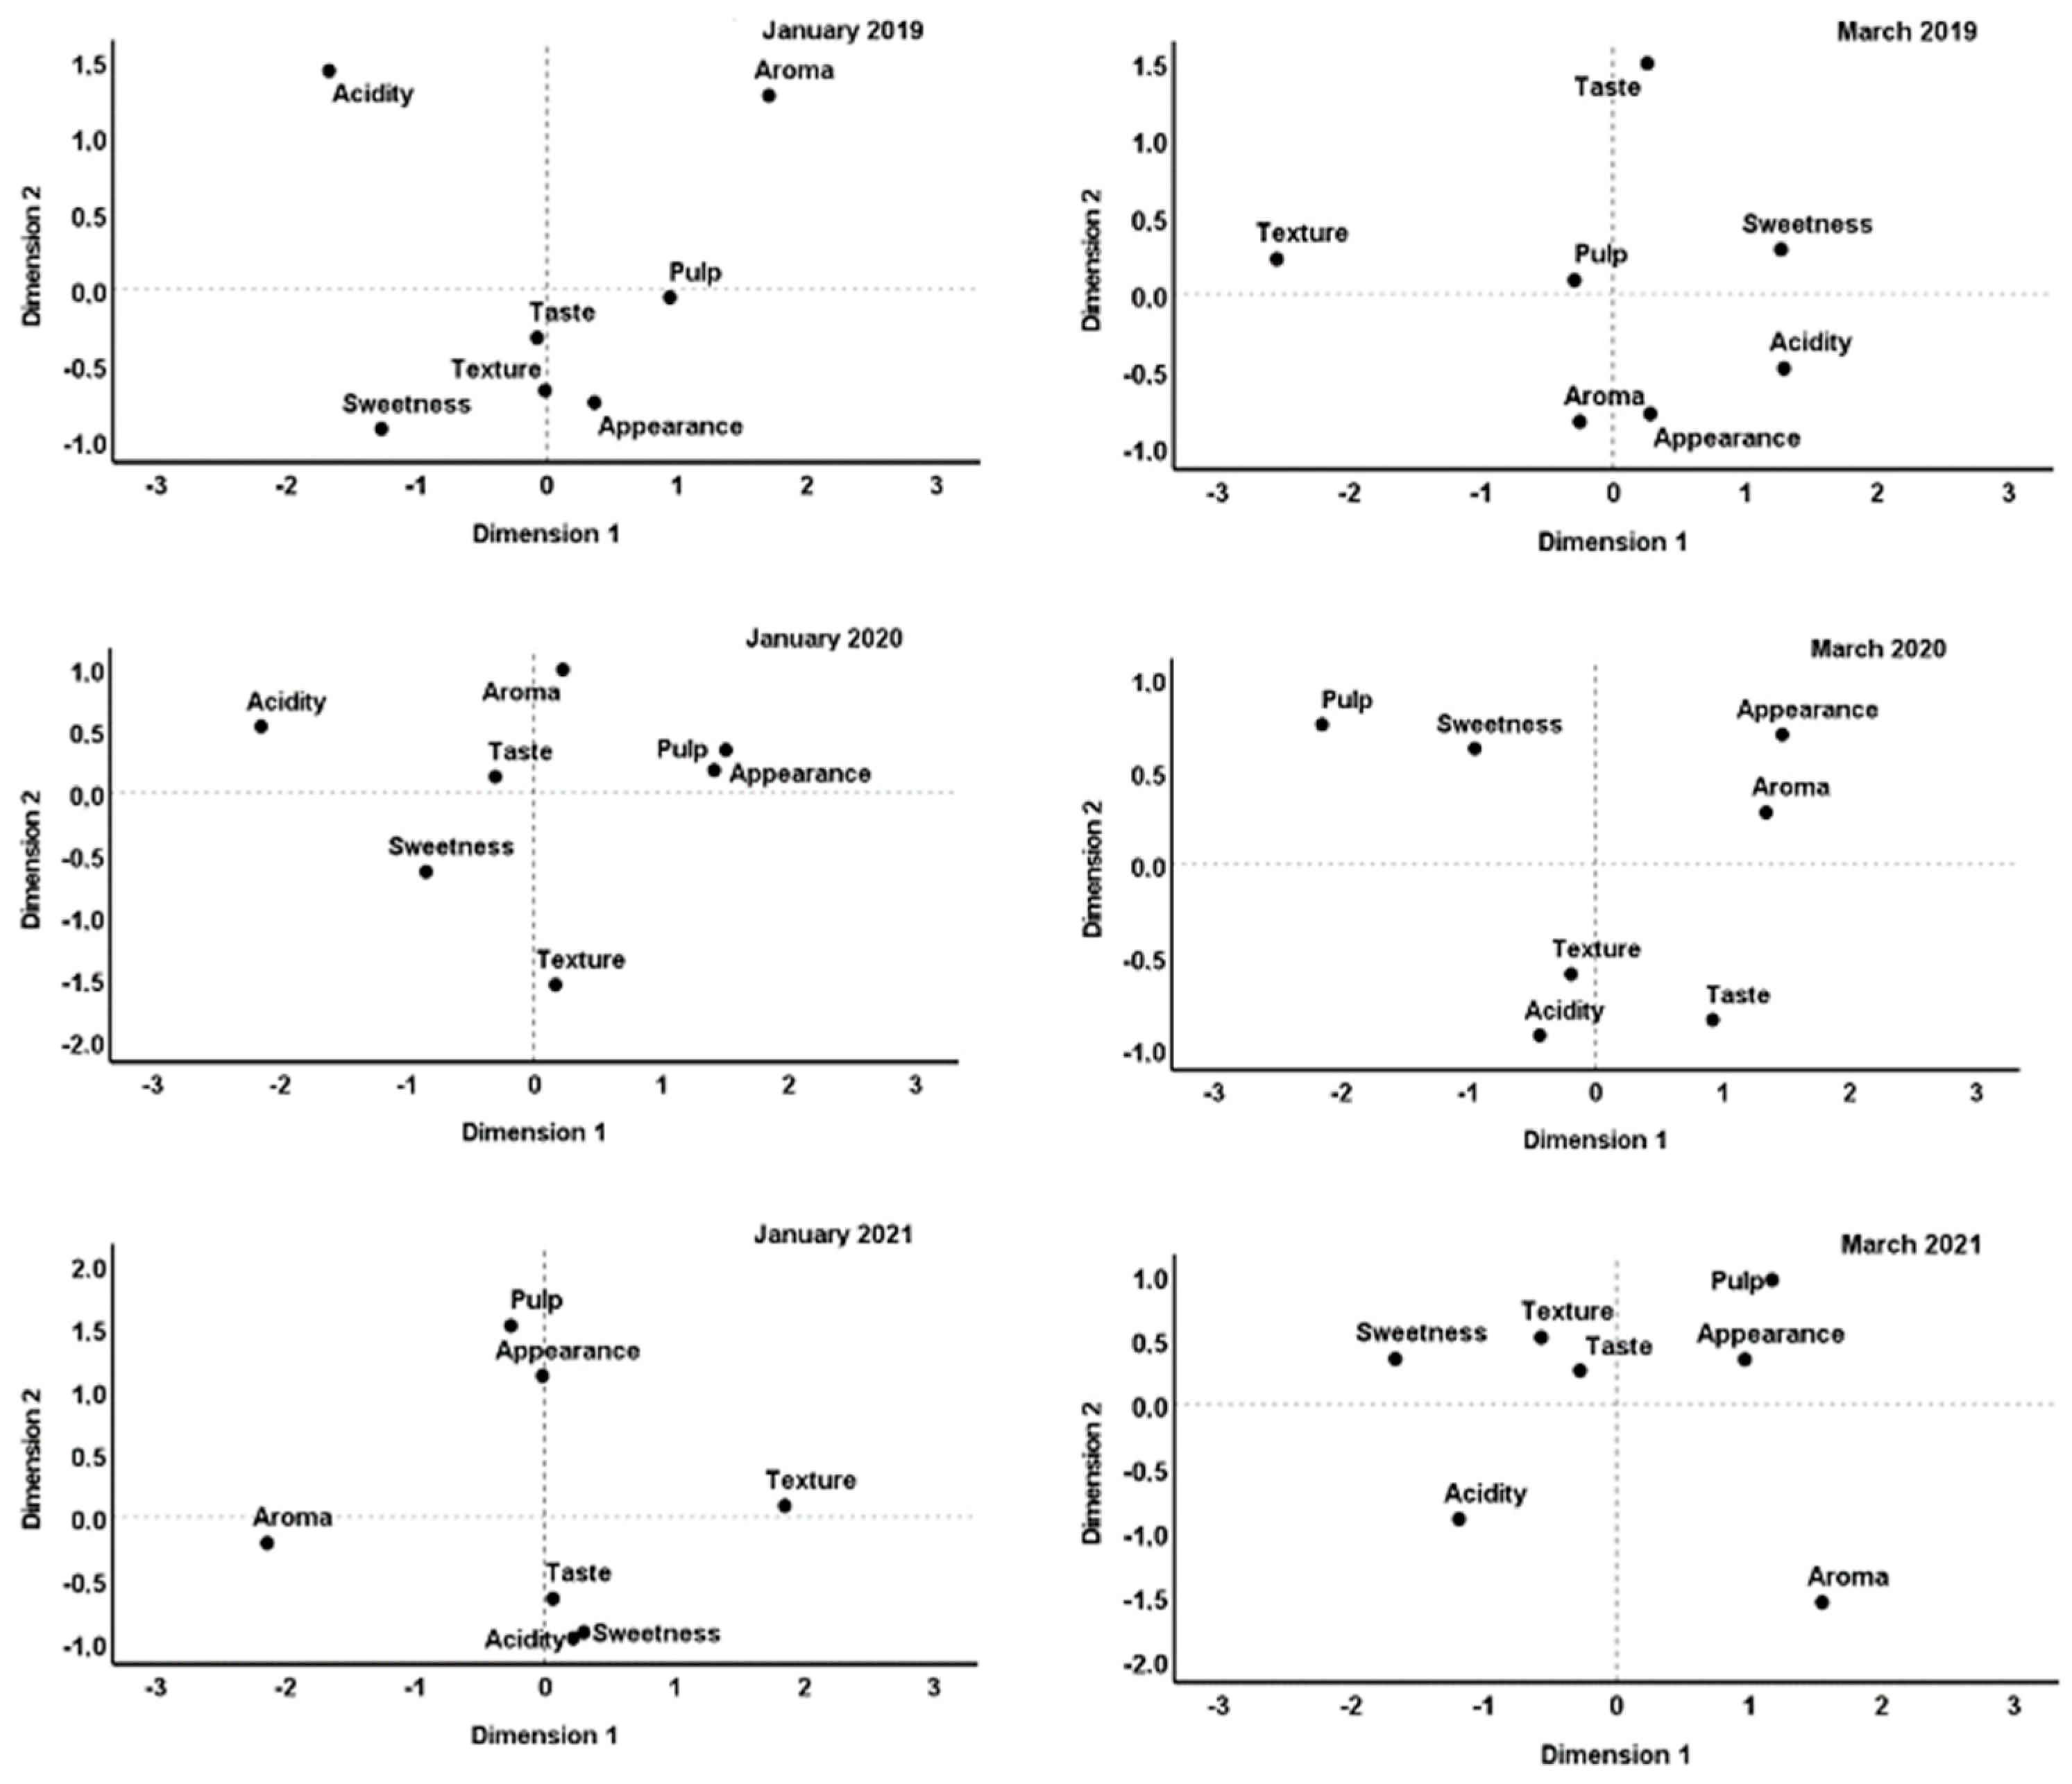
3.1.1. ‘Jintao’ Kiwifruit

The median for kiwifruit Actinidia chinensis ‘Jintao’ was around a six-point Likert scale for all sets and along the time, and the interquartile range, as a measure of dispersion, had low values as described in Table 1, between 0 and 3, for most cases. The maximum obtained was seven-point and the minimum value was 2.
In fact, for all the three years, independently of the month, all parameters evaluated were very consistent with a six-point evaluation through time and through years, meaning that ‘Jintao’ kiwifruit were very appreciated by the panellists regardless of being kept in storage for 2.5 or 4.5 months at 0 °C; however, for Actinidia chinensis, the storage period, at low temperature, is, usually, four months or less [36].
Pairwise comparisons for the same months in different years were performed revealing differences only for acidity between January 2020 and January 2021 (Figure 1), texture between March 2019 and March 2021, fruit appearance between March 2021 and March 2019, as well March 2021 and March 2020 (Figure 2).
Further analysis was performed applying MDS by year and by month (Figure 3). The results show that pulp appearance and fruit appearance are always linked, as well as general taste and sweetness, except in March 2020, meaning that, overall, the fruit appearance reflects on pulp appearance and sweetness has an impact on taste.
The degree of ability to explain the results of MDS were analysed through STRESS-I values (Table 2). Since STRESS-I values were below 25%, the error rate is also still below the fair value. The value of 90 and upper percent in the RSQ value (R-Squared is a statistical measure of how close the data are to the fitted regression line), show that the results of MDS analysis on consumers’ taste can be well explained (Table 2).

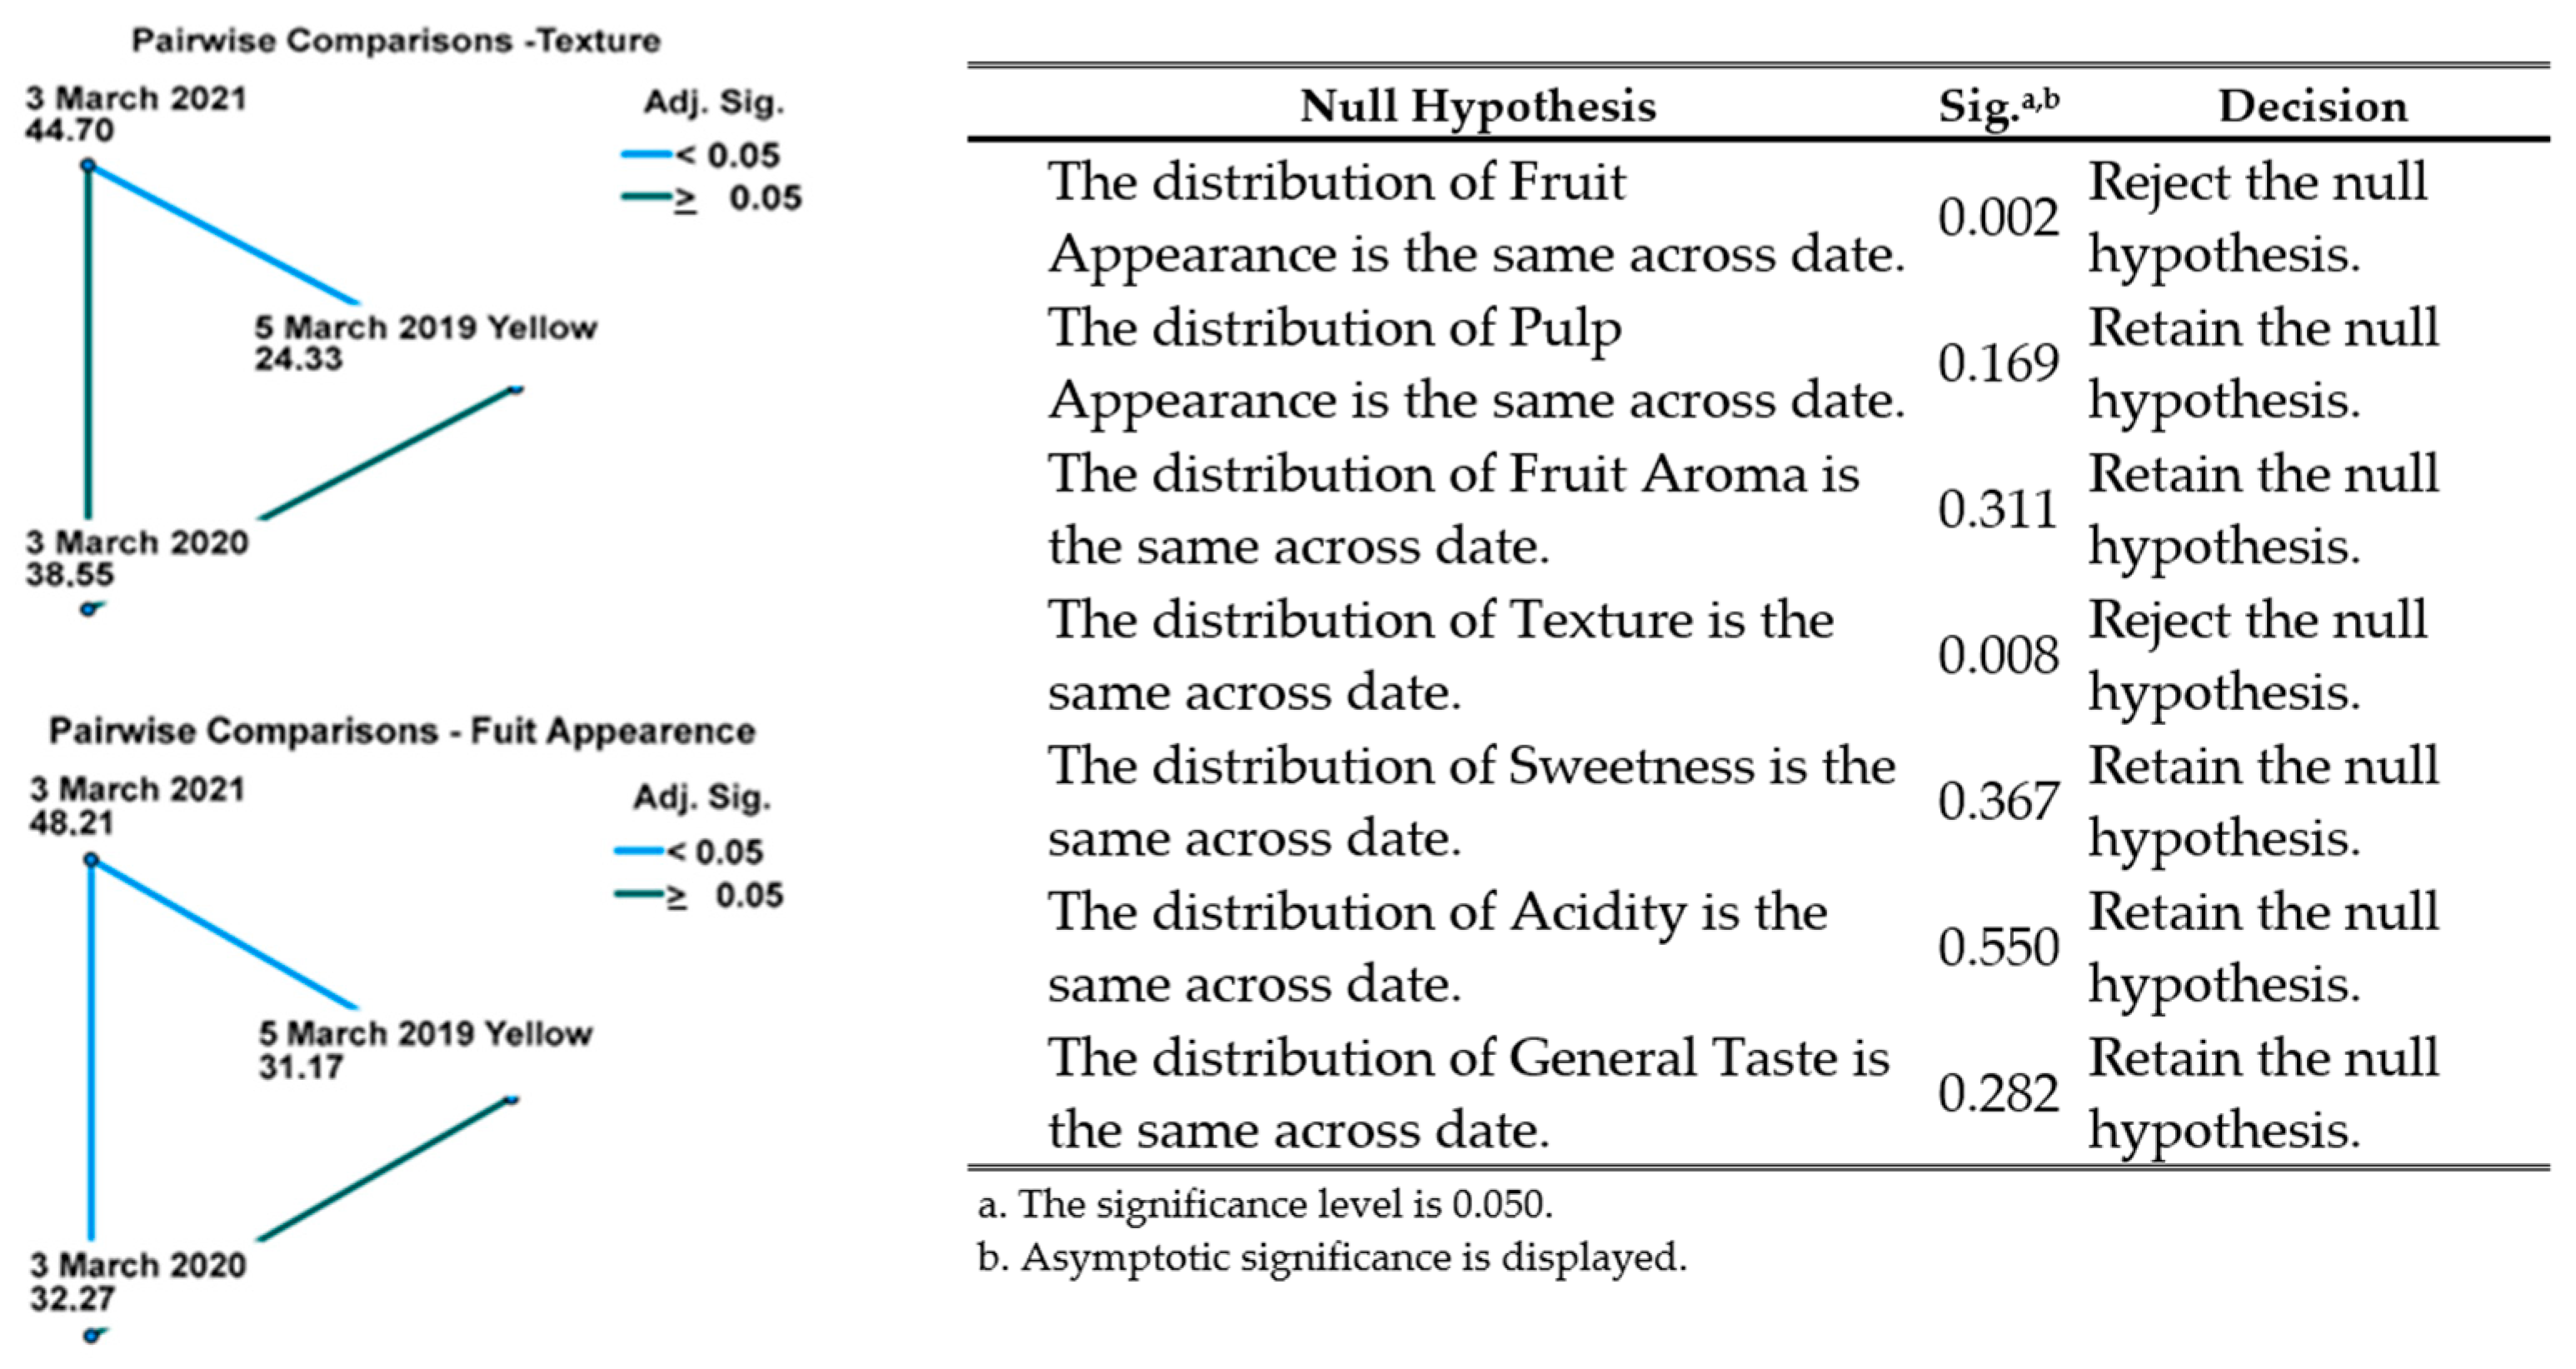
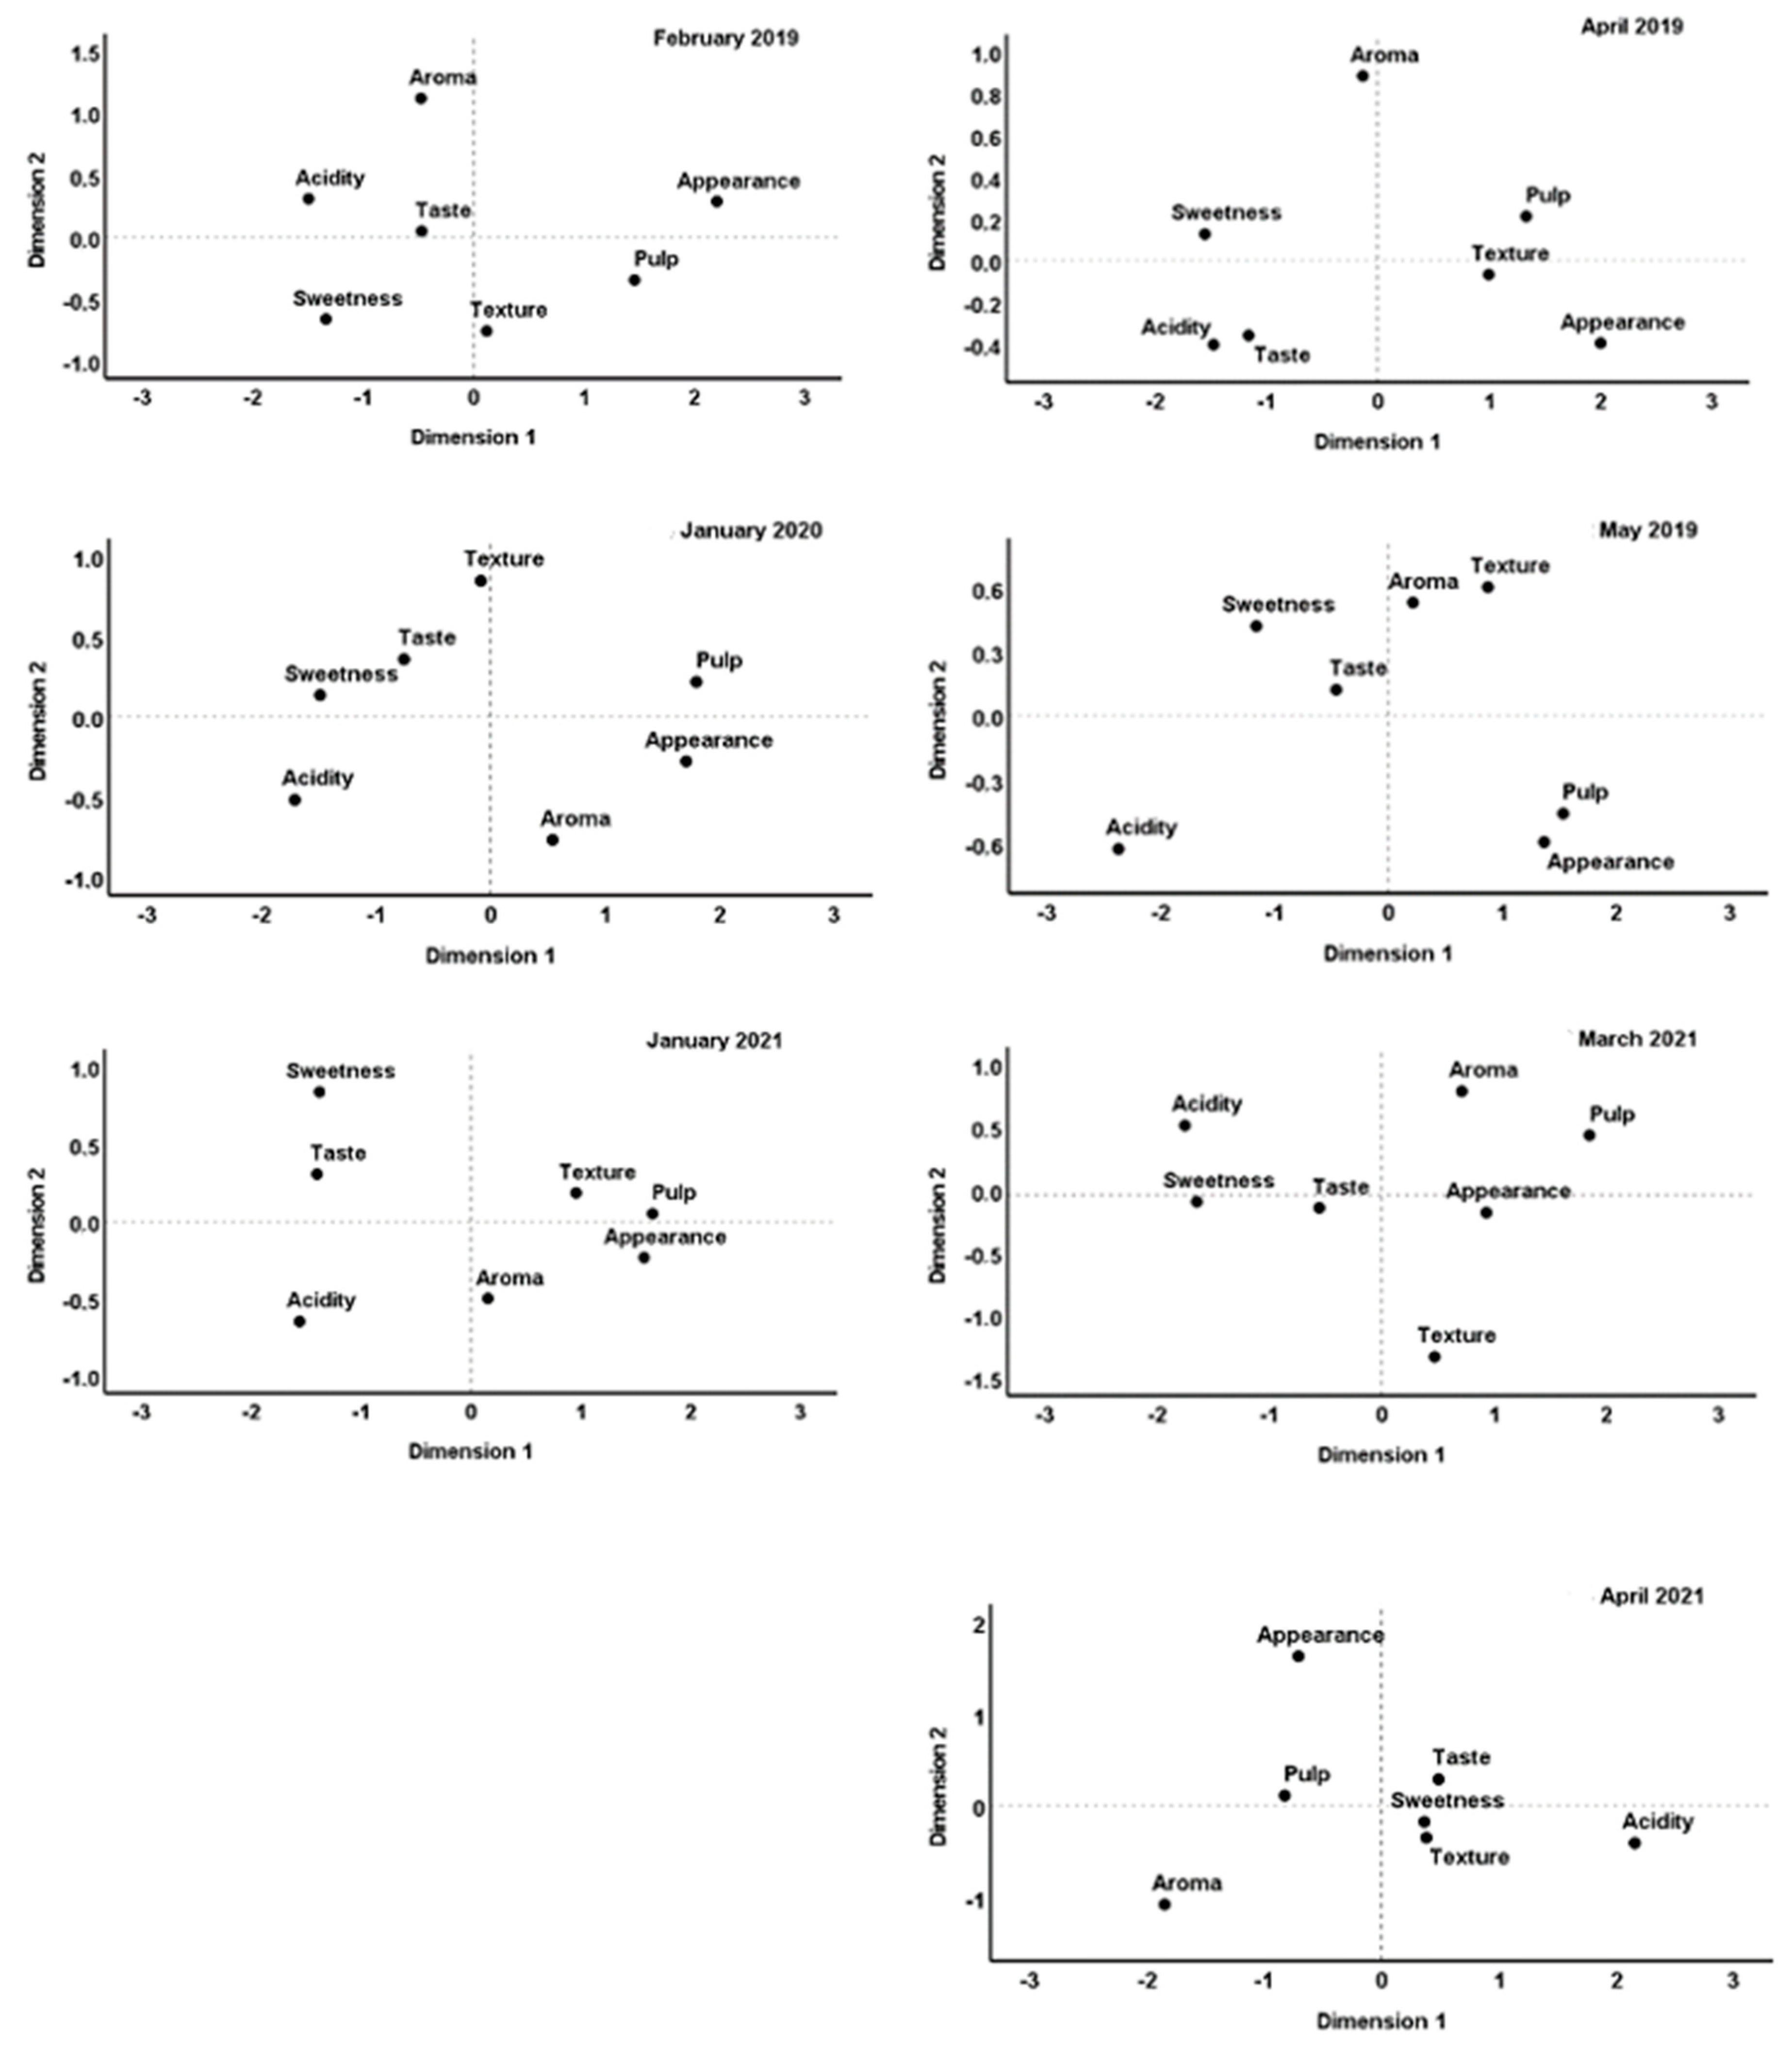
3.1.2. ‘Hayward’ Kiwifruit
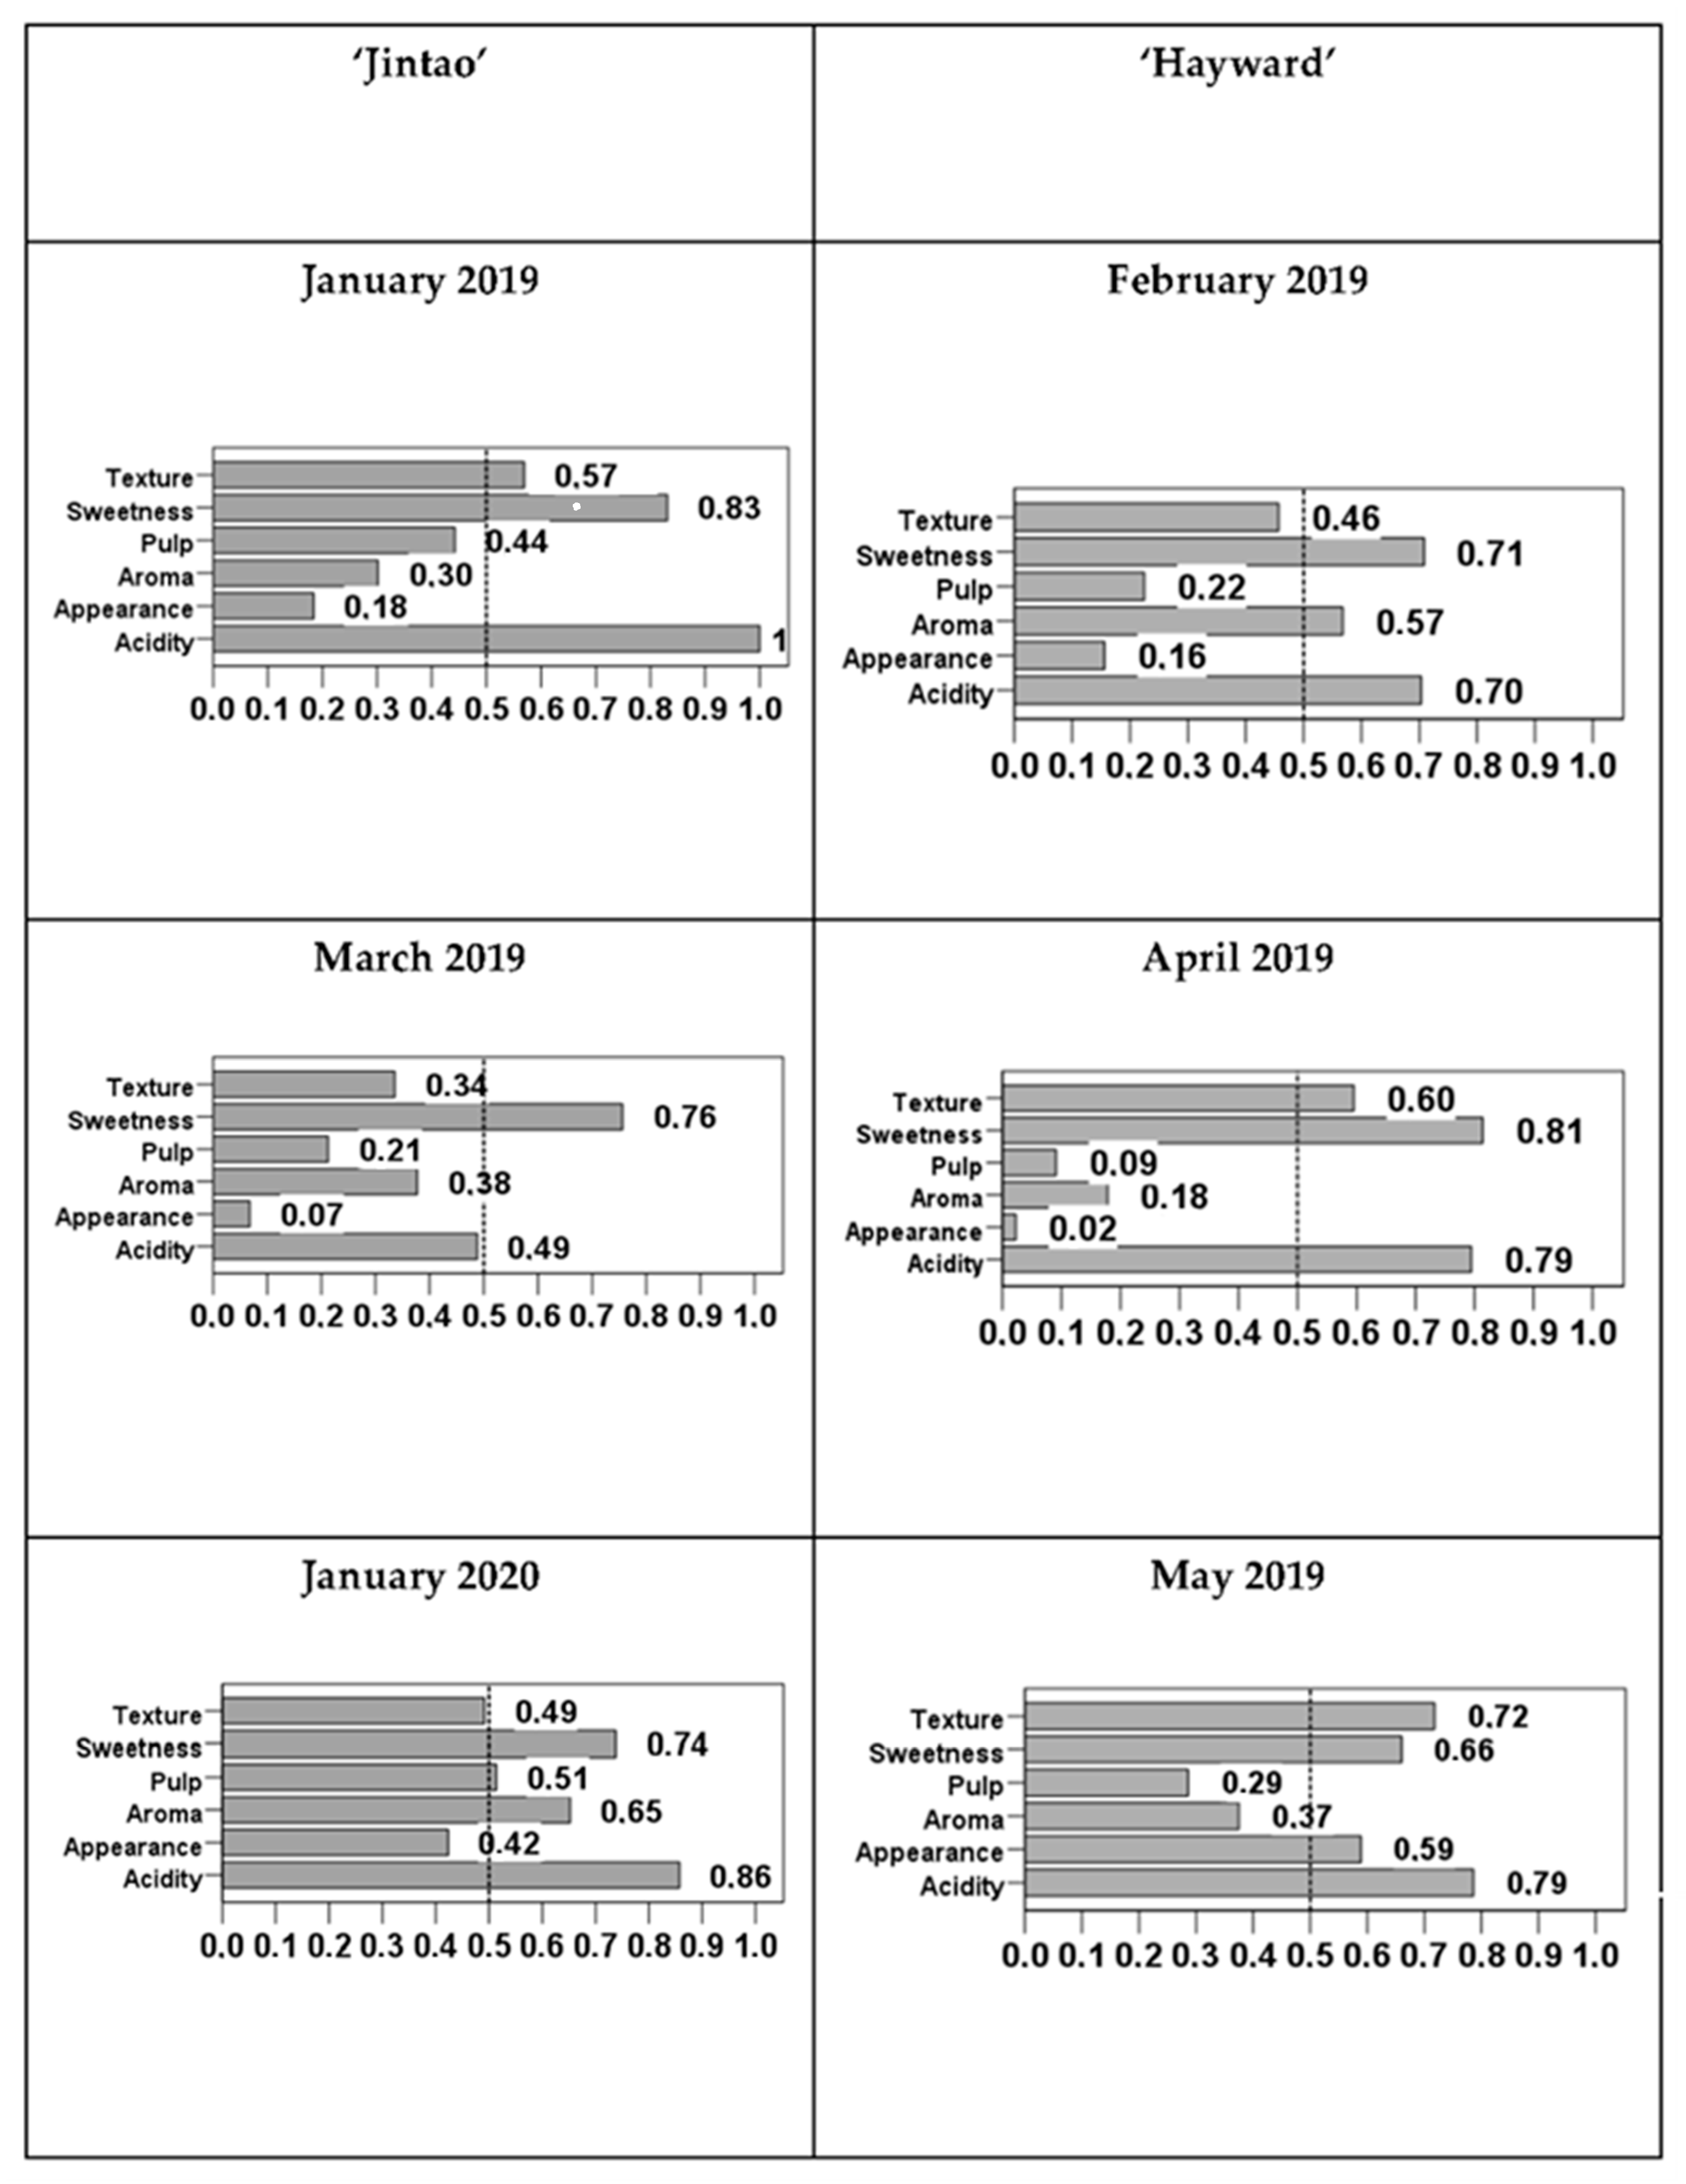
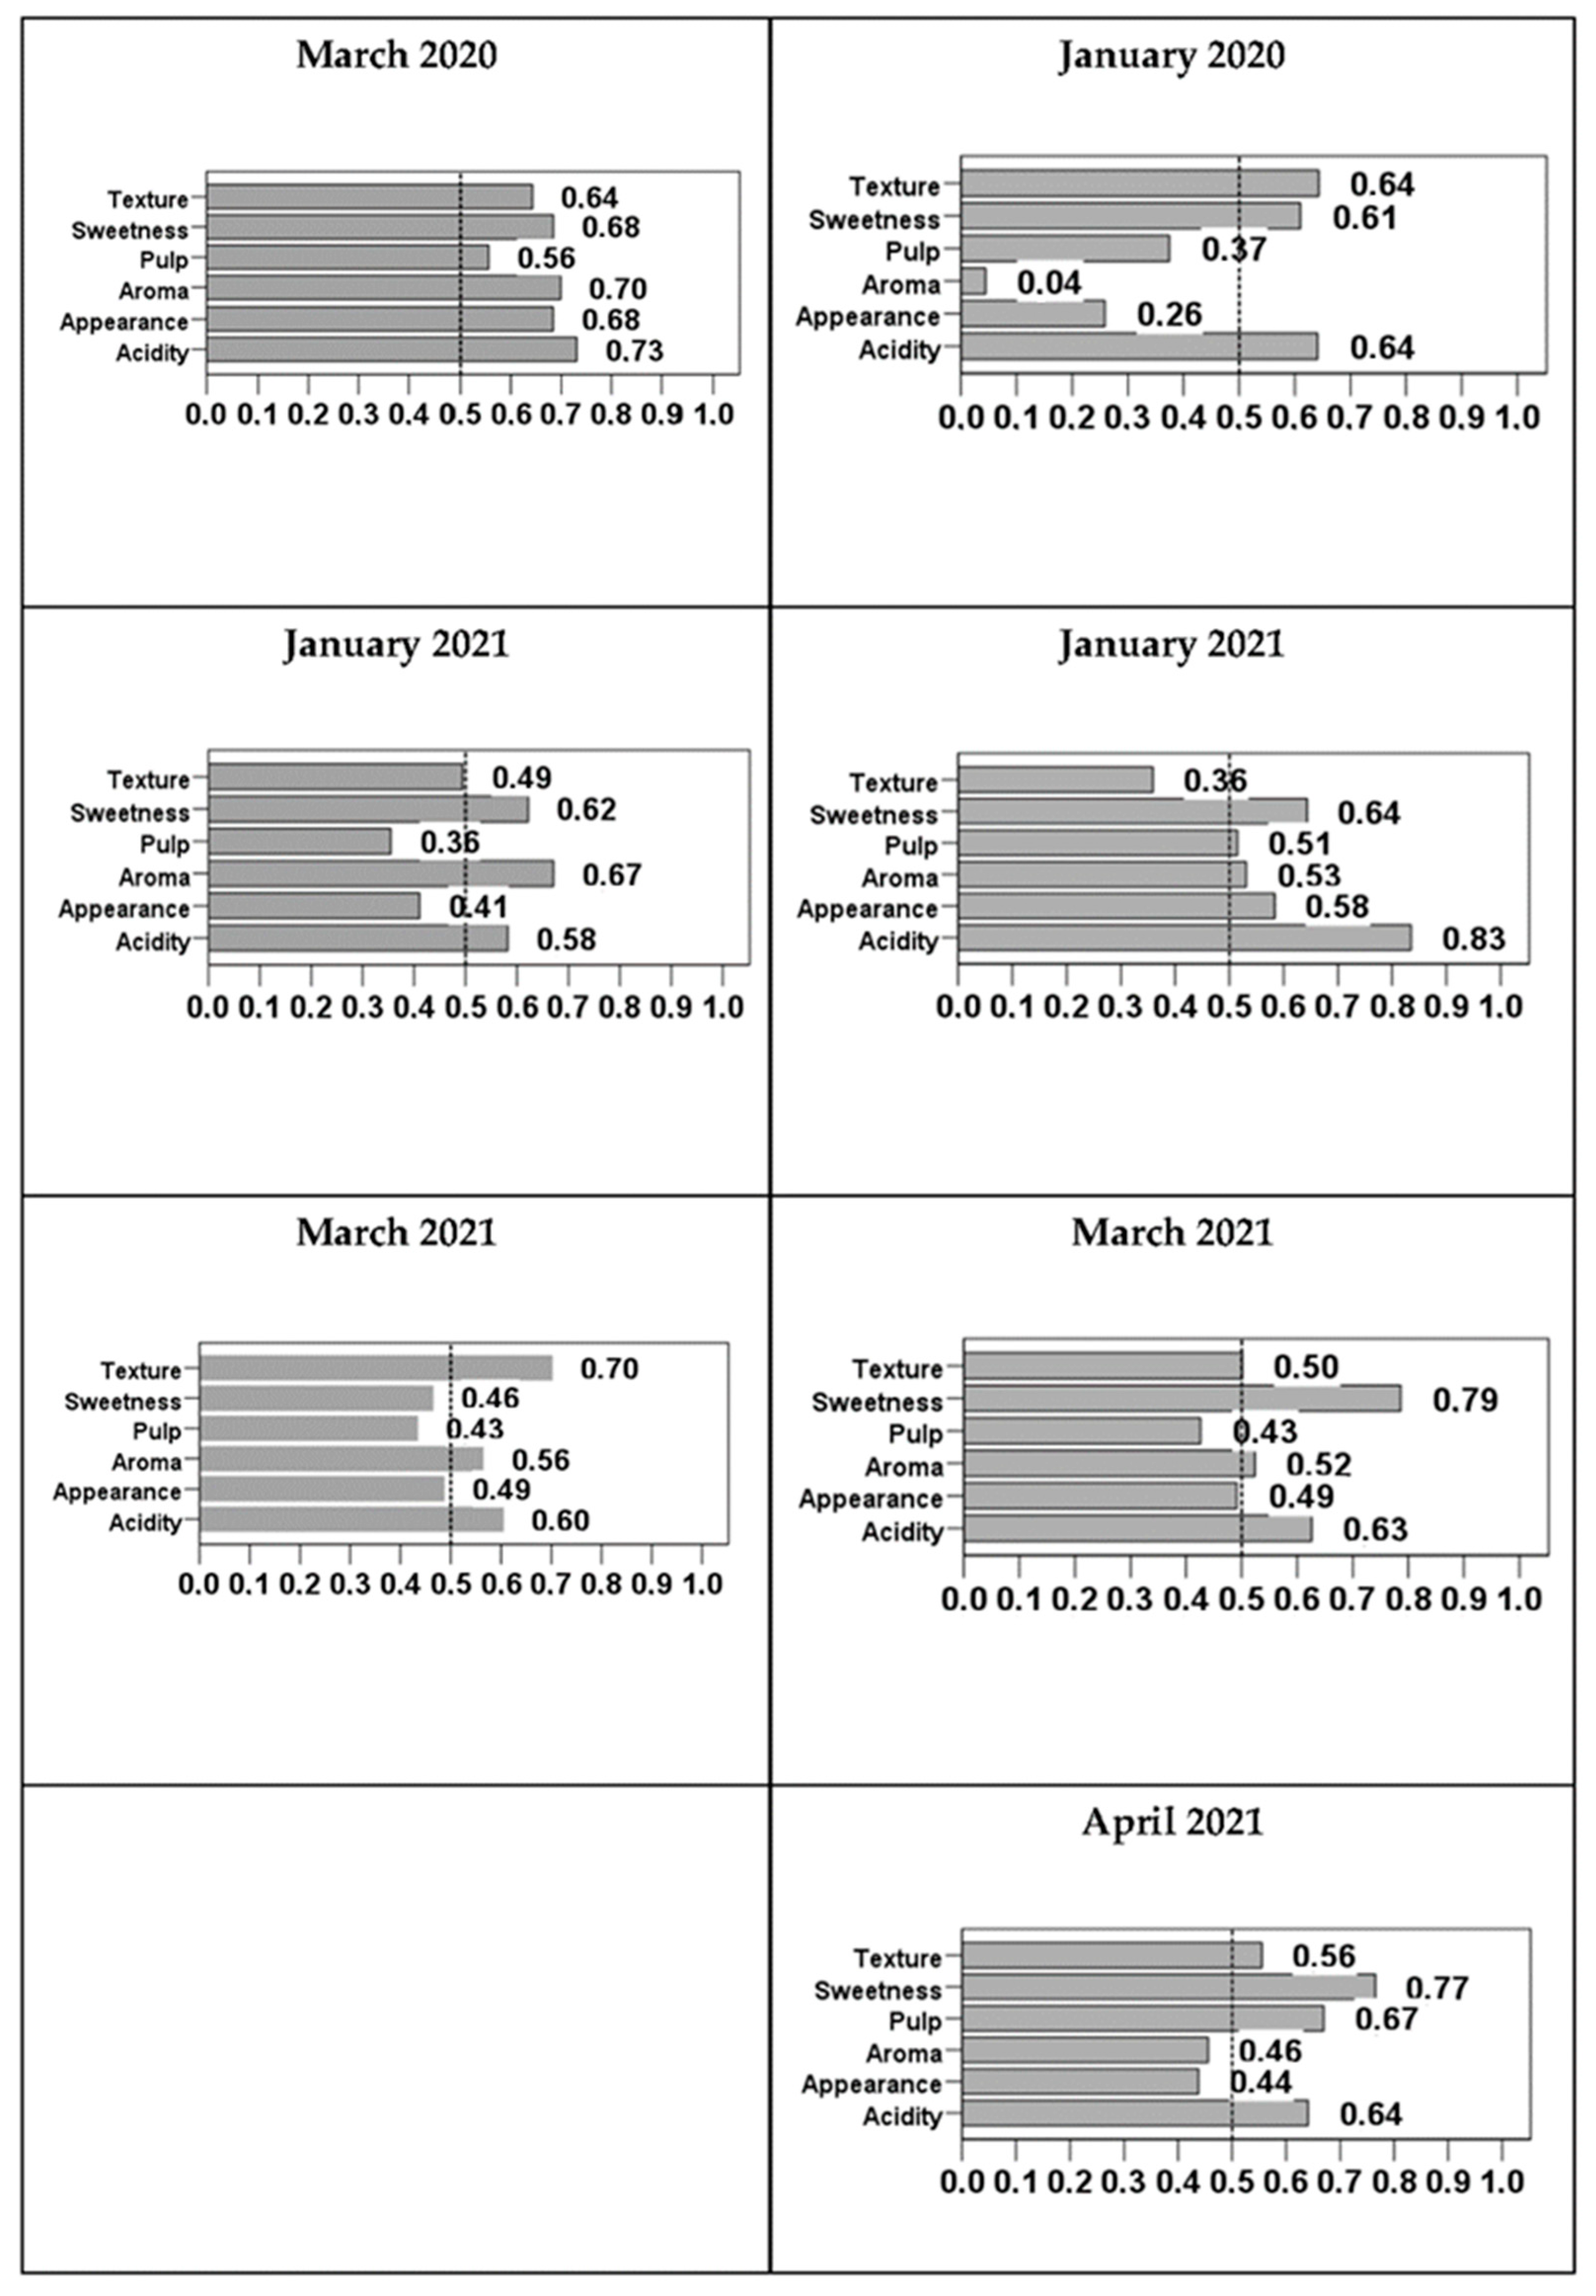
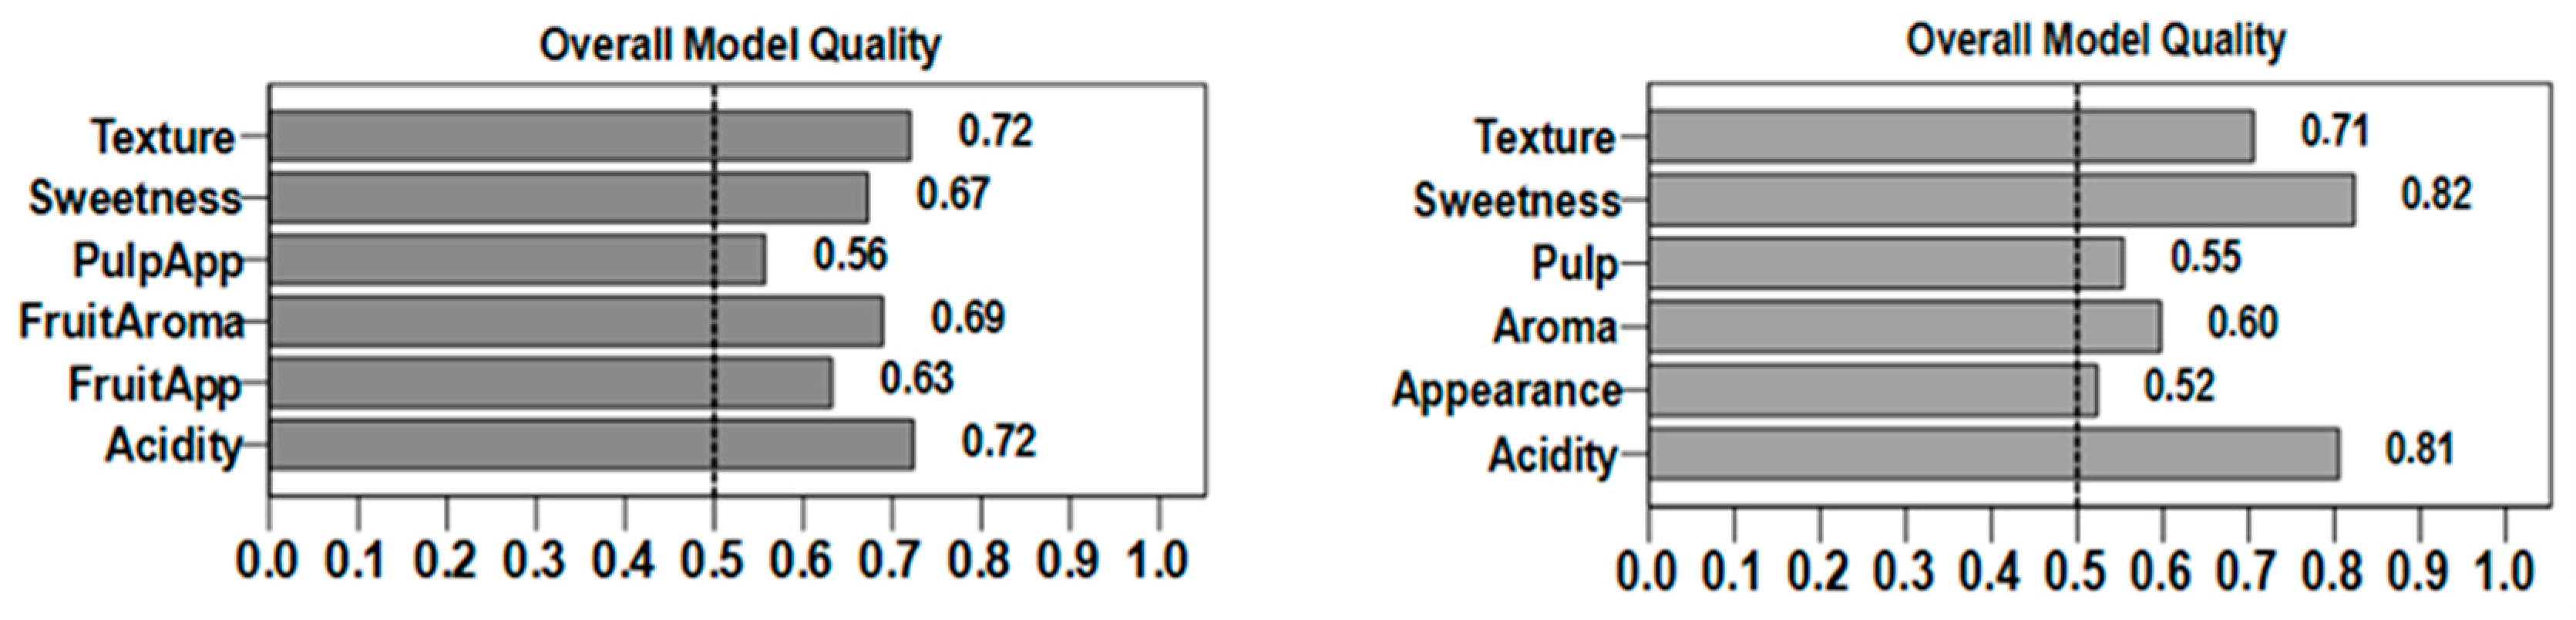
For ‘Hayward’ kiwifruit the median was around six-point Likert scale for all sets and along the time, and the interquartile range, as a measure of dispersion, had low values between 0 and 3 (Table 3), although a little more irregular than ‘Jintao’ possibly due a higher number of sensory evaluations and a longer storage time. The maximum obtained was seven-point and the minimum value was one-point.
Considering the homologous months of sampling, statistical differences were found, with the application of the Mann–Whitney nonparametric test for two independent samples, between April 2019 and April 2021 for sweetness and overall taste (p < 0.05) (Table 4). Although the sensory evaluations mentioned were performed at the same month, in the last one the kiwifruit were in storage 20 days more than in 2019, what possibly was enough to cause the statistically difference. As climacteric fruit, kiwifruit ripen through storage reaching the eating-ripe stage faster or latter according to their main ripening parameters at harvest time, which are SSC and Firmness [37]. The evolution of these parameters depends, not only of the harvest period, but also of pre and postharvest storage conditions [2,7]. In our case, there were both effects which explain the differences, mainly at the end of storage.
The MDS analysis shows that for ‘Hayward’, as ‘Jintao’, pulp appearance and fruit appearance, and also general taste and sweetness are always linked (Figure 4).

3.1.3. ROC Analysis

Performing a receiver operating characteristic (ROC) analysis along time by each sensory evaluation, showed that, for both cultivars, sweetness and acidity were the variables that respond with better scores for General taste (Figure 5), confirming that these two parameters are crucial factors for consumer acceptance [9,11]. However, for ‘Jintao’, aroma seems to be important for global taste in January and March 2020, and also appearance in March 2020 and texture in March 2021. For ‘Hayward’, texture had also impact in May 2019 and pulp appearance in April 2021, perhaps due to over-ripeness.
Instead of applying the ROC analysis for each month and year, ROC can be performed to obtain an overall model quality. This approach reveals that, for both cultivars, sweetness, acidity and texture were the variables that respond with better scores for General taste. Aroma has also importance for the General taste on ‘Jintao’ (Figure 6).
These results confirm, in first place, that, for each cultivar, sensory evaluation depends on different attributes. For example, for ‘Golden Delicious’ apples, values of firmness, SSC and TA are important, while for ‘Elstar’ apples consumer acceptance is more dependent on aroma and juiciness [38,39]; in second, that sweetness, acidity and aroma are critical to consumer acceptance of kiwifruit [9,11,14].

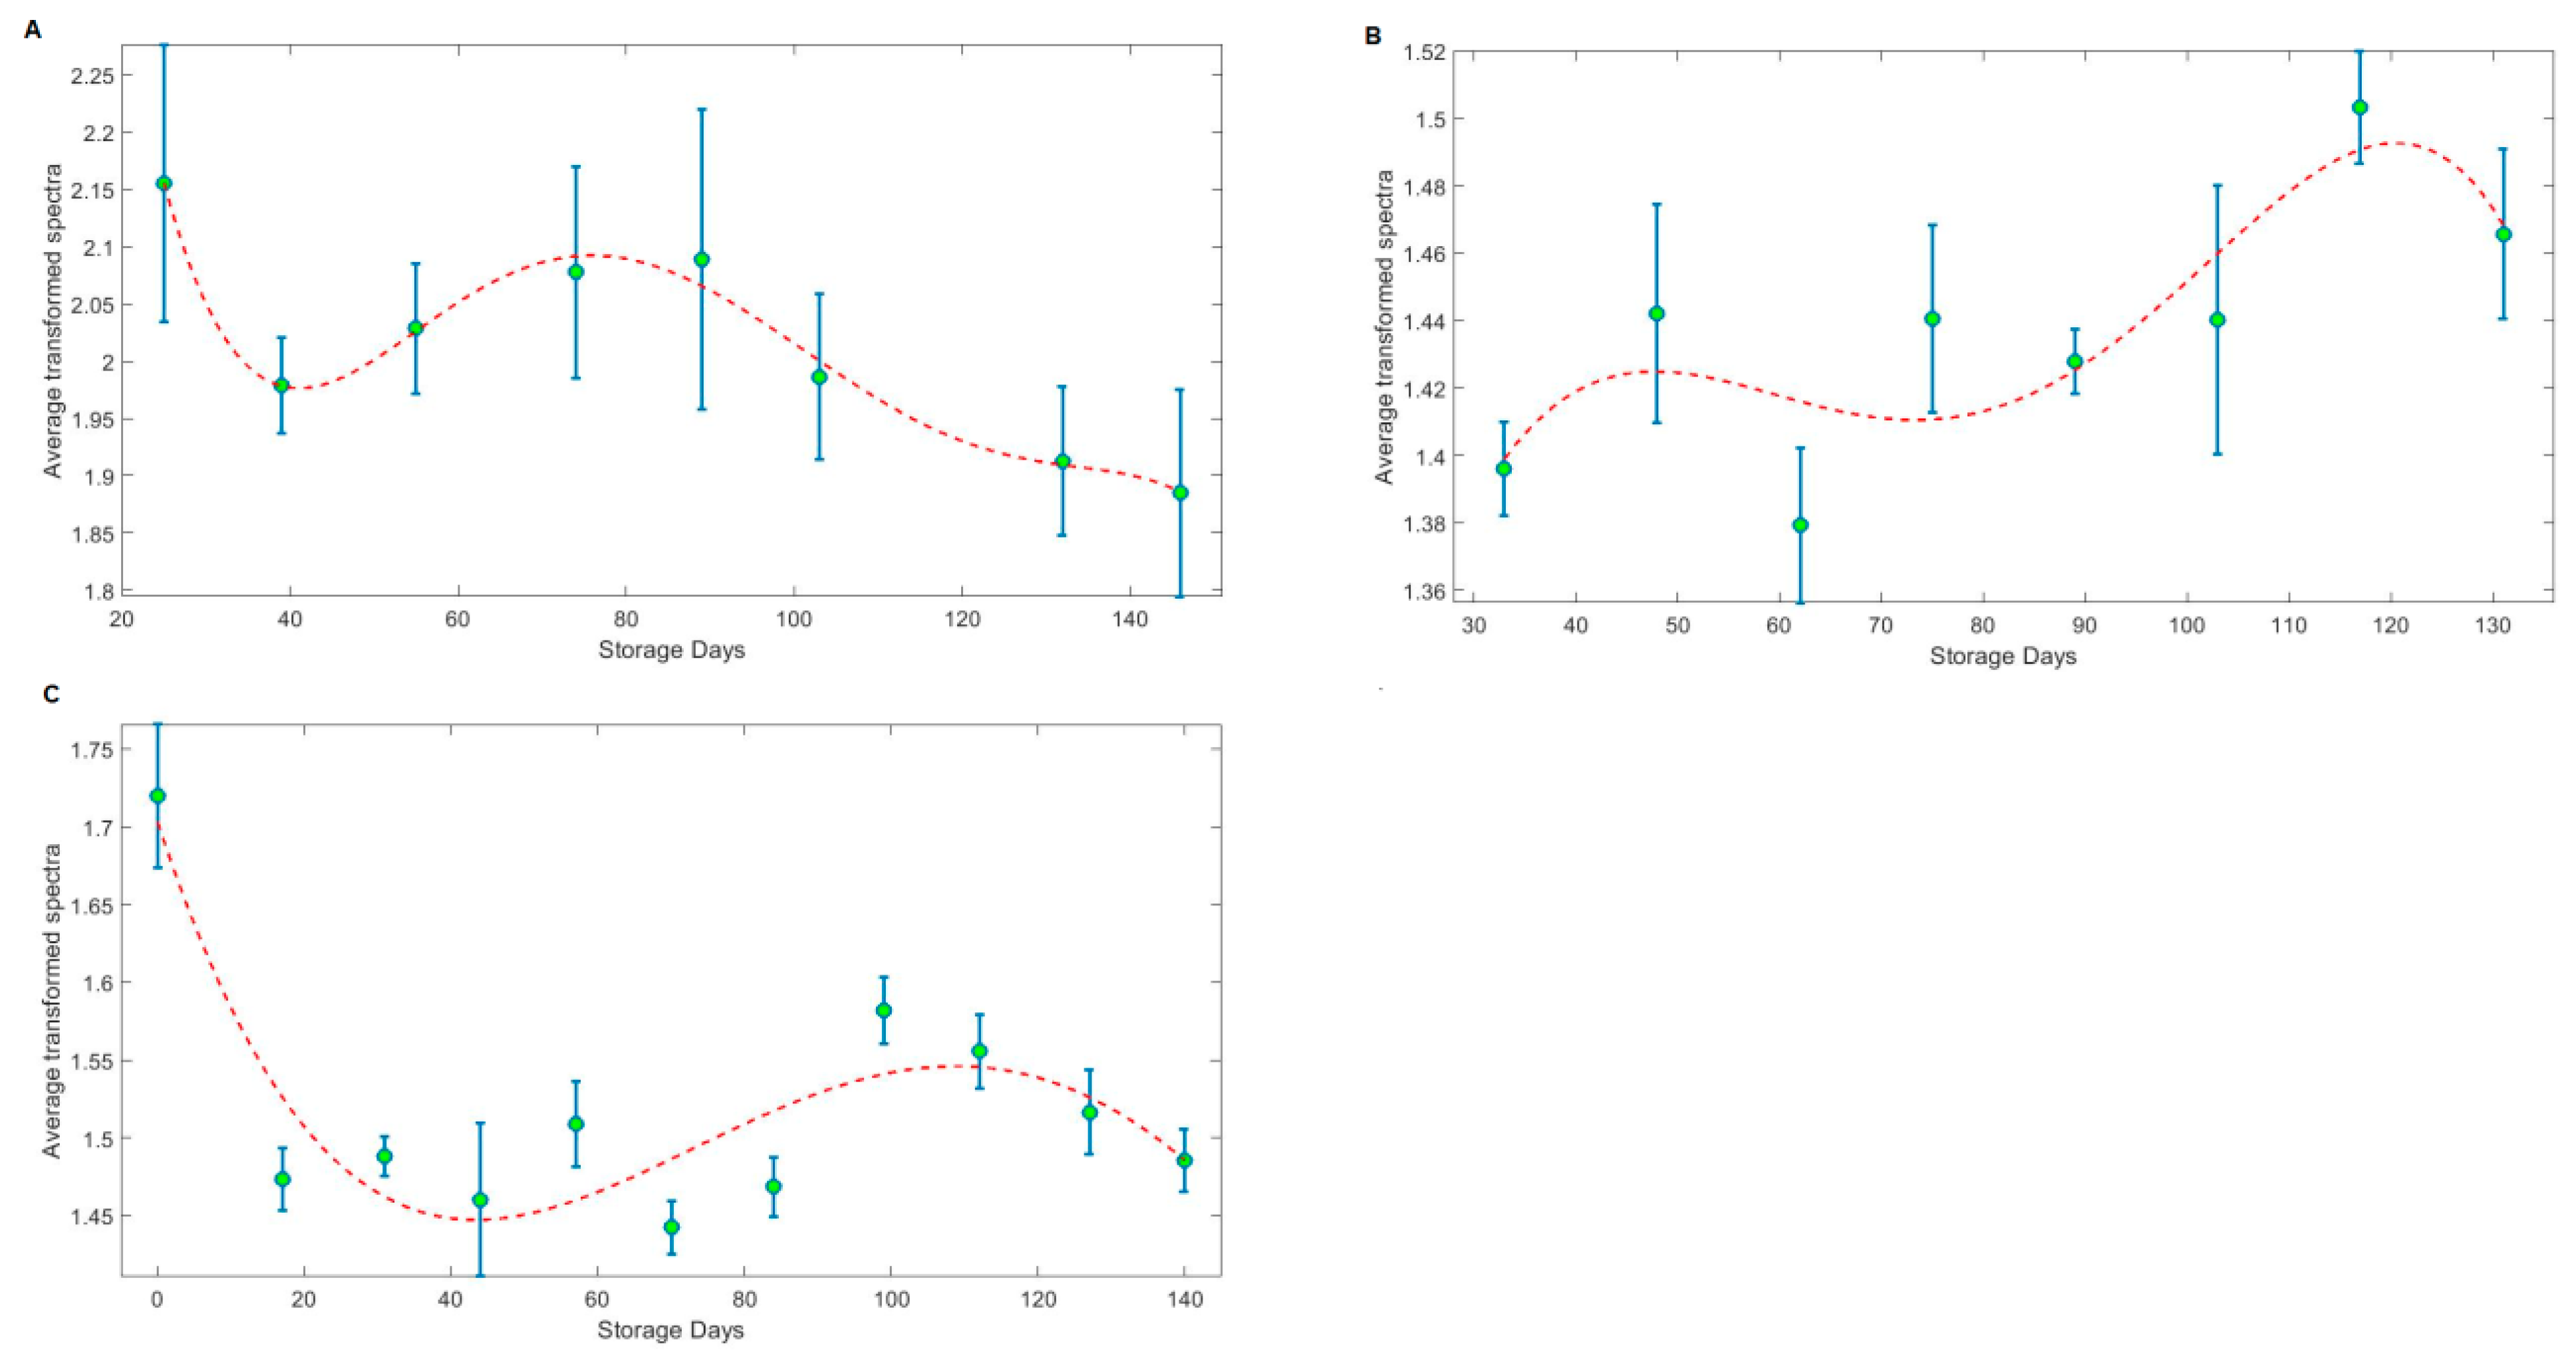
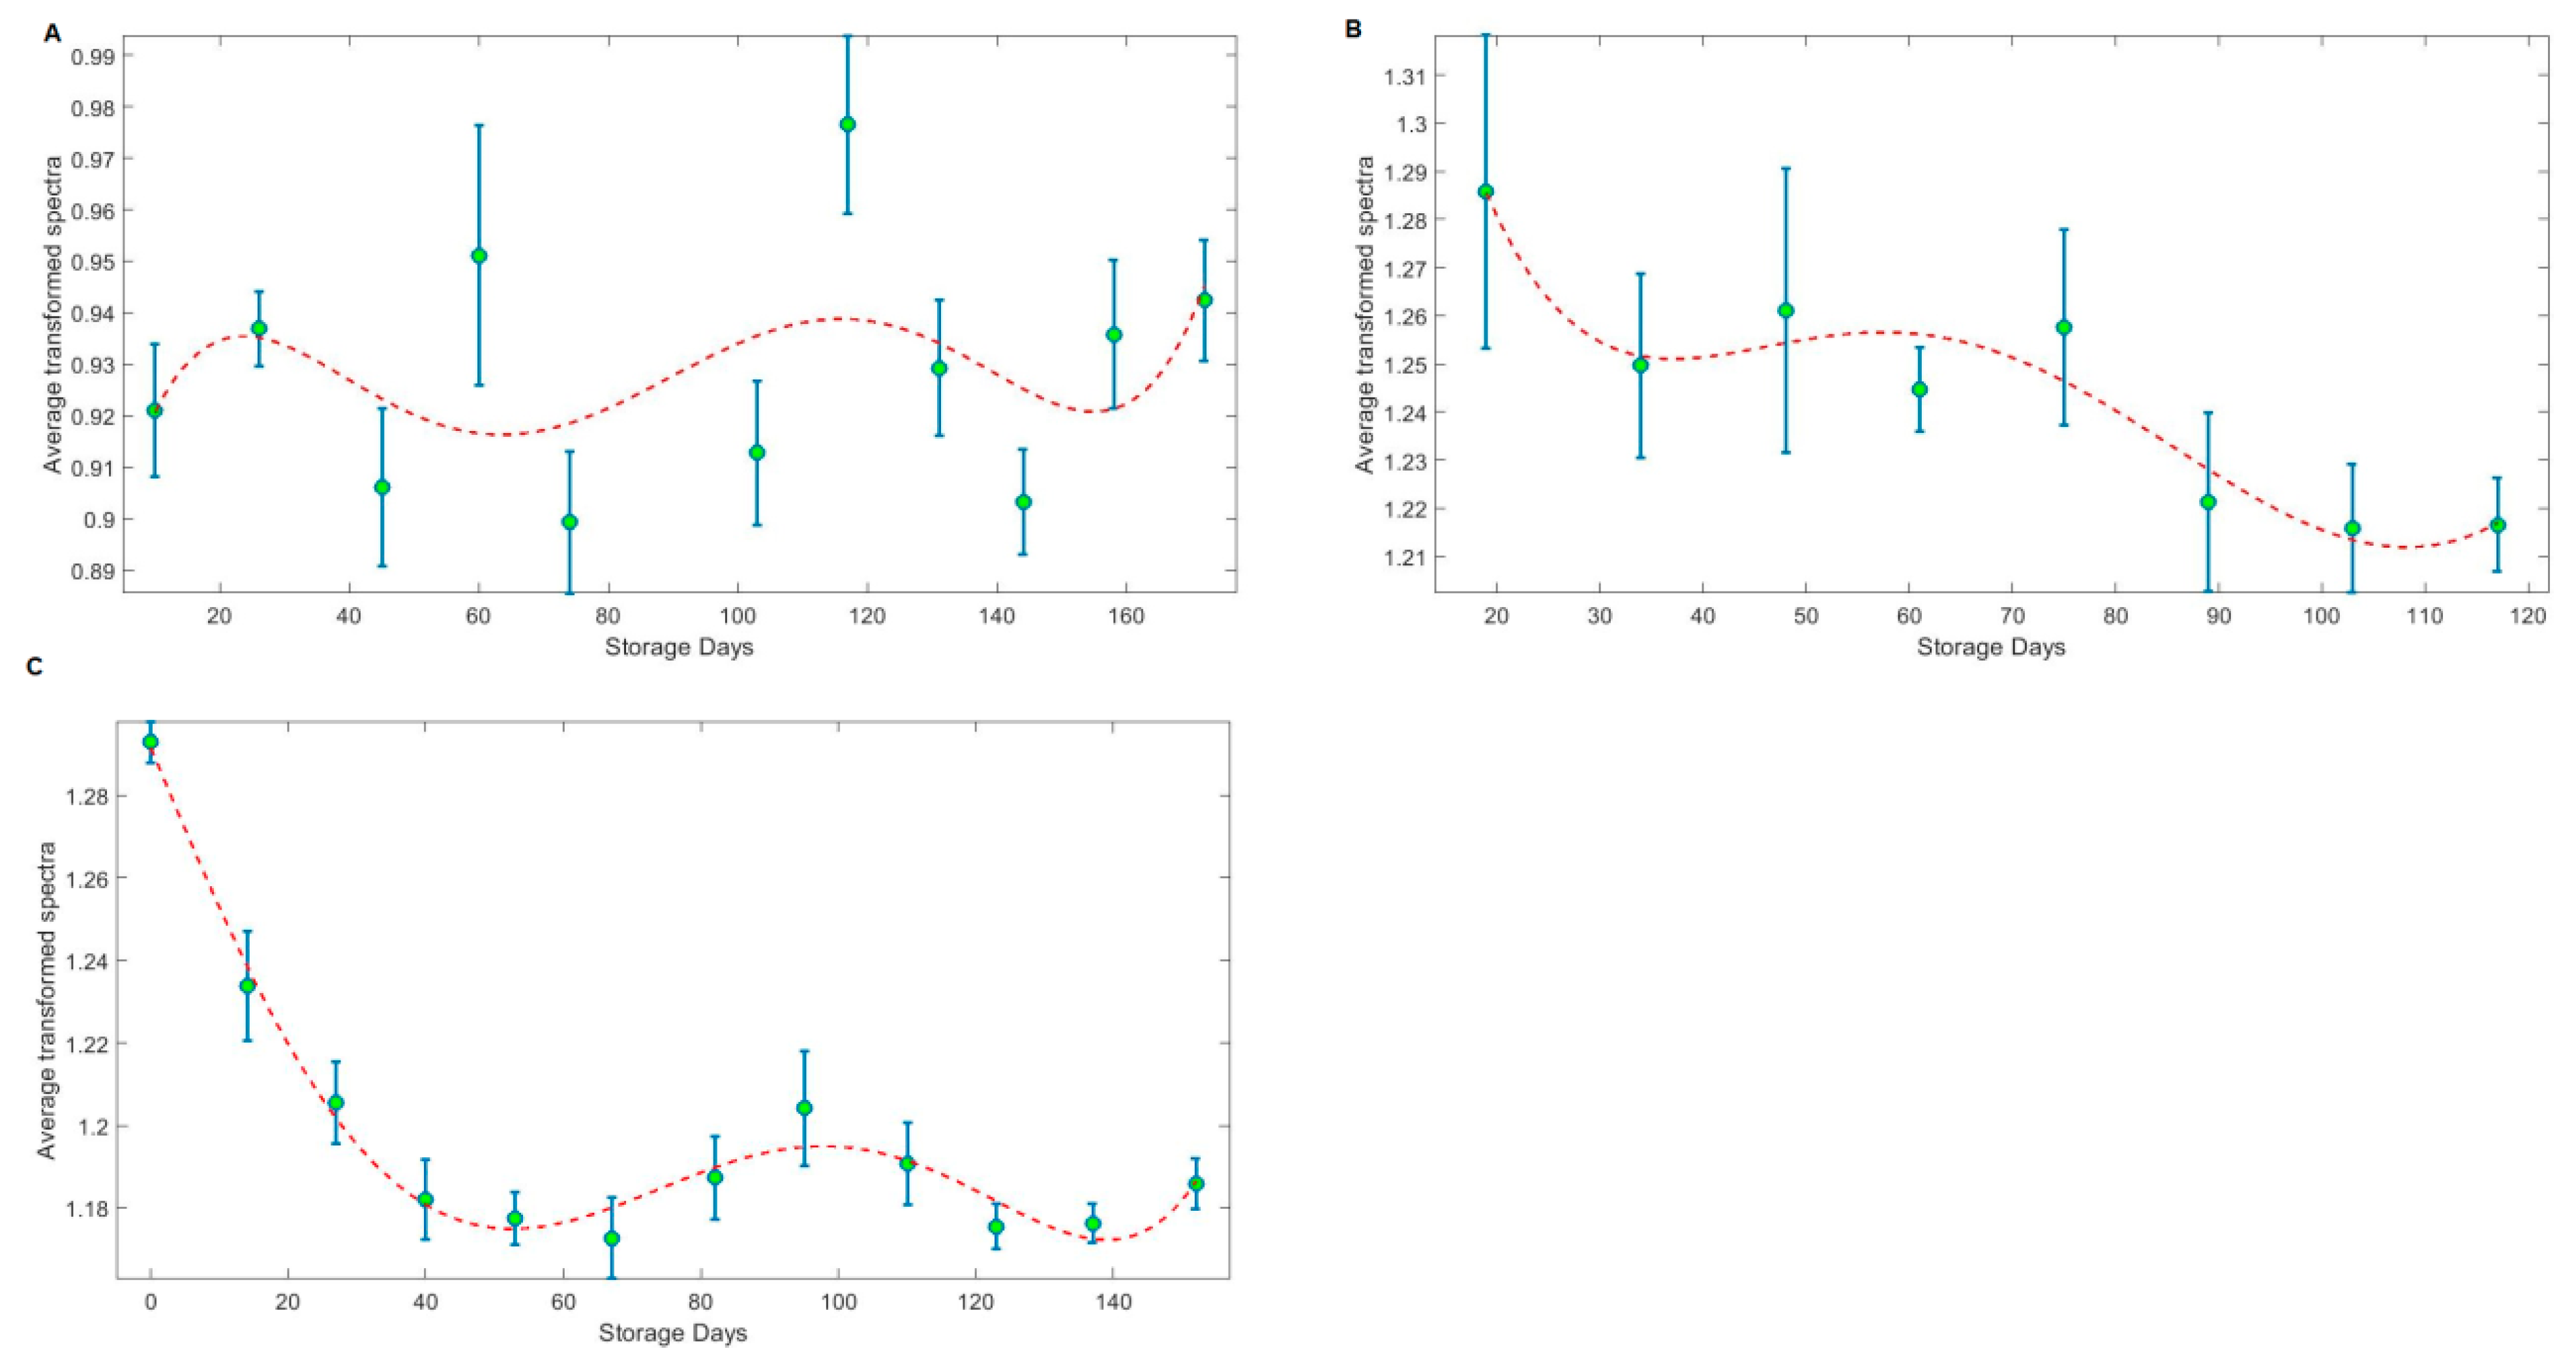
3.2. Average Spectra Temporal Evolution of Cold Stored Kiwifruit

In order to compensate for reflectance variations due to pulp texture variations, the absorption spectra were normalized to 800 nm (the NIR plateau), with the additional advantage that the ratio of reflectance at 680 nm to that of 800 nm provides a normalized proxy for chlorophyll content. The transformed spectra were then averaged over each measurement day, to provide possible spectral patterns. These are represented in Figure 7 for ‘Jintao’ and in Figure 8 for ‘Hayward’ kiwifruit. There was not a consistent evolution pattern of the spectra in the three years.
Since A680/A800 is a proxy for chlorophyll content, it can be seen in four of the six graphs in Figure 7 and Figure 8 that it decreases, as expected. However, in two other cases it remains approximately constant or even tends to rise. Even in the expected cases, that show the global decrease, there are modulations in time, which have to do simultaneously with the variation in chlorophyll and fruit firmness.
Being that firmness is an internal quality attribute (IQA) that consistently decreases with storage time, it could be expected that with the loss of kiwifruit firmness, the reflectance would be lower since soft fruit has less scattering (meaning also an equivalent absorption higher). However, the turbid biological material complicates the absorption and scattering processes and the complexity and the heterogeneities of the fruit’s tissue [16,40] affects the relationship between the reflectance spectra and the mechanical properties [18,41]. Furthermore, it was reported in apples that cell wall degradation reduces the scattering events [42], but air-filled pores caused by cells water loss leads to an increase in them [43], which also complicates this relation [38]. Moreover, since kiwifruit of each cultivar were from two different orchards and not from the same batch, an extra complexity might have been added.
Despite all these difficulties, the spectra collected show differences along the storage time, meaning that Vis-NIR spectroscopy is able to identify chemical and physical changes that occur during kiwifruit ripening in cold storage.

3.3. Spectra Reflectance Correlation with Internal Quality Attributes

Sweetness and texture have a major impact in consumer acceptance, for both cultivars, according the sensory evaluation results. Those two parameters are correlated to SSC (°Brix) and firmness, respectively [18]. For this reason, we investigated if there is a good correlation between kiwifruit SSC and firmness and their reflectance spectra acquired during storage, and at which wavelength.

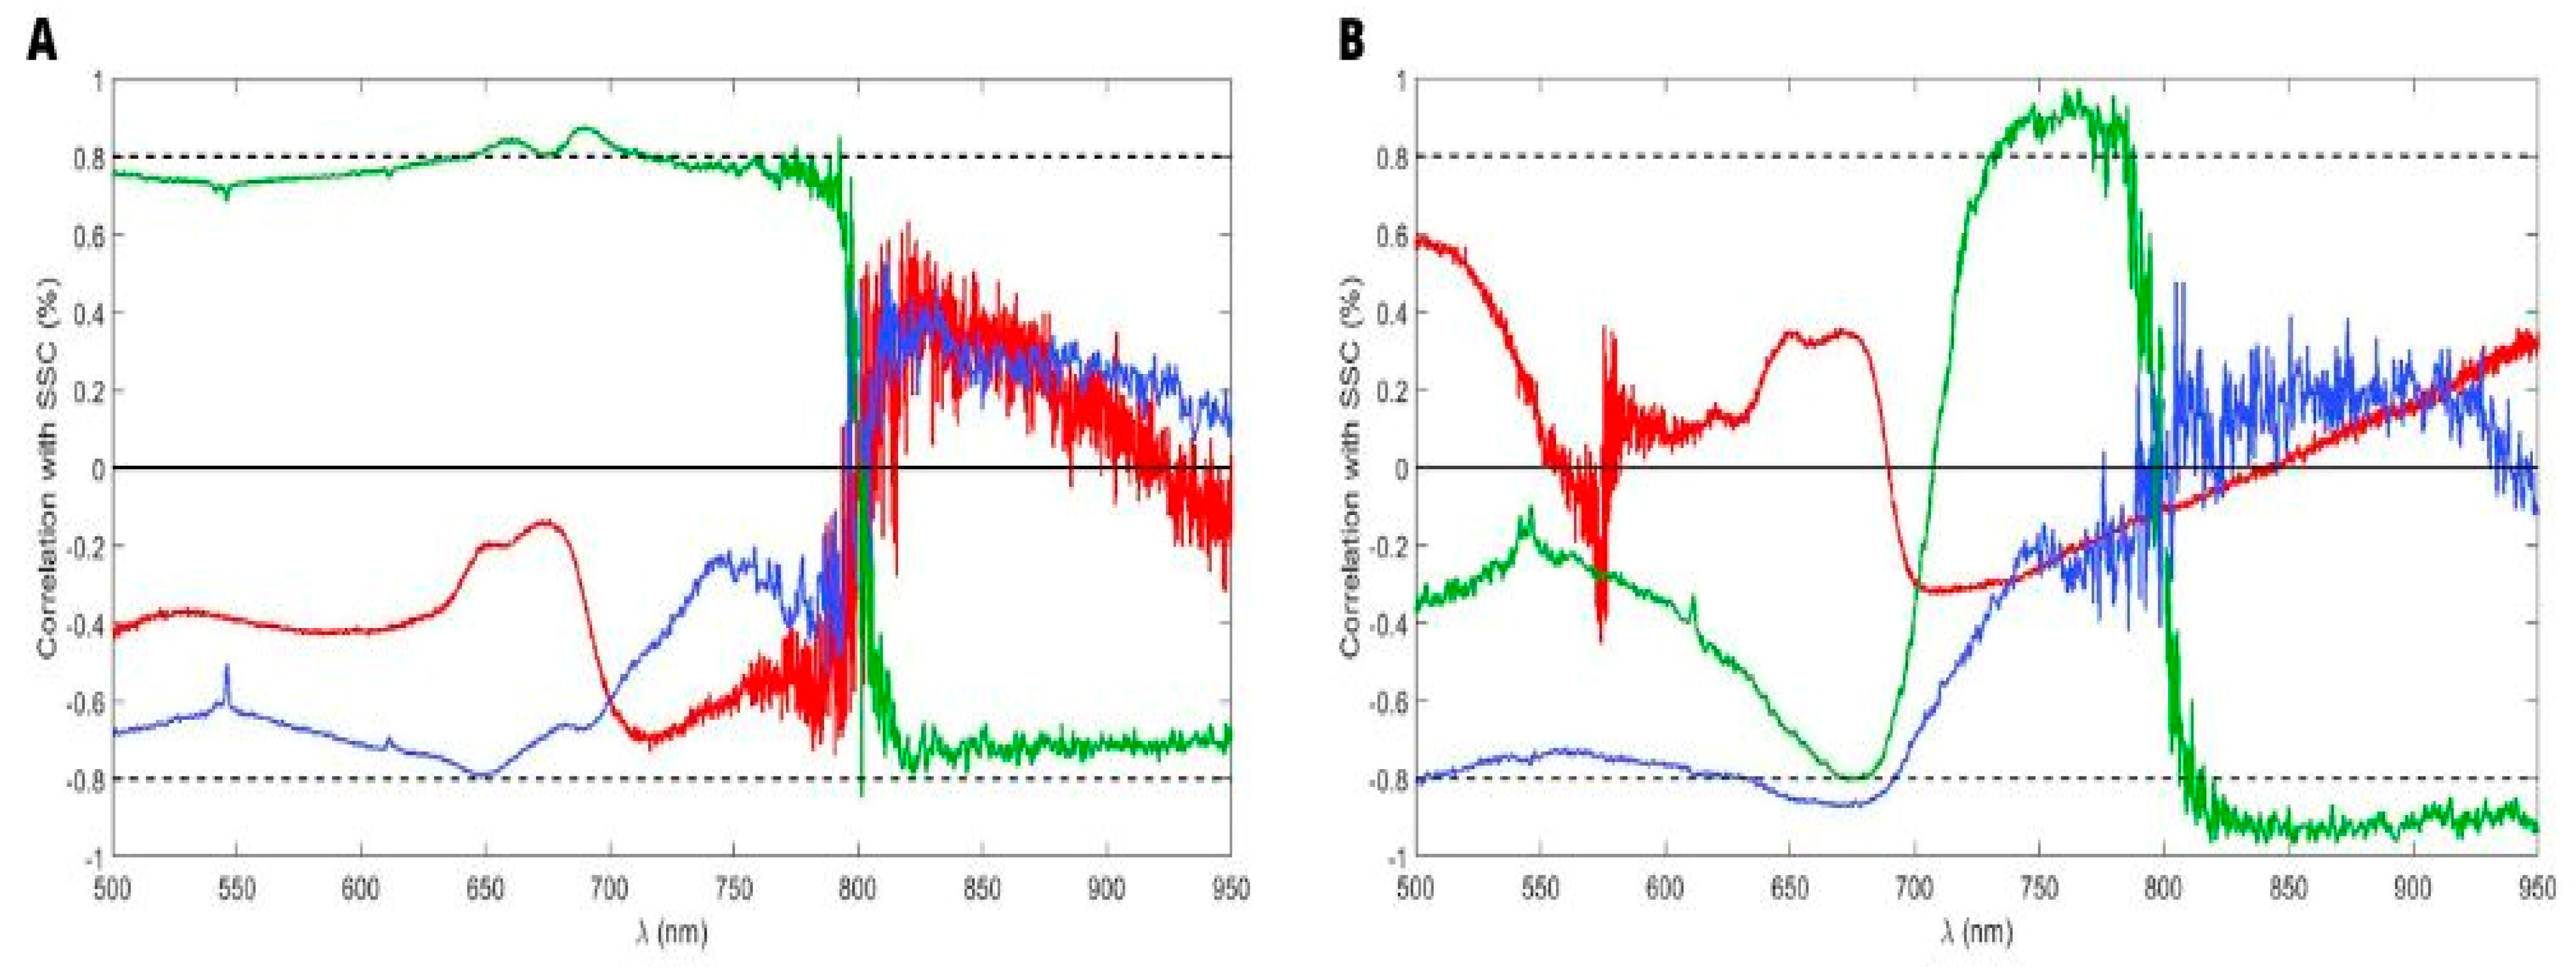
3.3.1. Soluble Solids Content (SSC)
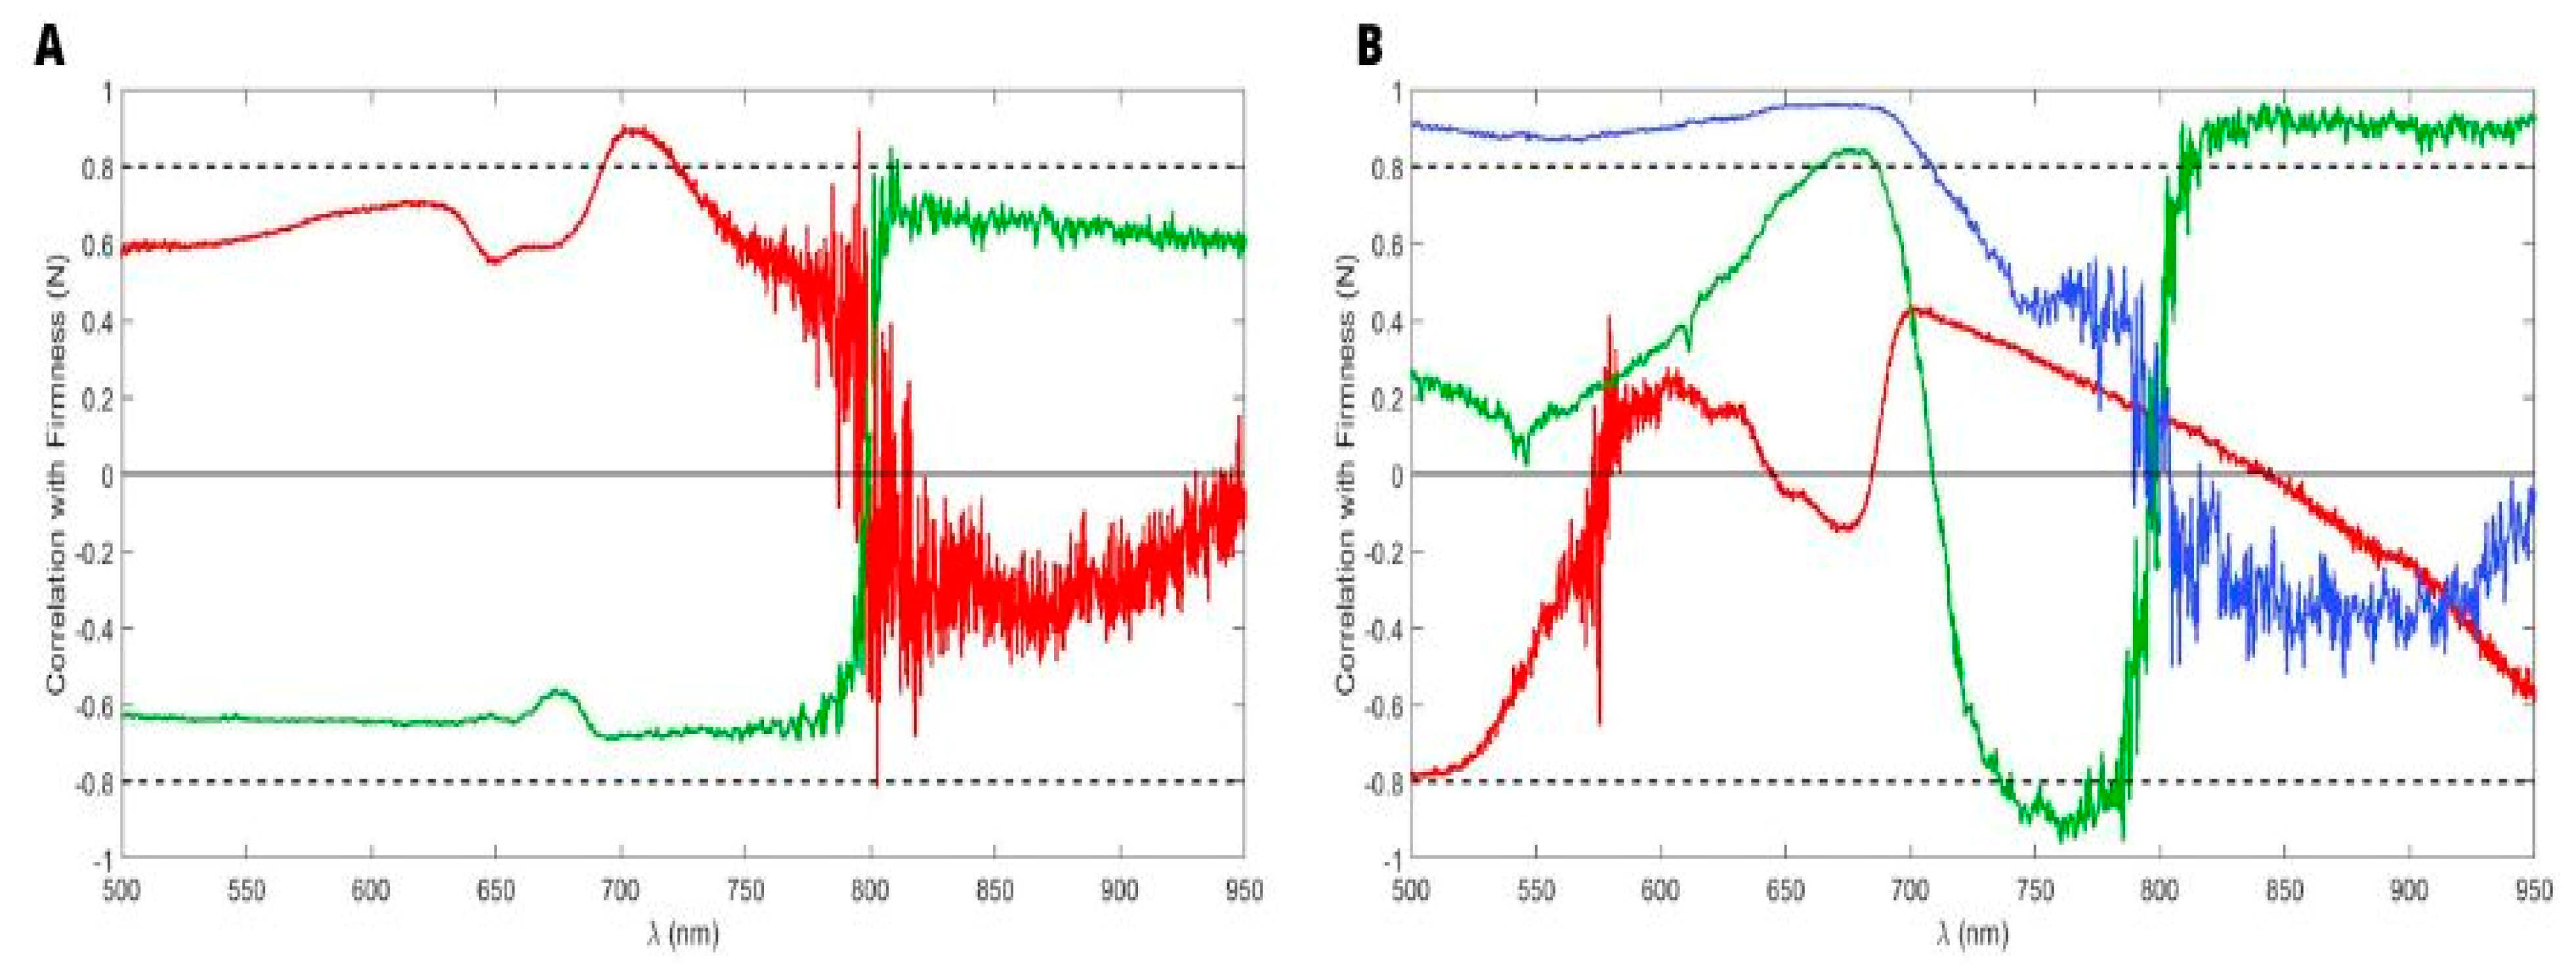
In the first place, correlation between kiwifruit SSC and their reflectance spectra was showed to be very different in each year/season. Even to the point that, in one year (2018/2019), there is a good positive correlation, and in the other two, although not so relevant, the correlation is negative for the same wavelength range (500–800 nm), while in 800–950 nm, the correlation inverted in all seasons (Figure 9A). Although very irregular through years, for ‘Jintao’ kiwifruit the higher correlation was obtained in the range 650–710 nm (≥0.8), followed by the range 820–950, in 2018/2019. The latter range revealed to have a negative correlation with ‘Hayward’ SSC also for kiwifruit from 2018/2019 (Figure 9B). There was also a good correlation, but positive, in the range 730–780 nm for the previous season, and a negative one between 635–690 nm in 2020/2021.
Results showed a very irregular correlation between SSC and reflectance spectra, but there is, effectively, wavelength ranges with good correlation values, meaning that Vis-NIR spectroscopy can be used to predict SSC of kiwifruit during storage with special attention to 635–780 nm, and so the kiwifruit consumers’ preference.

3.3.2. Firmness

Correlation values between reflectance spectra and ‘Jintao’ firmness are totally opposite in the two years showed (Figure 10A). The only relevant correlation was found at 695–720 nm in 2018/2019. In the case of ‘Hayward’ kiwifruit, correlation between firmness and reflectance spectra is even more irregular, not only between seasons, but also along the wavelengths in the same year (Figure 10B). There is a good positive correlation in the range 500–705 nm in 2020/2021 and at 810–950 nm in 2019/2020. A negative correlation was found at 740–785 nm in 2019/2020.

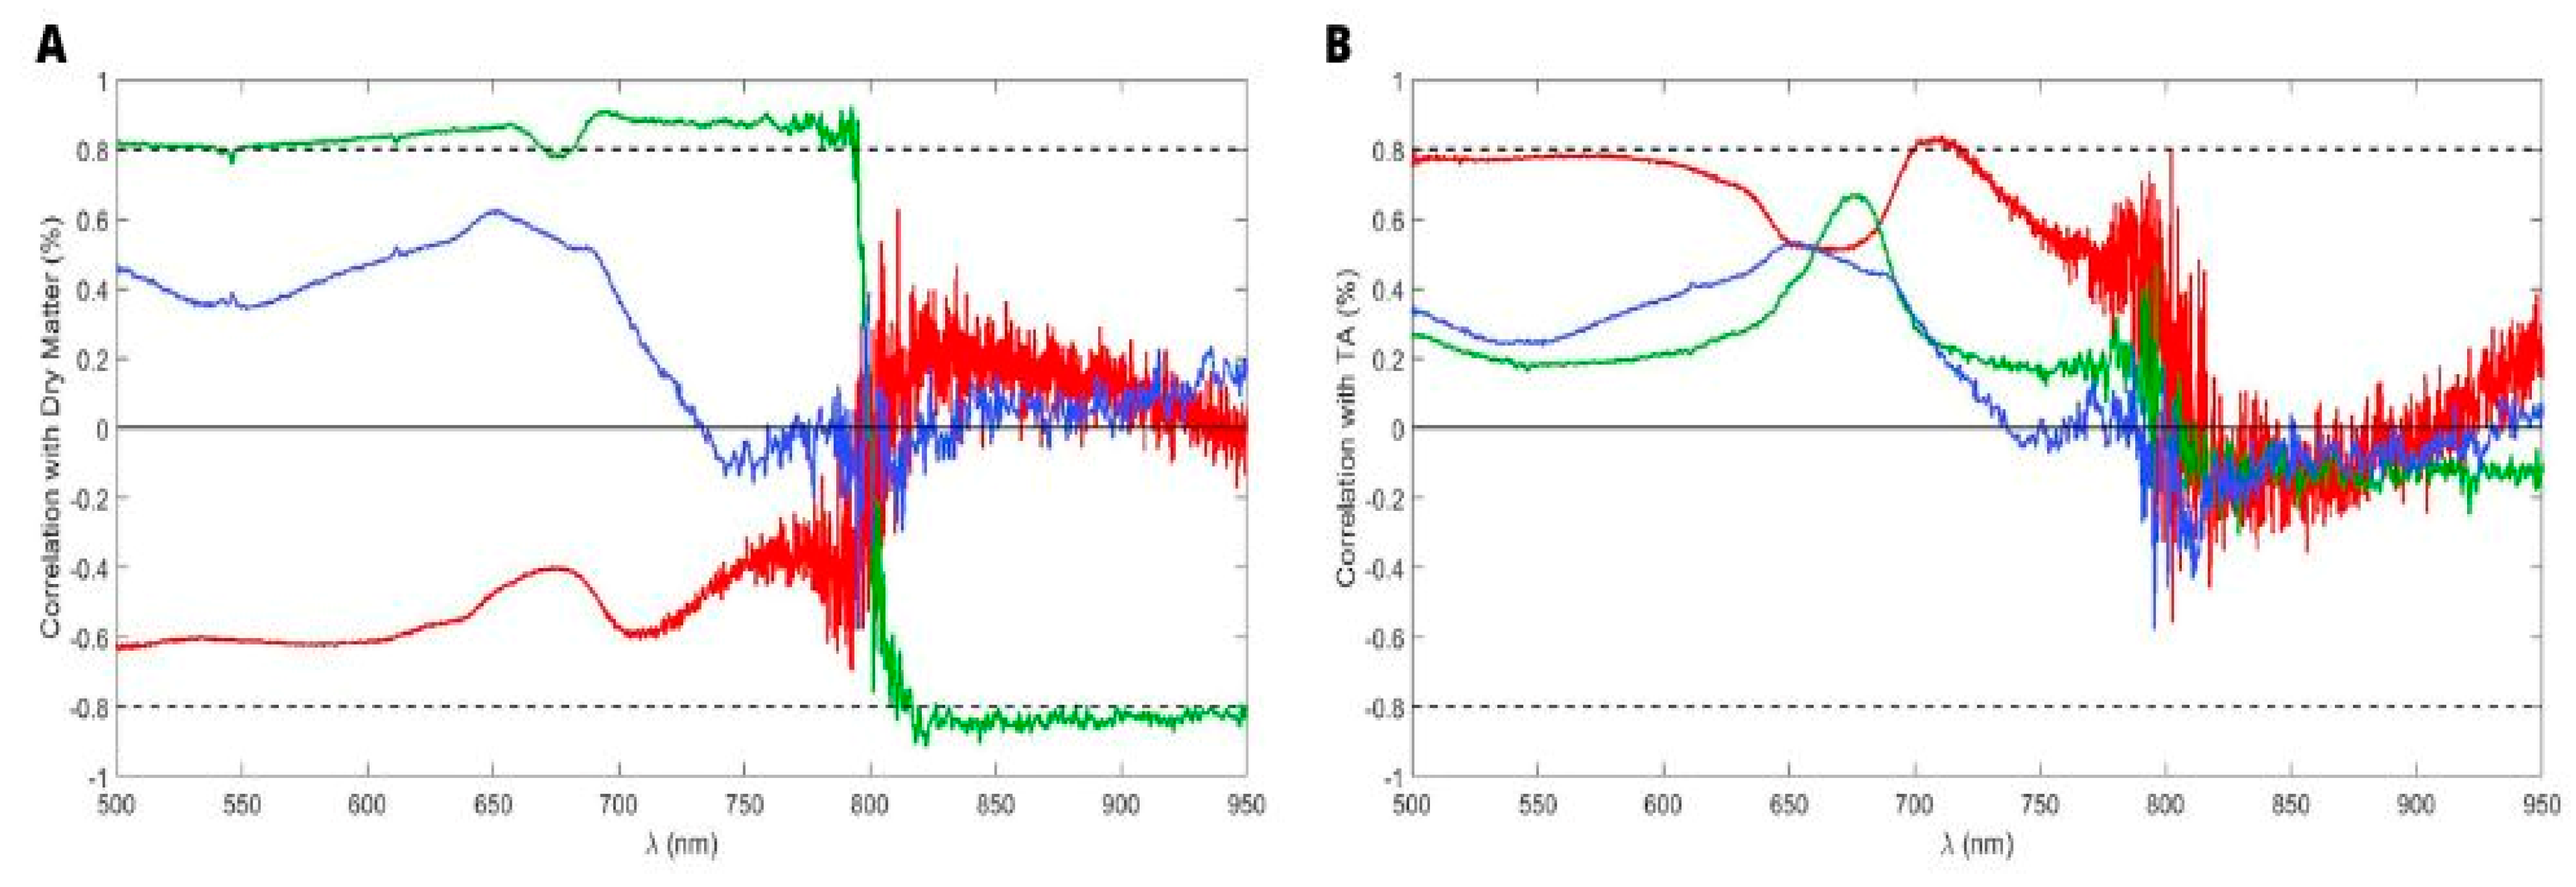
3.3.3. Other Internal Quality Attributes

Considering the results above, further investigation was performed to analyse other internal quality attributes and a good correlation with reflectance spectra was found for ‘Jintao’ kiwifruit dry matter (Figure 11A) and, not so good but still relevant, for titratable acidity (Figure 11B).
Correlation between dry matter of ‘Jintao’ kiwifruit and reflectance spectra acquired during storage is, in fact, very similar with the correlation showed for SSC in 2019/2020, highlighting the high correlation (≥0.8) at almost all spectrum of this year, which was positive at 550–665 nm and 685–790 nm, and negative at 820–950 nm.
On the other hand, although titratable acidity showed only a high positive correlation at 700–715 nm, correlation between 500–595 nm is very close to 0.8 in 2018/2019.

4. Conclusions

In this work, applying the receiver operating characteristic (ROC) analysis to sensory evaluation performed during cold storage of two kiwifruit cultivars, through three years, reveal that for ‘Jintao’ and ‘Hayward’ kiwifruit sweetness, acidity and texture were the variables, with higher impact scores in kiwifruit General taste through cold storage. For ‘Jintao’ aroma was also an important attribute. Although ‘Jintao’ kiwifruit was slightly higher appreciated by consumers than ‘Hayward’, both cultivars were highly appreciated.
Since the Vis-NIR spectroscopy showed to be able to distinguish the chemical and physical changes that occur during kiwifruit ripening in cold storage and there are good correlation values between SSC and reflectance spectra at the 635–780 nm wavelength range, this technology could be an objective alternative to determine optimum eating-ripe stage, which need further research to be consolidated.

Author Contributions

Conceptualization, A.M.A., R.G. and M.D.A.; methodology, R.G., S.C., A.M.A. and M.D.A.; software, R.G., S.C. and A.M.A.; validation, R.G. and M.D.A.; formal analysis, A.M.A. and S.C.; investigation, A.M.A. and S.C.; resources, R.G. and M.D.A.; writing—original draft preparation, A.M.A., S.C., R.G. and M.D.A.; writing—review and editing, R.G. and M.D.A.; supervision, R.G. and M.D.A.; funding acquisition, A.M.A., R.G. and M.D.A. All authors have read and agreed to the published version of the manuscript.

Funding

This research was funded by FCT - Fundação para a Ciência e a Tecnologia, Portugal, through a PhD scholarship for Andreia M. Afonso (SFRH/BD/131462/2017), base and programmatic funding for CEOT (UIDB/00631/2020 and UIDP/00631/2020, respectively) and programmatic funding for MED (UIDP/05183/2020). Part of the work was also supported by the project NIBAP (ALG-01-0247-FEDER-037303).

Data Availability Statement

Data are contained within the article.

Acknowledgments

The authors acknowledge Frutas Douro-ao-Minho (Guimarães, Portugal) for providing the access to the orchards followed in this study and Ana Cavaco for the support through this work.

Conflicts of Interest

The authors declare that they have no known competing financial interests or personal relationships that could have appeared to influence the work reported in this paper.

References

  1. Iwasawa, H.; Morita, E.; Yui, S.; Yamazaki, M. Anti-oxidant effects of kiwi fruit in vitro and in vivo. Biol. Pharm. Bull. 2011, 34, 128–134. [Google Scholar] [CrossRef] [PubMed] [Green Version]
  2. Chai, J.; Wang, Y.; Liu, Y.; Gu, Z.; Liu, Z. High O2/N2 controlled atmosphere accelerates postharvest ripening of ‘Hayward’ kiwifruit. Sci. Hortic. 2022, 300, 111073. [Google Scholar] [CrossRef]
  3. Testolin, R.; Ferguson, A.R. Kiwifruit (Actinidia spp.) production and marketing in Italy. N. Zeal. J. Crop Hortic. 2009, 37, 1–32. [Google Scholar] [CrossRef]
  4. Chai, J.; Wang, Y.; Liu, Y.; Yong, K.; Liu, Z. 1-MCP extends the shelf life of ready-to-eat ‘Hayward’ and ‘Qihong’ kiwifruit stored at room temperature. Sci. Hortic. 2021, 289, 110437. [Google Scholar] [CrossRef]
  5. Burdon, J.; Pidakala, P.; Martin, P.; McAtee, P.A.; Boldingh, H.L.; Hall, A.; Schaffer, R.J. Postharvest performance of the yellow-fleshed ‘Hort16A’ kiwifruit in relation to fruit maturation. Postharvest Biol. Technol. 2014, 92, 98–106. [Google Scholar] [CrossRef]
  6. Ma, T.; Sun, X.; Zhao, J.; You, Y.; Lei, Y.; Gao, G.; Zhan, J. Nutrient compositions and antioxidant capacity of kiwifruit (Actinidia) and their relationship with flesh color and commercial value. Food Chem. 2017, 218, 294–304. [Google Scholar] [CrossRef] [PubMed]
  7. Gambi, F.; Pilkington, S.M.; McAtee, P.A.; Donati, I.; Schaffer, R.J.; Montefiori, M.; Spinelli, F.; Burdon, J. Fruit of three kiwifruit (Actinidia chinensis) cultivars differ in their degreening response to temperature after harvest. Postharvest Biol. Technol. 2018, 141, 16–23. [Google Scholar] [CrossRef]
  8. Costa, G.; Ferguson, R.; Huang, H.; Testolin, R. Main changes in the kiwifruit industry since its introduction: Present situation and future. Acta Hortic. 2018, 1218, 1–16. [Google Scholar] [CrossRef]
  9. Marsh, K.B.; Friel, E.N.; Gunson, A.; Lund, C.; MacRae, E. Perception of flavour in standardised fruit pulps with additions of acids or sugars. Food Qual. Prefer. 2006, 17, 376–386. [Google Scholar] [CrossRef]
  10. Wang, M.Y.; MacRae, E.; Wohlers, M.; Marsh, K. Changes in volatile production and sensory quality of kiwifruit during fruit maturation in Actinidia deliciosa ‘Hayward’ and A. chinensis ‘Hort16A’. Postharvest Biol. Technol. 2011, 59, 16–24. [Google Scholar] [CrossRef]
  11. Garcia, C.V.; Quek, S.Y.; Stevenson, R.J.; Winz, R.A. Kiwifruit flavour: A review. Trends Food Sci. Technol. 2012, 24, 82–91. [Google Scholar] [CrossRef]
  12. Beever, D.J.; Hopkirk, G. Fruit development and fruit physiology. In Kiwifruit Science and Management; Warrington, I.J., Weston, G.C., Eds.; Ray Richards Publisher: Auckland, New Zealand, 1990; pp. 97–126. [Google Scholar]
  13. Burdon, J.; Pidakala, P.; Martin, P.; Billing, D.; Boldingh, H. Fruit maturation and the soluble solids harvest index for ‘Hayward’ kiwifruit. Sci. Hortic. 2016, 213, 193–198. [Google Scholar] [CrossRef]
  14. Wang, H.; Wang, C.; Peng, Z.; Sun, H. Feasibility study on early identification of freshness decay of fresh-cut kiwifruit during cold chain storage by Fourier transform-near infrared spectroscopy combined with chemometrics. J. Food Sci. 2022, 87, 3138–3150. [Google Scholar] [CrossRef] [PubMed]
  15. Jaeger, S.R.; Rossiter, K.L.; Wismer, W.V.; Harker, F.R. Consumer-driven product development in the kiwifruit industry. Food Qual. Prefer. 2003, 14, 187–198. [Google Scholar] [CrossRef]
  16. Nicolaϊ, B.M.; Beullens, K.; Bobelyn, E.; Peirs, A.; Saeys, W.; Theron, K.I.; Lammertyn, J. Nondestructive measurement of fruit and vegetable quality by means of NIR spectroscopy: A review. Postharvest Biol. Technol. 2007, 46, 99–118. [Google Scholar] [CrossRef]
  17. Shah, S.S.A.; Zeb, A.; Qureshi, W.S.; Arslan, M.; Malik, A.U.; Alasmary, W.; Alanazi, E. Towards fruit maturity estimation using NIR spectroscopy. Infrared Phys. Technol. 2020, 111, 103479. [Google Scholar] [CrossRef]
  18. Afonso, A.M.; Antunes, M.D.; Cruz, S.; Cavaco, A.M.; Guerra, R. Non-destructive follow-up of ‘Jintao’ kiwifruit ripening through VIS-NIR spectroscopy–individual vs. average calibration model’s predictions. Postharvest Biol. Technol. 2022, 188, 111895. [Google Scholar] [CrossRef]
  19. Tian, S.; Tian, H.; Yang, Q.; Xu, H. Internal quality assessment of kiwifruit by bulk optical properties and online transmission spectra. Food Control 2022, 141, 109191. [Google Scholar] [CrossRef]
  20. Mehinagic, E.; Royer, G.; Bertrand, D.; Symoneaux, R.; Laurens, F.; Jourjon, F. Relationship between sensory analysis, penetrometry and visible–NIR spectroscopy of apples belonging to different cultivars. Food Qual. Prefer. 2003, 14, 473–484. [Google Scholar] [CrossRef]
  21. François, I.M.; Wins, H.; Buysens, S.; Godts, C.; Van Pee, E.; Nicolaï, B.; De Proft, M. Predicting sensory attributes of different chicory hybrids using physico-chemical measurements and visible/near infrared spectroscopy. Postharvest Biol. Technol. 2008, 49, 366–373. [Google Scholar] [CrossRef]
  22. Sinelli, N.; Cerretani, L.; Di Egidio, V.; Bendini, A.; Casiraghi, E. Application of near (NIR) infrared and mid (MIR) infrared spectroscopy as a rapid tool to classify extra virgin olive oil on the basis of fruity attribute intensity. Food Res. Int. 2010, 43, 369–375. [Google Scholar] [CrossRef]
  23. Downey, G.; Sheehan, E.; Delahunty, C.; O’Callaghan, D.; Guinee, T.; Howard, V. Prediction of maturity and sensory attributes of Cheddar cheese using near-infrared spectroscopy. Int. Dairy J. 2005, 15, 701–709. [Google Scholar] [CrossRef]
  24. González-Martín, M.I.; Severiano-Pérez, P.; Revilla, I.; Vivar-Quintana, A.M.; Hernández-Hierro, J.M.; González-Pérez, C.; Lobos-Ortega, I.A. Prediction of sensory attributes of cheese by near-infrared spectroscopy. Food Chem. 2011, 127, 256–263. [Google Scholar] [CrossRef]
  25. Ribeiro, J.S.; Ferreira, M.M.; Salva, T.J.G. Chemometric models for the quantitative descriptive sensory analysis of Arabica coffee beverages using near infrared spectroscopy. Talanta 2011, 83, 1352–1358. [Google Scholar] [CrossRef] [PubMed] [Green Version]
  26. Ferrer-Gallego, R.; Hernández-Hierro, J.M.; Rivas-Gonzalo, J.C.; Escribano-Bailón, M.T. Evaluation of sensory parameters of grapes using near infrared spectroscopy. J. Food Eng. 2013, 118, 333–339. [Google Scholar] [CrossRef]
  27. Liu, P.; Zhu, X.; Hu, X.; Xiong, A.; Wen, J.; Li, H.; Ai, S.; Wu, R. Local tangent space alignment and relevance vector machine as nonlinear methods for estimating sensory quality of tea using NIR spectroscopy. Vib. Spectrosc. 2019, 103, 102923. [Google Scholar] [CrossRef]
  28. Gago, C.; Guerreiro, A.; Cruz, S.; Martins, N.; Cabrita, M.J.; Miguel, M.G.; Faleiro, M.L.; Antunes, M.D. 1-Methylcyclopropene and lemongrass essential oil nanocoatings effect on the preservation of cold stored ‘Rocha’ pear. Postharvest Biol. Technol. 2022, 192, 1–10. [Google Scholar] [CrossRef]
  29. Antunes, M.D.; Franco, J.; Veloso, F.; Panagopoulos, T. The evolution of kiwifruit production in Portugal. Acta Hortic. 2018, 1218, 17–21. [Google Scholar] [CrossRef]
  30. Cavaco, A.M.; Pires, R.; Antunes, M.D.; Panagopoulos, T.; Brázio, A.; Afonso, A.M.; Silva, L.; Lucas, M.R.; Cadeiras, B.; Cruz, S.P.; et al. Validation of short wave near infrared calibration models for the quality and ripening of ‘Newhall’ orange on tree across years and orchards. Postharvest Biol. Technol. 2018, 141, 86–97. [Google Scholar] [CrossRef]
  31. Workman Jr, J.J. A review of calibration transfer practices and instrument differences in spectroscopy. Appl. Spectrosc. 2018, 72, 340–365. [Google Scholar] [CrossRef]
  32. Greensill, C.V.; Walsh, K.B. Calibration transfer between miniature photodiode array-based spectrometers in the near infrared assessment of mandarin soluble solids content. J. Near Infrared Spectrosc. 2002, 10, 27–35. [Google Scholar] [CrossRef]
  33. Tian, S.; Liu, W.; Xu, H. Improving the prediction performance of soluble solids content (SSC) in kiwifruit by means of near-infrared spectroscopy using slope/bias correction and calibration updating. Food Res. Int. 2023, 170, 112988. [Google Scholar] [CrossRef] [PubMed]
  34. AOAC. Official Methods of Analysis, 16th ed.; Association of Official Analytical Chemists: Arlington, VA, USA, 1994. [Google Scholar]
  35. Kruskal, J.B. Multidimensional scaling by optimizing goodness of fit to a nonmetric hypothesis. Psychometrika 1964, 29, 1–27. [Google Scholar] [CrossRef]
  36. Asiche, W.O.; Mitalo, O.W.; Kasahara, Y.; Tosa, Y.; Mworia, E.G.; Ushijima, K.; Nakano, R.; Kubo, Y. Effect of storage temperature on fruit ripening in three kiwifruit cultivars. Hortic. J. 2017, 86, 403–410. [Google Scholar] [CrossRef] [Green Version]
  37. Antunes, M.D.C.; Sfakiotakis, E.M. Ethylene biosynthesis and ripening behaviour of ’Hayward’ kiwifruit subjected to some controlled atmospheres. Postharvest Biol. Technol. 2002, 26, 167–179. [Google Scholar] [CrossRef]
  38. Rizzolo, A.; Vanoli, M.; Spinelli, L.; Torricelli, A. Sensory characteristics, quality and optical properties measured by time-resolved reflectance spectroscopy in stored apples. Postharvest Biol. Technol. 2010, 58, 1–12. [Google Scholar] [CrossRef]
  39. Hoehn, E.; Gasser, F.; Guggenbühl, B.; Künsch, U. Efficacy of instrumental measurements for determination of minimum requirements of firmness, soluble solids, and acidity of several apple varieties in comparison to consumer expectations. Postharvest Biol. Technol. 2003, 27, 27–37. [Google Scholar] [CrossRef]
  40. Saeys, W.; Do Trong, N.N.; Van Beers, R.; Nicolaï, B.M. Multivariate calibration of spectroscopic sensors for postharvest quality evaluation: A review. Postharvest Biol. Technol. 2019, 158, 110981. [Google Scholar] [CrossRef]
  41. Cen, H.; Lu, R.; Mendoza, F.; Beaudry, R.M. Relationship of the optical absorption and scattering properties with mechanical and structural properties of apple tissue. Postharvest Biol. Technol. 2013, 85, 30–38. [Google Scholar] [CrossRef]
  42. Bobelyn, E.; Serban, A.S.; Nicu, M.; Lammertyn, J.; Nicolai, B.M.; Saeys, W. Postharvest quality of apple predicted by NIR-spectroscopy: Study of the effect of biological variability on spectra and model performance. Postharvest Biol. Technol. 2010, 55, 133–143. [Google Scholar] [CrossRef]
  43. Schotsmans, W.; Verlinden, B.E.; Lammertyn, J.; Nicolaï, B.M. The relationship between gas transport properties and the histology of apple. J. Sci. Food Agric. 2004, 84, 1131–1140. [Google Scholar] [CrossRef]
Figure 1. Pairwise Comparisons for acidity and table of Independent-Samples Kruskal–Wallis test results for ‘Jintao’ kiwifruit.
Horticulturae 09 00772 g001
Figure 2. Pairwise Comparisons for fruit appearance and texture, and table of Independent-Samples Kruskal–Wallis test results for ‘Jintao’ kiwifruit.
Horticulturae 09 00772 g002
Figure 3. MDS (Multidimensional scaling) diagrams showing the Euclidean distance method between the perceptions of consumer’s taste in Actinidia chinensis ‘Jintao’ kiwifruit.
Horticulturae 09 00772 g003
Figure 4. MDS (Multidimensional scaling) diagrams showing Euclidean distance method between the perceptions of consumer’s taste in ‘Hayward’ kiwifruit.
Horticulturae 09 00772 g004
Figure 5. Model quality for ROC curve analysis with tasters’ variables according to General taste maximum value given (seven-point) and the perceptions of consumer’s taste in kiwifruit (‘Jintao’ on the left and ‘Hayward’ on the right).
Horticulturae 09 00772 g005aHorticulturae 09 00772 g005b
Figure 6. Global Model quality for ROC curve analysis with tasters’ variables according to General taste maximum value given (7-point) at kiwifruit (‘Jintao’ on the left and ‘Hayward’ on the right).
Horticulturae 09 00772 g006
Figure 7. Averaged values of A680/A800 from Vis-NIR spectra of kiwifruit acquired along storage time for ‘Jintao’ kiwifruit during: (A) 2018/2019; (B) 2019/2020; (C) 2020/2021. Data depicted are the Mean ± SE of eight kiwifruit.
Horticulturae 09 00772 g007
Figure 8. Averaged values of A680/A800 from Vis-NIR spectra of kiwifruit acquired along storage time for ‘Hayward’ kiwifruit during: (A) 2018/2019; (B) 2019/2020; (C) 2020/2021. Data depicted are the Mean ± SE of eight kiwifruit.
Horticulturae 09 00772 g008
Figure 9. Correlation between soluble solids content (SSC) and Vis-NIR reflectance spectra of: (A) ‘Jintao’ kiwifruit; (B) ‘Hayward’ kiwifruit. Each colour line represents a different year/season (red = 2018/2019; green = 2019/2020; blue = 2020/2021).
Horticulturae 09 00772 g009
Figure 10. Correlation between firmness and Vis-NIR reflectance spectra of: (A) ‘Jintao’ kiwifruit; (B) ‘Hayward’ kiwifruit. Each colour line represents a different year/season (red = 2018/2019; green = 2019/2020; blue = 2020/2021).
Horticulturae 09 00772 g010
Figure 11. Correlation between Vis-NIR reflectance spectra of ‘Jintao’ kiwifruit and: (A) Dry matter; (B) Titratable acidity (TA). Each colour line represents a different year/season (red = 2018/2019; green = 2019/2020; blue = 2020/2021).
Horticulturae 09 00772 g011
Table 1. Descriptive statistics for Actinidia chinensis ‘Jintao’ kiwifruit according to panellist’s evaluation.
Storage
Days
Month
and Year
ParameterMedianMinimumMaximumRangeInter
Quartile
Range
74January 2019Fruit Appearance64731
Pulp Appearance63741.25
Aroma5.53741.25
Texture65721.25
Sweetness62751
Acidity62753
Global Taste65721.25
132March 2019Fruit Appearance65610
Pulp Appearance64730
Aroma63631
Texture52752
Sweetness64731
Acidity64733
Global Taste62751
75January 2020Fruit Appearance64731
Pulp Appearance64732
Aroma64731
Texture63742
Sweetness63742
Acidity62753
Global Taste63742
131March 2020Fruit Appearance62750.75
Pulp Appearance63740.75
Aroma63741
Texture62750.75
Sweetness62752
Acidity63741.75
Global Taste62751.75
70January 2021Fruit Appearance73741
Pulp Appearance63742
Aroma64732
Texture62751
Sweetness65721
Acidity64731
Global Taste74731
127March 2021Fruit Appearance63741
Pulp Appearance63741
Aroma63742
Texture65721
Sweetness64732
Acidity64732
General Taste64731
Table 2. Values of STRESS-I and RSQ for MDS ALSCAL methodology.
Storage DaysMonth and YearSTRESS-I ValueRSQ Value
74January 20190.0250.985
132March 20190.0600.994
75January 20200.0760.894
131March 20200.1350.961
70January 20210.0320.979
127March 20210.0470.997
Table 3. Descriptive statistics for ‘Hayward’ kiwifruit according panellist’s evaluation.
Storage DaysMonth and YearParameterMedianMinimumMaximumRangeInter Quartile Range
74February 2019Appearance76710.5
Pulp66711
Aroma64732
Texture62750
Sweetness52751
Acidity63742
Taste63741.5
131April 2019Appearance75721
Pulp65721
Aroma5.53741
Texture65721
Sweetness52751.75
Acidity5.52752.5
Taste62751
172May 2019Appearance6.55721
Pulp66711
Aroma64731
Texture64731
Sweetness62751.75
Acidity5.52752.75
Taste63741
61January 2020Appearance65721
Pulp74731
Aroma63741
Texture62751
Sweetness52753
Acidity52753
Taste62752
53January 2021Appearance6.55721
Pulp75721
Aroma64731.25
Texture64730.5
Sweetness51762
Acidity51761.25
Taste61761
123March 2021Appearance65721
Pulp65721
Aroma64731
Texture73741
Sweetness61761
Acidity61762
Taste63741
152April 2021Appearance64731
Pulp64731
Aroma64732
Texture75721
Sweetness65721
Acidity63742
Taste65721
Table 4. Mann–Whitney independent test applied in ‘Hayward’ kiwifruit sweetness and general taste evaluation.
ParameterGroup DateNMean RankSum of RanksProbability
SweetnessApril 20191713.82235<0.001
April 20212426.08626
Total41
TasteApril 20191714.882530.003
April 20212425.33608
Total41
Disclaimer/Publisher’s Note: The statements, opinions and data contained in all publications are solely those of the individual author(s) and contributor(s) and not of MDPI and/or the editor(s). MDPI and/or the editor(s) disclaim responsibility for any injury to people or property resulting from any ideas, methods, instructions or products referred to in the content.

