Article

Physiological and Transcriptional Analysis Provides Insights into Tea Saponin Biosynthesis and Regulation in Response to SA in Camellia vietnamensis Huang

1
School of Breeding and Multiplication (Sanya Institute of Breeding and Multiplication), Hainan University, Sanya 572025, China
2
School of Tropical Agriculture and Forestry, Hainan University, Danzhou 571737, China
3
Key Laboratory of Plant Secondary Metabolism and Regulation of Zhejiang Province, College of Life Sciences and Medicine, Zhejiang Sci-Tech University, Hangzhou 310018, China
*
Authors to whom correspondence should be addressed.
These authors contributed equally to this work.
Horticulturae 2024, 10(1), 8; https://doi.org/10.3390/horticulturae10010008
Submission received: 8 November 2023 / Revised: 8 December 2023 / Accepted: 15 December 2023 / Published: 20 December 2023

Abstract

:
Camellia vietnamensis Huang is an important and famous woody oil crop with high economic value in China because of its high-quality, edible, and medicinal oil. As one of its major active components, tea saponin (triterpenoid saponin) has shown anticancer, antioxidant, bacteriostatic, and other pharmacological activities. In this study, C. vietnamensis was used as an experimental material to determine the tea saponin content and physiological activity indicators after salicylic acid (SA) treatment and to analyze the differential expression genes of key metabolic pathways in response to SA by combining transcriptome data. The results showed that SA treatment increased the content of tea saponin and total phenols in leaves; effectively promoted the activity of superoxide dismutase (SOD), peroxidase (POD), catalase (CAT), and ascorbate peroxidase (APX); and decreased the content of malondialdehyde (MDA). A total of 60,038 genes, including 5871 new genes, were obtained by the RNA-seq. There were 6609 significantly differential expression genes mainly enriched in pathways such as sesquiterpenoid and triterpenoid biosynthesis, terpenoid backbone biosynthesis, diterpenoid biosynthesis, and flavonoid biosynthesis. The SA-induced key structural genes (SQS, SQE, bAS, CYP450, and UGT) and transcription factors related to the tea saponin biosynthetic pathway were screened by weighted gene co-expression network analysis (WGCNA). The results of this study could provide a theoretical basis and a new technical method to improve the content of tea saponin, with its excellent anticancer activity, in C. vietnamensis.

1. Introduction

Camellia vietnamensis Huang is a species of tea tree in the Theaceae family that is mainly cultivated in Hainan Island, Thailand, and Vietnam [1,2]. Because of the unique geographical location, long-term isolation, and favorable climate, the C. vietnamensis of Hainan Island is considered an independent germplasm resource [2,3] that is different from Camellia oleifera Abel., which is widely planted in mainland China, and it has a higher content of active ingredients in its tea oil than does C. oleifera [4], thus contributing to a high-grade resource with Hainan characteristics and a higher economic value.
Tea saponin is one kind of oleane-type pentacyclic triterpenoid saponin mixture, which is widely present in various tissues of Camellia spp., especially in seeds [5]. The pharmacological effects, namely antibacterial, antiviral, antioxidant, anti-osmotic, and anticancer, have been proven [6]. For instance, triterpenoid saponin can not only directly inhibit the proliferation of tumor cells but also produce anti-tumor activity by enhancing body immunity, inducing tumor cell apoptosis, reversing drug resistance, and improving anti-angiogenesis activity [7,8]. Therefore, it is important to study the biosynthesis of tea saponin to improve the quality of tea oil and promote the development of the Camellia spp. industry.
The tea saponin biosynthesis pathway can be divided into initiation, skeleton construction, and modification [9,10]. In the initial stage, isopentenyl pyrophosphate (IPP) and dimethylallyl pyrophosphate (DMAPP) are synthesized via mevalonic acid (MVA) and methylerythritol phosphate (MEP) pathways [11]. The 2,3-oxidsqualene is obtained in the skeleton construction stage. In the modification stage, β-amyrin is formed by β-amyrin synthase (bAS)-catalyzed 2,3-oxidsqualene, and then, tea saponin with multiple characteristics is obtained under the modification of CYP450 and UGT [6]. In the synthesis of tea saponin, many intermediate metabolites are active ingredients in tea oil and represent the nutritional quality of the tea oil.
The research on the biosynthesis pathway of tea saponin is still in its infancy, and the main task is to mine genomic and transcriptome data. For example, Yang et al. [10] identified key genes in the tea saponin biosynthesis pathway, including 143 key genes in the initial and skeleton construction stage and 1169 CYP450 and 1019 UGT in the modification phase, by analyzing the released genome data of C. oleifera [12]. Yang et al. [13] cloned 41 WRKY transcription factors through transcriptome sequencing, five of which may regulate SQS genes, and proved that CoWRKY1 could bind to the promoter region of SQS by using yeast monohybrid (Y1H) technology. Although the precursors of tea saponin are widely produced in various plants, tea saponin itself is not widely available. For example, several genera in the Brassica family contain large amounts of β-amyrin, but only Barbarea vulgaris is capable of saponin biosynthesis [14,15], which may be related to the presence of key enzymes in the middle and downstream of saponin synthesis in these particular plants, such as CYP450 and UGT.
Salicylic acid (SA) is a phenolic signaling substance ubiquitous in plants [16]. SA is a key regulatory factor in plant-acquired resistance and in vivo physiological activity [17], which can improve the activities of superoxide dismutase (SOD), peroxidase (POD), catalase (CAT), and other enzymes in plants. It plays an important role in activating defense responses [18]. Moreover, SA is also involved in enhancing the accumulation of secondary metabolites (including terpenoids) in plants [19,20] as one of the most important inducers in hairy root culture [21]. Su et al. [9] found that SA treatment of hairy roots of Psammosilene tunicoides increased the content of triterpenoid saponins by 13%. In addition, this has been verified in Panax ginseng [22], Polygala tenuifolia [23], Ginkgo biloba [24], and other plants. Transcriptome analysis comprehensively explains the SA-mediated regulatory network [9]. However, these studies mainly focus on the molecular mechanism of SA in response to stress [25], and there are few studies on the induction mechanism of terpenoid biosynthesis. Ye et al. [24] carried out RNA-seq analysis on G. biloba leaves treated with SA, found 249 differential genes between the treated group and CK, and identified candidate genes (HMGR and CYP450) and transcription factors (MYB and WRKY) related to terpene biosynthesis. However, there are few studies on the mechanism of SA-induced terpenoid biosynthesis in C. vietnamensis. Thus far, the relationship between SA and terpene accumulation remains unclear. Therefore, analysis of the transcriptome of SA-treated C. vietnamensis may reveal the biosynthetic pathway of terpenes.
At present, the identification and functional analysis of key enzyme genes in the biosynthesis pathway of triterpenoid saponins have been widely studied in medicinal plants such as P. ginseng, Panax notoginseng, and Glycyrrhiza uralensis, but the biosynthesis pathway of tea saponin from C. vietnamensis is still unclear. Therefore, in this study, after treating C. vietnamensis leaves with SA, secondary metabolic components and physiological enzyme activity indexes were determined, and then, the molecular mechanism of tea saponin biosynthesis was investigated by transcriptome analysis. The differential genes of the SA signal response in C. vietnamensis were screened through transcriptome analysis. Key genes and transcription factors were further screened by weighted gene co-expression network analysis (WGCNA). Real-time fluorescence quantitative PCR (RT-qPCR) was used to analyze and verify 20 key genes and 10 transcription factors. The results can lay a foundation for elucidating the molecular mechanism of the biosynthesis of tea saponin from C. vietnamensis.

2. Materials and Methods

2.1. Materials and SA Treatment

A healthy and well-growing C. vietnamensis Wanhai No. 4 was grafted from the oil-tea nursery of the Danzhou campus of Hainan University, China (19°30′28″ N, 109°29′45″ E), as the experimental material for SA treatment.
SA set four concentration gradients: 4 mM, 10 mM, 15 mM, and 20 mM. First, 1 M of SA mother liquor was prepared, and then, 0, 0.8, 2, 3, and 4 mL SA mother liquor was filled with ultra-pure water to 200 mL to prepare CK, 4 mM, 10 mM, 15 mM, and 20 mM of SA. At 11 am, the annual seedlings of C. vietnamensis were sprayed with different concentrations of SA solution until the surface of the leaves was dripping. Twenty-five plants were designated for each treatment, and plastic film was used to isolate the different treatment groups. At different time periods (0 h, 2 h, 6 h, 12 h, 18 h, 24 h, 36 h, 48 h, and 72 h), 25 strains of C. vietnamensis were mixed. Young leaves were taken and washed and wiped with clean water and then put into liquid nitrogen immediately, used immediately, or stored at –80 °C.
Then, leaves samples from CK and 20 mM SA treatments were selected for transcriptome (12 h, 36 h, and 72 h, with three biological replicates) sequencing analysis based on changes in tea saponin content.

2.2. Determination of Secondary Metabolites

Next, we weighed about 0.1 g of C. vietnamensis leaves, added 3 mL 50% ethanol, ground the sample, and poured it into a 5 mL centrifuge tube. The volume was fixed to 5 mL with 50% ethanol [26,27], subjected to ultrasound for 60 min, and centrifuged at 12,000 rpm for 15 min. The supernatant was the extraction solution for determining secondary metabolic components and was stored at 4 °C.
The method from Su et al. [9] was used to prepare the standard curve and sample liquid and determine the tea saponin content. First, we accurately added by pipette 0.50 mL extraction solution to be tested in a 10 mL stoppered test tube and then accurately added 0.50 mL 8% vanillin absolute ethanol solution. Again, we added 4 mL concentration of 77% sulfuric acid solution into the ice-water bath and shook and heated it in the water bath at 60 °C for 15 min. Then, the tube was transferred to ice water to cool for 10 min, and its absorbance was determined at the wavelength of 550 nm. The tea saponin content was calculated according to the standard curve and absorbance.
The Folin–Ciocalteu colorimetric method was used to extract and determine total phenols [28]. According to the standard curve y = 10.825x + 0.0514 (R2 = 0.9997), the content of total phenols in C. vietnamensis leaves was calculated.
The aluminum nitrate method determined the total flavonoid content [28]. According to the standard curve y = 1.2214x + 0.0443 (R2 = 0.9997), the content of total flavonoids in C. vietnamensis leaves was calculated.

2.3. Determination of Physiological Enzyme Activity Index

Next, we weighed 0.5 g C. vietnamensis leaves and added them into a liquid nitrogen pre-cooled mortar, added 3 mL 0.05 mol·L−1 phosphate buffer solution (PBS) of pH 7.8, and ground in an ice bath. The homogenate was poured into a centrifuge tube that was filled with PBS to 5 mL and then centrifuged at 12,000 rpm at 4 °C for 30 min. The supernatant was the enzyme liquid directly used or stored in the refrigerator at 4 °C.
The H2O2 content was determined in strict accordance with the instructions of the hydrogen peroxide kit (Suzhou Keming Biotechnology Co., Ltd., Suzhou, China).
The change in the superoxide anion (O2) production rate was measured according to the instructions of the superoxide anion kit (Suzhou Keming Biotechnology Co., Ltd., Suzhou, China). The O2 production rate in the sample was calculated according to the standard curve y = 0.0242x − 0.0027 (R2 = 0.9980).
The content of MDA was determined using the thiobarbituric acid (TBA) method with a slight modification [29]. We weighed 0.6 g TBA, dissolved it with a small amount of 1 M NaOH, and volumed it with 10% TCA (trichloroacetic acid) to 100 mL to obtain an MDA reaction solution. Next, 1 mL enzyme solution with a 2 mL MDA reaction solution was sealed in a boiling water bath for 15 min, rapidly cooled, and centrifuged at 12,000 rpm for 1 min, and the supernatant was then taken for colorimetric analysis at three wavelengths, namely 600, 532, and 450 nm. Using pure water as blank zero, each treatment was repeated three times.
The SOD activity was determined according to the method of Bouthayna et al. [29] with some modifications. The SOD reaction solution was prepared in the following order: 0.05 M PBS (pH 7.8), 130 mM methionine (Met) solution, 750 μM nitro blue tetrazolium dichloride (NBT) solution, 100 μM EDTA-Na2 solution, and 20 μM riboflavin and water; the corresponding ratio was 15:3:3:3:2.5. Then, 20 μL enzyme solution with 3 mL SOD reaction solution was designated as the treatment group, PBS as control, and also the blank, respectively. The blank was placed in a dark place, and the enzyme solution and the control were treated with 4000 Lux light (40 W 220 V; 50/60 Hz; I: 0.27 A) for 30 min. They were then preserved under dark light. Color comparison was performed at 560 nm with blank zero, and each process was repeated three times.
POD enzyme activity was determined by the guaiacol method [30]. POD reaction liquid is prepared in the following steps: we added 28 μL guaiacol into 50 mL 0.1 M PBS (pH 6.0), dissolved it, and added 19 μL 30% H2O2 after cooling. Then, we mixed it and placed it in the refrigerator at 4 °C. Next, 100 μL enzyme solution with 3 mL POD reaction solution was placed in the cuvette with PBS as the blank control, and the reading was performed every 1 min at 470 nm for a total of three times. The absorbance change value per minute represented the enzyme activity. Each process was repeated three times.
CAT enzyme activity was determined by Saidi et al. [30] with a slight modification. The CAT reaction solution was prepared at a ratio of 1:4 between 0.1 M H2O2 and 0.1 M PBS (pH 7.0). We added 50 μL enzyme solution with 2.5 mL CAT reaction solution in the colorimetric plate, compared the color at 240 nm, reading once every 1 min, for a total of three read times. CAT activity was expressed in terms of absorbance change per minute.
The APX enzyme activity was determined by Saidi et al. [30]. The APX extraction buffer consisted of 0.05 M PBS (pH 7.0), 2 mM ascorbic acid, 5 mM EDTA, and 1% polyvinyl pyrrolidone (PVP). We prepared the APX reaction solution as follows: 0.5 mM ascorbic acid, 0.1 mM EDTA, and 11.2 μL 30% H2O2. Then, we volumed to 500 mL with 0.05 M PBS (pH 7.0), which needed to be prepared before use. Next, we placed about 0.25 g of leaves into a pre-cooled mortar, added the pre-cooled APX extraction buffer, quickly homogenized, and centrifuged at 4 °C, 12,000 rpm for 20 min. The supernatant is the APX crude extract. The 0.1 mL APX crude extract with 2.9 mL reaction solution was colorimetric at 290 nm at 10 s, 20 s, 30 s, and 40 s readings, respectively. Each treatment was repeated three times by using distilled water.

2.4. Transcriptomic Analysis

We followed the instructions of the rapid universal plant RNA extraction kit (Huayueyang Biotech Co., Ltd., Beijing, China) for RNA extraction. RNA quality was measured using a nucleic acid analyzer (Thermo Scientific, Waltham, MA, USA) and gel electrophoresis, and qualified RNA samples were directly used for subsequent RNA-seq analysis or stored at –80 °C.
The transcriptome sequencing of C. vietnamensis was commissioned to Gene Denovo Biotechnology Co. (Guangzhou, China). Based on the genomic data of Camellia lanceoleosa (NCBI_GCA_025200525.1), the obtained transcriptome data were compared and analyzed by HISAT2. With FDR < 0.05 and |log2FC| > 1 as the difference screening conditions, the differential gene analysis and differential gene enrichment analysis were conducted by DESeq2 software (version 1.36.0). The weighted gene co-expression network analysis (WGCNA) was accomplished with the R package and Cytoscape software (v3.6.0, Hill St, San Diego, CA, USA), with a module similarity of 0.9, the power value of 10, and the minimum number of genes of 50 [31]. The content of secondary metabolites (tea saponin, total phenols, and total flavonoids) and related gene data were used for WGCNA analysis.

2.5. Verification of RT-qPCR Analysis

Primers were designed using Primer 5.0 (Premier Biosoft, San Francisco, CA, USA) (Table S1). Real-time fluorescent quantitative PCR (RT–qPCR) reactions were completed using the MonAmp™ ChemoHS qPCR Mix kit (Monad Biotechnology Co., Ltd., Wuhan, China), and the reaction system and procedure are herein shown (Tables S2 and S3). Amplification reactions were performed on a Roche LightCycler 96 (F. Hoffmann-La Roche Ltd., Basel, Switzerland). Glyceraldehyde-3-phosphate dehydrogenase (GAPDH) was selected as an internal reference gene. Furthermore, the data were analyzed by the 2™ΔΔCt method.

2.6. Statistical Analysis

The data from the physiological indicators were processed by Excel 2019 software (Microsoft China) and mapped by Origin software (version 9.80, OriginLab Corporation, Northampton, MA, USA), and the difference significance analysis (Duncan method) and correlation analysis (Pearson correlation coefficient) were performed by SPSS v26.0 software (International Business Machines Corp., Pheonix, AZ, USA), and the significance level was p ≤ 0.05.

3. Results

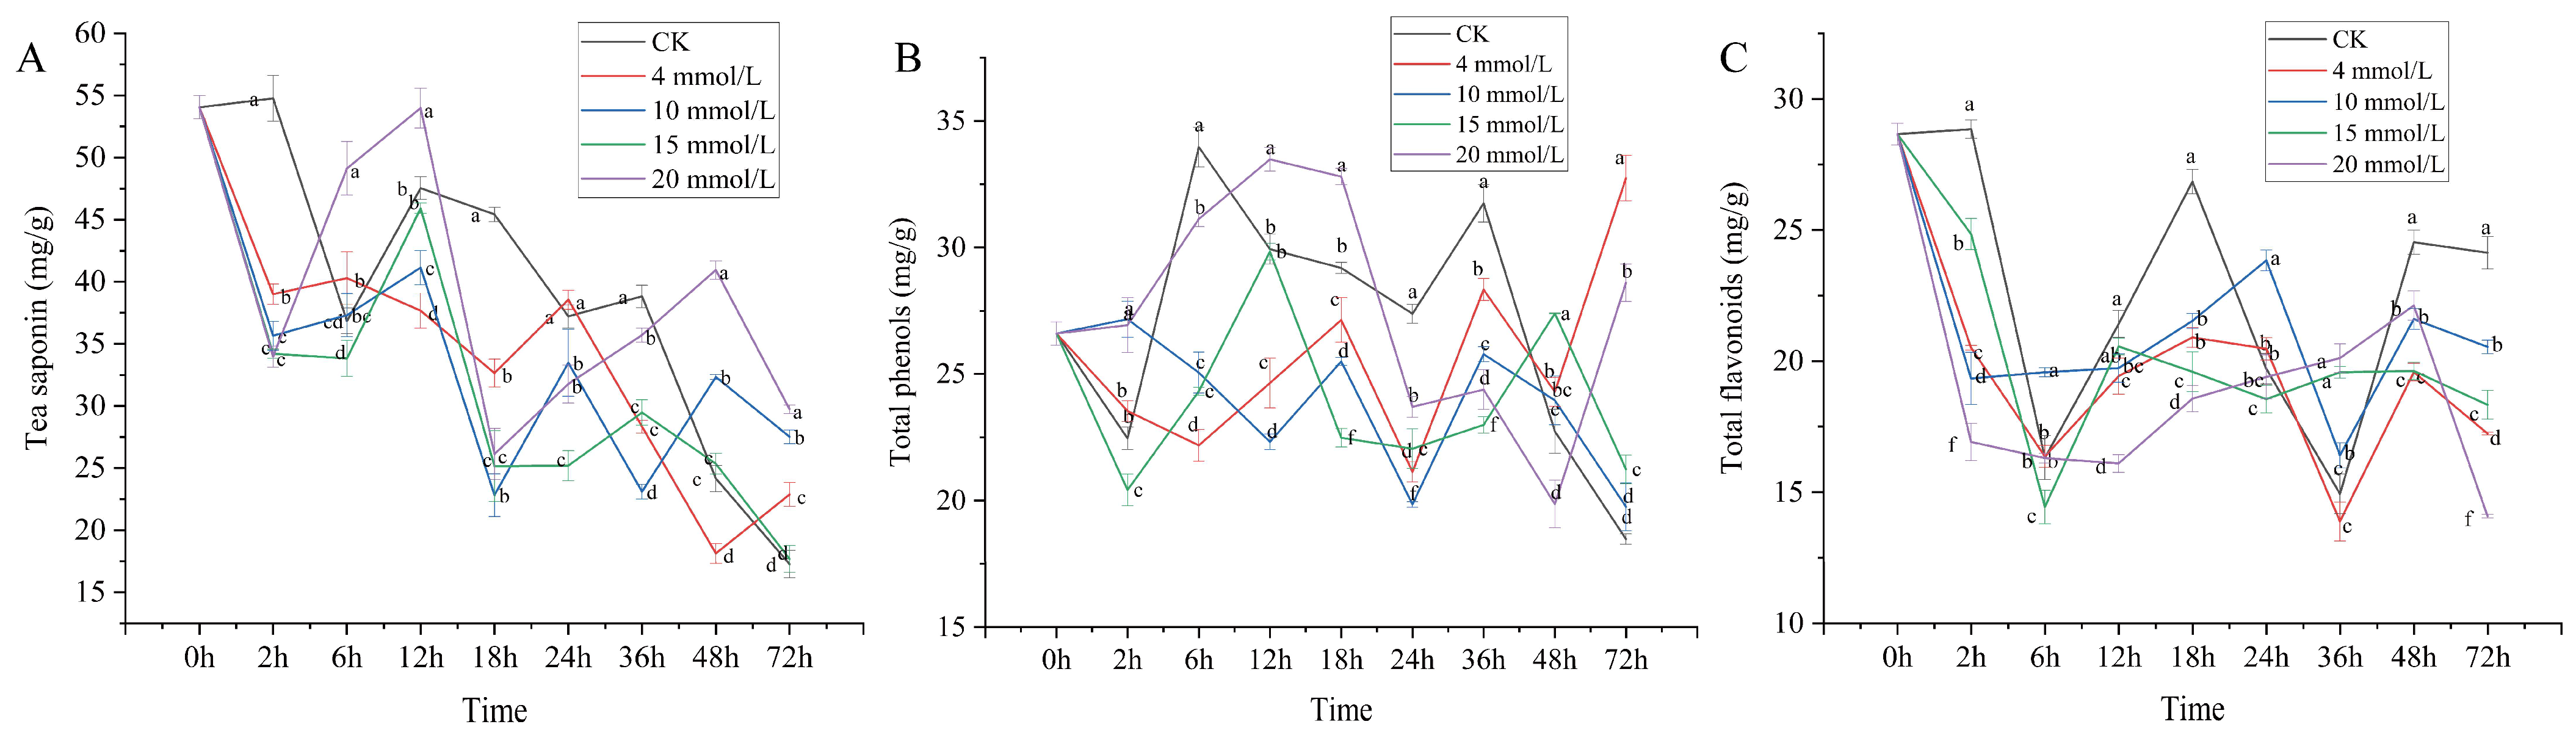
3.1. Effect of SA on Secondary Metabolic Components of C. vietnamensis

Different concentrations of SA affected the secondary metabolites of tea saponin in the leaves of C. vietnamensis and significantly affected them (Figure 1A). After SA treatment for 2 h, the accumulation of tea saponin decreased and then increased, reaching its peak at 12 h, decreasing at 18 h, and increasing at 24 h; the trend was inconsistent at 36 h (4 and 10 mM SA treatment decreased it, while 15 and 20 mM SA treatment increased it). At 48 h, 4 and 15 mM SA decreased and 15 and 20 mM SA treatment increased accumulation, while 4 mM SA treatment increased it at 72 h. The treatment of 10, 15, and 20 mM decreased it, and the overall trend showed irregular fluctuations. Among them, after 20 mM SA treatment, the content of tea saponin increased at 6 h, 12 h, 48 h, and 72 h compared with CK, and the content of tea saponin increased by about 1.7−fold compared with CK at 72 h. These results indicate that the high-concentration SA treatment was more sensitive to the positive response of tea saponin in C. vietnamensis than the low-concentration treatment, and the 20 mM SA treatment had the best effect. Therefore, the time points (12 h, 36 h, and 72 h) were selected for transcriptome analysis according to the differential variation of tea saponin content.
The response pattern of total phenols content in C. vietnamensis in response to SA was similar to that of tea saponin, showing an irregular fluctuation trend (Figure 1B). After SA treatment, the total phenol accumulation of the 15 and 20 mM SA treatment reached a peak at 12 h, 4 mM SA treatment reached a peak at 72 h, and 10 mM SA treatment reached a peak at 2 h. Overall, the fluctuation trend of the 4, 10, and 20 mM SA treatment was consistent at 18–48 h, all of which caused a decrease first, an increase after 24 h, and a decrease at 36 h. After 48 h, 4 and 20 mM SA treatment increased accumulation, while 10 mM SA treatment decreased it. The 15 mM SA treatment decreased the content at 18–24 h, increased it at 24–48 h, and decreased it again after 48 h. In addition, the total phenolic content of the 20 mM SA-treated leaves of C. vietnamensis was higher than that of the CK treatment at 12 h, 18 h, and 72 h. After SA treatment, C. vietnamensis generally showed negative feedback in the early stage and positive feedback in the later stage, especially during 4 mM and 20 mM treatment.
As seen in Figure 1C, the content of total flavonoids in the leaves of C. vietnamensis treated with SA showed an irregular fluctuation. Between 0–6 h, after 4, 15, and 20 mM SA treatment, the accumulation of total flavonoids showed a downward trend, while 10 mM SA treatment caused a downward trend at 2 h and was in an trend at 2–24 h. At 36–72 h, the fluctuation trend of total flavonoids accumulation in 10 and 4 mM SA treatments was consistent; both were decreased at 36 h, increased at 48 h, and then decreased at 72 h. During 12–48 h, 20 mM SA treatment was on the rise, and after 72 h, it declined, while the fluctuation trend for the 15 mM SA treatment during 24–72 h and 20 mM SA treatment was consistent. The accumulation of total flavonoids in C. vietnamensis after 2 h, 12 h, 18 h, 48 h, and 72 h was lower than that of CK, and notably, the negative feedback degree of 20 mM was more prominent. Interestingly, after 20 mM SA treatment at 36 h, the content of total flavonoids was higher than that of other treatments and CK and increased by about 1.3 times compared with CK. The results showed that SA treatment had an inhibitory effect on the content of total flavonoids in C. vietnamensis leaves.

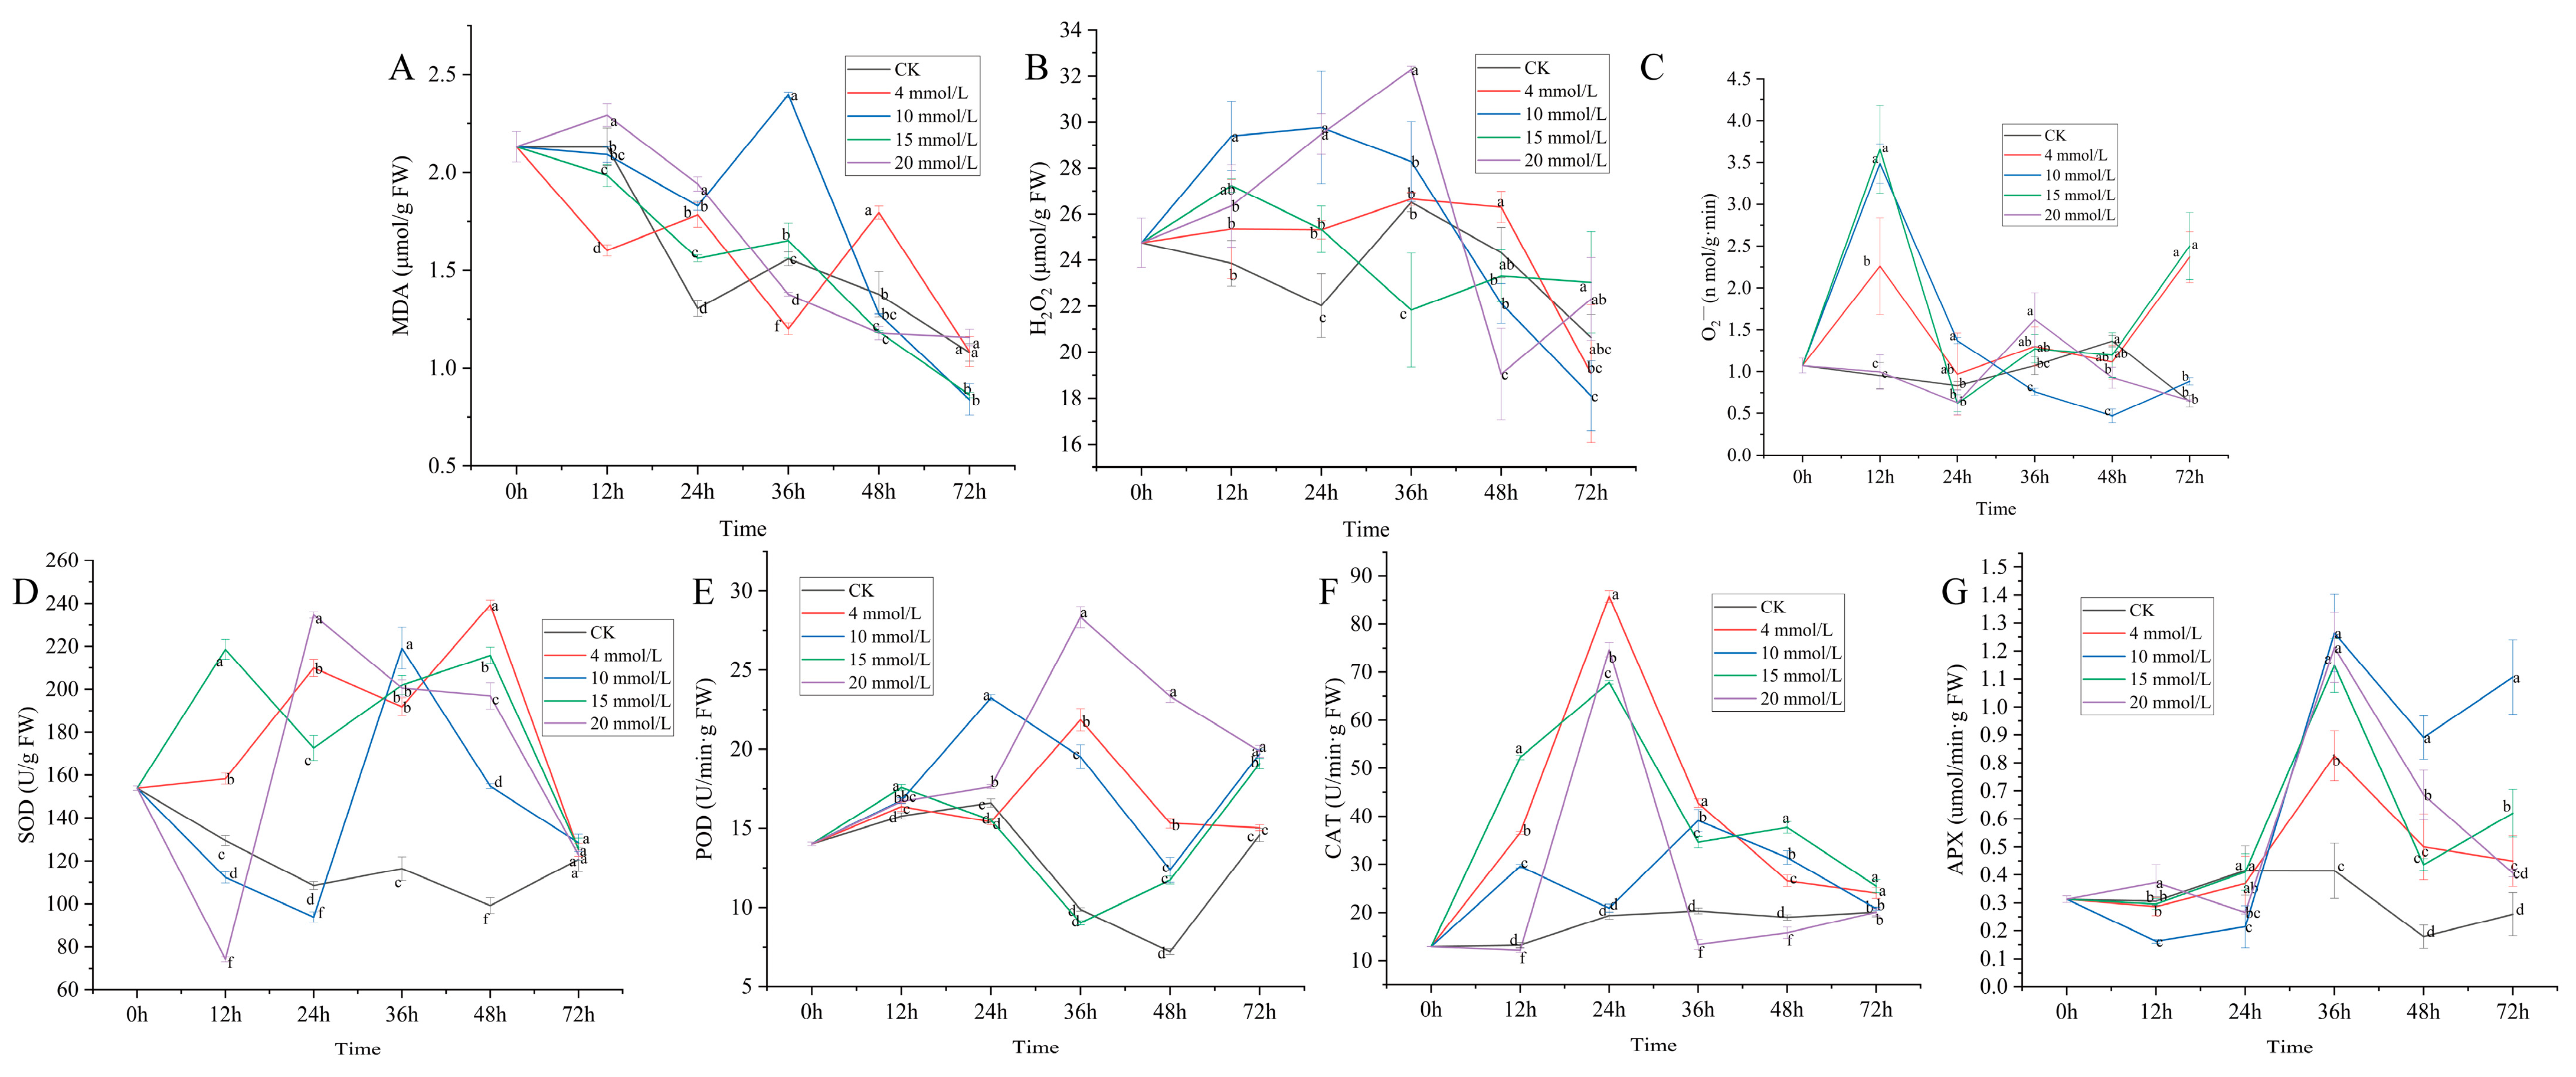
3.2. Effect of SA on Physiological Activity of C. vietnamensis

MDA is one of the important secondary metabolites produced by lipid peroxidation, and its excessive content aggravates the degree of membrane damage. Therefore, the content of MDA is a common index to reflect plant stress resistance and maturation. As shown in Figure 2A, after SA treatment, the MDA content in the leaves of C. vietnamensis showed a downward trend, and the MDA accumulation in each treatment reached the lowest value at 72 h. Among them, the high-concentration treatment (15 and 20 mM) showed a gradual fluctuation decrease, and its inhibition effect on MDA was the best at 72 h. However, the fluctuation range of low-concentration treatments was more extensive. After 4 mM SA treatment, the MDA content showed two higher values at 24 h and 48 h, which were higher than CK. After treatment with 10 mM SA, it peaked at 36 h. The results show that different concentrations of SA had different inhibitory effects on MDA content in leaves of C. vietnamensis, and the inhibitory effect of high-concentration treatment was slightly higher than that of low-concentration treatment. In addition, the effect of SA treatment on MDA has certain persistence and time specificity.
Both H2O2 and O2 are reactive oxygen species (ROS) in plants, and the dynamic balance of ROS in plants is an important condition for maintaining normal growth and avoiding damage to cells. According to Figure 2B, different concentrations of SA treatment had different effects on H2O2 content, but the content increased in the early stage and decreased in the later stage. Compared with CK, the H2O2 content of the SA treatment group increased at 12 h and 24 h and showed different trends in the later period. The H2O2 content of C. vietnamensis leaves treated with 4 and 20 mM SA reached a peak at 36 h; the H2O2 content of the 15 mM treatment group was the lowest at 36 h, and the content of only this treatment was lower than that of CK. The results show that SA treatment of C. vietnamensis leaves leads to excessive accumulation of H2O2 in a short period, and then, the content of H2O2 decreases to the same level as CK with the increase of time. The O2 production rate change after SA treatment generally increases first, then decreases, and then gradually stabilizes (Figure 2C). Among them, after 12 h of SA treatment, the production rate of O2 in the treatment group increased rapidly to varying degrees except for the decrease of the O2 production rate under the 20 mM treatment, and the rate of all treatment groups was higher than that of CK at this time point. At 48 h, the rate of the treatment group was lower than that of CK, and the rate of the 10 mM treatment was the lowest. The change trend of the O2 production rate in leaves of C. vietnamensis treated with 4 and 15 mM SA was the same, but the peak point differed. The maximum rate of the former appeared at 72 h, and the latter appeared at 12 h. There was no significant difference between the change trend of the rate after 20 mM SA treatment and CK, indicating that a high concentration of SA had no significant effect on the O2 production rate of C. vietnamensis leaves.
Plants will initiate their protective enzyme system to reduce damage to themselves when subjected to external stress. SOD is one of the most important protective enzymes, mainly scavenging O2. The effect of different concentrations of SA on SOD activity in leaves of C. vietnamensis is shown in Figure 2D. After treatment with 4 and 15 mM SA, the SOD activity in leaves of C. vietnamensis increased significantly, showing different degrees of increase over time compared with CK, and the SOD activity of these two treatments was higher than that of CK at all time points. The change trend of SOD activity in leaves of C. vietnamensis treated with 10 and 20 mM SA was more consistent, but there was a certain delay and specificity in time, for example, for the lowest value of SOD activity, the former appeared at 24 h, and the latter appeared at 12 h; the highest value of SOD activity appeared at 36 h, and the latter appeared at 24 h. The above results show that the leaves of C. vietnamensis could rapidly produce a stress response after SA treatment and enhance the activity of SOD enzyme in plants. However, over time, the activity of SOD in the treatment group was gradually equal to that of CK after the external stress became weaker.
As it is an important peroxidase in plants, the activity of POD can be used to reflect the changes of metabolism at a certain stage. Figure 2E shows that the POD activity in leaves of C. vietnamensis treated with SA tends to be stable at first and then generally shows a trend of increasing first and then decreasing. The change trend of POD activity in leaves of C. vietnamensis treated with 4 and 20 mM SA was consistent and reached its highest value at 36 h, which was 2.21 and 2.87 times the CK enzyme activity, respectively. The change trend of POD enzyme activity in 15 mM SA treatment group was similar to that of CK at 0–36 h, and there was no significant difference, but it was slightly higher than that of CK, indicating that the treatment had no substantial effect on inducing POD enzyme activity in leaves of C. vietnamensis. In general, the POD activity of the treatment group was not significantly different from that of CK at 12 h and 24 h after treatment, but the enzyme activity was significantly higher than that of CK at 36 h, 48 h, and 72 h after treatment. It shows that the response period of POD to SA in leaves of C. vietnamensis is mainly concentrated in the later stage of treatment.
CAT is a key enzyme that plays an antioxidant role in plants. It can remove H2O2 produced under stress conditions and reduce its damage to plants. From Figure 2F, it can be seen that SA treatment greatly influences CAT activity in leaves of C. vietnamensis, which generally increases first and then decreases. The change trend of CAT activity in 4, 15, and 20 mM SA treatment groups was similar, and all reached their maximum value at 24 h after treatment, which was 4.43, 3.50, and 3.86 times that of CK. The effect of the 10 mM SA treatment group on CAT activity was not as high as that of other treatment groups, but there were also two higher points in this process (12 h and 36 h). The CAT activity of 4, 10, and 15 mM SA treatment was higher than that of CK at all time points, while the CAT activity of the 20 mM SA treatment group was only higher than that of CK in the early stage of treatment, and the activity was slightly lower than that of CK in the later stage. The results show that different concentrations of SA treatment had different responses to CAT activity in leaves of C. vietnamensis, and low-concentration treatment had an effect in the induction process, but high-concentration treatment had a better effect only in the early stage of treatment.
APX is a heme peroxidase, one of the antioxidant enzymes that plays an important role in the process of active oxygen metabolism in plants. The effects of different concentrations of SA treatment on APX activity in C. vietnamensis leaves were similar (Figure 2G). In general, it was flat with CK and then increased rapidly, decreased rapidly, and stabilized. The APX activity of the SA treatment group was higher than that of CK in the later period (36 h, 48 h, and 72 h), and all reached their peak at 36 h, respectively. The results showed that SA had little effect on the APX activity in leaves of C. vietnamensis in the early stage of treatment, but the effect of later treatment was better.

3.3. Correlation Analysis of Secondary Metabolic Components and Physiological Activity Indexes

The above secondary metabolites and enzyme activity indexes data were input into SPSS software for Pearson correlation analysis, and correlation tables were obtained (Table 1). Tea saponin was significantly positively correlated with total phenols, total flavonoids, and MDA, while total flavonoids were significantly positively correlated with MDA content and negatively correlated with POD. MDA was also significantly negatively correlated with POD. In addition, SOD and CAT showed a significant positive correlation, and APX also showed a significant positive correlation with SOD and POD.

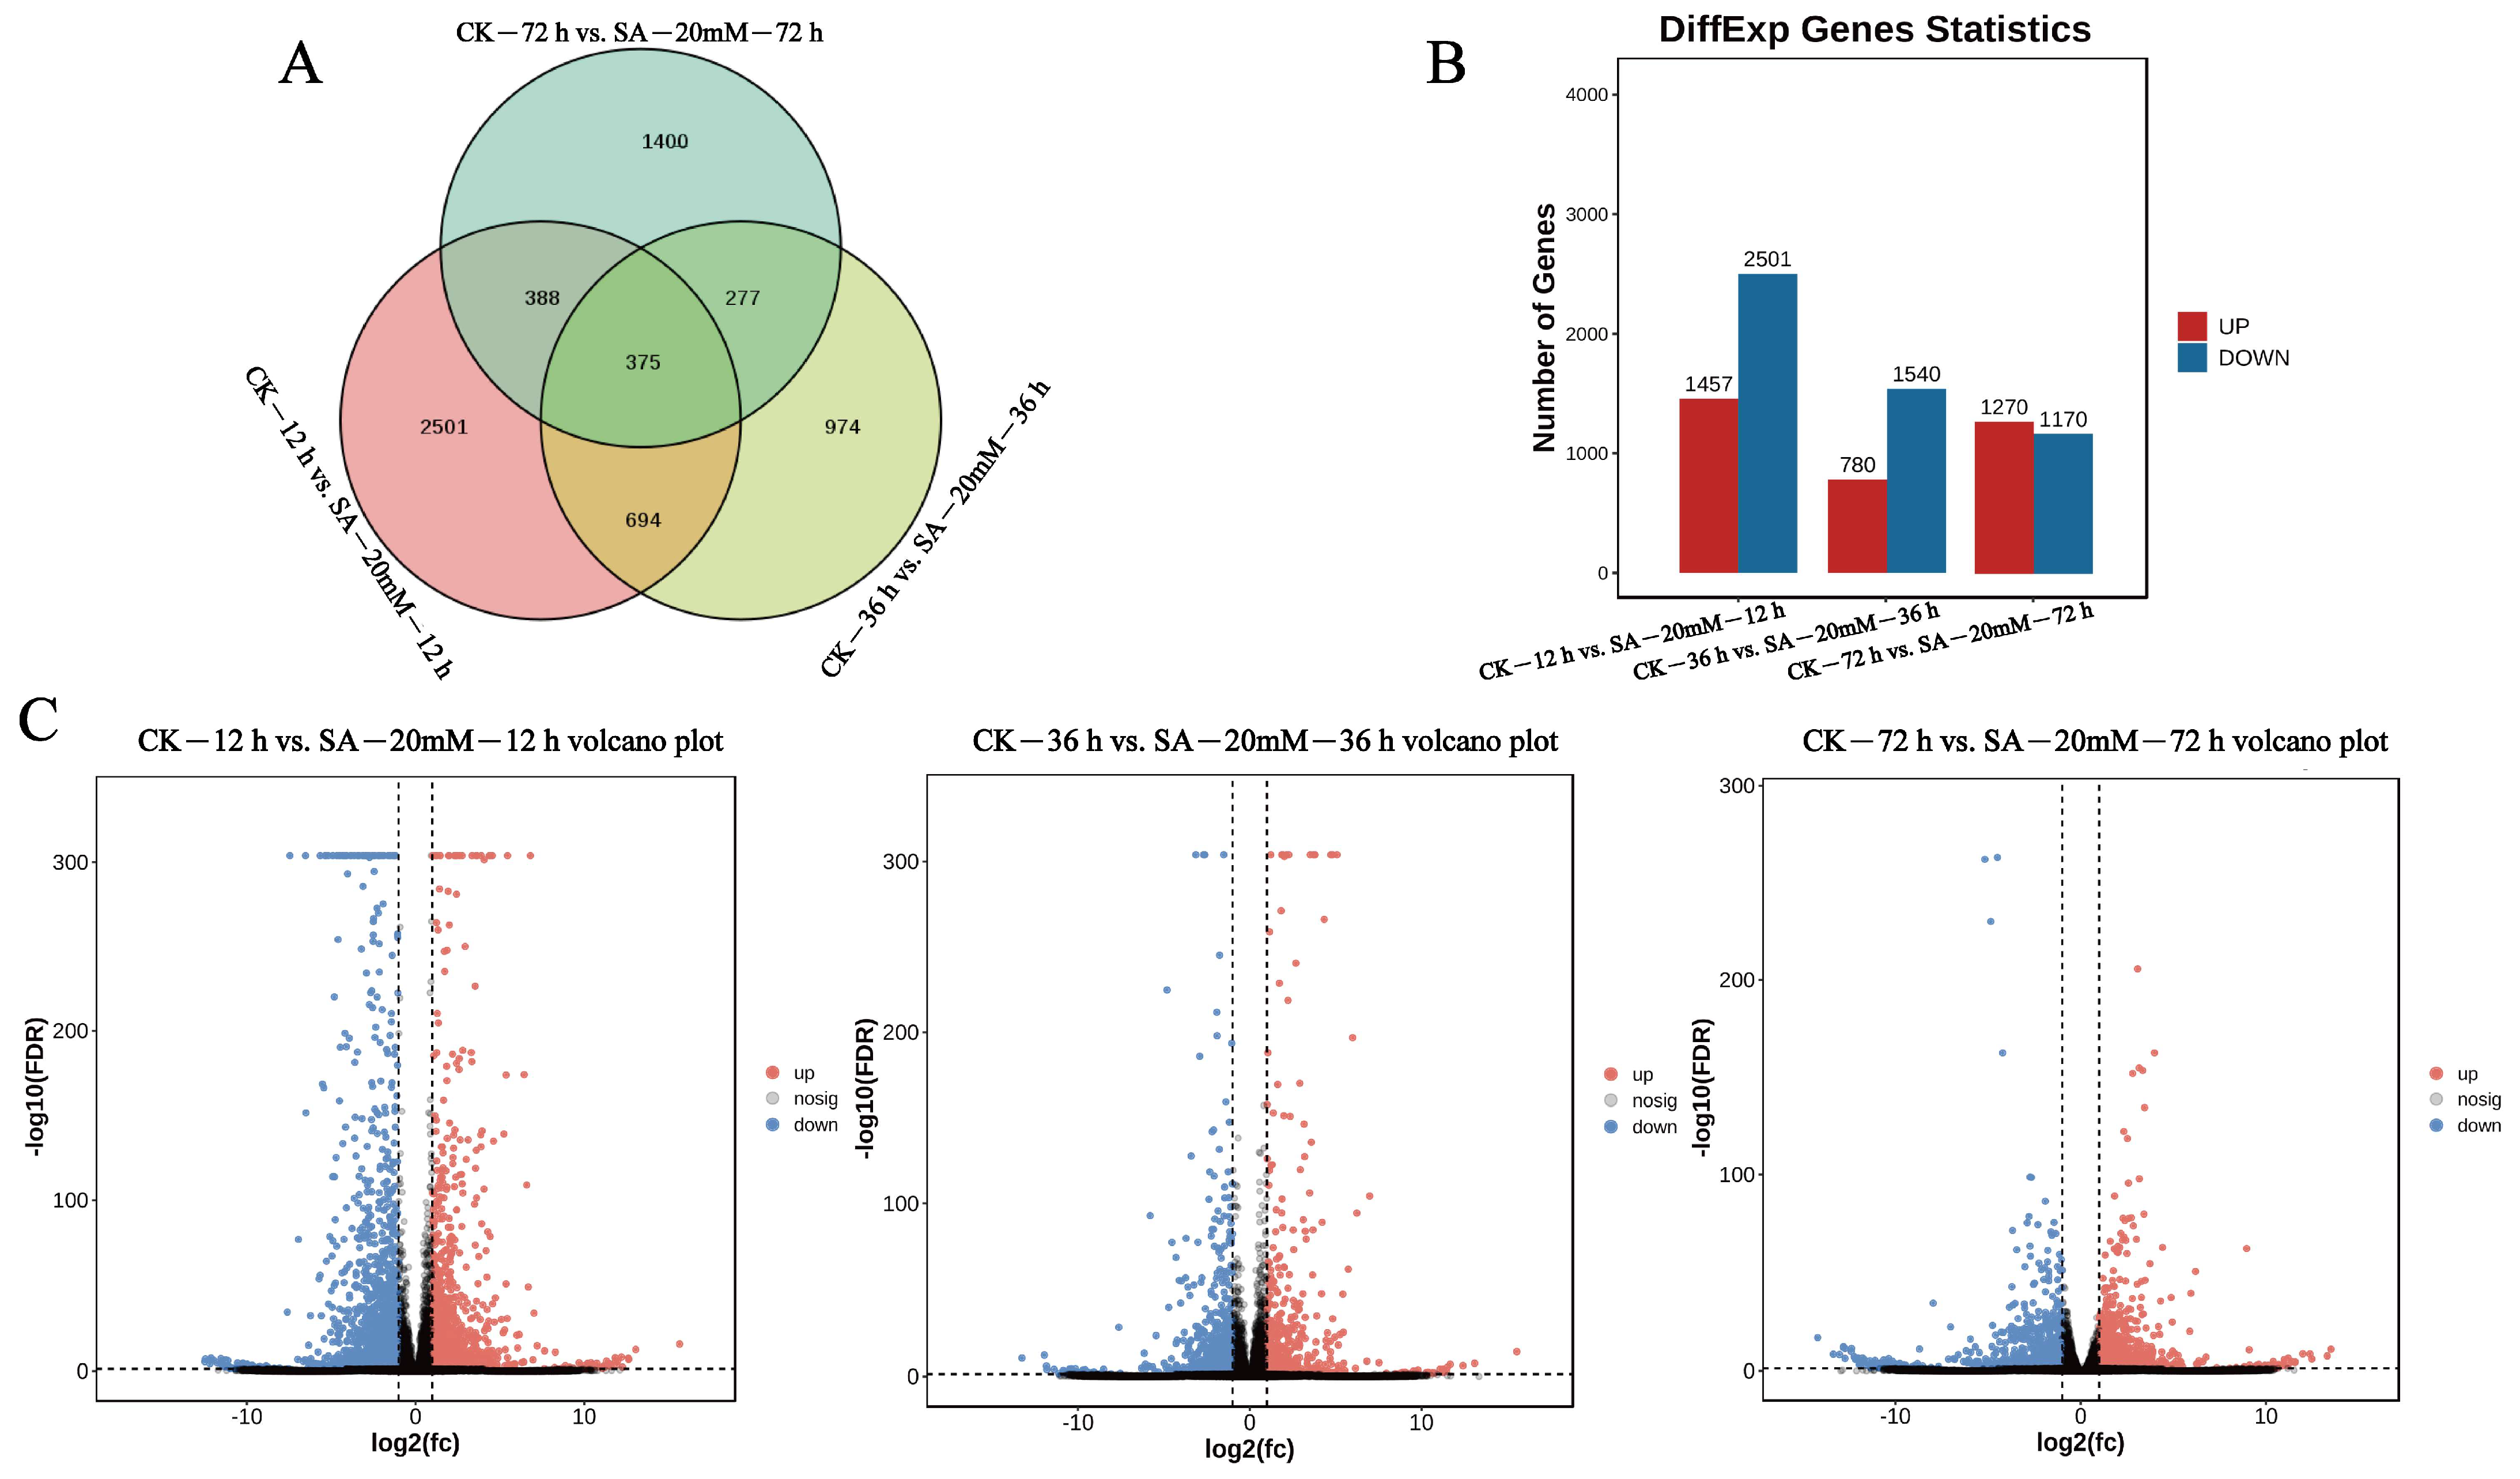
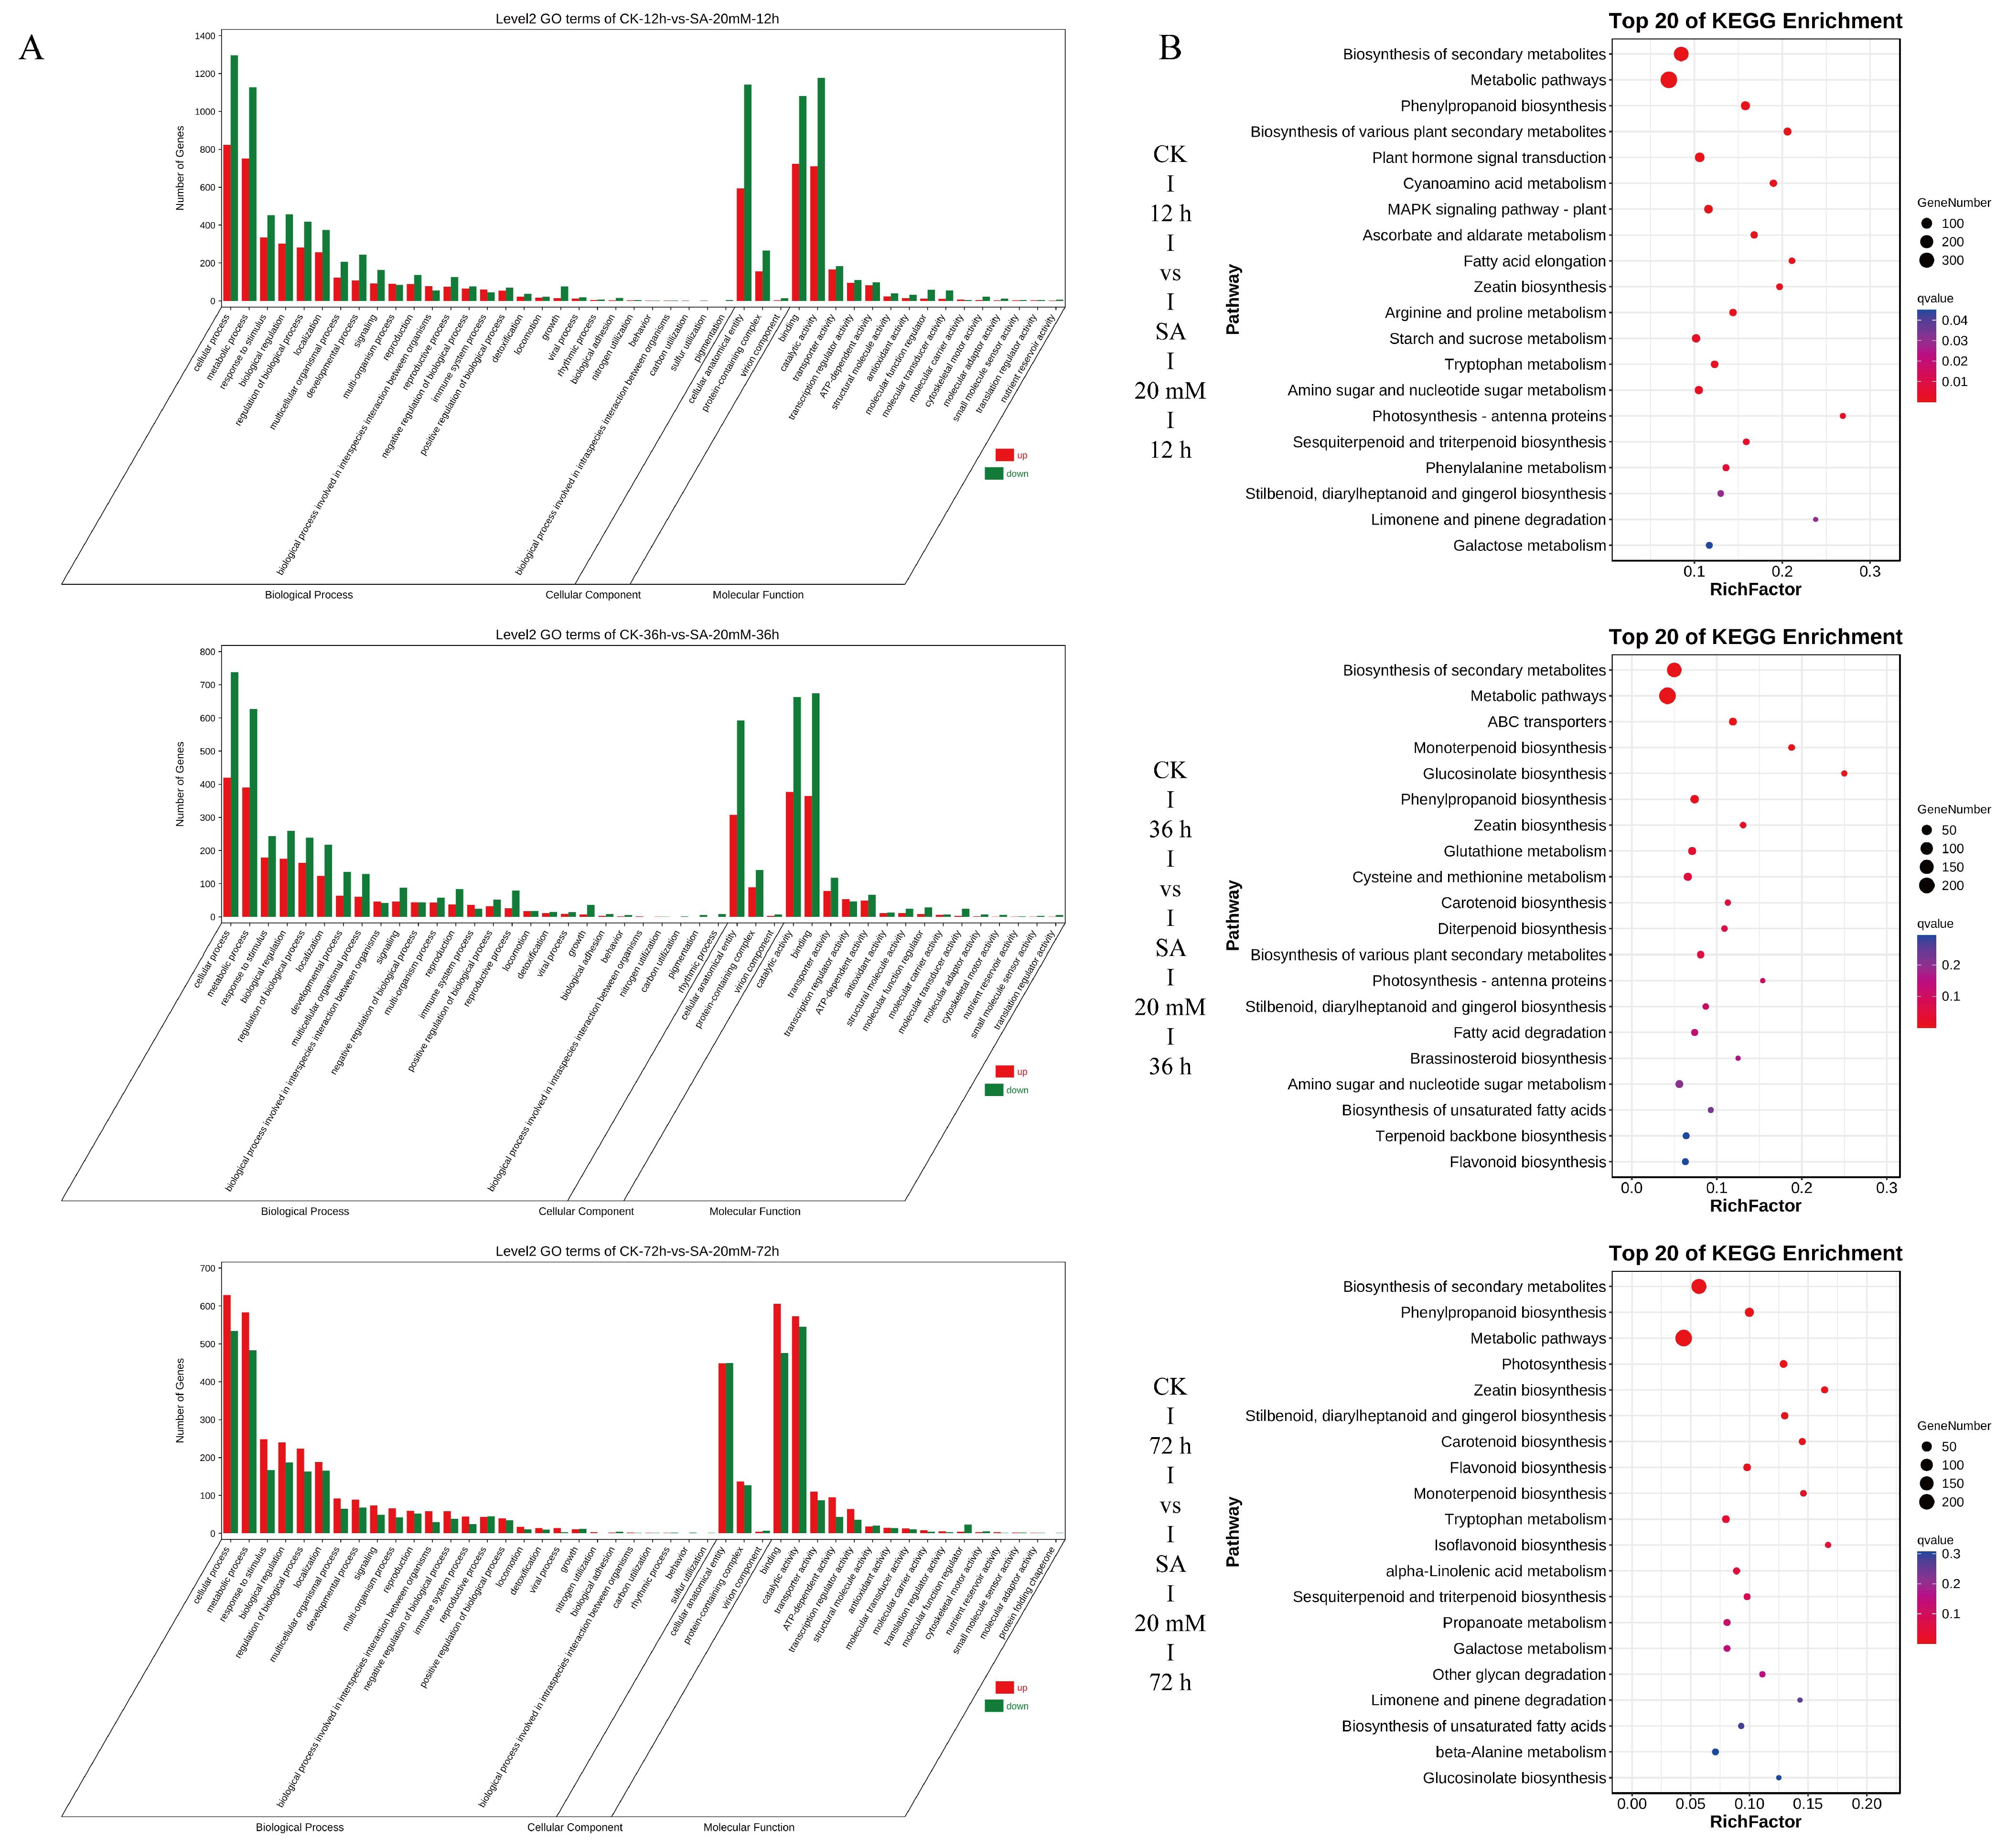
3.4. Differential Gene Identification, GO, and KEGG Enrichment Analysis

Based on the expression of genes in each sample, we analyzed the Pearson correlation coefficient between samples (Figure S2). The result showed that the three biological replicates of the same treatment were close in distance and had a high correlation. In addition, the samples had a certain distance and low correlation between CK and treatment groups. The above results showed that the samples of each treatment in this study were relatively reproducible, and the data obtained were reliable and stable.
A total of 60,038 genes were identified by sequencing. Using FDR < 0.05 and |log2FC| > 1 as the difference screening criteria, significant differentially detected genes in leaves of C. vietnamensis in three pairs of comparison groups were statistically analyzed. In total, 6609 significant differential genes (DEGs) were screened, and 375 DEGs were found at three time points (12 h, 36 h, and 72 h) after SA treatment, and 2501, 974, and 1400 unique DEGs were found in each comparison group, respectively (Figure 3A). Among them, 3958 DEGs were identified in the CK−12 h vs. SA−20 mM−12 h group; 1457 DEGs were up-regulated, and 2501 were down-regulated. There were 2320 DEGs in the CK−36 h vs. SA−20 mM−36 h group; 780 DEGs were up-regulated, and 1540 were down-regulated. A total of 2440 DEGs were analyzed in the CK−72 h vs. SA−20 mM−72 h group; 1270 DEGs were up-regulated, and 1170 were down-regulated (Figure 3B,C).
GO functional annotation and significant enrichment analysis were performed on the identified DEGs (Figure 4A). The results showed that the CK−12 h vs. SA−20 mM−12 h group had the most DEGs related to the biological process, which were mainly enriched in the cellular process (2120 genes), metabolic process (1880 genes), and response to stimulus (787 genes). The DEGs associated with molecular function were mainly enriched in catalytic activity (1888 genes), binding (1806 genes), and transporter activity (350 genes). The DEGs related to cellular components were only enriched into cellular anatomical entities, protein-containing complexes, and virion components. Among the three terms, the cellular anatomical entity had the most DEGs. The GO enrichment of DEGs in the other two treatment groups was similar. The DEGs in the three pairs of comparison groups were highly enriched in biological processes and molecular functions, and only the number of up-regulated DEGs was higher than that of down-regulated genes in the 72 h treatment group. The results showed that SA treatment greatly affected the metabolic process and catalytic activity of C. vietnamensis, and the promotion effect was more obvious at 72 h.
In the KEGG database, 1319, 779, and 833 DEGs were enriched in the CK−12 h vs. SA−20 mM−12 h, CK−36 h vs. SA−20 mM−36 h, and CK−72 h vs. SA−20 mM−72 h groups, respectively. There were 119, 118, and 113 metabolic pathways involved. Figure 4B shows the KEGG enrichment bubble diagram of the first 20 pathways with the lowest Q value. In the 12 h comparison group, DEGs were mainly enriched in metabolic pathways (396 genes), biosynthesis of secondary metabolites (271 genes), and plant hormone signal transduction (62 genes). The DEGs in the 36 h comparison group were mainly enriched in metabolic pathways (235 genes) and biosynthesis of secondary metabolites (158 genes). In addition to the higher enrichment of metabolic and secondary metabolic pathways, phenylpropanoid biosynthesis (31 genes) increased in the 72 h comparison group.

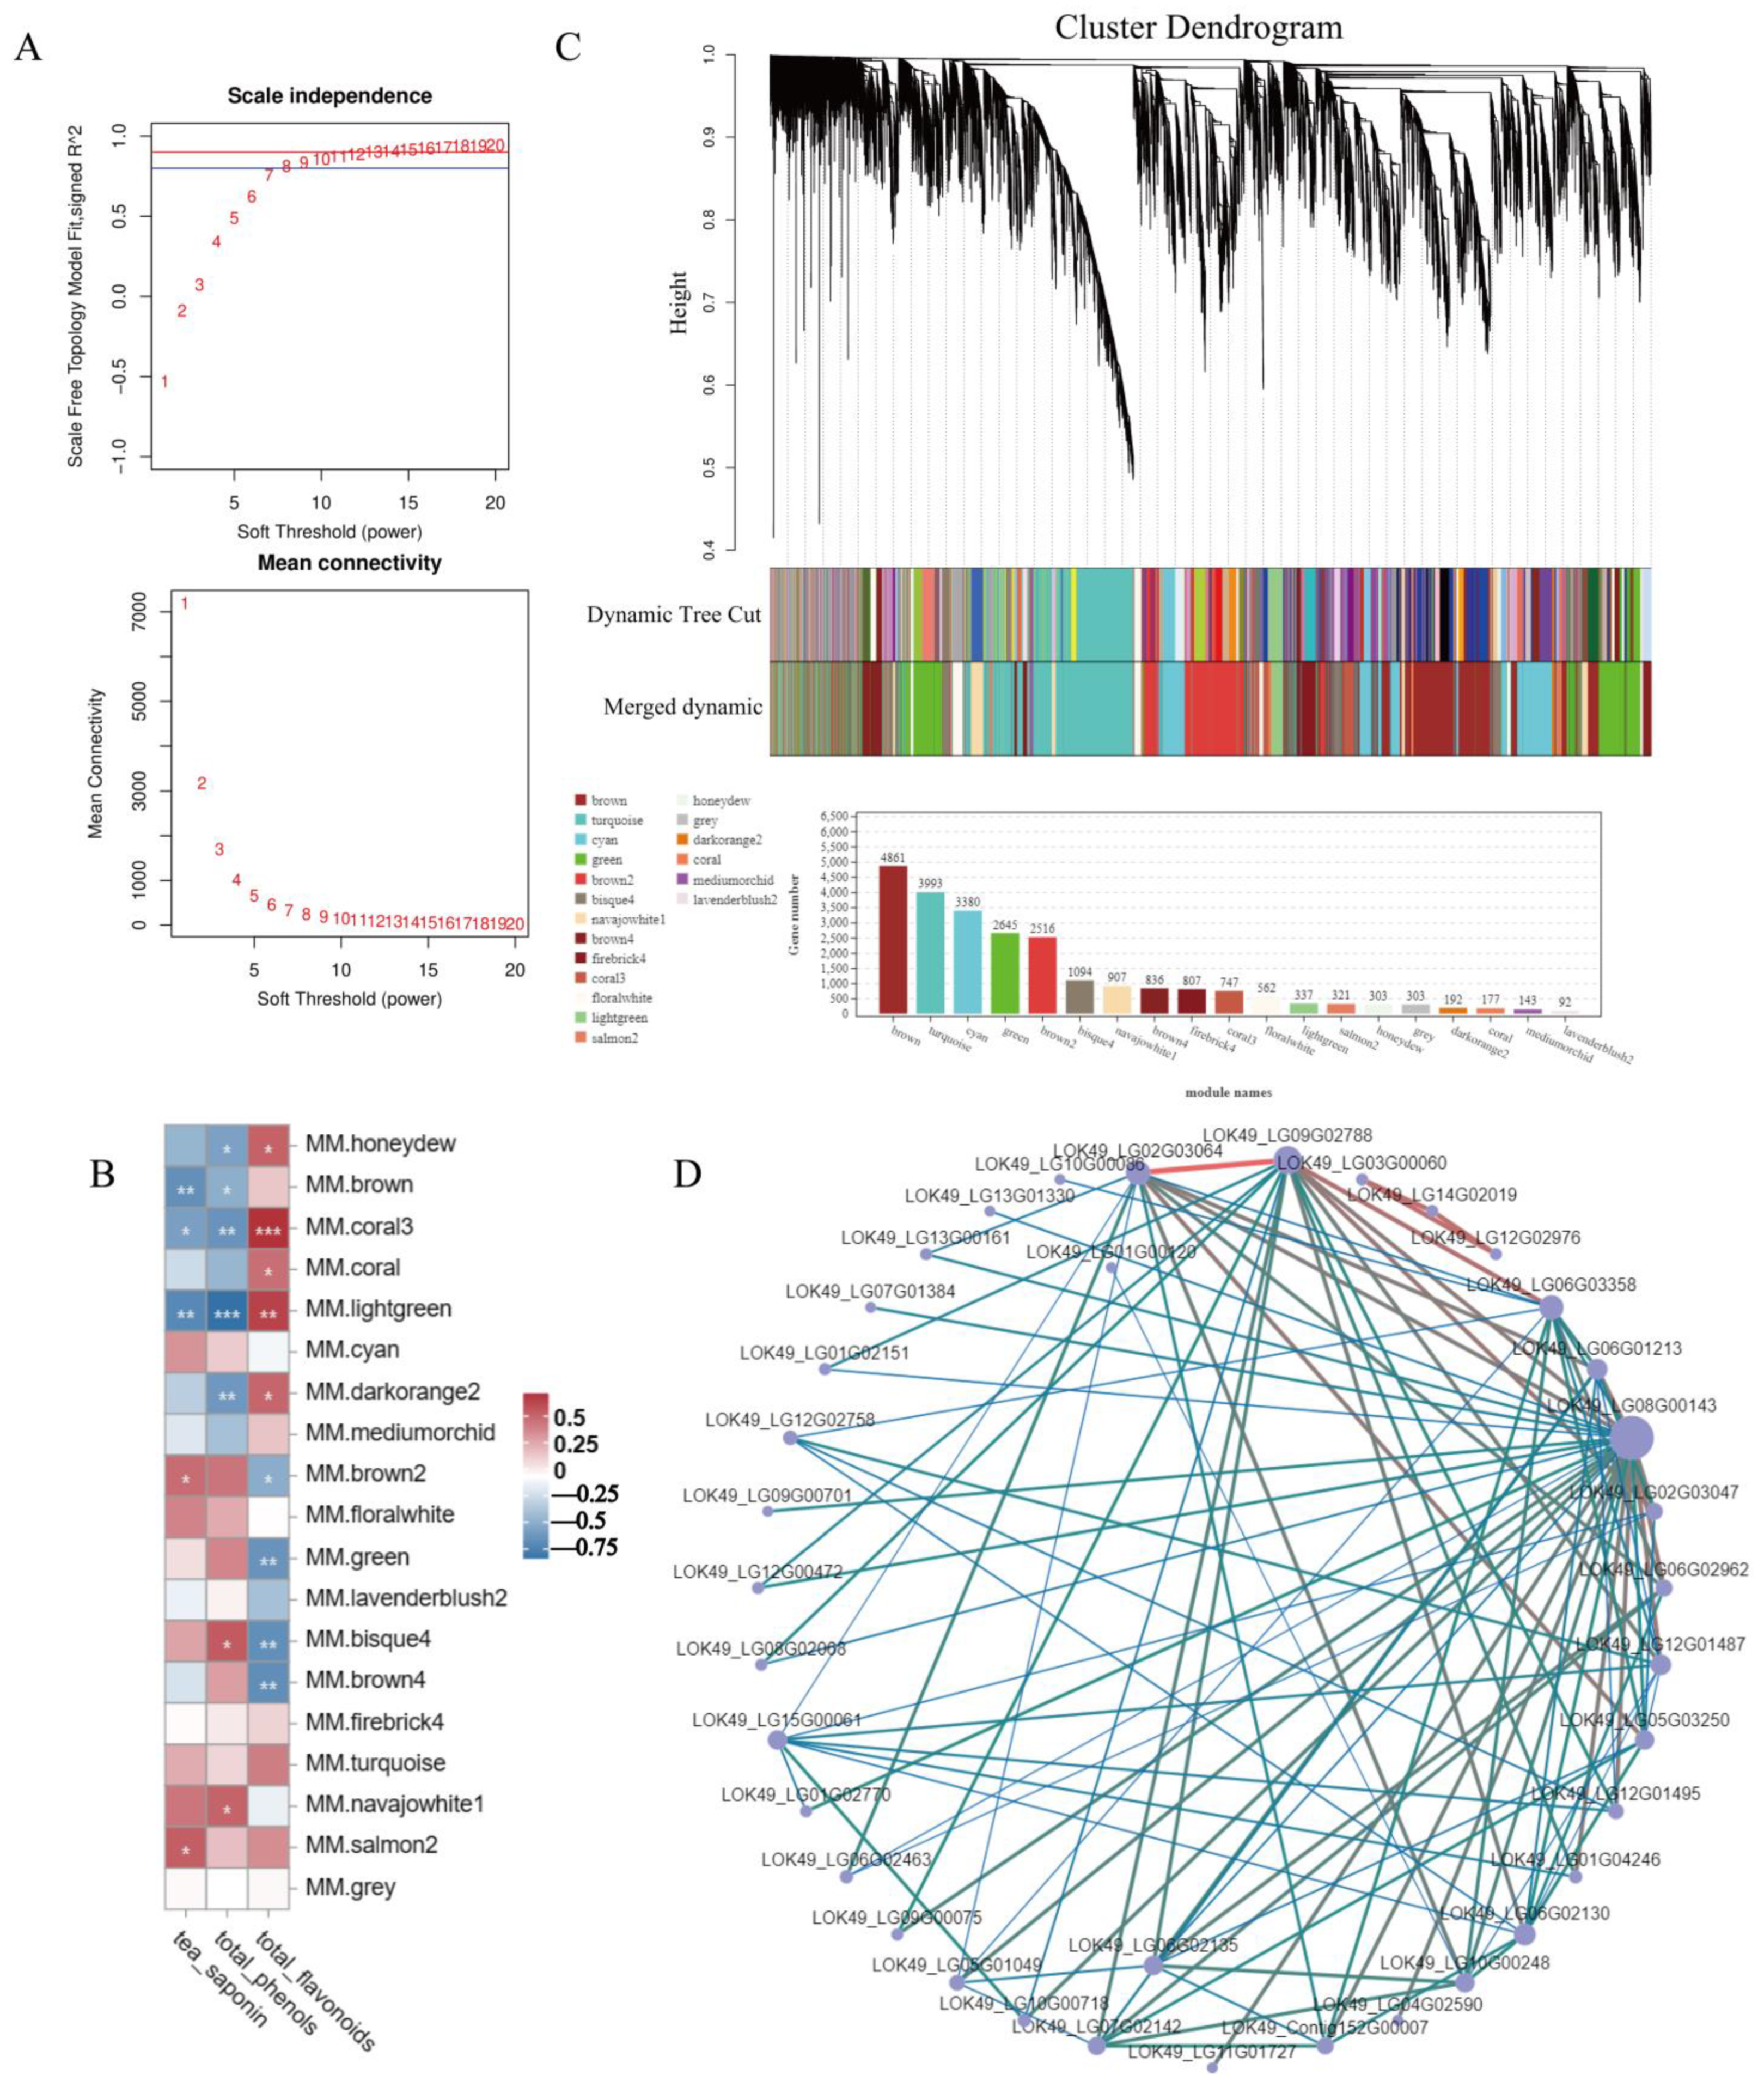
3.5. WGCNA of Transcriptome and Secondary Metabolites

In order to further analyze the molecular mechanism of secondary metabolite synthesis in response to SA, the contents of three indexes (tea saponin, total phenols, and total flavonoids) were used as phenotypic traits and transcriptome data for WGCNA analysis. In total, 24,216 transcripts were screened for power value testing, and the results showed that when the power was greater than 7 and less than 20, the correlation coefficient was higher than 0.8, and the connectivity was good (Figure 5A). In the end, 19 different modules were analyzed (Figure 5B). Based on the content of tea saponin, the results showed that the brown2 module containing 2516 genes was significantly positively correlated with its expression pattern (p-value ≤ 0.05) (Figure 5C), and the expression of this module gene reached its peak at 12 h after SA treatment. In the brown2 module, 633 genes in total were annotated in the KEGG database, and 313 genes were in the metabolic pathway (ko01100). There were 196 genes in the secondary metabolic biosynthesis pathway (ko01110) and 41 genes involved in plant hormone signaling (ko04075). In addition, genes 1, 6, 20, and 27 are annotated as HMGCR, CPR, CYP450, and UGT in this module, respectively. LOK49_LG07G02033 and LOK49_LG11G00840, both of which belong to the CYP72 family, were shown as likely to be related to the synthesis of tea saponin. It was also noted that there were one and five genes in the UGT73 and UGT74 families, respectively, and all of the above genes were shown likely to actively respond to the SA signaling-mediated tea saponin biosynthesis pathway.
In order to further explore the key genes in the brown2 module, it was found that among the top 100 gene relationship pairs with connectivity, LOK49_LG02G03064 and LOK49_LG09G02788 had the strongest connectivity (Figure 5D). In addition, the gene in the relationship pair also contained two genes annotated as glycosyltransferase (LOK49_LG06G02130 and LOK49_LG06G02135), which belong to the UGT74 family.

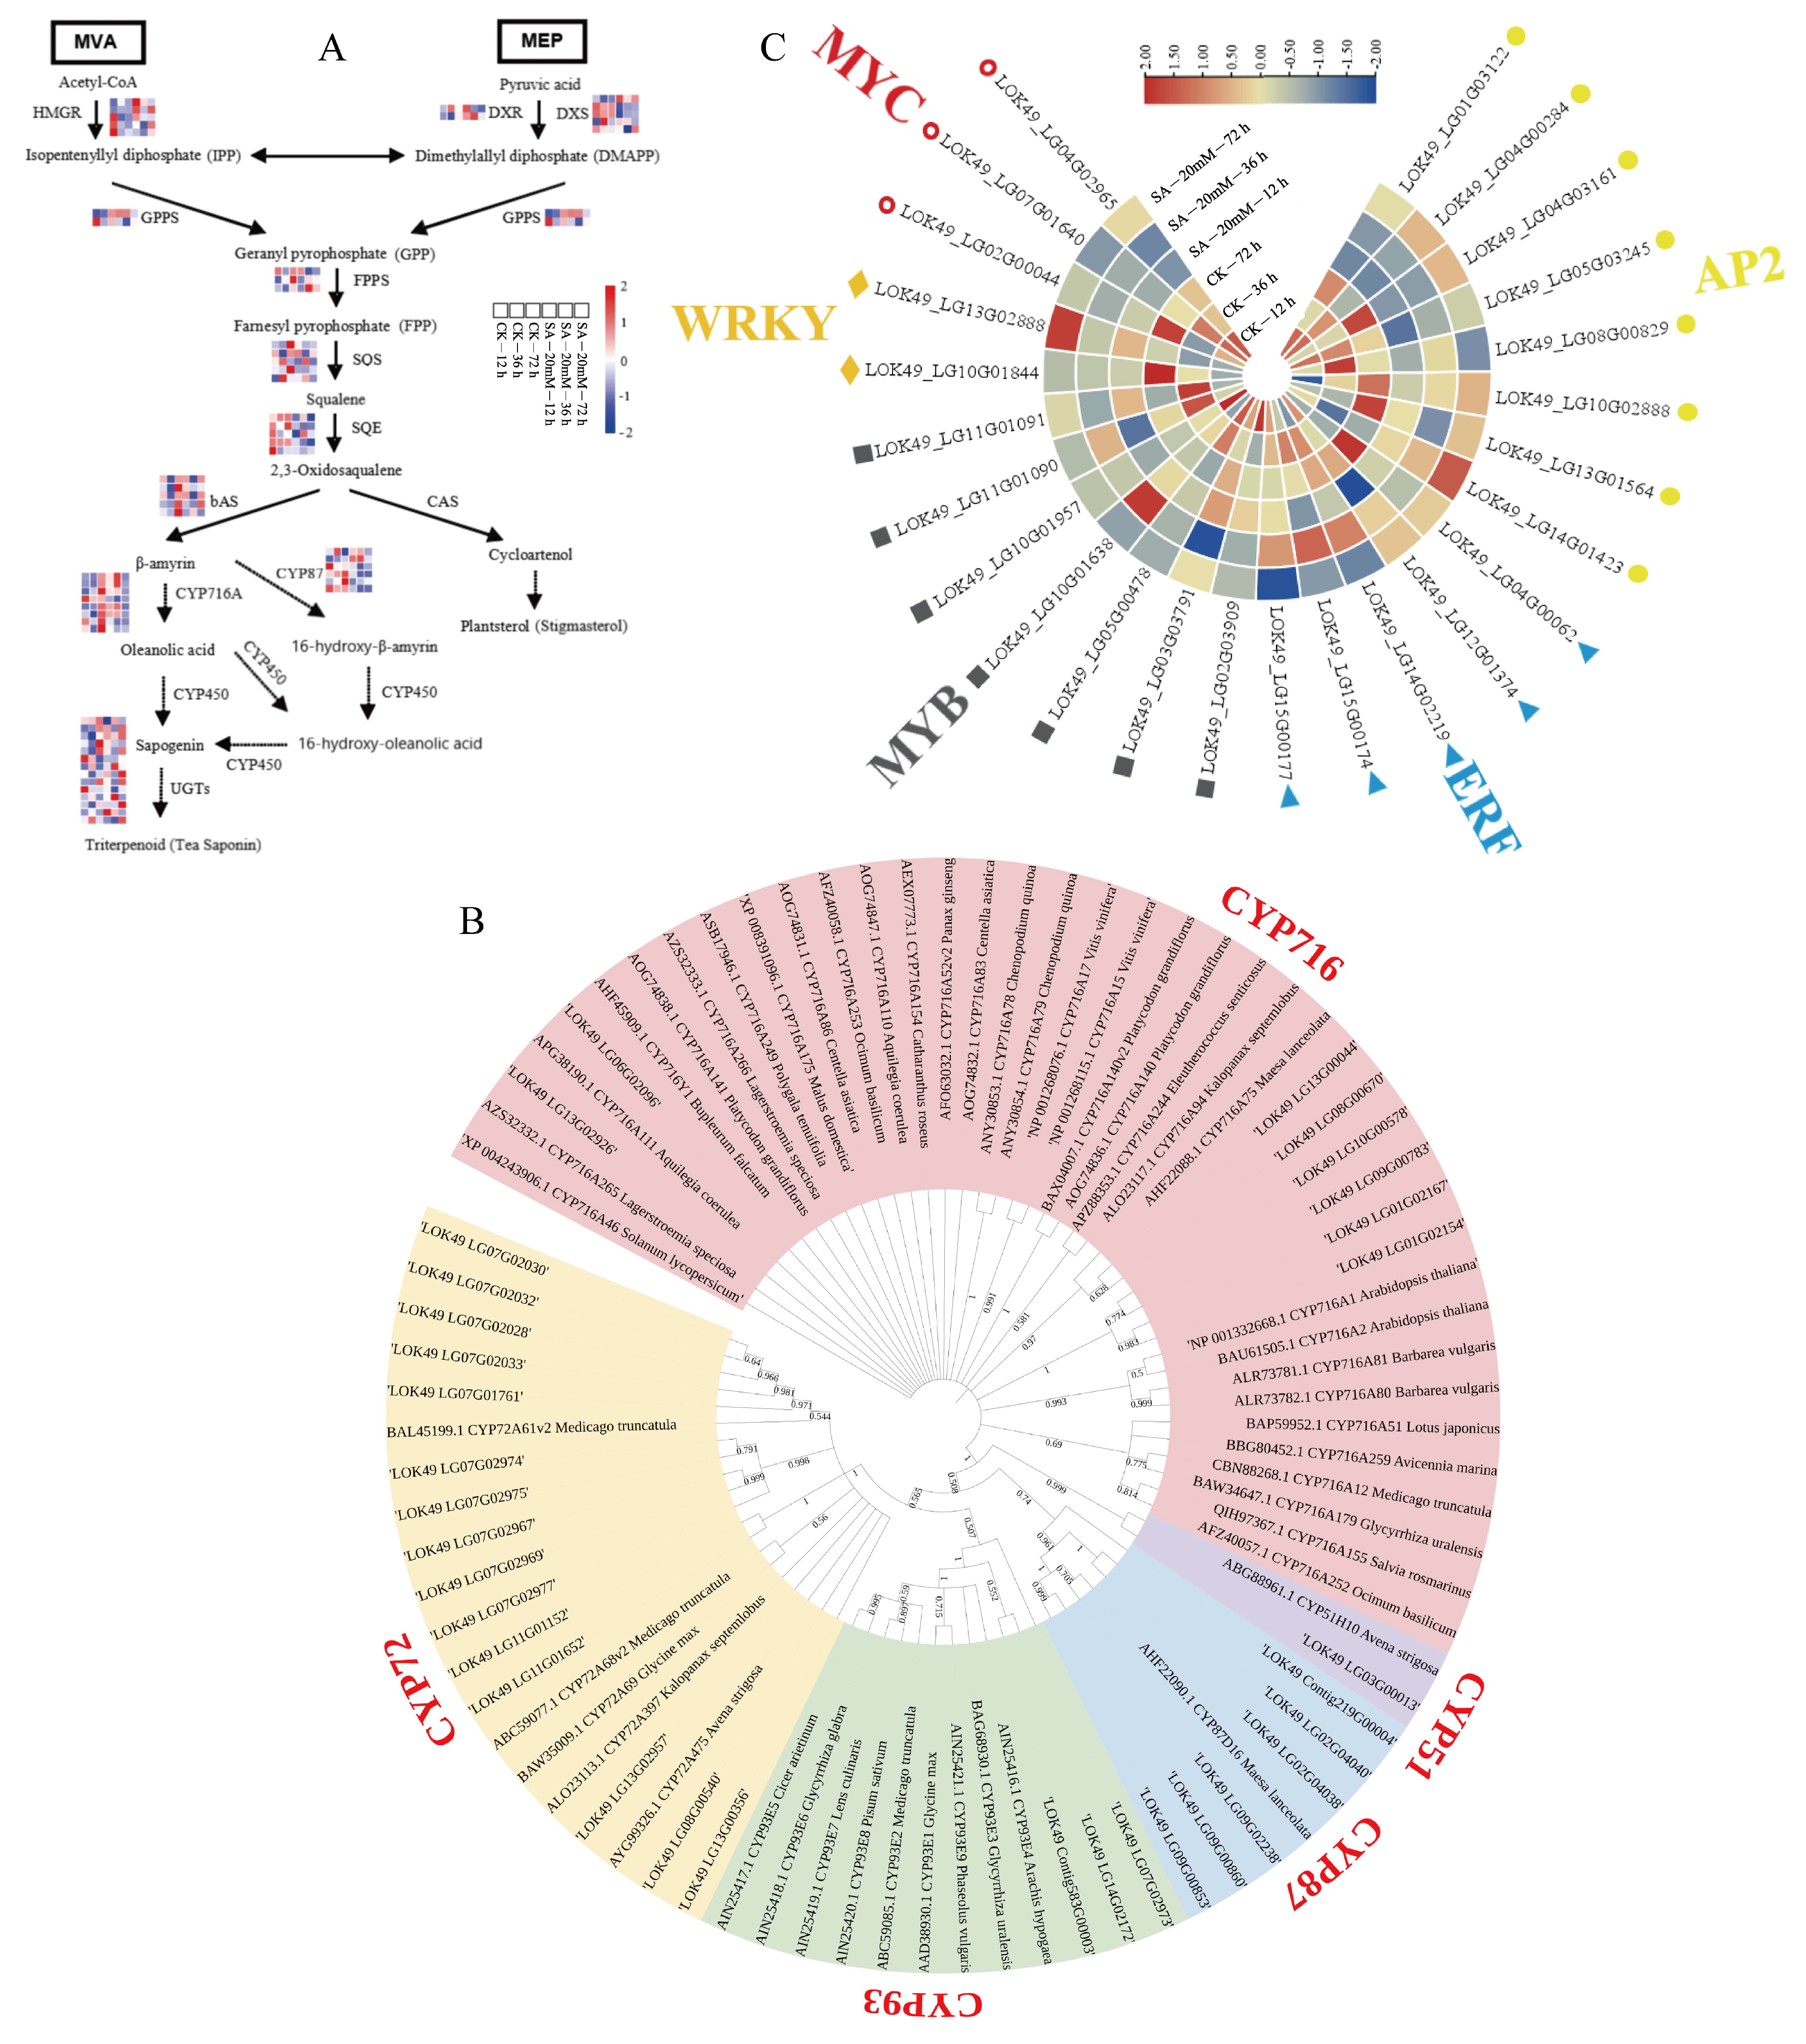
3.6. Analysis of the Synthesis Pathway of Tea Saponin from C. vietnamensis and Identification of Related CYP450

Based on the known triterpenoid saponin synthesis pathways in plants, the heat map of the tea saponin pathway and structural gene of C. vietnamensis was constructed by comparing the relevant structural genes annotated in the transcriptome data (Figure 6A). HMGCR, SQS, SQE, and bAS are the key enzyme genes in the middle and upper reaches of the triterpenoid skeleton, while CYP450 and UGT are the key enzyme genes in the downstream pathway of tea saponin biosynthesis. The transcripts in the figure are the genes with high expression and differences that were selected according to the annotation results (Table S4).
Based on CYP450 gene sequences related to triterpenoid saponin synthesis and verified function in other plants, the local blast screening of CYP450 gene fragments with identity greater than 40 was analyzed, and 144 CYP450 genes in total were screened. For further screening, 33 CYP450 with high expression levels and differences and 49 downloaded amino acid sequences of CYP450 associated with triterpene saponin synthesis were used for cluster analysis, and the phylogenetic tree was constructed by adjacency method (Figure 6B). The results showed that eight genes were clustered with the CYP716 family, one gene was clustered with the CYP51 family, six genes were clustered with the CYP87 family, three genes were clustered with the CYP93 family, and fifteen genes were clustered with the CYP72 family. LOK49_LG09G00783 (CYP716−1) was closest to CYP716A75 in Maesa lanceolata and may act on saponin C28, and the expression level of this gene increases after 12 h of SA treatment, which is 5.02 times higher than that of CK. LOK49_LG06G02096 (CYP716−2) was closely related to CYP716A111 in Aquilegia coerulea and CYP716Y1 in Bupleurum smithii, which may be related to the oxidation of saponin C16. In addition, LOK49_LG02G04038 (CYP87−1) and LOK49_LG02G04040 (CYP87−2) were clustered together with CYP87D16 in M. lanceolata, which might also be related to the oxidation of saponin C16. The expression levels of these two genes increased to varying degrees after SA treatment for 12 h and 72 h. LOK49_LG07G01761 (CYP72−1) and LOK49_LG07G02033 (CYP72−3) were the closest to CYP72A61v2 of Medicago truncatula, which might be related to the oxidation of saponin C22, and their expression levels also increased after 12 h and 72 h of SA treatment. The variation of tea saponin content after SA treatment was consistent with that after SA treatment. Combined with the clustering results, it could be inferred that the above genes may be involved in the biosynthesis of tea saponin in C. vietnamensis.

3.7. Screening of Transcription Factor (TF) Associated with Tea Saponin Synthesis in C. vietnamensis

The expression of structural genes in the pathway of terpenoids synthesis is often regulated by transcription factors (TF) such as bHLH, MYB, WRKY, bZIP, and AP2/ERF. Especially after induction by hormones (such as salicylic acid), TF expression is affected, thus regulating gene expression and influencing the synthesis of secondary metabolites. Therefore, it is important to identify and analyze the TF associated with tea saponin in transcriptome data. The TF amino acid sequences associated with triterpenoid saponin synthesis in other species were used to construct phylogenetic trees with TF with non-zero expression in transcriptome data (Figure S3). The result showed that TFs of eight AP2, five ERF, seven MYB, two WRKY, and three MYC families were screened in the transcriptome data, and TFs associated with triterpene synthesis were clustered together (Figure 6C). The expression levels of two TFs belonging to the WRKY family increased at 12 h after SA treatment, among which LOK49_LG13G02888 was grouped with PgWRKY1 and PqWRKY1, and their expression levels increased significantly at 12 h and 72 h after SA treatment (Figure 6Cand Figure S2). It was suggested that the transcription factor might be related to the synthesis pathway of tea saponin. There were two AP2s (LOK49_LG10G02888 and LOK49_LG13G01564) that had increased expression levels after 12 h, and two AP2s (LOK49_LG04G00284 and LOK49_LG14G01423) had increased expression levels after 72 h. Some transcription factors related to triterpene synthesis were also found in the MYB family of C. vietnamensis, among which the expression of LOK49_LG11G01091 increased after treatment for 12 and 72 h. LOK49_LG03G03791 and LOK49_LG10G01638 had an upward trend at 12 h, and LOK49_LG05G00478 had an upward trend at 72 h only. In the ERF family, the expression levels of two TFs (LOK49_LG04G00062 and LOK49_LG14G02219) increased after treatment for 12 h, which may also show involvement in the synthesis of tea saponin in C. vietnamensis.

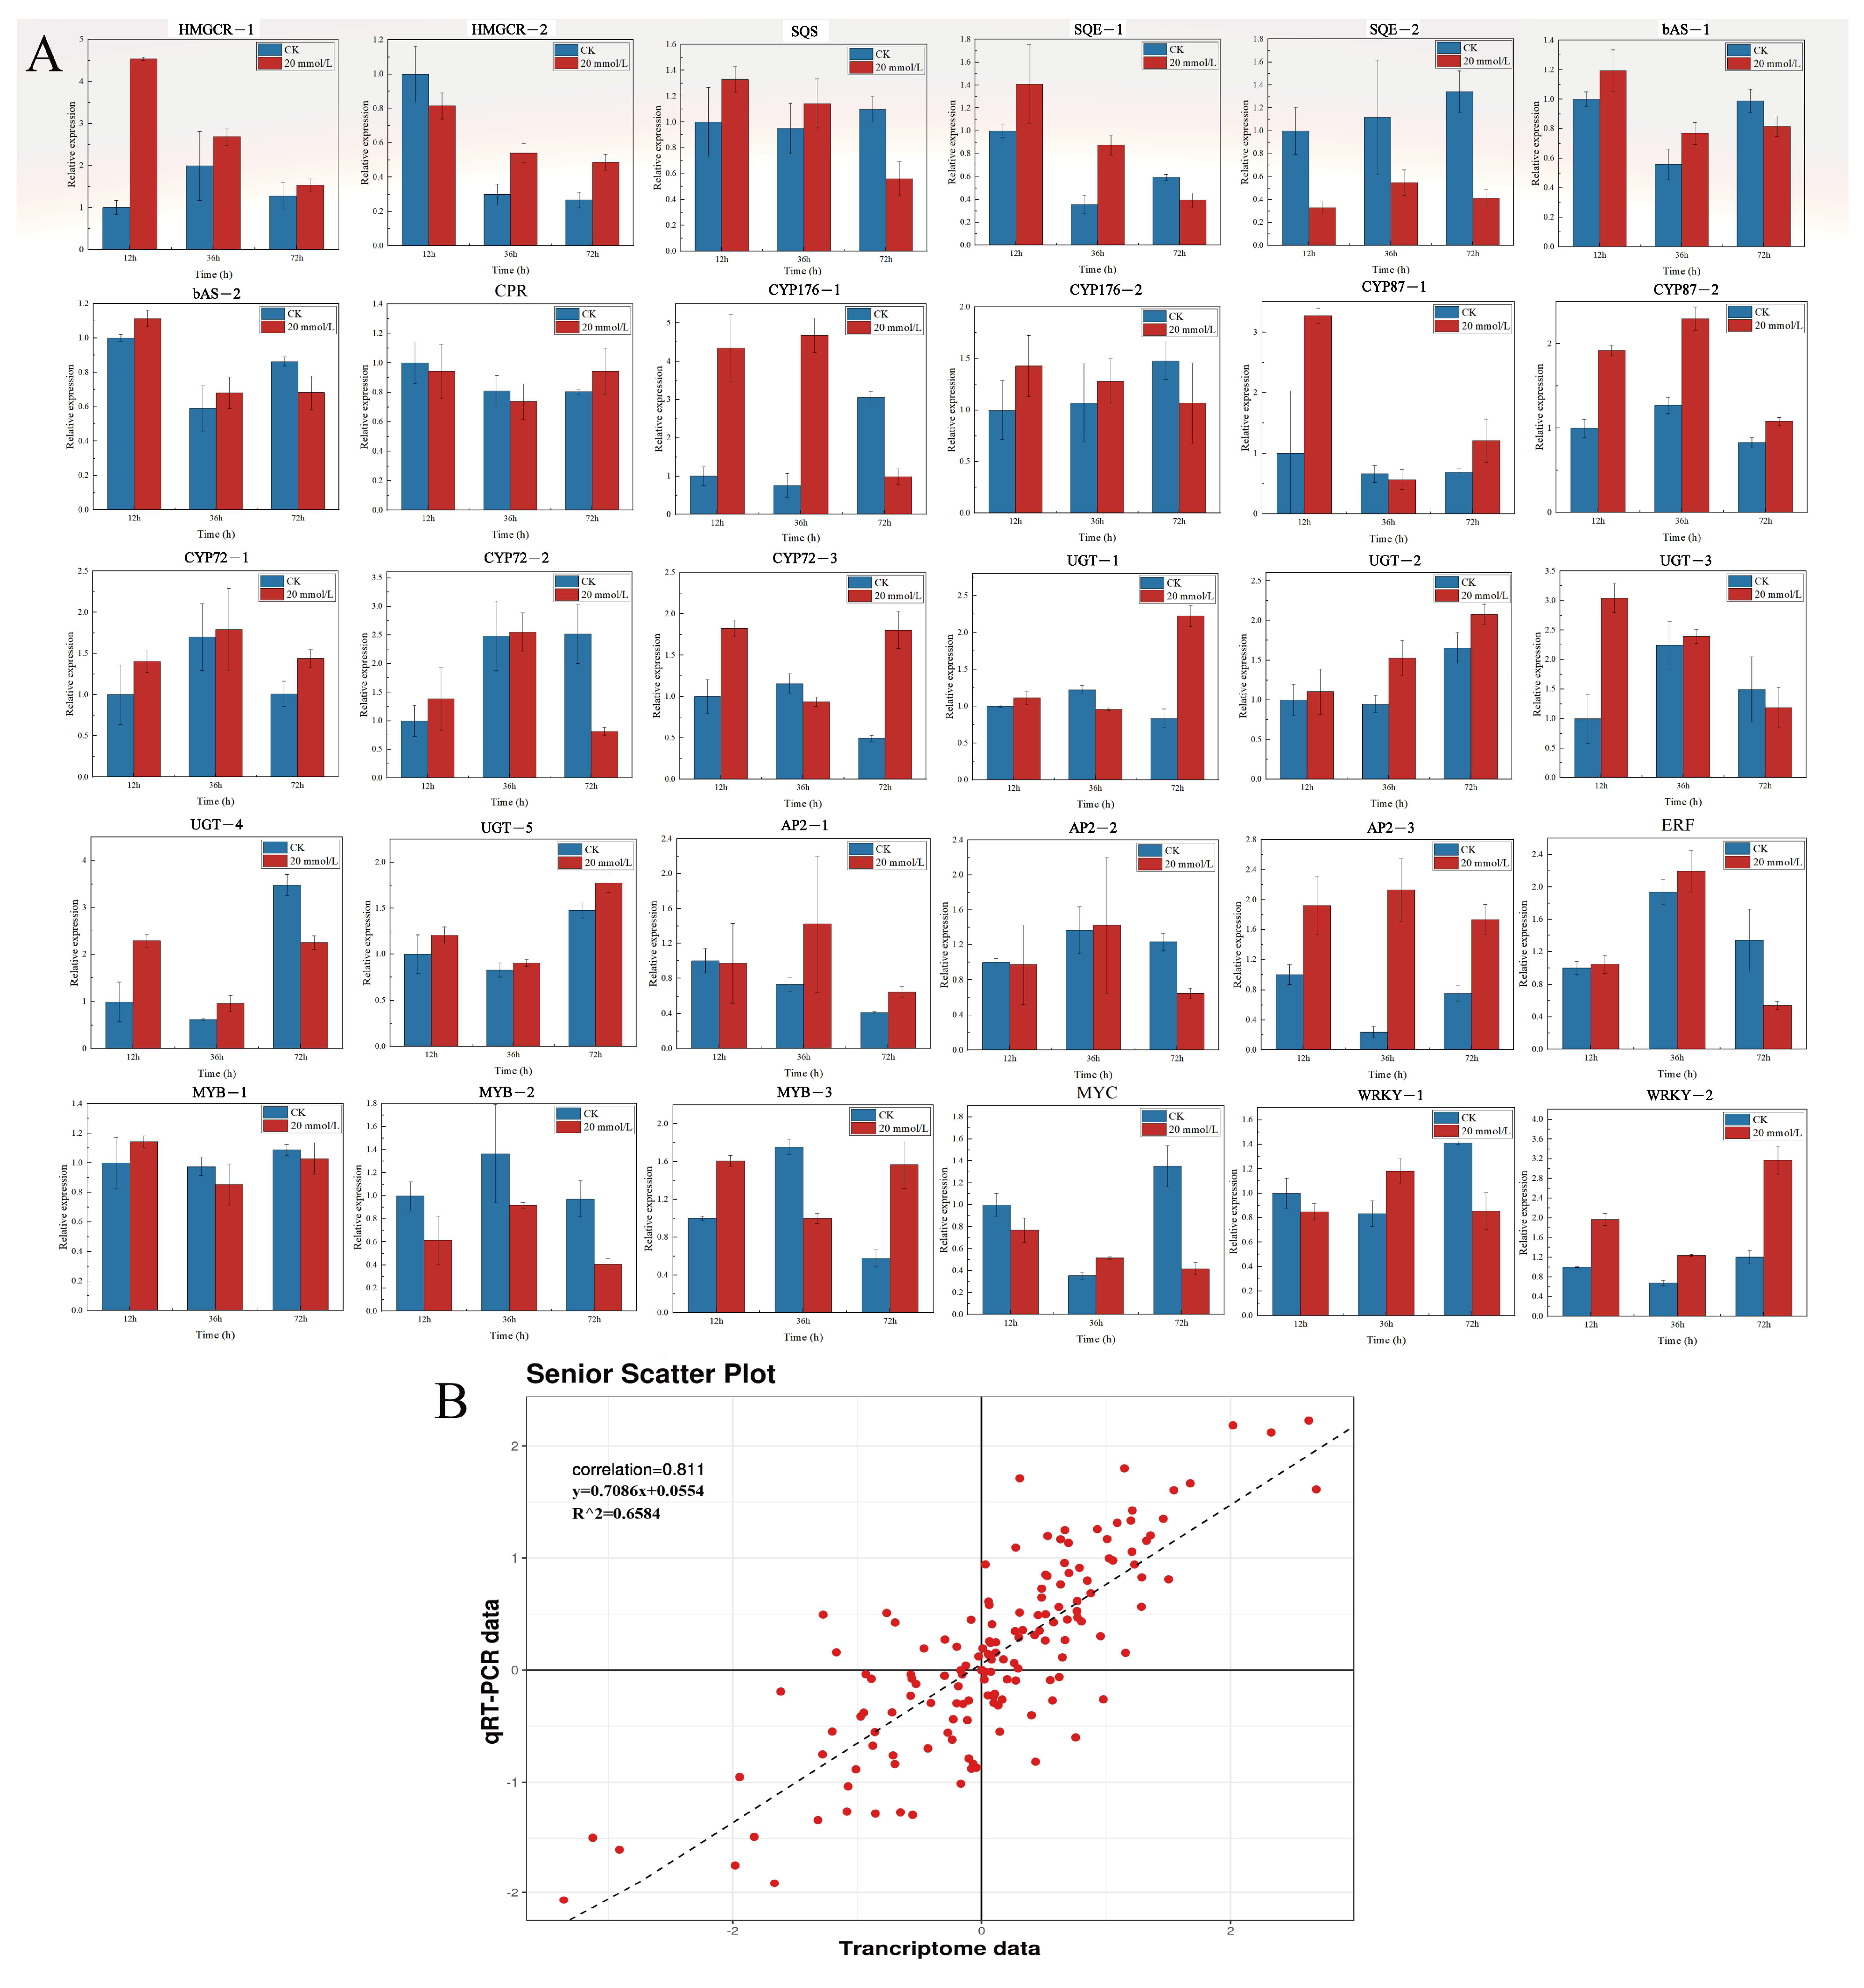
3.8. Correlation Analysis of RT-qPCR and Transcriptome

In order to verify the reliability of RNA-seq data, based on the above analysis results, 20 key structural genes (including HMGCR, SQS, SQE, bAS, CPR, CYP450, and UGT) and 10 TFs in the tea saponin biosynthesis pathway in C. vietnamensis were screened for RT-qPCR verification. The expression pattern was consistent with RNA-seq results (Figure 7A). The correlation coefficient between the transcriptome data calculated by the Pearson method and RT-qPCR was 0.811 (Figure 7B), indicating that the transcriptome data were accurate.

4. Discussion

4.1. Analysis of Secondary Metabolic Components and Physiological Activity Response to SA in C. vietnamensis

SA can not only cause a variety of physiological reactions in plants by activating plant defense systems such as improving plant stress resistance, activating plant signal transduction, and related gene expression, but it can also induce the synthesis and accumulation of some secondary metabolites [8,32] such as triterpenoid saponin [9,22], flavonoids [33], and terpene lactones [24]. The study found that exogenous application of SA could promote the accumulation of saponins in Polygala tenuifolia root [23] and induce the biosynthesis of saponins in ginseng suspension cells [34]. This study showed that different secondary metabolites in the leaves of C. vietnamensis had different responses to SA, but in general, low-concentration treatment inhibited the accumulation of tea saponin and total phenols, while high-concentration treatment induced their biosynthesis. For example, the tea saponin content in the 20 mM SA treatment group was higher than CK at 6 h, 12 h, 48 h, and 72 h, and the total phenols content was higher than CK at 2 h, 12 h, 18 h, and 72 h. This was similar to the study results of Tajik et al. [35] on SA-induced phenols in Crocus sativus L. However, the biosynthesis effects of different SA concentrations on plant secondary metabolites were different. For example, Su et al. [9] found that 5 mg·L−1 SA promoted the accumulation of saponins within 5 days, while higher concentrations inhibited their biosynthesis. The results of this study were different, which might be due to the difference in sensitivity of different plants to SA.
ROS levels may be out of balance and even soar in plants treated with exogenous inducers. At this point, the plant cell can enable its antioxidant enzyme system, through the SOD, POD, CAT, and APX synergy, to clear excess free radicals and prevent plants from being seriously damaged in harsh environments [36]. The increase in SOD activity is related to plant stress resistance, which can decompose O2 into H2O2 to improve the stress resistance. POD also plays an integral role in ROS removal. APX and CAT can eliminate the accumulation of H2O2 in plants to balance the ROS system in plants. MDA is the product of membrane peroxidation and can reflect the peroxidation degree of lipids in plant cell membranes [37,38]. Naz et al. [32] found that the activities of SOD, CAT, POD, and APX increased after high-concentration SA treatment in Pisum sativum. In this study, it was found that a low concentration of SA (4 mM) reduced MDA content and O2 production rate and enhanced SOD activity in a certain period of time, while a high concentration of SA (20 mM) promoted the accumulation of MDA and H2O2 and reduced SOD activity (12 h), indicating that a high concentration of SA causes certain damage to the cell membrane of C. vietnamensis leaves. The results were similar to those of Wang et al. [39] in their study of Blumea balsamifera. However, for other antioxidant enzymes (POD, CAT, and APX), both low- and high-concentration treatments can improve their activity to varying degrees since POD and APX have the highest activity at 36 h after SA treatment, while CAT has the highest activity at 24 h after treatment. Therefore, it was speculated that SA-induced antioxidant effects and response mechanisms are based on the concentration of SA and species.

4.2. Candidate Structural Genes Involved in Theasaponins Pathway in C. vietnamensis

In this study, the biosynthesis mechanism of tea saponin in C. vietnamensis was analyzed, and the terpenoids synthesis pathway was studied (Figure S1). There were 49 genes putatively involved in sapogenin biosynthesis, and 54 saponins were identified by transcriptome and metabolome analysis [40]. In the previous study, we also identified some genes (such as SQS) related to the biosynthesis of tea saponins in C. vietnamensis [1]. Significant differentially expressed genes in the terpenoid backbone biosynthesis pathway were mainly HMGS, HMGR, PMK, MVD, FPS, and GGPS, with an increase in SA processing time in this study, and most of the gene expression quantities increased gradually. The results were similar to those of Su et al. [9] in treating Psammosilene tunicoides with SA. The gene expression levels of two transcripts annotated as HMGR (LOK49_LG05G03940 and LOK49_LG08G00037) increased at 72 h and were 2.82−fold and 1.44−fold higher than that of CK, respectively, which was consistent with the changing trend of tea saponin content after SA treatment. In addition, the analysis of differential genes among treatments showed that the key genes enriched in the triterpenes biosynthesis pathway were SQS, SQE, and bAS, among which SQE increased most significantly in SA treatment at 36 h, which was 2.18−fold that of CK. In other species, it has also been found that SA supplementation could induce gene expression through the terpenoids’ synthesis pathway. For instance, in Phyllostachys heterocycla, SA significantly increased the accumulation of triterpenoid saponins and promoted the expression levels of AACT, DXS, SE, and CYP72A [9]. These data suggest that SA could affect the expression of related genes in the terpenoids synthesis pathway and induce the accumulation of more triterpenes in plants.

4.3. TFs Involved in Theasaponins Biosynthesis of C. vietnamensis

The SA-induced regulation of transcription factors is one of the important mechanisms affecting triterpenoid saponin biosynthesis [8]. Yao et al. [41] identified several MYBs that might participate in the ginsenoside synthesis pathway. In addition, the interaction between PgWRKY4X and PgSE was verified by protein interaction experiments. The study of SA-treated Betula platyphylla found that both BpMYB21 and BpMYB61 could specifically activate the SQE promoter and then affect the synthesis of triterpenes by regulating the expression of SQS and SQE [42]. In this study, the TFs of MYB, WRKY, ERF, AP2, and MYC families were screened through cluster analysis, and it was speculated that they might be involved in regulating the expression of related structural genes in the synthesis pathway of tea saponin in C. vietnamensis, thus affecting the content of tea saponin. For example, the expression level of LOK49_LG13G02888 (WRKY) significantly increased after SA treatment for 12 h and 72 h, which was consistent with the change in tea saponin content, and the clustering results showed that it was clustered with PgWRKY1 and PqWRKY1. It was speculated that LOK49_LG13G02888 (WRKY) may be a transcription factor regulating structural gene expression in the tea saponin synthesis pathway of C. vietnamensis in response to the SA signal. The specific regulatory mode needs further verification and analysis.
According to the above results, we know that different concentrations of SA treatment can affect the content of tea saponin in the leaves of C. vietnamensis, which provides data support and a theoretical basis for our study on the mechanism of tea saponin biosynthesis and lays a foundation for the synthesis and application of tea saponin.

5. Conclusions

In summary, based on the combined analysis of metabolomics and transcriptomics, the molecular mechanism of tea saponin metabolism in C. vietnamensis under SA treatment was studied. The results showed that SA treatment could increase the contents of tea saponin and total phenols in C. vietnamensis leaves and effectively promote the activities of SOD, POD, CAT, and APX in C. vietnamensis leaves. WGCNA analysis was used to screen multiple structural genes (such as SS, SQE, bAS, CYP450, and UGT) and transcription factors (such as WRKY, AP2, ERF, and MYB) related to tea saponin synthesis. The results of this study could lay a foundation for the functional verification of tea-saponin-related structural genes and elucidate the molecular mechanism of tea saponin biosynthesis in C. vietnamensis, therefore having great significance for the efficient synthesis of tea saponin and novel saponin compounds.

6. Patents

This section is not mandatory but may be added if there are patents resulting from the work reported in this manuscript.

Supplementary Materials

The following supporting information can be downloaded at: https://www.mdpi.com/article/10.3390/horticulturae10010008/s1, Figure S1: Frame diagram of tea saponin synthesis Figure S2: Correlation heat map; Figure S3: Phylogenetic tree of AP2, MYB, WRKY, ERF, bHLH, and MYC families; Figure S4: Some photos of Camellia vietnamensis Huang; Table S1: List of real-time PCR primers for key genes of tea saponin synthesis in C. vietnamensis; Table S2: The RT-qPCR reaction system; Table S3: The RT-qPCR reaction procedure; Table S4: Transcript information of triterpenoid saponin biosynthesis pathway.

Author Contributions

Conceptualization, P.X. and J.Y.; methodology, P.X.; software, H.Y.; validation, Y.L. (Yang Li) and H.Y.; formal analysis, Y.L. (Yang Li) and H.Y.; investigation, Y.L. (Yang Li) and H.Y.; resources, J.Y. and Y.W.; data curation, J.Y. and Y.W.; writing—original draft preparation, Y.L. (Yang Li) and H.Y.; writing—review and editing, Y.L. (Yang Li), H.Y., M.Z.U.H. and Y.L. (Ya Liu); visualization, J.Y.; supervision, P.X. and Y.W.; project administration, Y.W.; funding acquisition, P.X. and J.Y. All authors have read and agreed to the published version of the manuscript.

Funding

This study was supported by Key R&D Program of Hainan, China (ZDYF2022SHFZ020), Tropical Island Ecology Open project of Key Laboratory of Ministry of Education (HNSF-OP-202203), High-level Talents Project of Hainan Natural Science Foundation (820RC585).

Data Availability Statement

The datasets in this study were uploaded to NCBI, with the accession number PRJNA983986 (https://www.ncbi.nlm.nih.gov/sra/PRJNA983986; accessed on 15 November 2023).

Acknowledgments

The authors would like to thank the Guangzhou Genedenovo Biotechnology Co., Ltd. for assisting in sequencing analysis.

Conflicts of Interest

The authors declare no conflict of interest.

References

  1. Dai, J.; Zheng, W.; Yu, J.; Yan, H.; Wang, Y.; Wu, Y.; Hu, X.; Lai, H. cDNA cloning, prokaryotic expression, and functional analysis of squalene synthase (SQS) in Camellia vietnamensis Huang. Protein Expr. Purif. 2022, 194, 106078. [Google Scholar] [CrossRef]
  2. Zhang, W.; Zhao, Y.; Yang, G.; Peng, J.; Chen, S.; Xu, Z. Determination of the evolutionary pressure on Camellia Oleifera on Hainan Island using the complete chloroplast genome sequence. PeerJ 2019, 7, e7210. [Google Scholar] [CrossRef] [PubMed]
  3. Ye, Z.; Wu, Y.; Ul Haq Muhammad, Z.; Yan, W.; Yu, J.; Zhang, J.; Yao, G.; Hu, X. Complementary transcriptome and proteome profiling in the mature seeds of Camellia oleifera from Hainan Island. PLoS ONE 2020, 15, e0226888. [Google Scholar] [CrossRef]
  4. Chen, J.; Guo, Y.; Hu, X.; Zhou, K. Comparison of the chloroplast genome sequences of 13 oil-tea Camellia samples and identification of an undetermined oil-tea Camellia species from Hainan province. Front. Plant Sci. 2022, 12, 798581. [Google Scholar] [CrossRef]
  5. He, L.; Guoying, Z.; Huaiyun, Z.; Yuanhao, H. Chemical constituents and biological activities of saponin from the seed of Camellia oleifera. Sci. Res. Essays 2010, 5, 4088–4092. [Google Scholar]
  6. Guo, N.; Tong, T.; Ren, N.; Tu, Y.; Li, B. Saponins from seeds of genus Camellia: Phytochemistry and bioactivity. Phytochemistry 2018, 149, 42–55. [Google Scholar] [CrossRef] [PubMed]
  7. Żwawiak, J.; Pawełczyk, A.; Olender, D.; Zaprutko, L. Structure and activity of pentacyclic triterpenes codrugs. A review. Mini-Rev. Med. Chem. 2021, 21, 1509–1526. [Google Scholar] [CrossRef]
  8. Li, Y.; Wang, J.; Li, L.; Song, W.; Li, M.; Hua, X.; Wang, Y.; Yuan, J.; Xue, Z. Natural products of pentacyclic triterpenoids: From discovery to heterologous biosynthesis. Nat. Prod. Rep. 2023, 40, 1303–1353. [Google Scholar] [CrossRef]
  9. Su, L.; Li, S.; Qiu, H.; Wang, H.; Wang, C.; He, C.; Xu, M.; Zhang, Z. Full-length transcriptome analyses of genes involved in triterpenoid saponin biosynthesis of Psammosilene tunicoides hairy root cultures with exogenous salicylic acid. Front. Genet. 2021, 12, 657060. [Google Scholar] [CrossRef]
  10. Yang, L.; Qiao, L.; Su, X.; Ji, B.; Dong, C. Drought stress stimulates the terpenoid backbone and triterpenoid biosynthesis pathway to promote the synthesis of saikosaponin in Bupleurum chinense DC. roots. Molecules 2022, 27, 5470. [Google Scholar] [CrossRef]
  11. Sallaud, C.; Rontein, D.; Onillon, S.; Jabès, F.; Duffé, P.; Giacalone, C.; Thoraval, S.; Escoffier, C.; Herbette, G.; Leonhardt, N.; et al. A novel pathway for sesquiterpene biosynthesis from Z,Z-farnesyl pyrophosphate in the wild tomato Solanum habrochaites. Plant Cell 2009, 21, 301–317. [Google Scholar] [CrossRef] [PubMed]
  12. Lin, P.; Wang, K.; Wang, Y.; Hu, Z.; Yan, C.; Huang, H.; Ma, X.; Cao, Y.; Long, W.; Liu, W.; et al. The genome of oil-Camellia and population genomics analysis provide insights into seed oil domestication. Genome Biol. 2022, 23, 14. [Google Scholar] [CrossRef] [PubMed]
  13. Yang, R.; Yan, Y.; Zeng, Y.; Jin, S.; Jiang, Q.; Yu, L.; Lai, R. Correlation between squalene synthase promoter and WRKY transcription factor in Camellia oleifera. J. Hortic. Sci. Biotechnol. 2021, 96, 34–43. [Google Scholar] [CrossRef]
  14. Nielsen, N.J.; Nielsen, J.; Staerk, D. New resistance-correlated saponins from the insect-resistant Crucifer Barbarea vulgaris. J. Agric. Food Chem. 2010, 58, 5509–5514. [Google Scholar] [CrossRef] [PubMed]
  15. Augustin, J.M.; Kuzina, V.; Andersen, S.B.; Bak, S. Molecular activities, biosynthesis and evolution of triterpenoid saponins. Phytochemistry 2011, 72, 435–457. [Google Scholar] [CrossRef] [PubMed]
  16. Wu, Q.; Wang, J.; Mao, S.; Xu, H.; Wu, Q.; Liang, M.; Yuan, Y.; Liu, M.; Huang, K. Comparative transcriptome analyses of genes involved in sulforaphane metabolism at different treatment in Chinese kale using full-length transcriptome sequencing. BMC Genom. 2019, 20, 377. [Google Scholar] [CrossRef]
  17. Lu, H.; Greenberg, J.T.; Holuigue, L. Editorial: Salicylic acid signaling networks. Front. Plant Sci. 2016, 7, 238. [Google Scholar] [CrossRef]
  18. Sawai, S.; Saito, K. Triterpenoid biosynthesis and engineering in plants. Front. Plant Sci. 2011, 2, 25. [Google Scholar] [CrossRef]
  19. Yendo, A.C.A.; De Costa, F.; Gosmann, G.; Fett-Neto, A.G. Production of plant bioactive triterpenoid saponins: Elicitation strategies and target genes to improve yields. Mol. Biotechnol. 2010, 46, 94–104. [Google Scholar] [CrossRef]
  20. Ramirez-Estrada, K.; Vidal-Limon, H.; Hidalgo, D.; Moyano, E.; Golenioswki, M.; Cusidó, R.; Palazon, J. Elicitation, an effective strategy for the biotechnological production of bioactive high-added value compounds in plant cell factories. Molecules 2016, 21, 182. [Google Scholar] [CrossRef]
  21. Gutierrez-Valdes, N.; Häkkinen, S.T.; Lemasson, C.; Guillet, M.; Oksman-Caldentey, K.-M.; Ritala, A.; Cardon, F. Hairy root cultures—A versatile tool with multiple applications. Front. Plant Sci. 2020, 11, 33. [Google Scholar] [CrossRef] [PubMed]
  22. Tewari, R.K.; Paek, K.-Y. Salicylic acid-induced nitric oxide and ROS generation stimulate ginsenoside accumulation in Panax ginseng roots. J. Plant Growth Regul. 2011, 30, 396–404. [Google Scholar] [CrossRef]
  23. Teng, H.; Xie, X.; Wang, L.; Hu, Z. Effects of exogenous substances on saponin content in root of Polygala tenuifolia Willd. South. J. Agric. 2014, 45, 2143–2147. [Google Scholar]
  24. Ye, J.; Mao, D.; Cheng, S.; Zhang, X.; Tan, J.; Zheng, J.; Xu, F. Comparative transcriptome analysis reveals the potential stimulatory mechanism of terpene trilactone biosynthesis by exogenous salicylic acid in Ginkgo biloba. Ind. Crops Prod. 2020, 145, 112104. [Google Scholar] [CrossRef]
  25. Kim, J.D.; Khan, M.I.; Shin, J.H.; Lee, M.G.; Seo, H.J.; Shin, T.S.; Kim, M.Y. HPLC fractionation and pharmacological assessment of green tea seed saponins for antimicrobial, anti-angiogenic and hemolytic activities. Biotechnol. Bioprocess Eng. 2015, 20, 1035–1043. [Google Scholar] [CrossRef]
  26. Maulana, T.I.; Falah, S.; Andrianto, D. Total phenolic content, total flavonoid content, and antioxidant activity of water and ethanol extract from Surian (Toona sinensis) leaves. IOP Conf. Ser. Earth Environ. Sci. 2019, 299, 012021. [Google Scholar] [CrossRef]
  27. Zhao, Y.; Su, R.; Zhang, W.; Yao, G.-L.; Chen, J. Antibacterial activity of tea saponin from Camellia oleifera Shell by novel extraction method. Ind. Crops Prod. 2020, 153, 112604. [Google Scholar] [CrossRef]
  28. Yu, J.; Yan, H.; Wu, Y.; Wang, Y.; Xia, P. Quality evaluation of the oil of Camellia spp. Foods 2022, 11, 2221. [Google Scholar] [CrossRef]
  29. El Amine, B.; Mosseddaq, F.; Naciri, R.; Oukarroum, A. Interactive effect of Fe and Mn deficiencies on physiological, biochemical, nutritional and growth status of Soybean. Plant Physiol. Biochem. 2023, 199, 107718. [Google Scholar] [CrossRef]
  30. Saidi, I.; Ayouni, M.; Dhieb, A.; Chtourou, Y.; Chaïbi, W.; Djebali, W. Oxidative damages induced by short-term exposure to cadmium in bean plants: Protective role of salicylic acid. S. Afr. J. Bot. 2013, 85, 32–38. [Google Scholar] [CrossRef]
  31. Zhang, B.; Horvath, S. A general framework for weighted gene coexpression network analysis. Stat. Appl. Genet. Mol. Biol. 2005, 4, 17. [Google Scholar] [CrossRef] [PubMed]
  32. Naz, S.; Bilal, A.; Saddiq, B.; Ejaz, S.; Ali, S.; Ain Haider, S.T.; Sardar, H.; Nasir, B.; Ahmad, I.; Tiwari, R.K.; et al. Foliar application of salicylic acid improved growth, yield, quality and photosynthesis of Pea (Pisum sativum L.) by improving antioxidant defense mechanism under saline conditions. Sustainability 2022, 14, 14180. [Google Scholar] [CrossRef]
  33. Ni, J.; Dong, L.; Jiang, Z.; Yang, X.; Sun, Z.; Li, J.; Wu, Y.; Xu, M. Salicylic acid-induced flavonoid accumulation in ginkgo biloba leaves is dependent on red and far-red light. Ind. Crops Prod. 2018, 118, 102–110. [Google Scholar] [CrossRef]
  34. Biswas, T.; Mathur, A.; Gupta, V.; Singh, M.; Mathur, A.K. Salicylic acid and ultrasonic stress modulated gene expression and ginsenoside production in differentially affected Panax quinquefolius (L.) and Panax sikkimensis (Ban.) cell suspensions. Plant Cell Tissue Organ Cult. PCTOC 2019, 136, 575–588. [Google Scholar] [CrossRef]
  35. Tajik, S.; Zarinkamar, F.; Soltani, B.M.; Nazari, M. Induction of phenolic and flavonoid compounds in leaves of Saffron (Crocus sativus L.) by salicylic acid. Sci. Hortic. 2019, 257, 108751. [Google Scholar] [CrossRef]
  36. Ghasemzadeh, A.; Jaafar, H. Interactive effect of salicylic acid on some physiological features and antioxidant enzymes activity in ginger (Zingiber officinale Roscoe). Molecules 2013, 18, 5965–5979. [Google Scholar] [CrossRef] [PubMed]
  37. Syed, B.A.; Patel, M.; Patel, A.; Gami, B.; Patel, B. Regulation of antioxidant enzymes and osmo-protectant molecules by salt and drought responsive genes in Bambusa balcooa. J. Plant Res. 2021, 134, 165–175. [Google Scholar] [CrossRef] [PubMed]
  38. Tyagi, S.; Shumayla; Verma, P.C.; Singh, K.; Upadhyay, S.K. Molecular characterization of ascorbate peroxidase (APX) and APX-related (APX-R) genes in Triticum aestivum L. Genomics 2020, 112, 4208–4223. [Google Scholar] [CrossRef]
  39. Wang, L.-J.; Li, S.-H. Thermotolerance and related antioxidant enzyme activities induced by heat acclimation and salicylic acid in grape (Vitis vinifera L.) leaves. Plant Growth Regul. 2006, 48, 137–144. [Google Scholar] [CrossRef]
  40. Xu, Y.; Zhao, G.; Ji, X.; Liu, J.; Zhao, T.; Gao, Y.; Gao, S.; Hao, Y.; Gao, Y.; Wang, L.; et al. Metabolome and transcriptome analysis reveals the transcriptional regulatory mechanism of triterpenoid saponin biosynthesis in Soapberry (Sapindus mukorossi Gaertn.). J. Agric. Food Chem. 2022, 70, 7095–7109. [Google Scholar] [CrossRef]
  41. Yao, L.; Wang, J.; Sun, J.; He, J.; Paek, K.-Y.; Park, S.-Y.; Huang, L.; Gao, W. A WRKY transcription factor, PgWRKY4X, positively regulates ginsenoside biosynthesis by activating squalene epoxidase transcription in Panax ginseng. Ind. Crops Prod. 2020, 154, 112671. [Google Scholar] [CrossRef]
  42. Yin, J.; Sun, L.; Li, Y.; Xiao, J.; Wang, S.; Yang, J.; Qu, Z.; Zhan, Y. Functional identification of BpMYB21 and BpMYB61 transcription factors responding to MeJA and SA in birch triterpenoid synthesis. BMC Plant Biol. 2020, 20, 374. [Google Scholar] [CrossRef] [PubMed]
Figure 1. Dynamic changes in the contents of tea saponin (A), total phenols (B), and total flavonoids (C) in Camellia vietnamensis Huang (C. vietnamensis) leaves under different concentrations of SA treatment (abcdf, p-value ≤ 0.05).
Horticulturae 10 00008 g001
Figure 2. Dynamic changes in the contents of MDA (A), H2O2 (B), O2 (C), SOD (D), POD (E), CAT (F), and APX (G) in C. vietnamensis leaves under different concentrations of SA treatment (abcdf, p-value ≤ 0.05).
Horticulturae 10 00008 g002
Figure 3. Venn (A), histogram (B), and volcanic plots (C) of differential genes at three time points (12 h, 36 h, and 72 h) after SA treatment of C. vietnamensis leaves.
Horticulturae 10 00008 g003
Figure 4. GO functional annotation and significant enrichment analysis were performed on the identified DEGs (A) and KEGG enrichment bubble diagram of the first 20 pathways with the lowest Q value (B) at three time points (12 h, 36 h, and 72 h) after SA treatment of C. vietnamensis leaves.
Horticulturae 10 00008 g004
Figure 5. WGCNA of transcriptome and secondary metabolites. (A) Soft threshold. (B) Cluster dendrogram (*** significant at level 0.001, ** significant at level 0.01, * significant at level 0.05). (C) Module–trait relationships. (D) Cytoscape of the key**enes in the brown2 module. Points represent genes, and lines represent a regulatory relationship between two points. The darker and larger the node color and line, the stronger the connectivity.
Horticulturae 10 00008 g005
Figure 6. (A) A heat map of tea saponin pathway and structural gene of C. vietnamensis was constructed by comparing the relevant structural genes annotated in the transcriptome data. (B) Phylogenetic tree of 33 CYP450 with high expression levels and differences and 49 downloaded amino acid sequences of CYP450 associated with triterpene saponin synthesis. (C) Cluster heat map of TFs associated with triterpenoid saponin synthesis.
Horticulturae 10 00008 g006
Figure 7. Expression pattern profiles of key structural genes and TFs related to tea saponin biosynthesis. (A) The relative expression levels of 20 key structural genes (including HMGCR, SQS, SQE, bAS, CPR, CYP450, and UGT) and 10 TFs in the tea saponin biosynthesis pathway. (B) Scatter plot and linear regression based on RT-qPCR and transcriptome data. The correlation coefficient was calculated using the Spearman correlation method.
Horticulturae 10 00008 g007
Table 1. Correlation analysis between secondary metabolic components and enzyme activities. (Note: ** significant at level 0.01, * significant at level 0.05. MDA, malondialdehyde; SOD, superoxide dismutase; POD, peroxidase; CAT, catalase; APX, ascorbate peroxidase; H2O2, hydrogen peroxide; O2, superoxide anion.)
Tea SaponinTotal PhenolsTotal FlavonoidsMDASODPODCATAPXH2O2O2
Tea saponin10.413 *0.385 *0.666 **−0.241−0.238−0.242−0.3180.2030.11
Total phenols0.413 *1−0.2530.262−0.233−0.215−0.213−0.1480.080.118
Total flavonoids0.385 *−0.25310.663 **−0.234−0.573 **−0.352−0.34−0.093−0.065
MDA0.666 **0.2620.663 **1−0.131−0.567 **−0.206−0.3160.311−0.017
SOD−0.241−0.233−0.234−0.13110.2780.615 **0.404 *0.282−0.068
POD−0.238−0.215−0.573 **−0.567 **0.27810.1710.388 *0.2520.119
CAT−0.242−0.213−0.352−0.2060.615 **0.1711−0.0030.2450.026
APX−0.318−0.148−0.34−0.3160.404 *0.388 *−0.0031−0.075−0.201
H2O20.2030.08−0.0930.3110.2820.2520.245−0.07510.238
O20.110.118−0.065−0.017−0.0680.1190.026−0.2010.2381
Disclaimer/Publisher’s Note: The statements, opinions and data contained in all publications are solely those of the individual author(s) and contributor(s) and not of MDPI and/or the editor(s). MDPI and/or the editor(s) disclaim responsibility for any injury to people or property resulting from any ideas, methods, instructions or products referred to in the content.

