Article

Comparative Metabolomic and Transcriptomic Analysis Reveals That Variations in Flavonoids Determine the Colors of Different Rambutan Cultivars

1
Sanya Nanfan Research Institute & Key Laboratory of Quality Regulation of Tropical Horticultural Crop in Hainan Province, School of Tropical Agriculture and Forestry, Hainan University, Haikou 570228, China
2
Hainan State Farms Academy of Sciences Group Co., Ltd., Sanya 572025, China
*
Author to whom correspondence should be addressed.
These authors contributed equally to this work.
Horticulturae 2024, 10(3), 263; https://doi.org/10.3390/horticulturae10030263
Submission received: 26 January 2024 / Revised: 1 March 2024 / Accepted: 6 March 2024 / Published: 10 March 2024

Abstract

:
Rambutan is a tropical tree and its fruit has several favorable characteristics. To understand how the color of the rambutan fruit peel develops, the transcriptome, flavonoid metabolome, and carotenoid metabolome data of two rambutan cultivars, ‘BY2’ and ‘BY7’, which show yellow and red peels at maturity, respectively, were comprehensively analyzed at three developmental stages. We identified 26 carotenoid components and 53 flavonoid components in these cultivars. Anthocyanins were the main component contributing to the red color of ‘BY7’ after reaching ripeness. The carotenoid content decreased sharply as the fruit matured. Hence, we speculated that flavonols were the main contributors to the yellow color of the ‘BY2’ peel. In total, 6805 differentially expressed genes were screened by transcriptome analysis; the majority of them were enriched in metabolic pathways and the biosynthesis of secondary metabolites. Weighted gene co-expression network analysis results revealed that in addition to MYB and bHLH, ERF, WRKY, MYB-related, and C3H were the main potential transcription factors regulating the color of the rambutan peel. In addition, we also identified 12 structural genes associated with flavonoid biosynthesis. The research findings shed light on the molecular mechanisms of color acquisition in rambutan fruit peels, laying the foundation for the quality control of rambutan and the cultivation of differently colored cultivars of rambutan.

1. Introduction

Peel color is an important attribute of fruit appearance. Plants rely on brightly colored fruits to attract birds and animals, which eat these fruits and then spread their seeds, supporting plant reproduction [1]. For human consumers, fruit peel color is a key determinant of the quality of fruit products and consumers typically prefer bright and colorful fruits [2]. Peel color largely depends on the composition of various natural pigments in the peel. These natural plant pigments mainly include chlorophyll, carotenoids, flavonoids, and alkaloid pigments, among others. In most fruits, during the process of ripening, chlorophyll is broken down and other pigments are synthesized. These dynamic changes in pigment levels affect the peel color of fruits [3].
Cultivars in which the fruit becomes red upon reaching ripeness, such as the red cultivars of mangoes, typically have a high level of the flavonoid anthocyanin [4]. On the contrary, fruits that appear yellow—such as most citrus fruits—show a high content of carotenoids in the fruit peel [5]. Studies on pears have shown that the pigments that give a yellow color to the cultivar ‘Hongzaosu’ are mainly flavonoids, rather than carotenoids [6]. Dragon fruits primarily show a bright red-colored peel at maturity due to the accumulation of other pigments, such as beet red pigment [7]. Based on these studies and other evidence, we can conclude that flavonoids and carotenoids are the key pigments that determine peel coloration during fruit ripening.
Flavonoids belong to a group of plant compounds called polyphenols. According to the structure of their chemical skeleton, flavonoid compounds can be divided into various groups, such as flavanols, flavones, flavonols, anthocyanins, isoflavonoids, aurones, and phlobaphenes. Among these compounds, aurones have a C6-C2-C6 skeleton, while the other flavonoid components all have a C6-C3-C6 skeleton [8]. Meanwhile, carotenoids are polyene compounds composed of isoprenoids [9]. Carotenoids are broadly classified into two groups according to the presence of oxygen atoms in their structural formulas. The first group consists of aerobic carotenoids, such as xanthophylls, including zeaxanthin and β-cryptoxanthin. In contrast, the other group consists of anaerobic carotenoids, including lycopene and other carotene-derived compounds [10].
Flavonoids not only serve as important contributors to the colors of plants and fruits but also protect them from the oxidative damage caused by ultraviolet (UV) stress in plant tissues [11]. In addition, given the antioxidant activity of flavonoid compounds, the consumption of fruits with high flavonoid levels can inhibit the proliferation of cancer cells, reduce the risk of cerebrovascular diseases, delay aging, and improve insulin secretion capacity in humans [12,13]. Like flavonoids, carotenoids have also been recognized to effectively clear peroxide radicals and prevent oxidative damage [14]. Flavonoids are mainly synthesized in plants through phenylalanine deamination in the phenylpropane metabolic pathway [15]. The cytoplasmic mevalonate pathway and the plastid-localized 2-C-methyl-D-erythritol 4-phosphate (MEP) pathway generate the precursors required for carotenoid synthesis, such as isopentenyl pyrophosphate, dimethylallyl pyrophosphate, and geranylgeranyl pyrophosphate. These precursors are used to generate carotenoids via a complex series of reactions [16]. The biosynthesis of flavonoids and carotenoids depends on the presence of structural genes and is controlled via the action of several transcription factors (TFs). The MYB-bHLH-WD40 (MBW) complex—which contains R2R3-MYB, bHLH, and WD40 TFs—is a crucial regulator of flavonoid metabolism and synthesis pathways in plants [17]. Additionally, TFs such as MYB, CNR, TAGL1, and RIN regulate the accumulation of carotenoids in plant tissues [18].
Rambutan (Nephelium lappaceum L.) is a famous tropical tree belonging to the Sapindaceae family, which also includes litchi (Litchi chinensis) and longan (Dimocarpus longan), and is a type of non-respiratory climacteric fruit tree [19]. Rambutan is native to southeast Asia, including countries such as Indonesia and Malaysia [20]. Rambutan was first introduced and planted successfully in China in the early 1960s and, since then, several rambutan cultivars suitable for local planting have been selected and bred. Today, these cultivars are mainly grown in the Baoting, Qiongzhong, and Sanya cities and counties in Hainan Province. In fact, rambutan cultivation has emerged as one of the key local pillar industries in Baoting.
The flesh of rambutan is sweet and sour and rich in flavor. Although the taste of rambutan is similar to that of litchi, it is still unique. The skin of rambutan fruits is covered with unique hair-like spinterns—a characteristic that is common across different cultivars of this fruit [21]. Most cultivars of rambutan, such as ‘BY7’, develop bright red skin and soft spiky hairs at maturity, making the fruit very appealing. However, in recent years, the demand for a new rambutan cultivar called ‘BY2’ has gradually increased, both in China’s cultivation area and the consumer market. Unlike most other rambutan cultivars, such as ‘BY3’, ‘BY4’, and ‘BY7’, ‘BY2’, the new rambutan cultivar develops golden skin and hair at maturity and its flavor is also different from that of the red cultivars. Hence, ‘BY2’ provides a novel visual and taste experience to consumers.
Previous studies on rambutan have mainly focused on the internal quality and development characteristics of the fruit and its flesh. For example, some studies have shown that rambutan fruit is rich in sugars such as glucose and fructose [22]. Meanwhile, other studies have found that the main organic acids in the flesh of rambutan fruit are tartaric, malic, succinic, and lactic acid [23]. Recent studies have employed metabolomics and related methods to investigate the metabolic profiles and potential taste biomarkers of different rambutan cultivars [24]. However, there has been no report on how color formation occurs in rambutan and how color differences arise between the yellow and red cultivars of rambutan.
In this study, the peels of the yellow rambutan cultivar ‘BY2’ and the red rambutan cultivar ‘BY7’ were chosen as experimental materials. Flavonoid metabolomic analysis, carotenoid metabolomic analysis, and RNA sequencing (RNA-seq) analysis were carried out in the early (S1), middle (S2), and late developmental stages (S3; maturity) of the ‘BY7’ and ‘BY2’ cultivars. In addition, by analyzing the amounts of related pigments and examining the expression patterns of major pigment genes, the key pigments and key genes that determine color development in the two types of rambutan cultivars were screened. This paper offers a new understanding of the color formation mechanisms of rambutan but also enriches the theory of flavonoid biosynthesis of rambutan peel, which has a huge significance from the perspective of breeding new color cultivars of rambutan.

2. Materials and Methods

2.1. Plants and Sampling

Samples of the ‘BY2’ and ‘BY7’ rambutan cultivars required for the study were collected from the Baoting Tropical Crop Research Institute (18.6095 N, 109.74039 E) located in Baoting (Hainan, China) from a tree aged 8 years. Fruits were collected during three different periods of fruit development, namely 50 days after full bloom (DAFB) (S1), 90 DAFB (S2), and 130 DAFB (S3), representing the early, middle, and late (maturity) developmental stages, respectively. Fruits at different stages of development were randomly collected from five different individual plants and at least 60 fruits were collected in total. A knife was used to peel the fruit and separate the skin and flesh tissues, which were quickly frozen in liquid nitrogen, brought to the laboratory, and stored at −80 °C.

2.2. Physiological Index Measurement

The L*, a*, and b* values of rambutan peels were measured by using a portable color difference meter (Linshang Technology Co., Ltd., Shenzhen, China). The soluble solid content and acid content of the flesh of rambutan were determined using a brix-acidity meter (PAL-BX/ACD15, ATAGO, Tokyo, Japan). Chlorophyll and carotenoid levels were determined via ethanol extraction and colorimetry. Briefly, the plant tissue was ground in a mortar and 95% ethanol (2–3 mL) was added to prepare a homogenate. Then, 10 mL ethanol was added and the mixture was homogenized until the tissue completely lost its color. After 3 min, the extract was filtered and placed in a brown volumetric bottle and the volume was made up to 25 mL with ethanol. Subsequently, the extract was poured into a colorimetric dish, with 95% ethanol serving as the blank. The absorbance values A665, A649, and A470 were measured at 665, 649, and 470 nm, respectively, using a New Century T6 spectrophotometer (New Century, China). Each sample consisted of three biological replicates. Chlorophyll and carotenoid levels were calculated as follows [25].
Chlorophyll a (Ca) = 13.95 × A665 − 6.88 × A649
Chlorophyll b (Cb) = 24.96 × A649 7.32 × A665
Carotenoids = (1000 × A470 − 2.05 × Ca − 114.8 × Cb)/245

2.3. Metabolomics Analysis

Flavonoid and carotenoid metabolomics of the two rambutan cultivars ‘BY2’ and ‘BY7’ were analyzed at three different developmental stages. This analysis was conducted by Metware Biotechnology Co., Ltd. (Wuhan, China). In short, freeze-dried samples were ground into a powder (MM400, Retsch, Haan, Germany) (30 Hz, 1.5 min), which was used to prepare three replicates of 0.05 g each. In each replicate, 0.05 g of the powder was added to a 500 μL extraction mixture containing 50% methanol and 0.1% HCl. The mixture was vortexed for 5 min (MIX-200, Jingxin, Shanghai, China) and subjected to ultrasound (KQ5200E, Shumei, Kunshan, China) for 5 min. It was subsequently subjected to centrifugation (5424R, Eppendorf, Hamburg, Germany) at 12,000 r/min and 4 °C for 3 min. The supernatant was obtained and the above protocol was repeated once. The supernatants obtained during the two rounds were mixed and the sample was filtered through a microporous filter (0.22 μm pore size) for ultra-high performance liquid chromatography and tandem mass spectrometry LC-MS/MS analysis (HPLC-MS/MS). The samples were then analyzed using an HPLC−MS/MS system (UPLC, ExionLC™ AD, MS, Applied Biosystems 6500 Triple Quadrupole) and the following analytical conditions: UPLC—column, WatersACQUITY BEH C18 (1.7 µm, 2.1 × 100 mm); solvent system, water (0.1% formic acid): methanol (0.1% formic acid); gradient program, 95:5 v/v at 0 min, 50:50 v/v at 6 min, 5:95 v/v at 12 min, hold for 2 min, 95:5 v/v at 14 min; hold for 2 min; flow rate, 0.35 mL/min; temperature, 40 °C; and injection volume, 2 μL. Subsequently, the Metware Database (MWDB) was employed for MS-based flavonoid detection. Chromatographic peak areas were calculated using the corresponding standard linear equations to measure flavonoid concentrations. A more detailed process of flavonoid metabolomic analysis has been provided in previous studies [4].
Carotenoid levels were measured by MetWare (http://www.metware.cn/ accessed on 5 March 2023) using the AB SCIEX QTRAP 6500 LC-MS/MS platform. First, the plant tissue was ground to powder (MM400, Germany) (30 Hz, 1 min). Then, 0.05 g of the powder was added to 500 μL of an extraction solution, which consisted of a mixture of n-hexane:acetone:ethanol (1:1:1, v/v/v) containing 0.01% BHT (g/mL). The mixture was vortexed for 20 min (MIX-200, Jingxin, Shanghai, China) and then centrifuged (5424R, Eppendorf, Germany) for 5 min (12,000 r/min, 4 °C). The supernatant was obtained and the operation was repeated again. The supernatants obtained from both rounds were combined to obtain the extraction solution. The extraction solution was concentrated and then dissolved in a 100 μL methanol/MTBE mixture (1:1, v/v) before filtering through a microporous filter (0.22 μm pore size). It was then added to a brown bottle for subsequent LC-MS/MS. The sample extracts were analyzed using the same HPLC−MS/MS system in the following analytical conditions: LC column, YMC C30 (3 μm, 100 × 2.0 mm i.d); solvent system, methanol:acetonitrile (1:3, v/v) with 0.01% BHT and 0.1% formic acid (A) and methyl tert-butyl ether with 0.01% BHT (B); gradient program, started at 0% B (0–3 min), increased to 70% B (3–5 min), increased further to 95% B (5–9 min), and finally ramped back to 0% B (10–11 min); flow rate, 0.8 mL/min; temperature, 28 °C; and injection volume: 2 μL. Subsequently, the mass spectrum data were evaluated based on scheduled multiple reaction monitoring (MRM).

2.4. RNA Extraction and Sequencing

Total RNA was extracted from rambutan peel samples using a specific kit for plant polysaccharides polyphenols (Tiangen, DP441, Beijing, China). mRNA enrichment was carried out using Oligo (dT) magnetic beads and this was followed by fragmentation using a fragmentation buffer. Singe-stranded cDNA was synthesized with random hexamers using short fragments as templates. Subsequently, double-stranded cDNA was prepared by adding buffer, dNTPs, and DNA polymerase Ⅰ and then purified using AMPure XP beads. cDNA was purified even further and end-repaired via the addition of A-tails. Additionally, sequencing adapters were also connected to the cDNA. Purified cDNA was enriched via PCR for cDNA library construction. Subsequently, the library was subjected to quality inspection and sequencing was performed after quality criteria were met. Two (paired-end) ended RNA sequencing was conducted on the Illumina sequencing platform at Metware Biotechnology Co., Ltd. (Wuhan, China). Subsequently, Fastp was used for quality control on the raw reads obtained from sequencing, filtering out unqualified data to obtain clean reads [26], which were then mapped to the rambutan reference genome (National Genomics Data Center, accession number: GWHBECQ00000000) using HISAT2 [27]. String Tie was used to assemble transcripts from the reads and gene expression was calculated based on FPKM values. Differentially expressed genes (DEGs) between the ‘BY7’ and ‘BY2’ cultivars were analyzed using DESeq2 [28] and identified based on the following criteria: False Discovery Rate (FDR) < 0.05 and |log2FoldChange| > 1. Raw RNA-seq data were submitted to the NCBI database (ID number: PRJNA1048704).

2.5. cDNA Synthesis and Quantitative Real-Time PCR (Q-PCR)

cDNA was prepared using the HiScript Ⅲ All-in-one RT SuperMix (Vazyme, R333, Nanjing, China) kit according to the instructions provided in the kit. Specifically, 1 µg RNA was reverse transcribed into cDNA. After 20-fold dilution, the cDNA was used as a reaction template for qPCR. The 15 µL reaction mixture for qPCR included 1 µL forward and reverse primers (10 µM), 5.5 µL cDNA, and 7.5 µL 2× Q3 SYBR qPCR Master Mix (Universal) (TOLOBIO, #22204, Shanghai, China). The protocols and instrument settings used for qPCR were as described previously [4]. All primers were designed using the online platform primer3 (https://bioinfo.ut.ee/primer3-0.4.0/ accessed on 10 August 2023) (Supplementary Table S1). The relative gene expression was calculated using the 2-ΔΔCt method and normalized based on the expression of the rambutan actin gene. All samples contained three biological replicates.

2.6. Weighted Gene Co-Expression Network Analysis (WGCNA)

WGCNA was conducted using an online tool (https://cloud.metware.cn/). All genes identified using RNA-seq were subjected to WGCNA, as were those found to be associated with the contents of proanthocyanidins (PAs), anthocyanins, and flavonols in the peels of ‘BY2’ and ‘BY7’ rambutan during the three developmental stages. The system default gene filtering thresholds of MergeCutHeight and minModuleSize were used (0.2 and 50, respectively). The automatic network construction function ‘blockwise’ was employed to build modules. The characteristic gene values of each module were calculated to test the correlation between each sample and trait. The ‘light green’, ‘dark grey’, ‘dark green’, ‘midnight blue’, ‘pink’, ‘magenta’, ‘red’, and ‘turquoise’ modules were used to select candidate genes for subsequent analysis based on a threshold of 0.80. The Kyoto Encyclopedia of Genes and Genomes (KEGG, http://www.genome.jp/kegg) database was employed to functionally annotate the identified genes.

2.7. Statistical Analysis

Data were expressed as the mean ± standard deviation. Significant differences between groups were examined using a Student’s t-test with SPSS 27.0 (SPSS, Chicago, IL, USA). p < 0.05 (*) and p < 0.01 (**) were considered statistically significant and highly statistically significant, respectively. All heatmaps were plotted with TBtools [29] and a z-score normalization function was employed between each row of data. ChiPlot (https://www.chiplot.online/) was used to draw stacked bar charts.

3. Results and Analysis

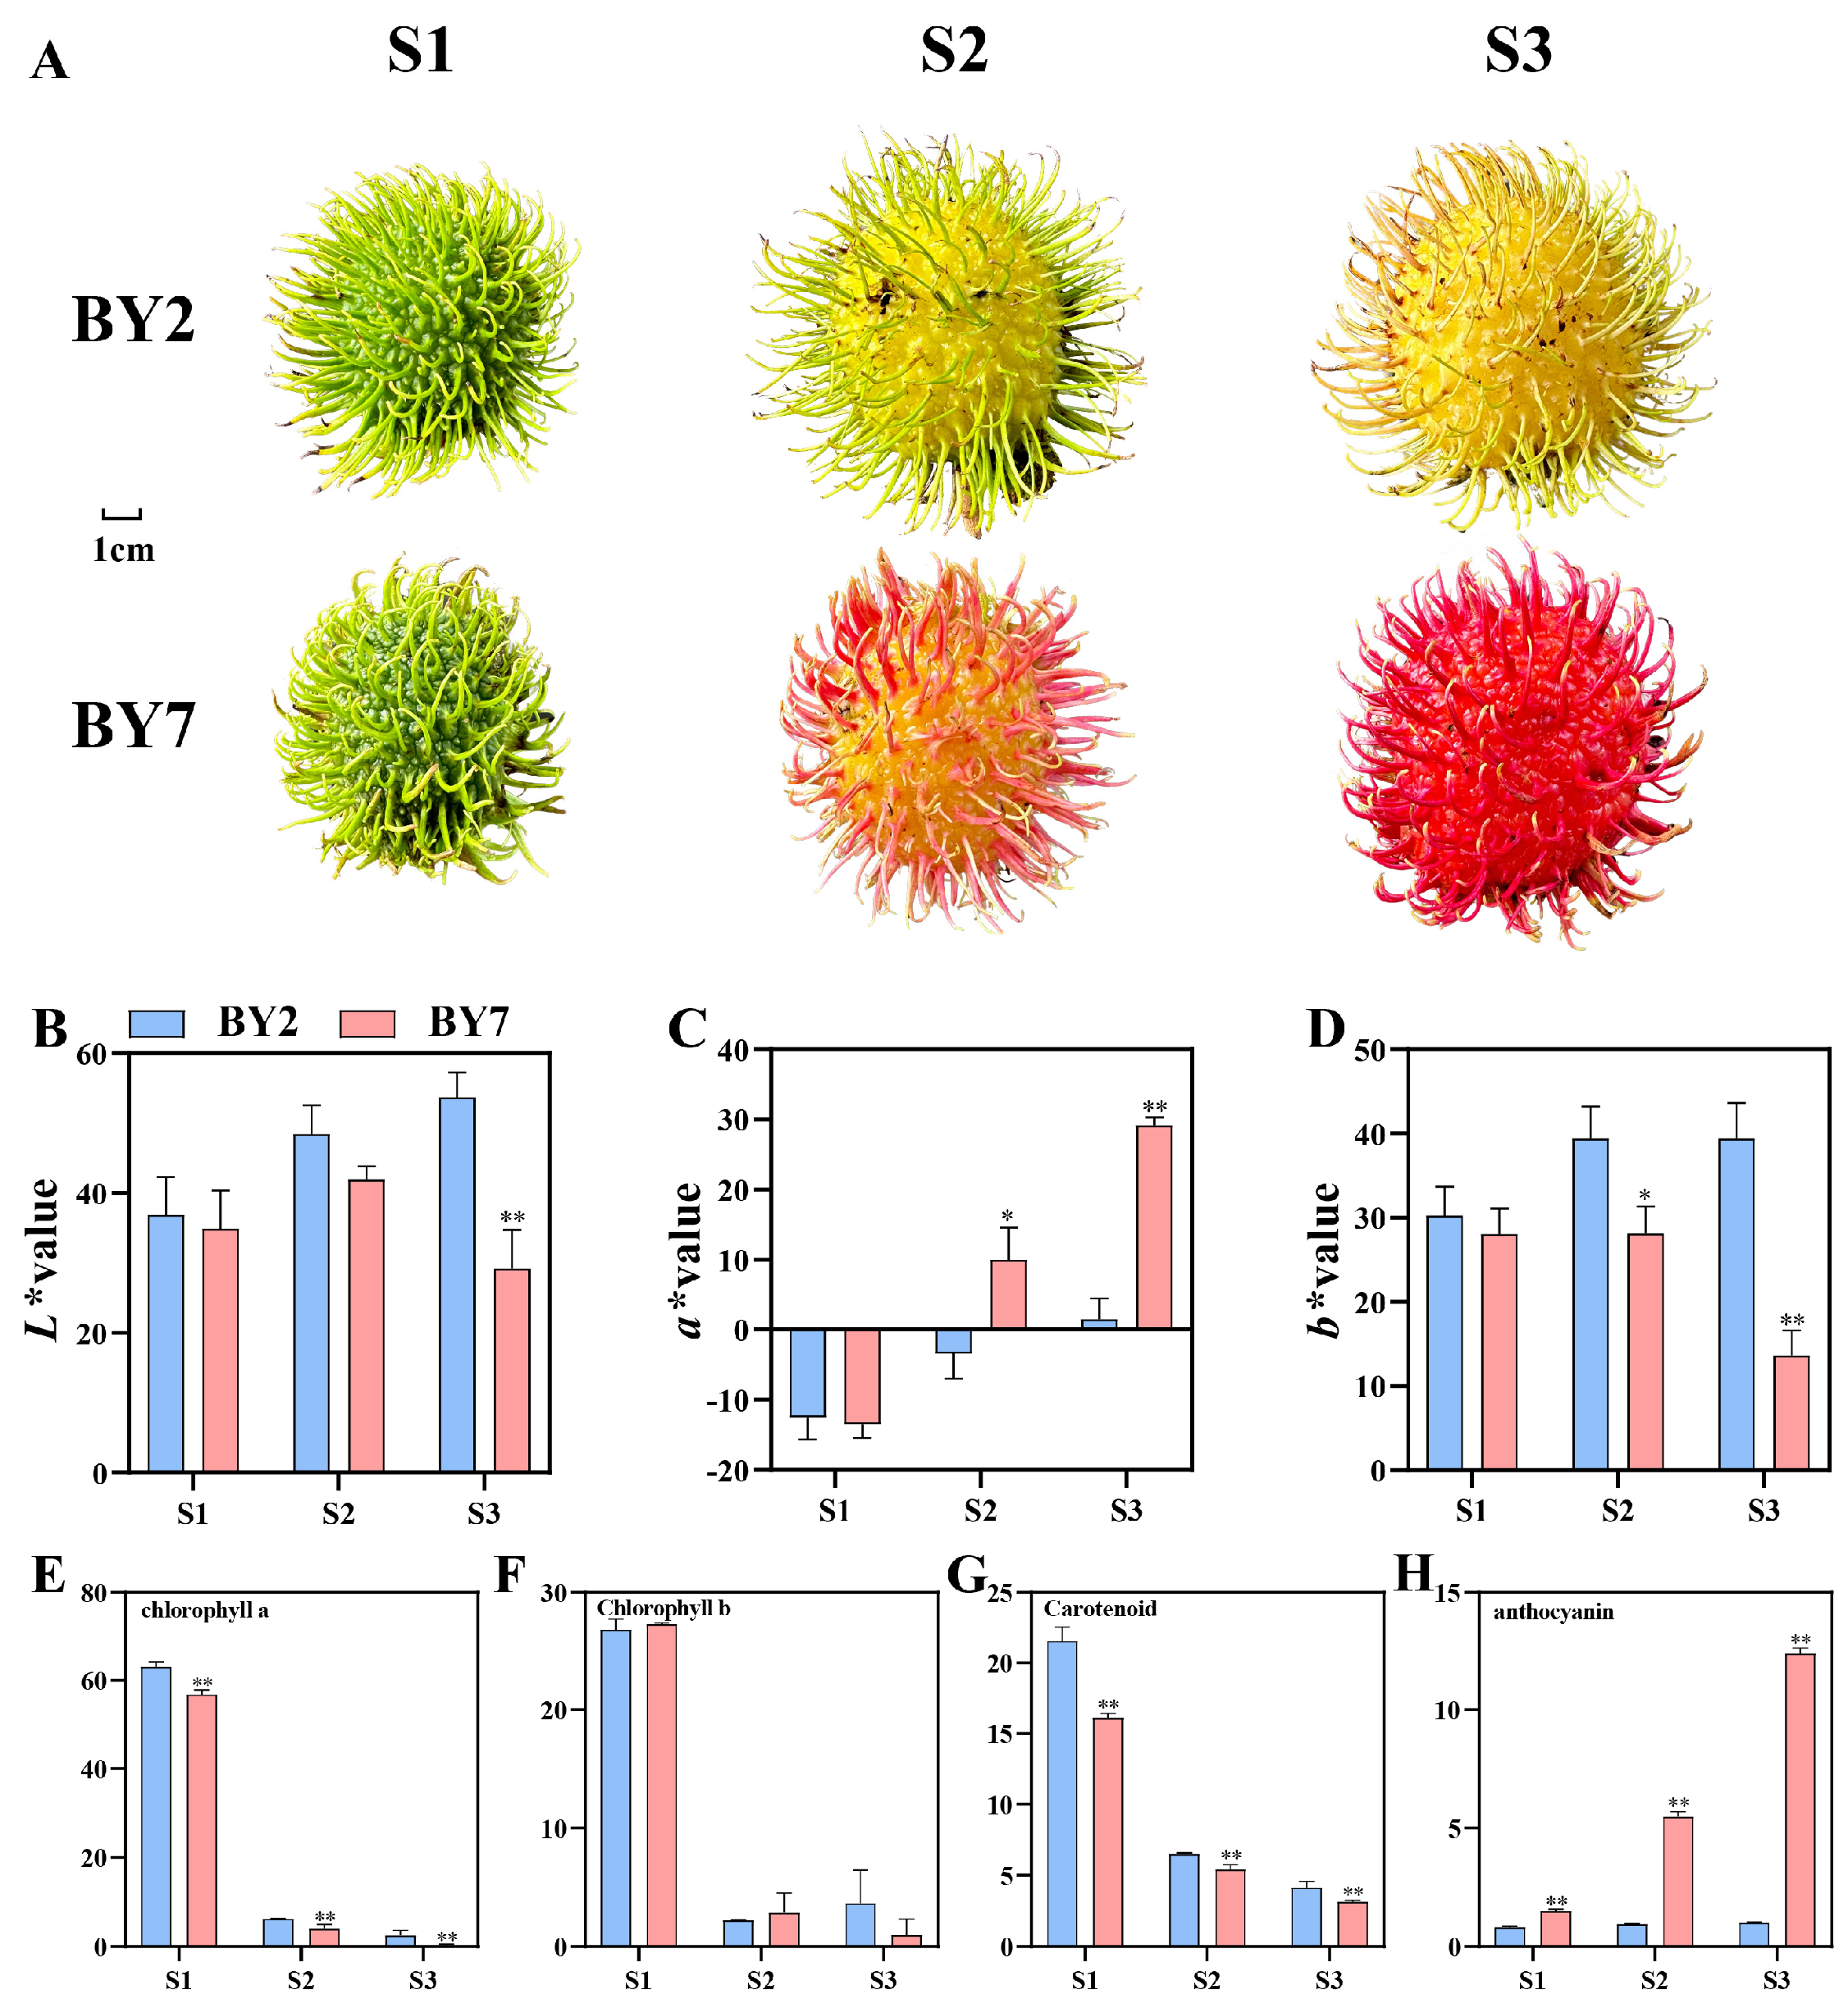
3.1. Basic Analysis of Two Differently Colored Rambutan Cultivars

Figure 1A shows the fruits of the ‘BY2’ and ‘BY7’ cultivars at different developmental stages. In the S1 period, both cultivars were completely green in color. As the fruits continued to develop and mature, ‘BY2’ gradually turned yellow–green (S2) and eventually became golden-yellow (S3). However, ‘BY7’ exhibited a completely different change in its coloring pattern. During the S2 stage, the fruit hair turned red and the skin surface became slightly red but the base color appeared yellow. However, at the S3 stage, the fruit turned completely red (Figure 1).
The L* value, a* value, and b* value are color-based indices that represent the brightness, red–green degree, and yellow–blue degree of the sample color, respectively. At maturity (S3), ‘BY2’ had a significantly greater L* value than ‘BY7’ (Figure 1B). The a* value of ‘BY2’ was significantly lower than that of ‘BY7’ at the S2 and S3 stages, while its b* value was significantly higher (Figure 1C,D). These results indicated that with the continuous maturation of the fruit, ‘BY2’ gradually acquired a yellow peel, likely due to the accumulation of yellow substances, while ‘BY7’ gradually formed a red peel by accumulating red pigments.
In order to further determine the cause of skin coloration of two rambutan cultivars, metabolome methods were used to detect the components and contents of carotenoids and anthocyanins in the samples. In order to further determine the reason behind the different colors of the ‘BY7’ and ‘BY2’ cultivars, we determined the pigment content in the peels of each cultivar. The chlorophyll a and chlorophyll b amounts in the ‘BY7’ and ‘BY2’ cultivars were significantly lower at the S2 and S3 stages than at the S1 stage. This suggested that as the fruits developed and matured, their chlorophyll content rapidly decreased, leading to the chlorosis of the fruit peel (Figure 1E,F). No significant accumulation of anthocyanins was observed in ‘BY2’ throughout the developmental period. However, the amount of anthocyanins in the ‘BY7’ fruit peel increased significantly with fruit development, indicating that the accumulation of anthocyanins was the main contributor to red coloration in the ‘BY7’ fruit peel (Figure 1H). Interestingly, similar to chlorophyll, carotenoids showed a decreasing trend in both the ‘BY2’ and ‘BY7’ fruit peels during development, showing significantly lower contents at S2 and S3 than at S1 in both cultivars (Figure 1G). This was inconsistent with the golden yellow color observed in the ‘BY2’ peel at the ripening stage. Therefore, these findings indicated that carotenoid content may not be the primary contributor to the yellow color of the ‘BY2’ peel. In order to explain peel color differences in the two rambutan cultivars at a molecular level, metabolomic methods were employed and the types and contents of carotenoids and anthocyanins in the ‘BY7’ and ‘BY2’ cultivars were examined.

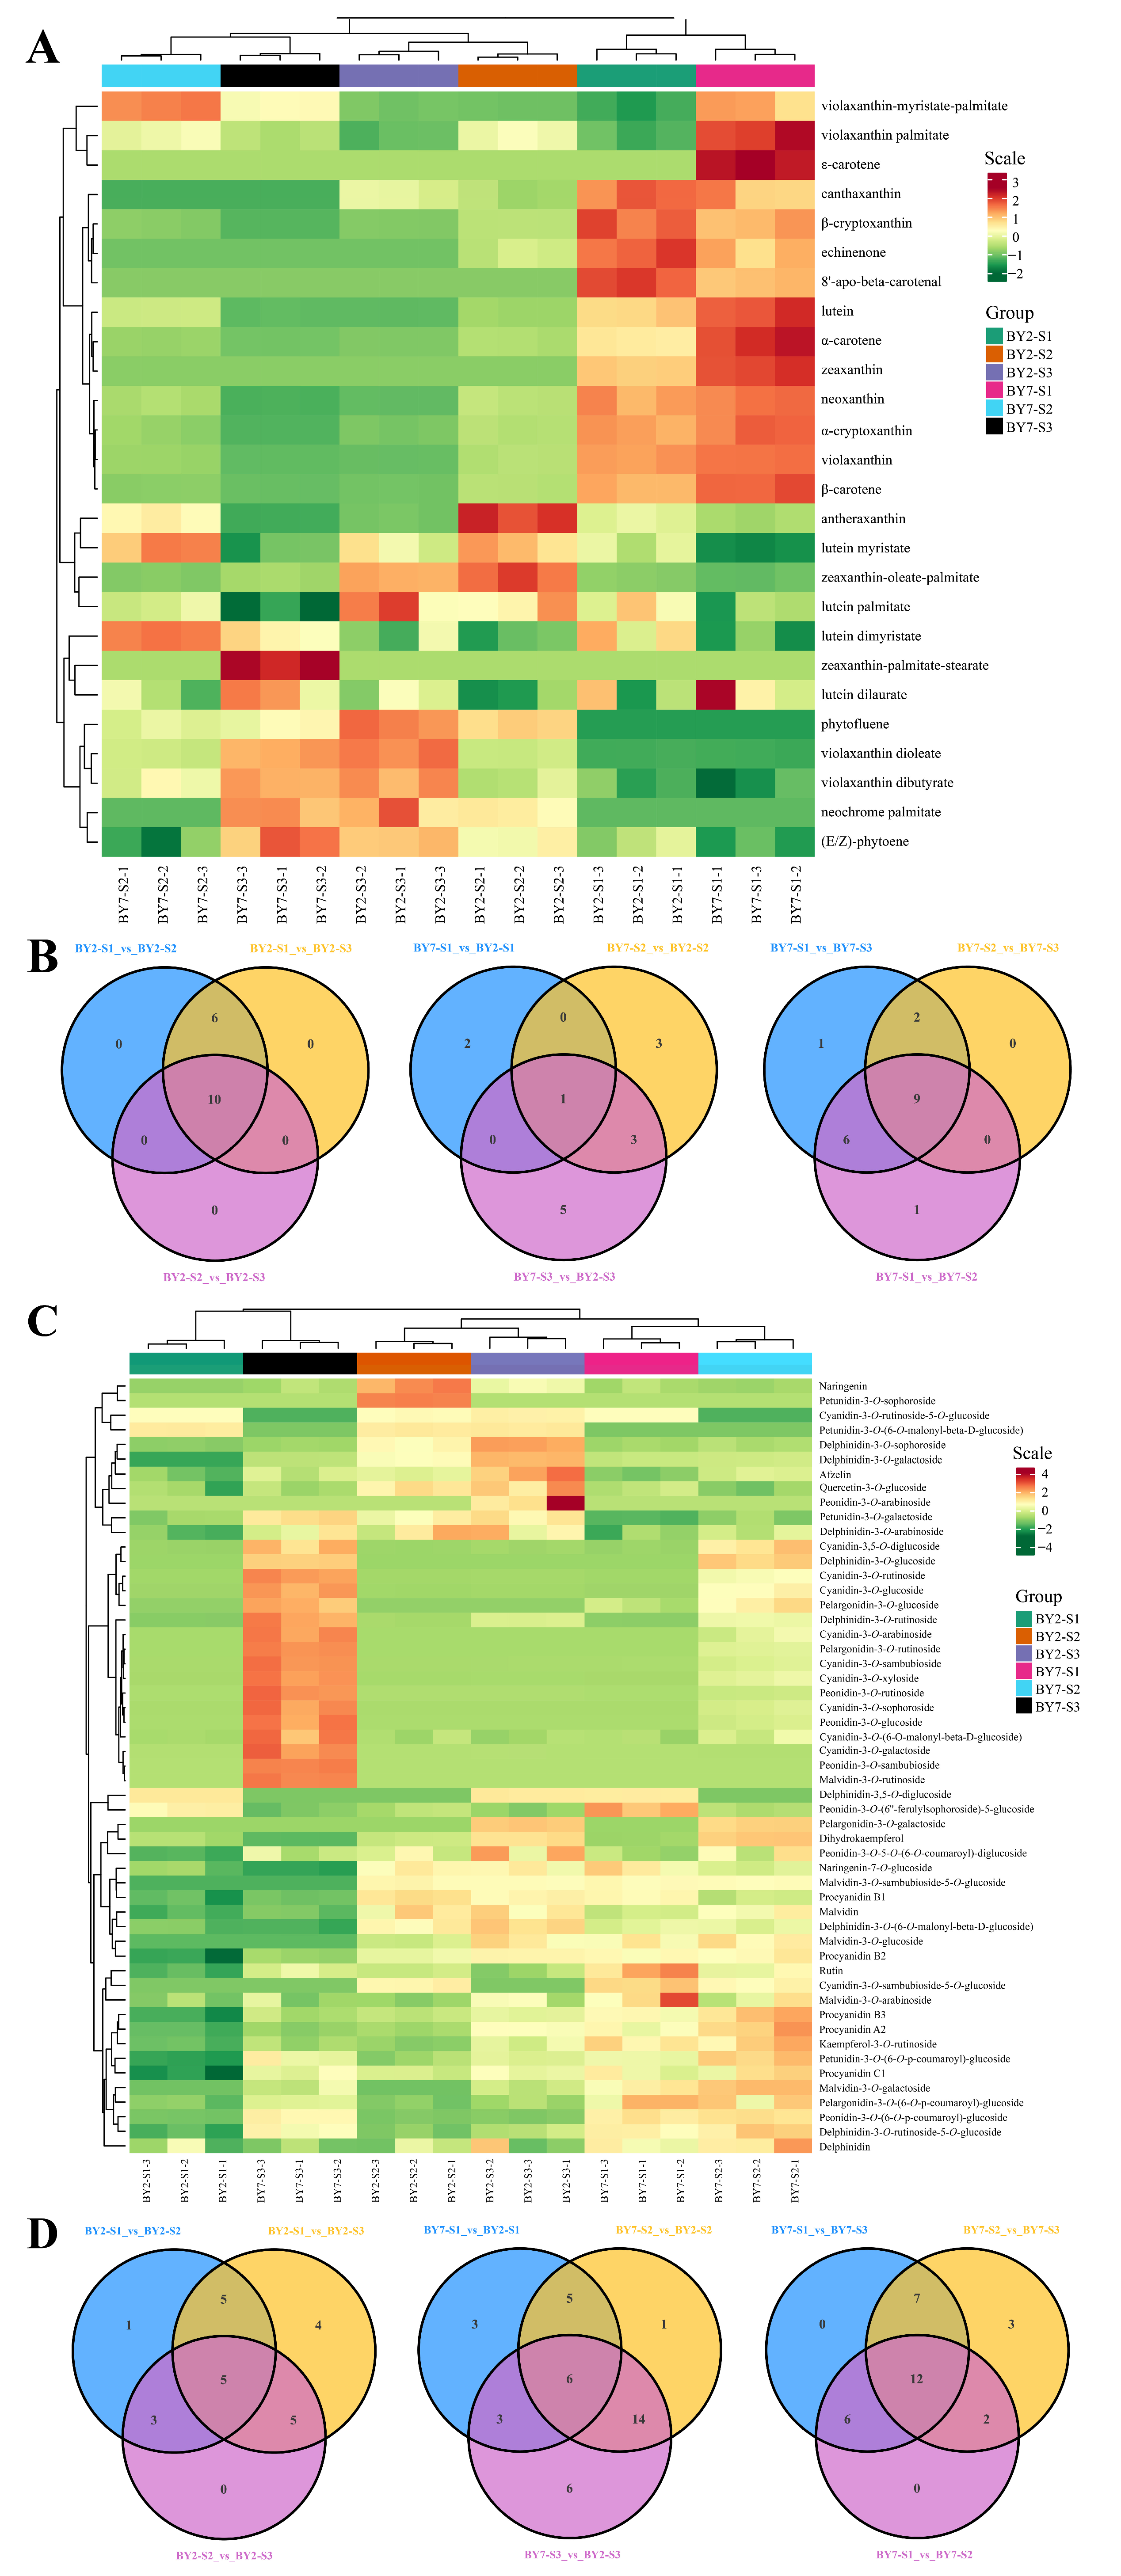
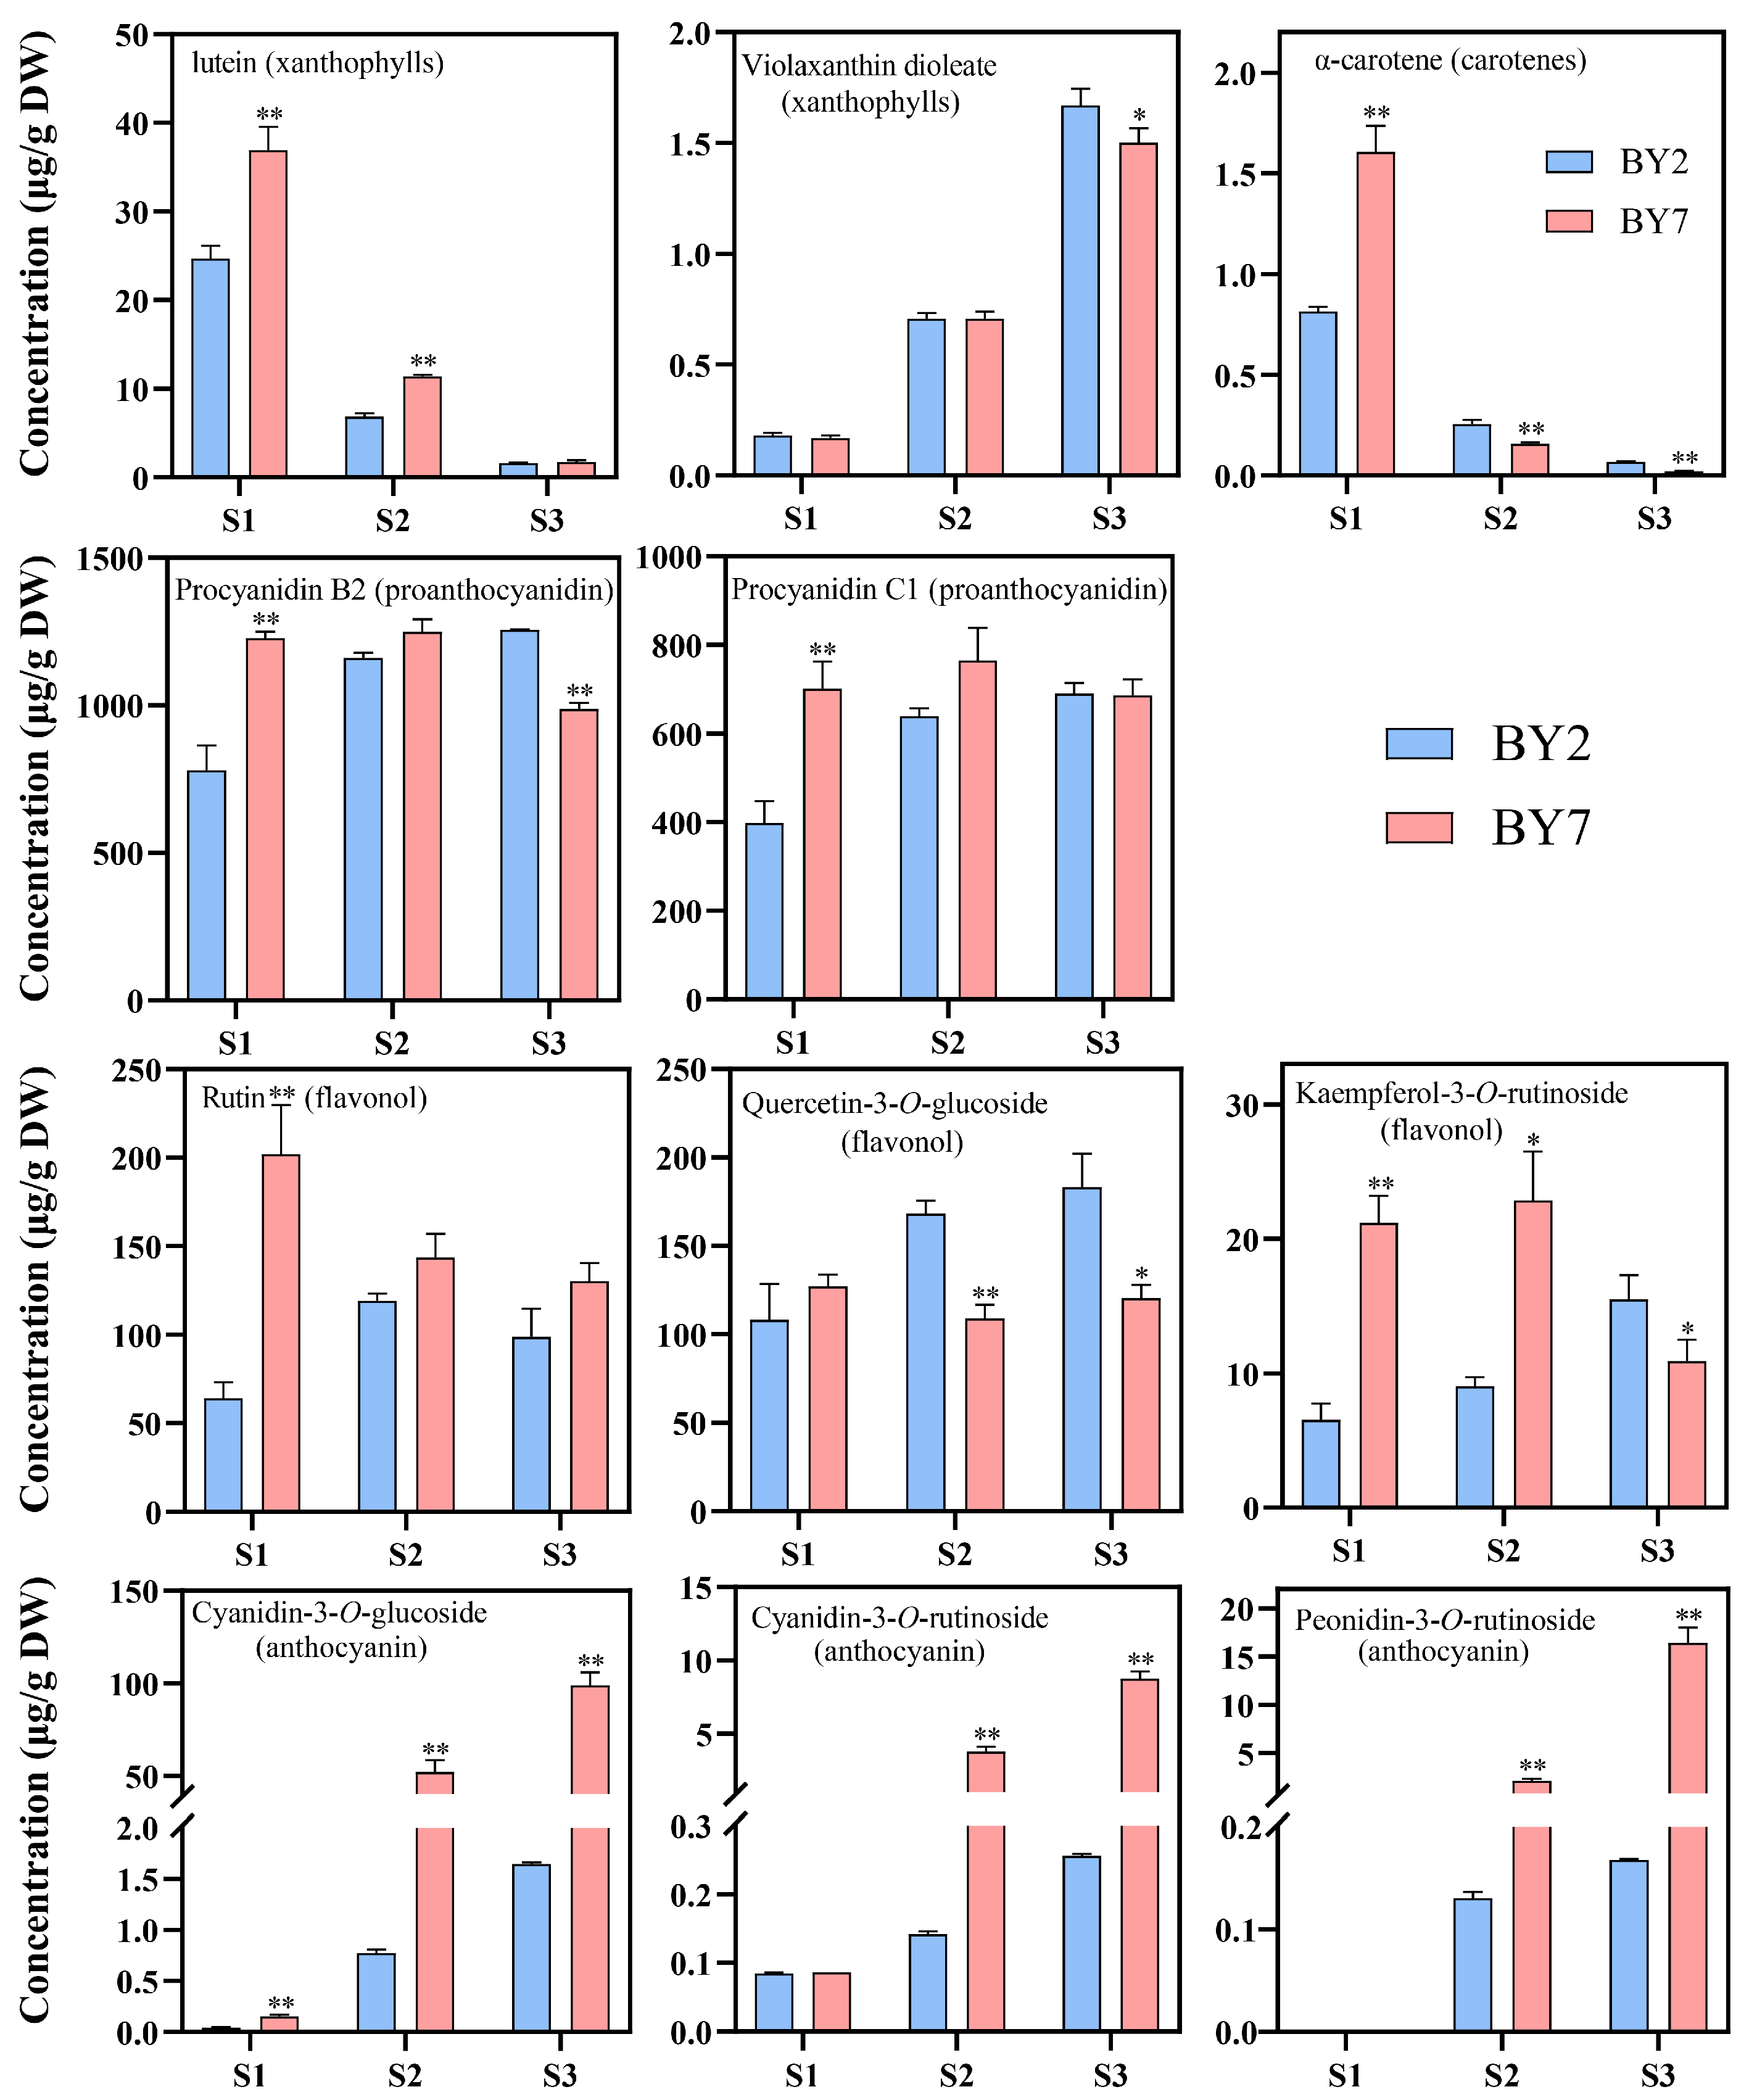
3.2. Carotenoid Accumulation in ‘BY7’ and ‘BY2’

Overall, 26 carotenoid molecules were detected, including 5 carotenoids and 21 luteins (Figure 2A). Luteins were the predominant components, with a content of 36.94 μg/g, while the other components all showed levels lower than 2.00 μg/g (Figure 3). When comparing each group, 21 carotenoids were screened out as differential metabolites (Figure 2B). Meanwhile, nine differential metabolites were identified across S1–S3 in the red cultivar ‘BY7’ and 10 were identified across S1–S3 in the yellow cultivar ‘BY2’ (Figure 2B). However, comparisons between the ‘BY7’ and ‘BY2’ cultivars in the S1, S2, and S3 phases revealed the presence of only one common metabolite—violaxanthin-myristate-palmitate. This indicated that there was relatively little difference in the types and contents of carotenoids in the peels of the ‘BY7’ and ‘BY2’ cultivars. However, the levels of carotenoids in the same cultivar varied greatly across different developmental stages. Although carotenoids showed greater accumulation in the yellow peel of ‘BV2’, the absolute carotenoid content was low in both the rambutan cultivars. The largest amount of total carotenoids in ‘BY7’ was observed at the S1 stage (43.73 μg/g). Meanwhile, the largest amount of total carotenoids in ‘BY2’ was much lower at only 30.11 μg/g (Table S2). Based on past experience, this carotenoid content appeared insufficient for conferring the golden color to the peel of the ‘BY2’ cultivar. It was even more puzzling that the carotenoid content of both ‘BY7’ (red) and ‘BY2’ (yellow) gradually decreased as the fruit matured. At the S3 stage, the carotenoid content in ‘BY7’ and ‘BY2’ was 4.93 μg/g and 5.21 μg/g, respectively (Table S2). Obviously, these low levels of carotenoids did not seem enough to impart a vivid yellow color to the ‘BV2’ yellow cultivar. Hence, the findings strongly suggested that carotenoids may only have a ‘passer-by role’ in the colorification of the rambutan peel, both in the red cultivar and the yellow cultivar. That is, they may not affect the final color of these peels at maturity.

3.3. Flavonoids Accumulation in the ‘BY7’ and ‘BY2’ Rambutan Cultivars
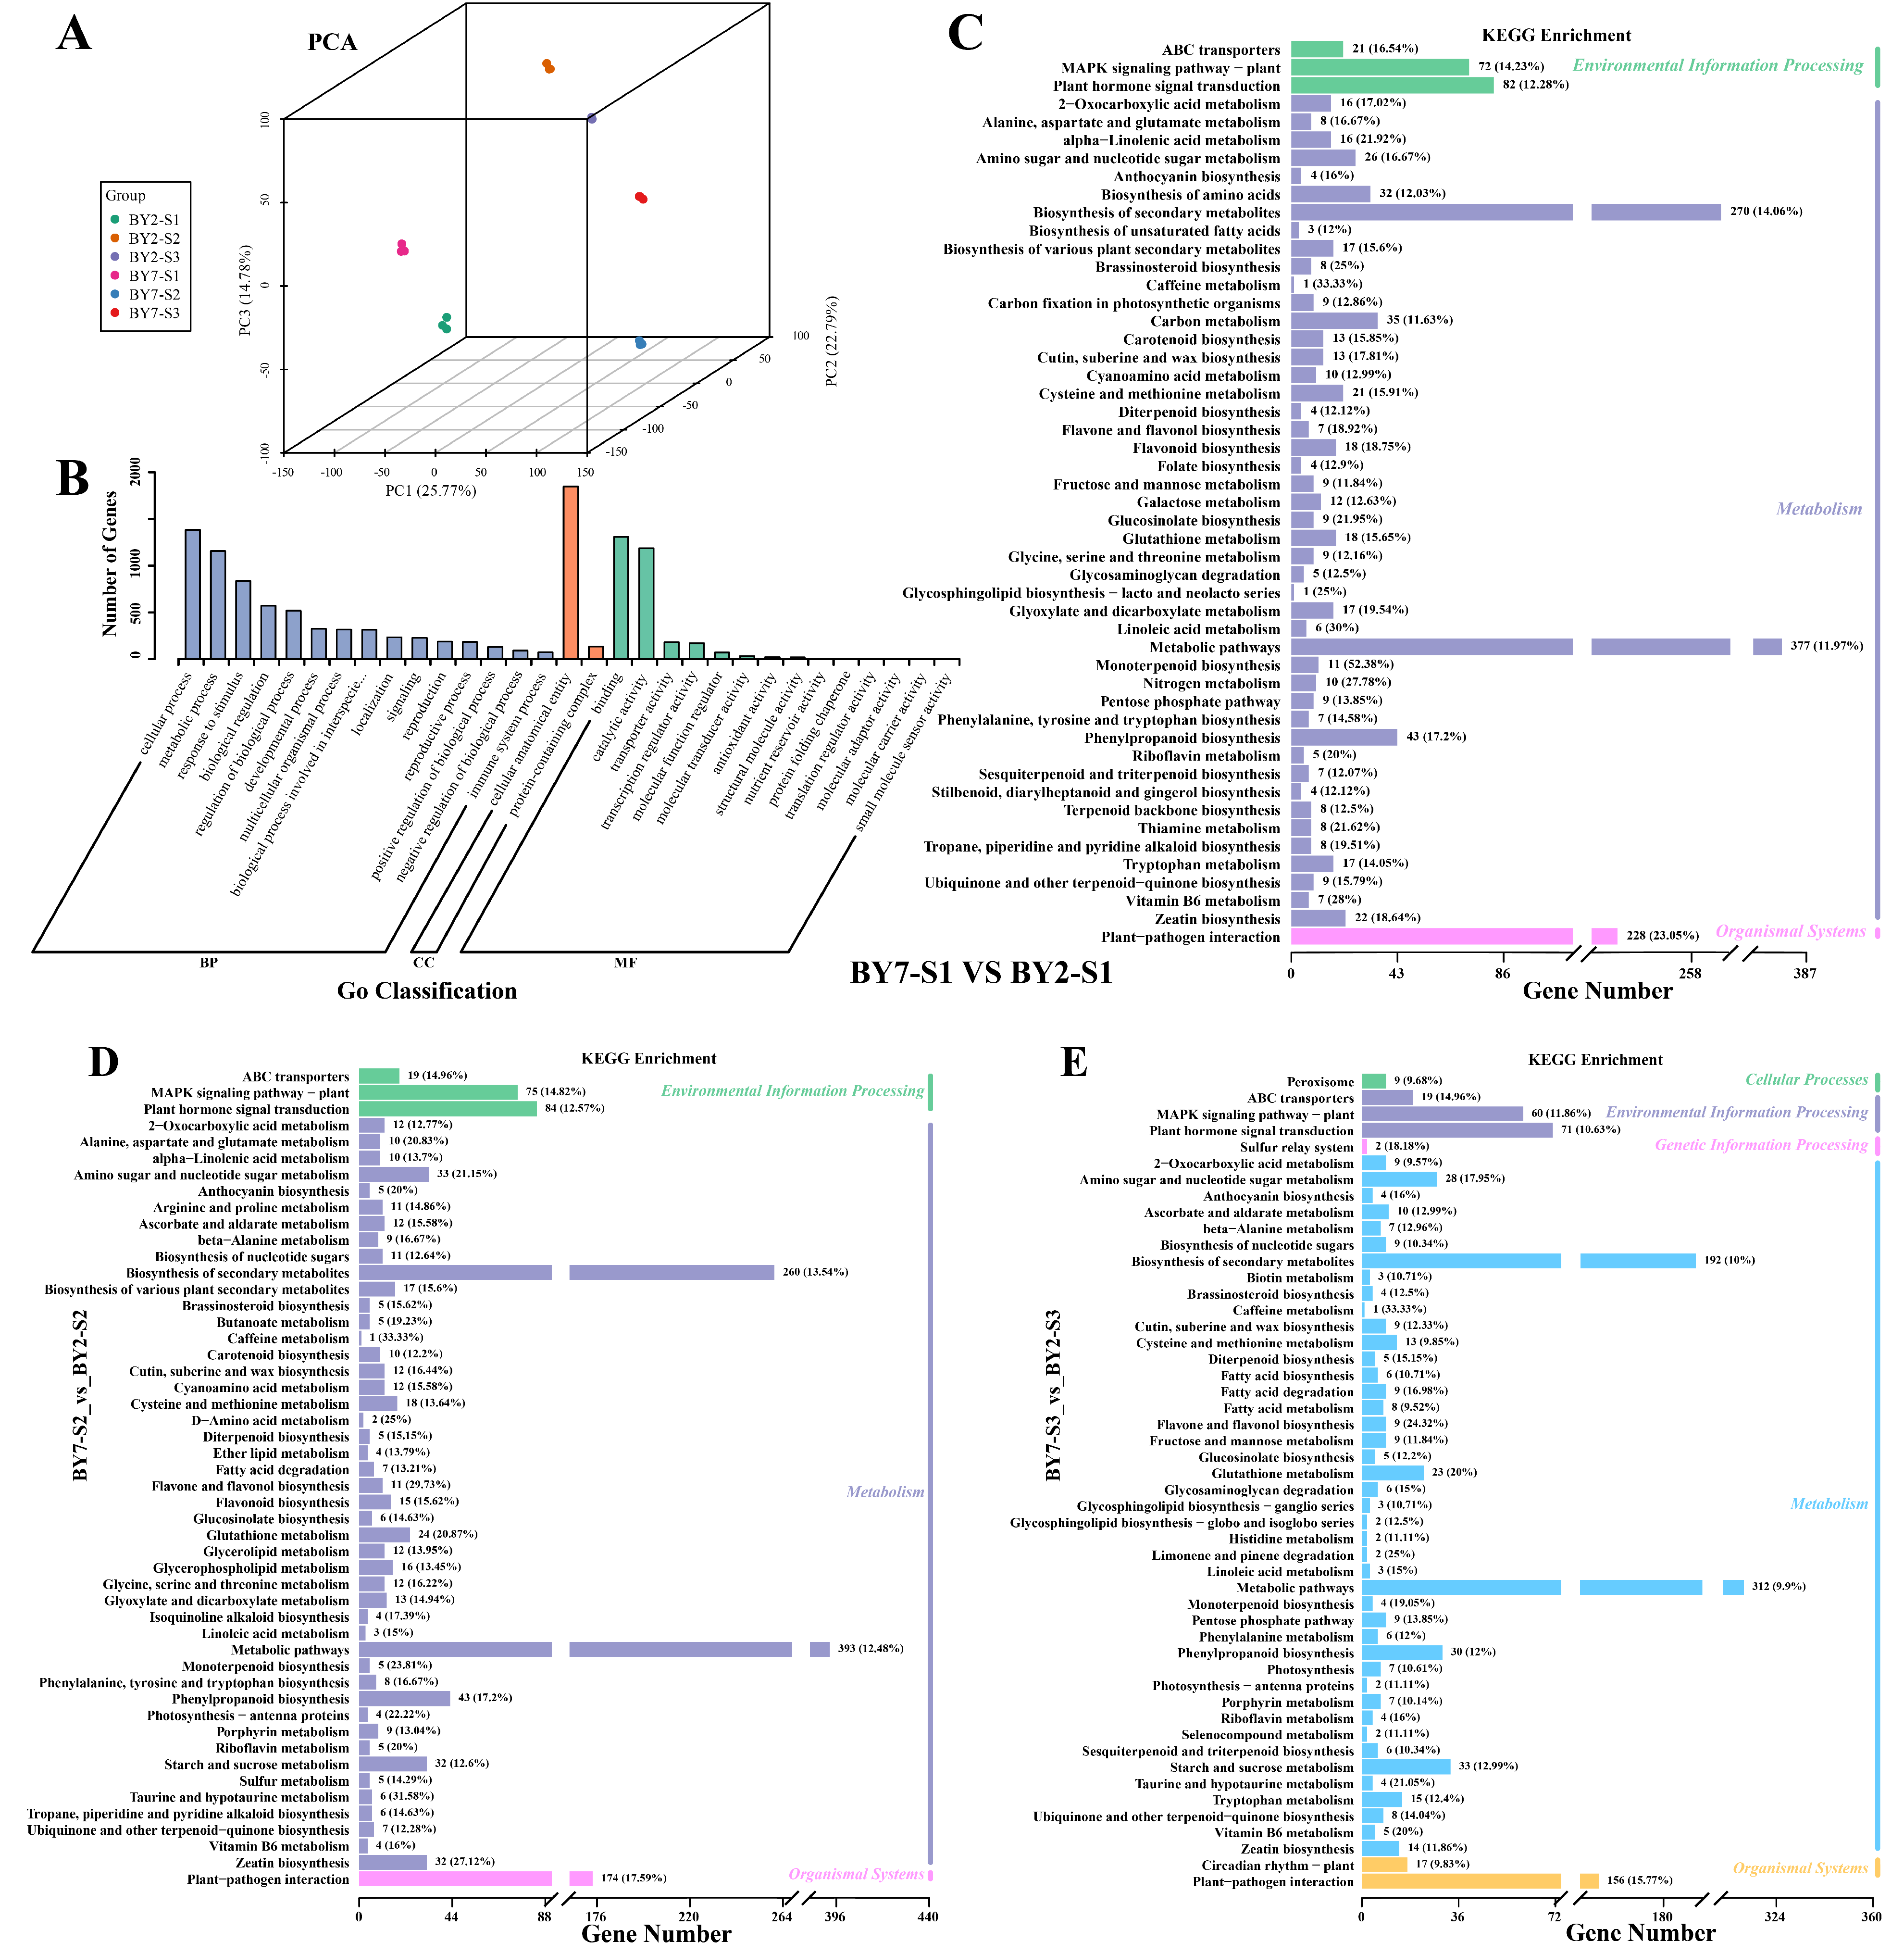
A total of 53 flavonoid species were detected, including 41 anthocyanins (11 Cyanidins, 9 Delphinidins, 6 Malvidin, 4 Pelargonidin, 7 Peonidin, and 4 Petunidin) (Figure 2C). In addition, there were five types of PAs and seven types of flavonols (Figure 2C). Among them, a total of 39 types of flavonoid components were found to be differential metabolites. In total, 30 types of differential flavonoid components were identified in the comparison of ‘BY7’ at different developmental stages and 23 were identified in the comparison of ‘BY2’ at different developmental stages. Notably, proanthocyanidin B1 was only found in ‘BY2’ (Figure 2D). There were 38 different metabolites discovered in the comparison of the ‘BY7’ and ‘BY2’ rambutan cultivars at different developmental stages (S1, S2, and S3). Notably, Delphinidin-3-O-rutinosid-5-O-glucoside, Petunidin-3-O-(6-O-malonyl-beta-D-glucoside), Procyanidin B3, and Rutin were the only differential metabolites identified in the comparison of the ‘BY7’ and ‘BY2’ cultivars (Figure 2D). Notably, 29 differential flavonoids were found in the BY7-S3_Vs_BY2-S3 comparison, indicating significant differences in the color development process between these two cultivars at the S3 stage (Figure 2D). The main flavonoids present in the peels of the ‘BY7’ and ‘BY2’ cultivars were PAs and relatively low levels of flavonols and anthocyanins were detected. During fruit development, the total flavonoid content of the red cultivar ‘BY7’ showed a decreasing trend and the contents of total flavonoids and total PAs decreased significantly. Meanwhile, the total anthocyanin content increased significantly and was 56.74 times higher in the S3 period than in the S1 period (Table S3). On the contrary, the total amount of flavonoids in ‘BY2’ showed a positive correlation with fruit maturity. Specifically, the contents of total anthocyanins, total flavonols, and total PAs all tended to increase as the fruit matured. The main reason for this change was the accumulation of total flavonoids and total procyanidins, whose content increased by 126.21 and 776.53 μg/g DW, respectively. Meanwhile, the absolute content of anthocyanins remained relatively low (Table S3). Procyanidin B2 and C1, the main types of PAs, showed concentrations of 988.53 and 686.20 μg/g DW and 1255.93 and 690.73 μg/g DW in BY7 and BY2 at maturity, respectively (Figure 3). Quercetin-3-O-glucoside, Rutin, and Kaempferol-3-O-rutoside were the major types of flavonols and their concentrations were 120.55 and 183.18 μg/g DW, 130.28 and 98.94 μg/g DW, and 10.90 μg/g and 15.49 DW in BY7 and BY2 during the S3 period, respectively (Figure 3).

3.4. RNA Seq

RNA-seq analysis of 18 rambutan peel samples yielded 45,403,508–74,150,954 raw reads, from which 44,327,470–71,883,730 clean reads and 6.65–10.78 G clean bases were obtained by filtering (Table 1). The sequencing error rate across all samples was 0.03% and the contents of Q20, Q30, and GC were 96.68–97.43%, 91.30–92.73%, and 45.38–45.88%, respectively (Table 1). Using principal component analysis (PCA), the samples could be grouped into six categories, corresponding to the three developmental stages of the ‘BY7’ and ‘BY2’ cultivars (Figure 4A).
In total, 2926 DEGs were detected in the BY7-S1_vs_BY2-S1 comparison. Among them, 1436 genes were highly expressed in BY7-S1 and 1490 genes were highly expressed in BY7-S1 (Table S4). In total, 2758 DEGs were detected in the BY7-S2_vs_BY2-S2 comparison, of which 1340 genes were highly expressed in BY7-S1 and 1418 genes were highly expressed in BY7-S1 (Table S4). Furthermore, 2369 DEGs were detected in BY7-S3_vs_BY2-S3, including 957 genes with high expression in BY7-S1 and 1412 genes with high expression in BY7-S1 (Table S4).
Gene ontology (GO) revealed that most DEGs could be annotated into the modules of biological processes (BP) and molecular functions (MF). In the cell composition (CC) module, the highest enrichment of DEGs from the BY7-S1_vs_BY2-S1, BY7-S2_vs_BY2-S2, and BY7-S3_vs_BY2-S3 comparisons was observed for cellular anatomical entities (Figure 4B and Figure S1). Most BP genes were involved in cellular processes (1383, 1318, and 1071 genes in the three comparison groups, respectively), metabolic processes (1157, 1150, and 878 genes, respectively), and the response to stimulus (838, 778, and 618 genes, respectively) (Figure 4B and Figure S1). The MF genes were mainly involved in binding (1308, 1214, and 1024 genes, respectively) and catalytic activity (1187, 1136, and 922 genes, respectively) (Figure 4B and Figure S1).
Based on KEGG analysis, the DEGs were linked to metabolism, including metabolic pathways (377, 393, and 312 genes, respectively) and the biosynthesis of secondary metabolites (270, 260, and 192 genes, respectively) (Figure 4C–E). Other pathways with a high gene abundance included the plant–pathogen interaction (228, 174, and 156 genes, respectively), plant hormone signal transduction (82, 84, and 71 genes, respectively), MAPK signaling pathway–plants (72, 85, and 60 genes, respectively), phenylpropanoid biosynthesis (42, 43, and 33 genes, respectively), and starch and sucrose metabolism (0, 32, and 33 genes, respectively) (Figure 4C–E).

3.5. Dynamics of DEG Expression

The effects of different developmental stages on gene expression were analyzed. The DEGs were analyzed using Mfuzz and the genes were classified into 12 clusters (Figure S2). Clusters 2, 3, 6, 7, 8, 9, 10, and 12 showed no obvious response to fruit development. However, genes in Clusters 1, 4, and 5 showed down-regulation as the red cultivar ‘BY7’ and the yellow cultivar ‘BY2’ matured. Meanwhile, genes in cluster 11 were up-regulated during development (Figure S2). Therefore, the genes in Clusters 1, 4, and 5 and those in Cluster 11 were denoted as developmental negative response and developmental positive response genes, respectively.

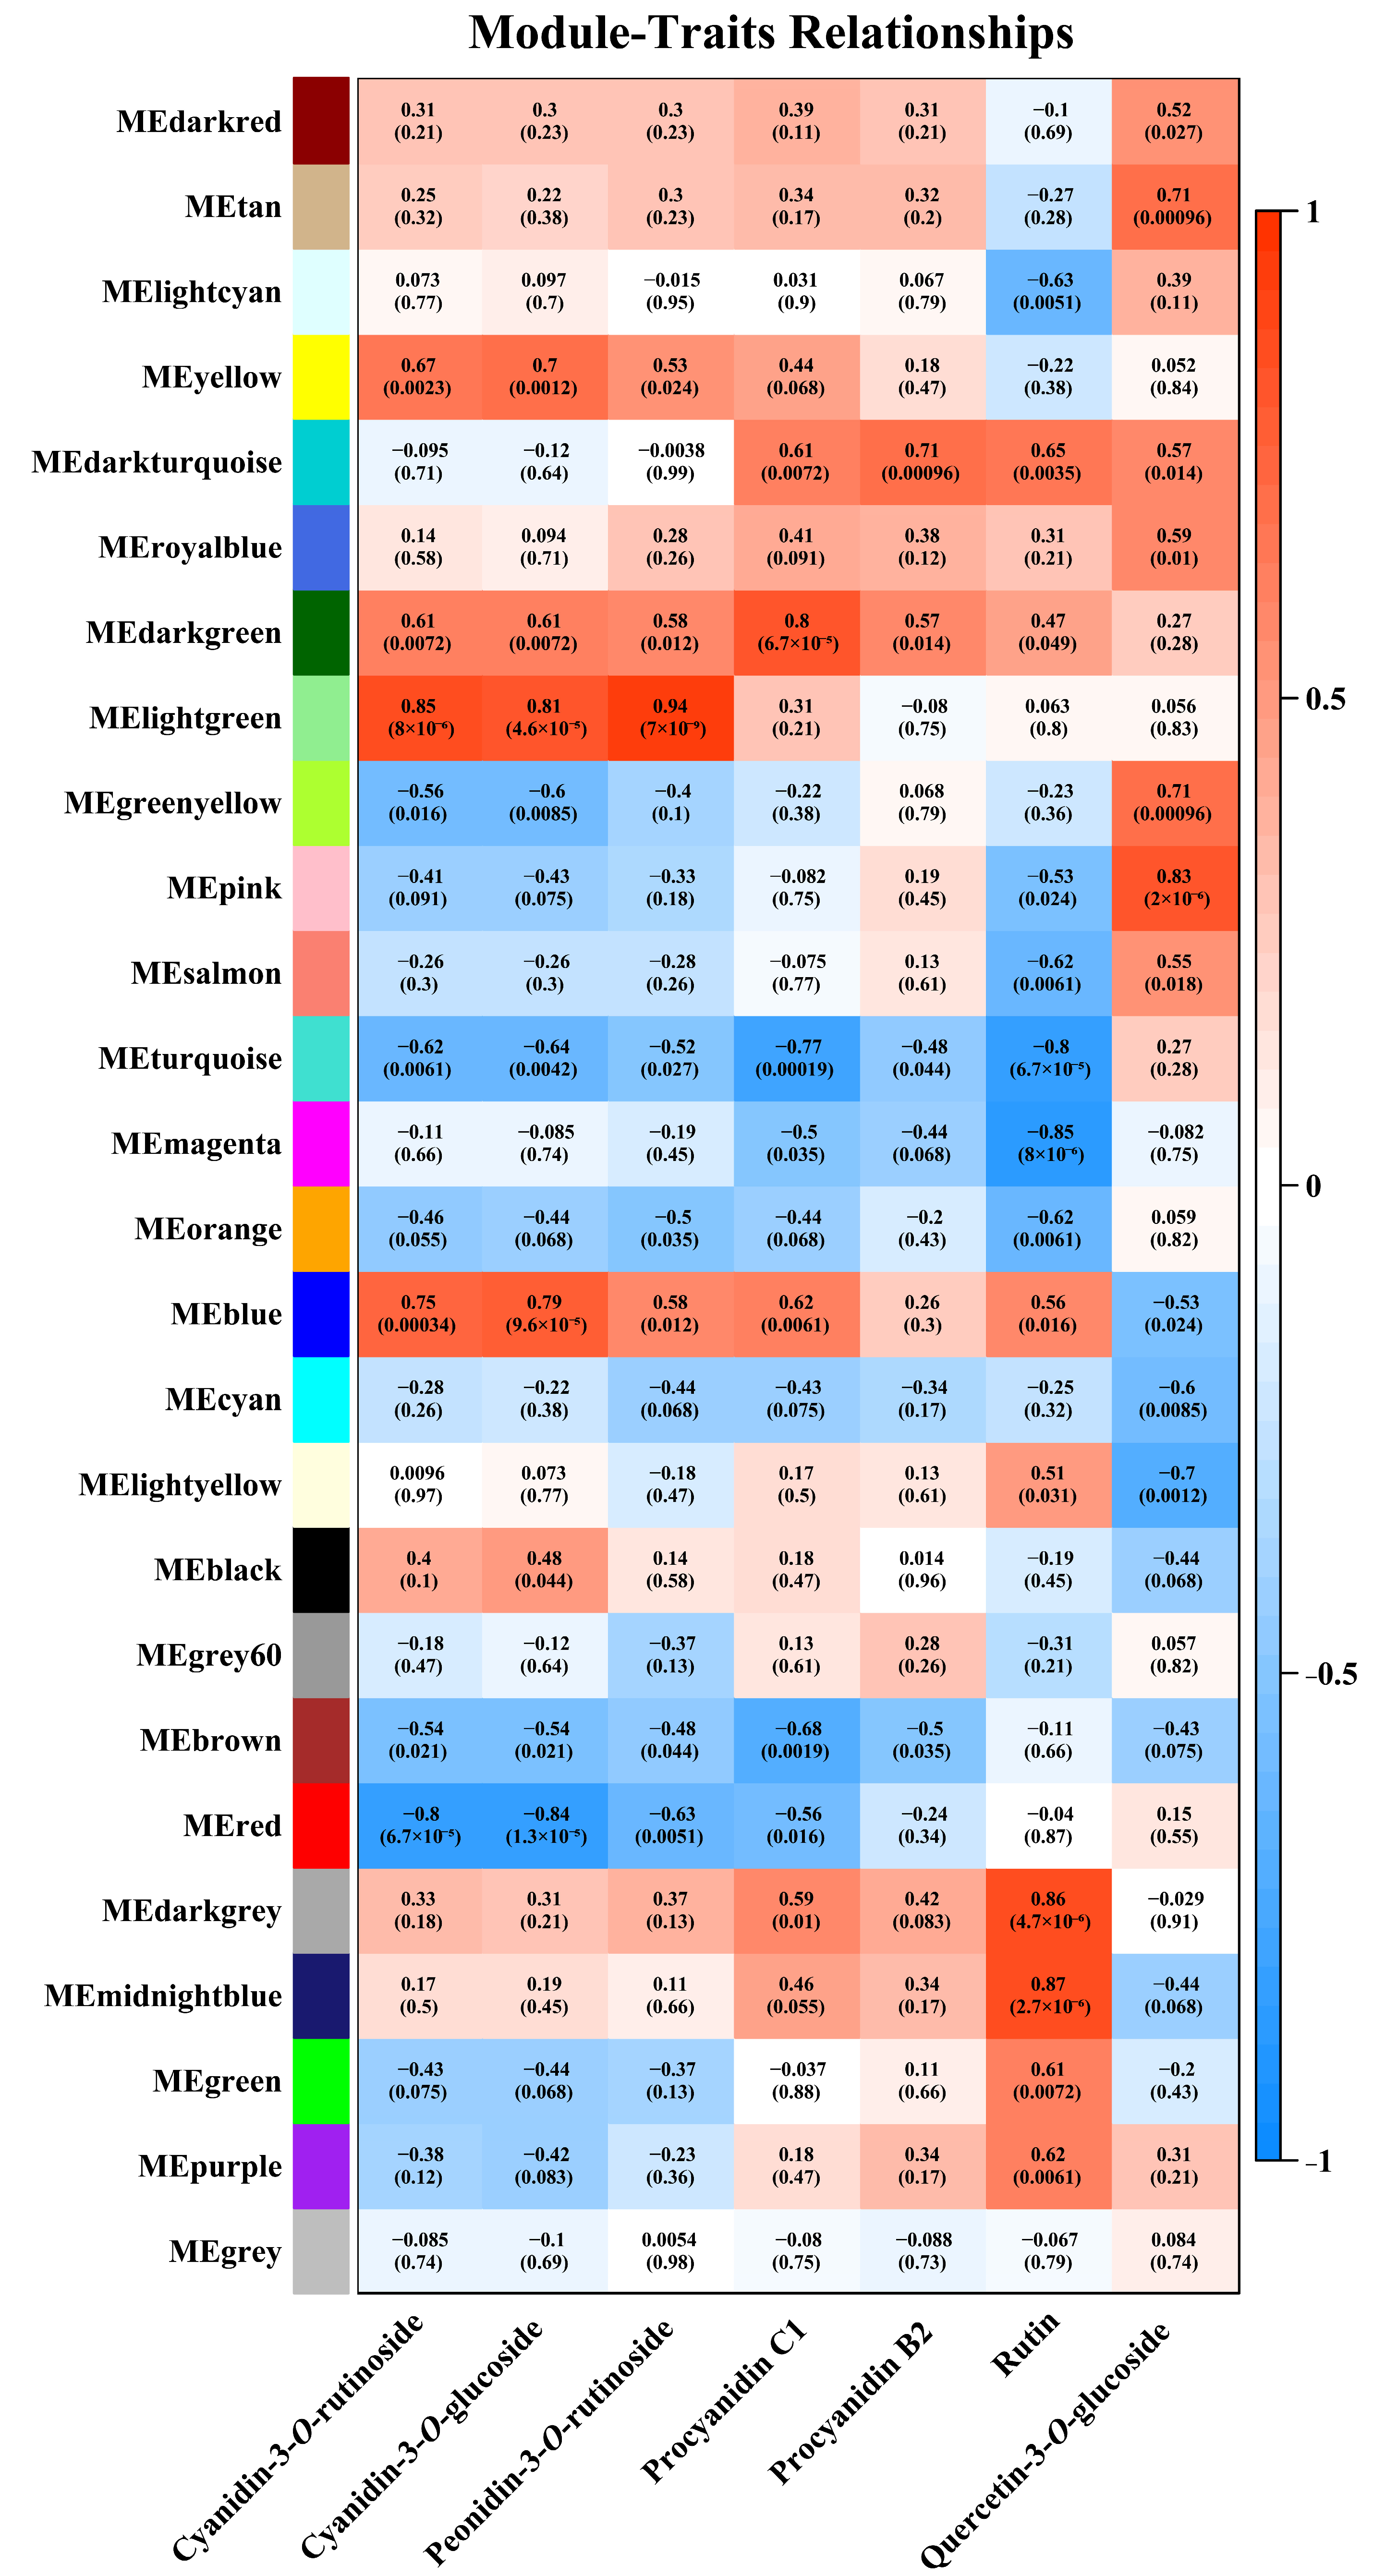
3.6. Flavonoid-Related DEGs Identified via WGCNA

Based on WGCNA, genes associated with flavonoid synthesis were identified and 26 modules were established (Figure 5). Within the relationships of module traits, some correlations between phenotype and genome expression were identified. The analysis of module–trait relationships showed that the light green module had a strong positive correlation with the levels of Cyanidin-3-O-rutinoside (r = 0.85, p = 8 × 10⁻⁶), Cyanidin-3-O-glucoside (r = 0.81, p = 4.6 × 10⁻⁵), and Peonidin-3-O-rutinoside (r = 0.94, p = 7 × 10⁻⁹) (Figure 5). Meanwhile, the red module was highly negatively associated with the levels of Cyanidin-3-O-rutinoside (r = −0.8, p = 6.7 × 10⁻⁵) and Cyanidin-3-O-glucoside (r = −0.84, p = 1.3 × 10⁻⁵) (Figure 5). For PAs, the dark green module (r = 0.8, p = 6.7 × 10⁻⁵) showed a highly positive correlation with Procyanidin C1 content. For flavonols, there were two modules with a high positive correlation to Rutin content, namely, the dark grey module (r = 0.86, p = 4.7 × 10⁻⁶) and the midnight blue module (r = 0.87, p = 2.7 × 10⁻⁶). The turquoise module (r = −0.8, p = 6.7 × 10⁻⁵) and magenta module (r = −0.85, p = 8 × 10⁻⁶) showed a high negative correlation with Rutin levels (Figure 5). In addition, the pink module (r = 0.83, p = 2 × 10⁻⁵) showed a high positive correlation with Quercetin-3-O-glucoside levels (Figure 5). Finally, according to the threshold value (±0.8), a total of eight modules were obtained. These were the light green, red, dark green, dark grey, midnight blue, turquoise, magenta, and pink modules. Genes from these modules were considered candidate genes associated with the regulation of flavonoid compound biosynthesis in rambutan peels.

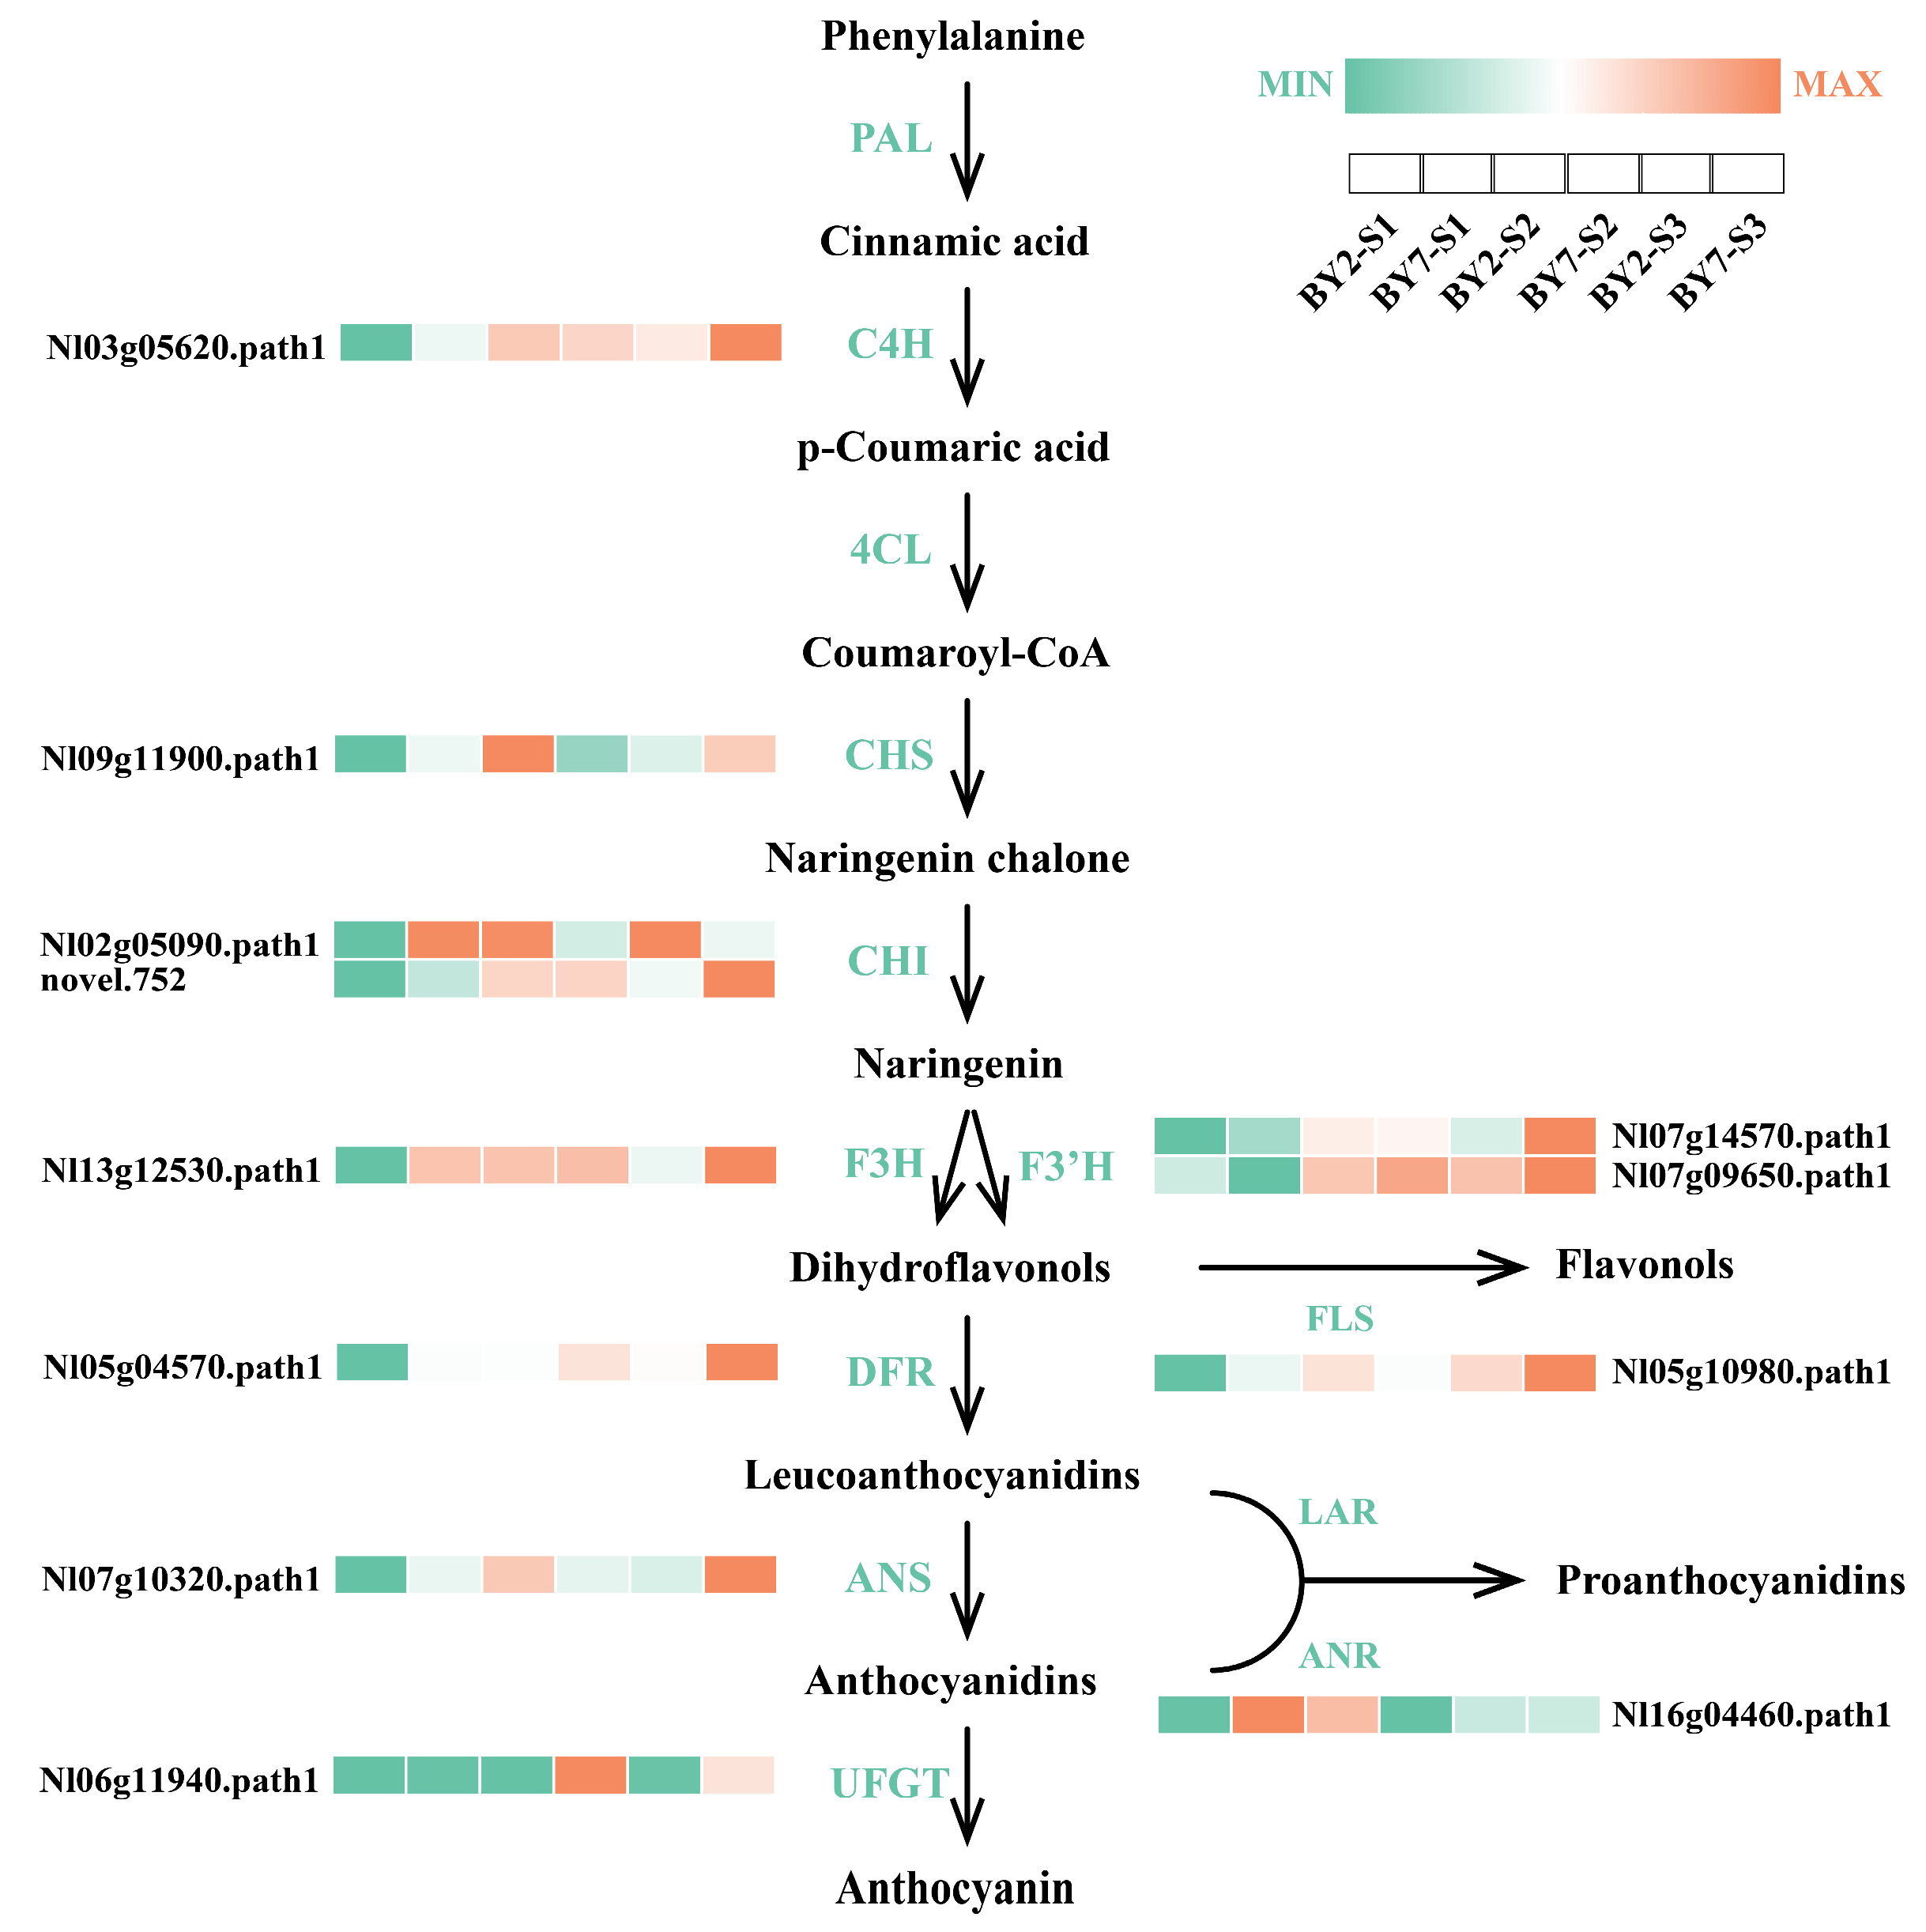
3.7. Structural Genes Associated with Flavonoid Biosynthesis

The key genes required for the synthesis of flavonoids in rambutan were determined by screening for structural genes enriched for flavonoid synthesis on KEGG pathway analysis according to their expression levels. Accordingly, we selected 12 key structural genes in total. This included one C4H gene, one CHS gene, two CHI genes, one F3H gene, two F’3H gene, one DFR gene, one ANS gene, one UFGT gene, one FLS gene, and one ANR gene (Figure 6). When the expression of these genes was compared between the two rambutan cultivars ‘BY7’ and ‘BY2’ at the same stage, they were largely found to be higher in ‘BY7’ (Figure 6). For example, at the S1 stage, CHS, F3H, F3’H (Nl07g14570. path1), DFR, ANS, and ANR levels were 2.57, 2.76, 3.82, 2.18, 3.95, and 2.79 times higher in ‘BY7’ than in ‘BY2’, respectively (Figure 6). In addition, at the S3 stage, F3’H (Nl07g14570. path1) and ANS showed 2.40 and 2.19 times higher levels in the ‘BY7’ fruit peel than in the ‘BY2’ fruit peel, respectively. The structural gene UFGT—closely related to anthocyanin synthesis—was the most significantly expressed in ‘BY7’ when compared to ‘BY2’. The expression levels of UFGT in ‘BY7’ were astonishingly 36.99 and 14.99 times higher compared to the levels in ‘BY2’ at S2 and S3, respectively (Figure 6). However, only CHS and ANR showed significantly higher expression levels in the ‘BY2’ peel at S2 than in the ‘BY7’ peel at S2 (2.88 and 2.42 times, respectively) (Figure 6). However, the levels of other structural genes at other stages were comparable across the two rambutan cultivars ‘BY7’ and ‘BY2’.

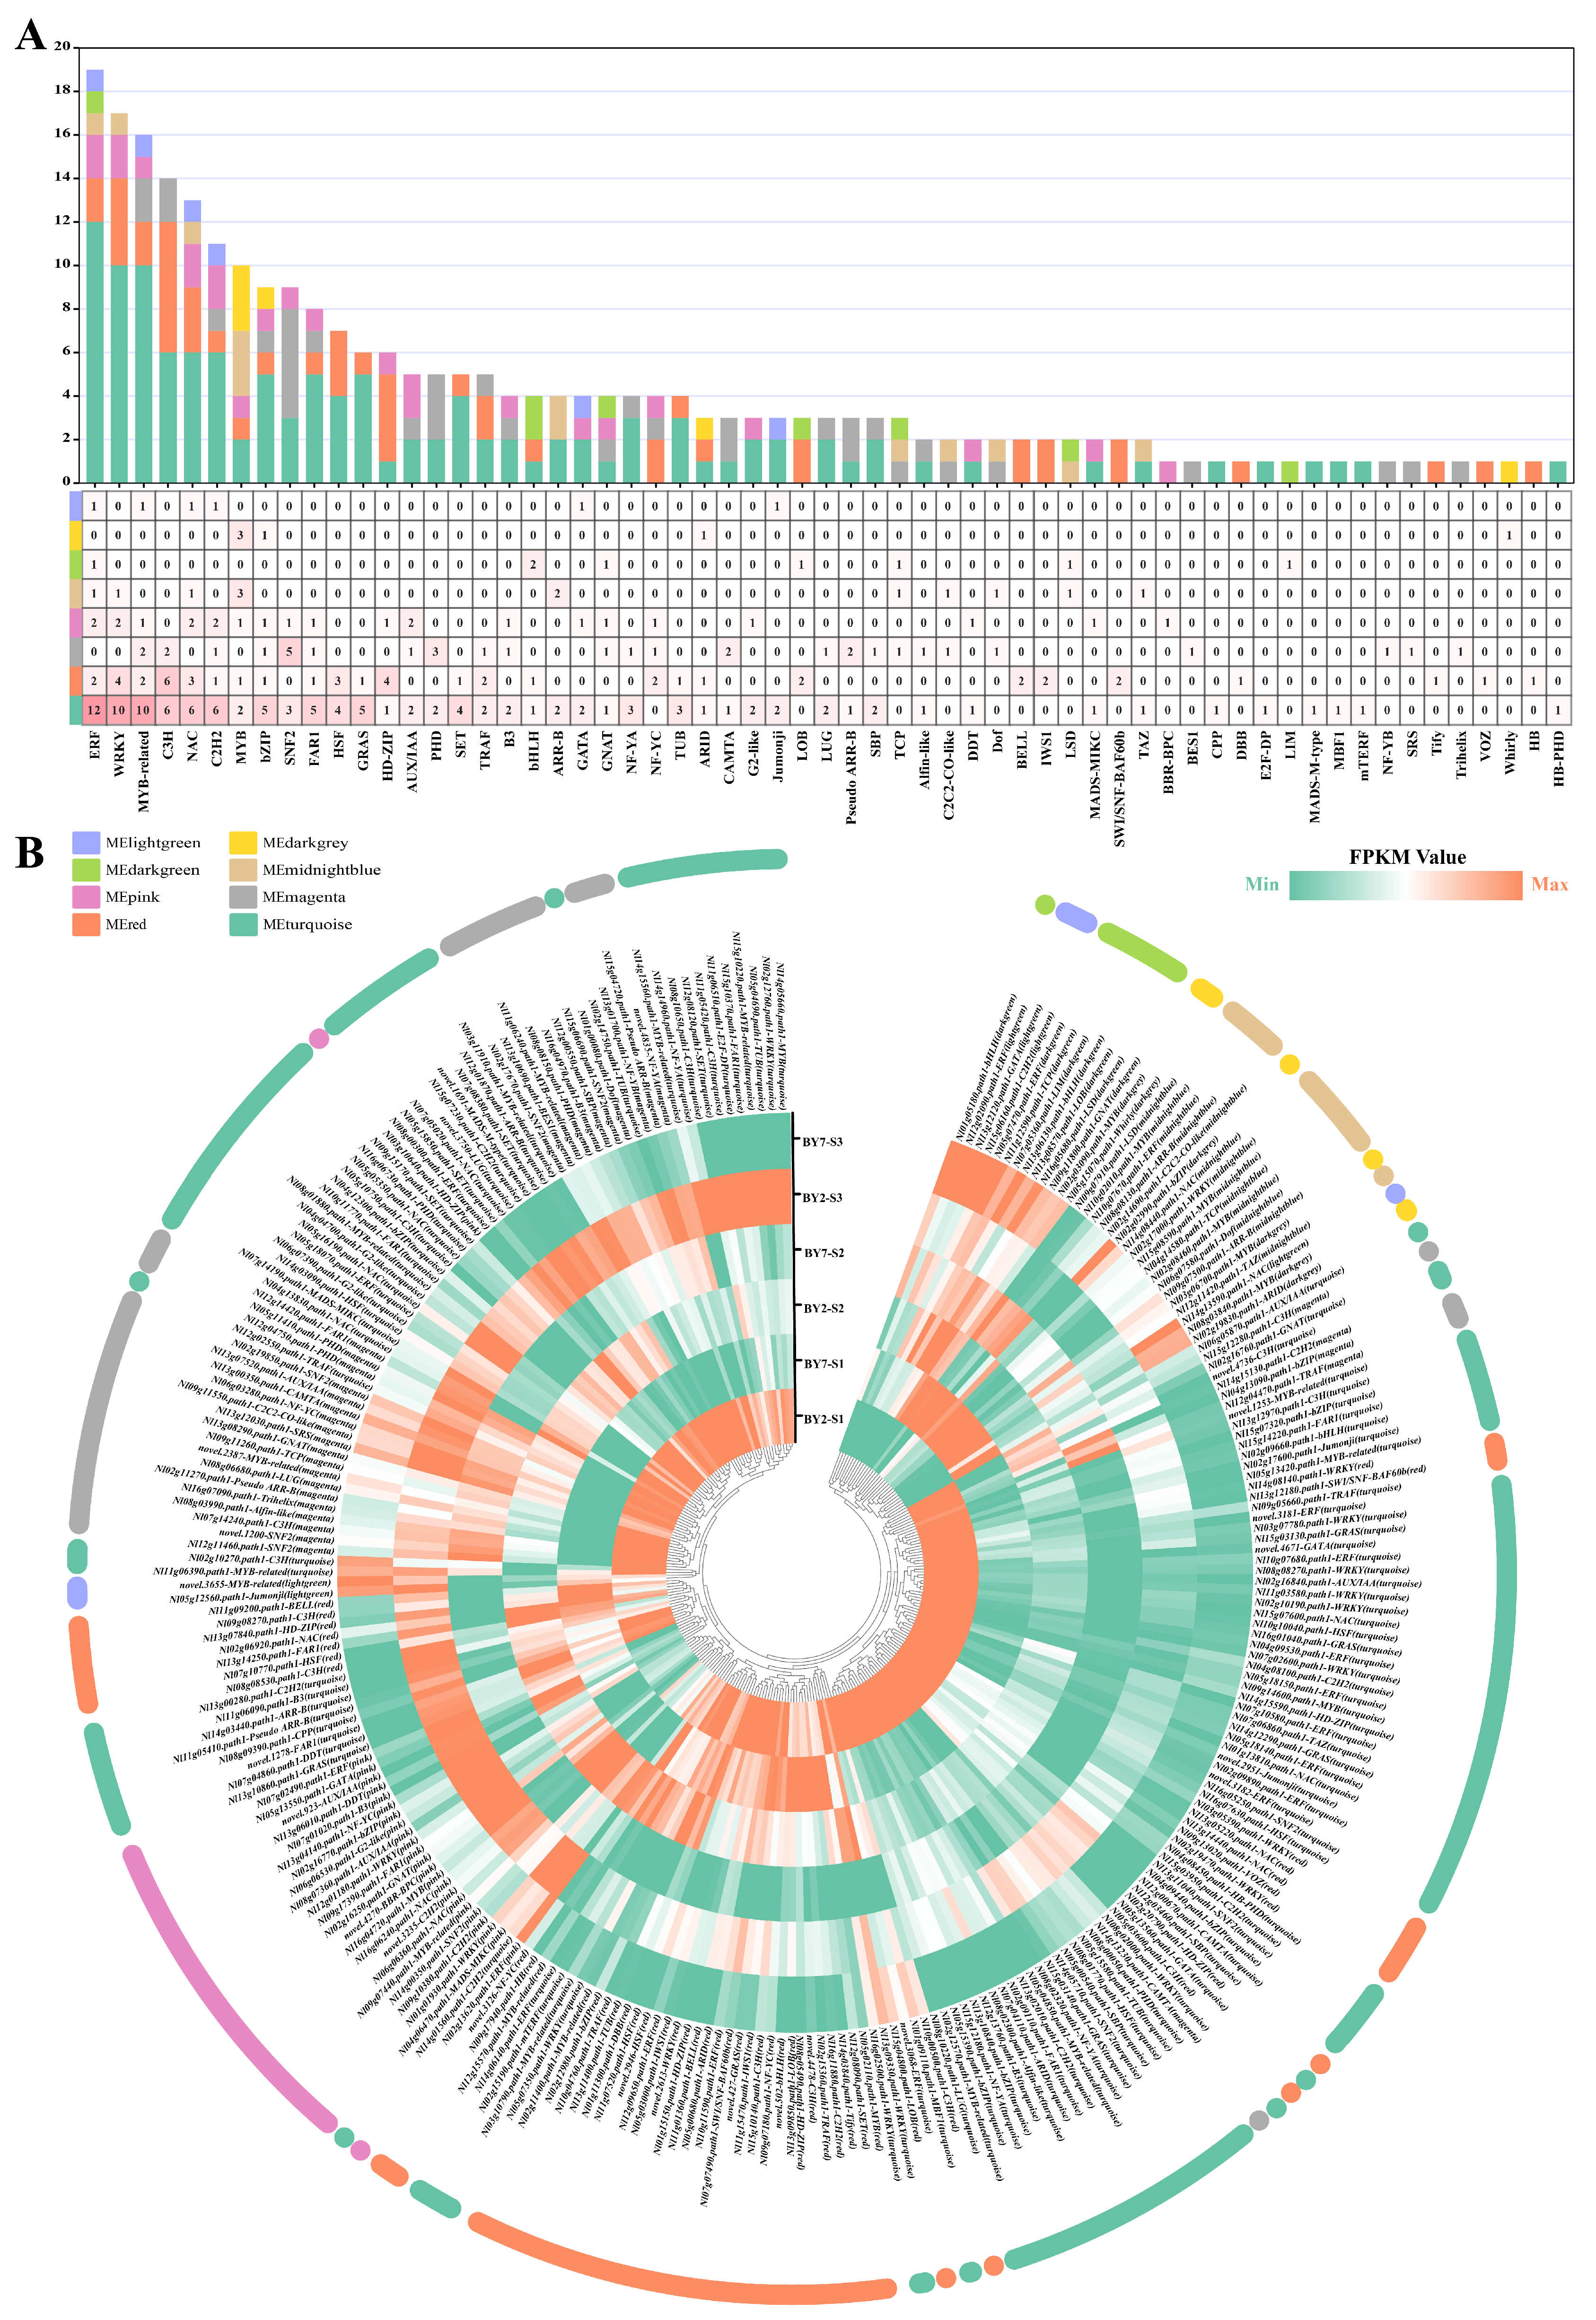
3.8. Regulatory Genes

Ultimately, a total of 10 MYB genes were linked to flavonoid synthesis via WGCNA (Figure 7A). Among them, seven members showed a positive correlation with flavonol levels and two members showed a negative correlation with the flavonol content (Figure 7A). One member was found to be negatively correlated with the content of anthocyanins (Figure 7A).
WGCNA also yielded four bHLHs (Figure 7A). Two members showed a positive correlation with Procyanidin C1 content and one member each was negatively correlated with the anthocyanin content and flavonol content, respectively (Figure 7A).
In addition to these TFs, another 59 TF gene families regulating flavonoid biosynthesis in the two rambutan cultivars ‘BY7’ and ‘BY2’ were screened. Of these genes, 12 members of the ERF family were negatively correlated with the flavonol content, 3 members showed a positive correlation with flavonol levels, 2 members showed a negative association with the anthocyanin levels, 1 member showed a positive association with anthocyanin levels, and 1 member was positively correlated with the flavonol content (Figure 7A). The WRKY and MYB-related families ranked second and third in terms of the number of members involved in flavonoid biosynthesis, with 17 and 16 members of these families linked to this biosynthetic process, respectively (Figure 7A).
In addition, more than 10 members of the C3H, NAC, and C2H2 TF families were also identified (Figure 7A). It can be seen from the figure that the members of the turquoise and red modules, which showed a negative relationship with the content of Rutin and anthocyanin, respectively, accounted for most of the members of these gene families. Their expression in ‘BY2’ was generally higher than that in ‘BY7’ at the three stages of rambutan maturation (Figure 7B). The light green and pink module genes, which exhibited a positive correlation with anthocyanin and Quercetin-3-O-glucoside levels, were highly expressed in ‘BY7’ and ‘BY2’, respectively. This was in line with the trend of flavonoid metabolite levels (Figure 7B). Hence, these genes may be closely related to flavonoid biosynthesis in the ‘BY7’ and ‘BY2’ cultivars of rambutan.

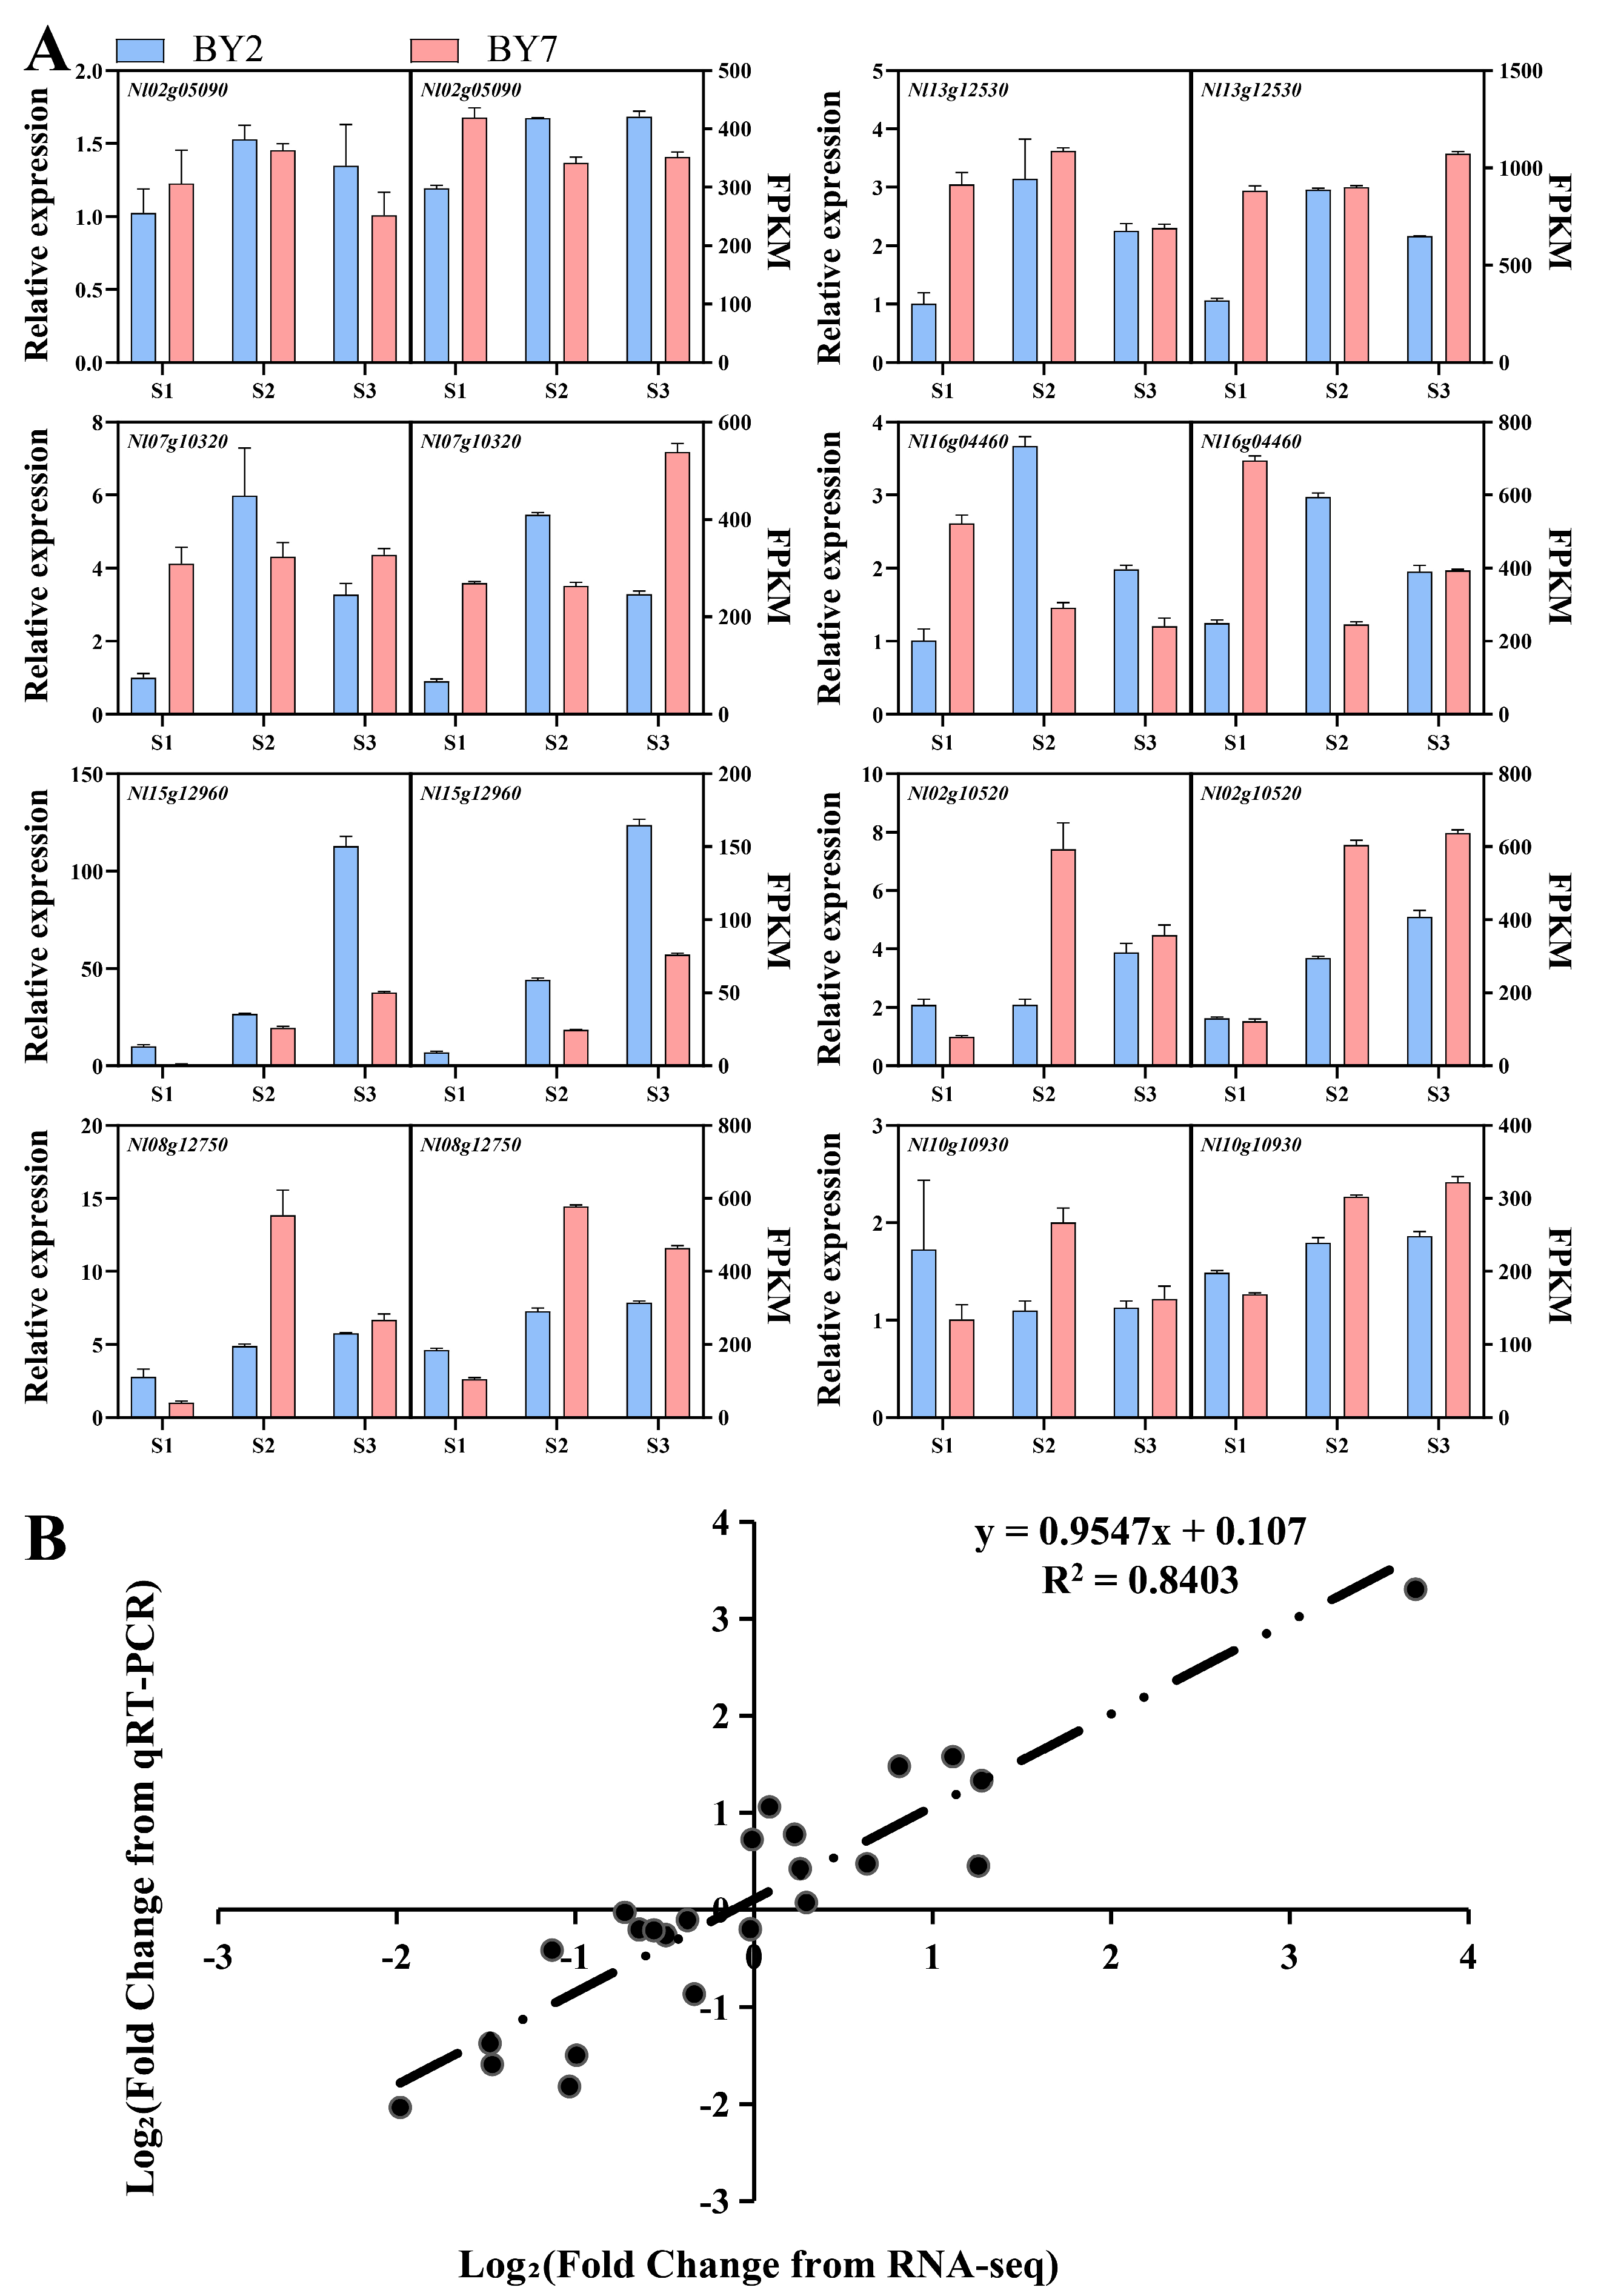
3.9. qPCR Validation

The reliability of RNA-seq data was verified by qPCR analysis of eight randomly selected DEGs. The expression trends of these genes were largely in line with the transcript levels determined using RNA-seq (Figure 8A). The correlation coefficient of the two methods reached 0.8403, which indicated the reliability of the RNA-seq data (Figure 8B).

4. Discussion

Flavonoids have high antioxidant activity. Hence, they can protect plants from adverse environmental factors and are also greatly beneficial for human health [30]. Anthocyanins and flavonols, which are also flavonoid substances, are important chemical components that add color to fruits. At present, although there is abundant research on color development in various types of fruits, the mechanisms of color development in rambutan have been explored to a limited extent. Hence, understanding the colorification mechanisms in different parts of rambutan, including the color of its peels, is important. Typically, the high content of anthocyanins and anthocyanin derivatives is the primary reason for the bright red color of fruit cultivars [31]. Evidence suggests that the types and contents of anthocyanins vary greatly across different plants. Cyanidin 3-galactoside is the main anthocyanin in apples and red pears [32], whereas Cyanidin-3-O-galactoside is the main color-related anthocyanin in red mango cultivars [4]. In the present study, based on metabolomics data, 41 anthocyanins belonging to six classes were identified in rambutan cultivars. The content of these different types of anthocyanins remained very low throughout the process of development in the yellow cultivar ‘BY2’ and did not exceed 2 μg/g DW. In contrast, in the red cultivar ‘BY7’, Cyanidin-3-O-glucoside, Cyanidin-3-O-rutinoside, and Peonidin-3-O-rutinoside appeared to be the three main types of anthocyanins, and their contents increased steadily with fruit maturation, reaching 98.86, 8.76, and 16.43 μg/g DW when the fruits were fully ripe (stage S3), respectively. Interestingly, Cyanidin 3-O-glucoside has been reported to be the most important anthocyanin in the peels of litchi and longan, both of which belong to the Sapindaceae family. This suggests that closely related plants from the same family may contain similar anthocyanin species [33].
The flavonols usually found in plants are common pigments and therefore affect the color of different parts of the plant [34]. These flavonols are known to make plant tissues appear yellowish or yellow [35]. The yellow cultivar ‘BY2’ is a very recent germplasm and only its pulp quality development has been studied so far [24]. Notably, no studies on the peel color of this cultivar have been performed. The golden appearance of the ‘BY2’ rambutan cultivar at maturity can easily be interpreted to result from the accumulation of carotenoids, which are key pigments associated with fruit ripening. However, in our study, the carotenoid levels in ‘BY2’ were found to be relatively low. In fact, these levels gradually decreased with fruit maturation. At the S3 stage in ‘BY2’, the total carotenoid levels were less than 6 μg/g DW and the most abundant lutein—violaxanthin dioleate—only showed an overall content of 1.67 μg/g DW. Such low levels of carotenoids were obviously not sufficient to confer a golden color to the peel of ‘BY2’. Hence, we concluded that carotenoids were not the main pigments that made the peel of ‘BY2’ golden. However, we also found that flavonols show continuous accumulation in the peel of the ‘BY2’ fruit as the fruit ripens. Accordingly, it was speculated that flavonols were the primary substances contributing to the golden-yellow color of ‘BY2’ rambutan. This was consistent with studies on pears, bougainvillea, and monkeyflowers [6,36,37]. Although the flavonol content in the peel of ‘BY7’ was also high, this cultivar did not show a yellow color. This may be related to the shielding effect of chlorophyll during early development and the accumulation of anthocyanins in the upper layer of the peel during late development [38].
While screening for structural genes that potentially regulate flavonoid synthesis pathways in rambutans, 12 key structural genes were obtained. The expression of the early flavonoid biosynthesis genes C4H, CHS, CHI, F3H, and F3’H was examined and it was found that except for F3’H (Nl07g09650. path1), the other genes were highly expressed in ‘BY7’ during the S1 developmental stage. However, during the S2 and S3 stages, there was not much difference in the overall expression of these genes between the ‘BY7’ and ‘BY2’ rambutan cultivars. The differences in the expression of DFR and ANS—shared by the anthocyanin and PA biosynthesis pathways—were significant at the S1 stage. UFGT, the most critical structural gene in anthocyanin synthesis, showed high levels in the red cultivar ‘BY7’. Similar findings regarding this gene have also been reported in other species [39,40]. The expression level of the key gene ANR, which catalyzes the final step of PA biosynthesis, was higher in the ‘BY7’ cultivar at S1 and higher in the ‘BY2’ cultivar at S2. Interestingly, ANR has been shown to induce PA biosynthesis in another plant cultivar [41,42].
Interestingly, although the expression of the key flavonol biosynthesis gene FLS was slightly higher in the ‘BY7’ cultivar during the S1 and S3 stages, the flavonol content in the ‘BY7’ fruit peel showed a downward trend during maturation. Meanwhile, in ‘BY2’, the flavonol content increased significantly and the total flavonol content at the S3 stage in this cultivar was higher than that in ‘BY7’. We believe that this was mainly because the common precursor required for flavonol and anthocyanin synthesis, dihydroflavonol, flowed more toward the anthocyanin synthesis pathway in ‘BY7’. This reduced the flow to the flavonol pathway, ultimately resulting in a lower total flavonol content in ‘BY7’. Previous studies have reported the existence of competition for common substrates between different branches of the flavonoid synthesis pathway [43]. Notably, both ‘BY7’ and ‘BY2’ were planted in Baoting County, Hainan Province, under highly similar growth environments. These cultivars had comparable physiological characteristics as well as a similar total flavonoid content at maturity [24]. From an ecological and evolutionary perspective, we can state that both cultivars produced a large amount of anthocyanins in order to adapt to their similar environment. However, ‘BY7’ tended to accumulate more anthocyanins in its fruit peels, while ‘BY2’ tended to accumulate more flavonols. This phenomenon fully demonstrates the diverse characteristics of these cultivars.
The MBW complex is known to be a key regulator of plant genes involved in flavonoid biosynthesis pathways [17]. An MBW complex—composed of TT2 (AtMYB123), TT8 (AtbHLH42), and TTG1 (WD40)—was found to bind to the promoters of AtANR and AtUFGT and regulate the accumulation of flavonoids in Arabidopsis [41]. It was recently reported that ChMYB1 can interact with ChbHLH42 and ChTTG1 to form an MBW complex that enhances ChUFGT activity and induces anthocyanin synthesis in Cerasus humilis [44]. MYBs are considered key factors for the identification of target gene promoters [45]. In Pyrus bretschneideri, PyMYB114 can induce anthocyanin biosynthesis by interacting with bHLH3 [46]. Recent studies have found that RcMYB1 can activate its own promoter and the promoter of other anthocyanin biosynthesis-related genes in roses, thereby promoting anthocyanin synthesis in rose petals [47]. In strawberries, FaMYB5 has been identified as an R2R3-MYB TF that can bind to the F3’H and LAR gene promoters to enhance anthocyanin and PA production [48]. MdMYB12 and MdMYB22 can induce proanthocyanidin and flavonol synthesis in apples, respectively [49]. In Arabidopsis, MYB12 has been identified as a specific activator of flavonol biosynthesis [50], whereas in pears, bHLH64 has been found to positively regulate anthocyanin biosynthesis via light induction [51].
In addition to possessing positive regulatory effects as activators, MYBs and bHLHs have also been shown to act as suppressors. In pears, the transcription inhibitor PpMYB140 competitively binds to bHLH3 with PpMYB114, thereby inhibiting anthocyanin synthesis [52]. The overexpression of the activator MaMYBPA in bananas induces the expression of the repressor MaMYBPR and these factors collectively regulate PA biosynthesis through competitive synergistic effects [53]. In Brassica napus, BnbHLH92a negatively regulates the synthesis of PAs and anthocyanins in the seed coat [54]. In this study, seven MYBs showed positive correlations with flavonol levels in rambutan peels and two bHLHs showed positive correlations with the PA content of rambutan peels. Two MYBs and one bHLH, as well as one MYB and bHLH, were negatively correlated with the content of flavonols and anthocyanins in the peels, respectively. Hence, in the ‘BY7’ and ‘BY2’ cultivars, most MYBs and bHLHs appear to be involved in flavonol regulation, with only a few regulating the production of PAs and anthocyanins. Surprisingly, no MYBs were found to positively regulate anthocyanin production. Thus, we speculate that other key TFs may be involved in the positive regulation of anthocyanins in rambutan.
Beyond MYB and bHLH, other TFs involved in regulating flavonoid synthesis in rambutan were also identified. These TFs could also regulate the biosynthesis of flavonoids as activators or repressors. Based on WGCNA results, we found that the other most common TFs were those from the ERF, WRKY, and MYB-related TF families. ERF TFs are widely reported to modulate plant flavonoid biosynthesis. In pears, PyERF3 can promote anthocyanin synthesis via its interactions with PyMYB114 and PybHLH3 [46]. In apples, MdERF1B acts on MdMYB9 and MdMYB11 to positively regulate the amassing of anthocyanins and PAs [55]. In citrus fruits, CitERF32, CitERF33, and CitRAV1 enhance the accumulation of flavanones and flavones by improving the conversion efficiency of CHI [56]. Notably, ERF TFs can also act as repressor molecules. For example, the PpERF9-PpTPL1 co-inhibition complex inhibits the expression of PpMYB114 and PpRAP2.4 in pears, thereby inhibiting anthocyanin biosynthesis in the pericarp [57].
Various studies indicate that WRKY TFs not only control the basic growth and development-related metabolic activities of plants but also participate in secondary metabolism. In pears, PyWRKY26 can interact with PybHLH3 to jointly target PyMYB114 and regulate the accumulation of anthocyanins in the peel [58]. Moreover, WRKY TFs also contribute to the regulation of PA and flavonol biosynthesis in plants [59,60]. Similarly, MYB-related TFs have been implicated in flavonoid biosynthesis. MybA participates in anthocyanin biosynthesis in Kyoho grapes by modulating UFGT gene expression [61] and AtMYBD can regulate anthocyanin biosynthesis in Arabidopsis through the maintenance of a biological clock [62].
Other TFs such as NAC and bZIP TFs are known to modulate flavonoid biosynthesis in plants. MdNAC52 regulates anthocyanin and PA biosynthesis in apples via MdMYB9 and MdMYB11 [63]. The B-box2 of PtrBBX23 in poplar can bind to the bZIP domain of HY5 to enhance its self-stimulating activity, thereby promoting PA and anthocyanin production by binding to MYBs and gene promoters [64]. Based on these findings and the results of our study, we can conclude that TFs are crucial in regulating flavonoid production in the rambutan peel and their regulatory network is complex and diverse. The synergistic regulation between multiple TFs enables the maintenance of a dynamic equilibrium in the level of plant flavonoids.

5. Conclusions

Compared with the peel of ‘BY7’, the peel of ‘BY2’ is golden yellow and has higher L* and b* values and a lower a* value. In this study, results from carotenoid metabolomic analysis and flavonoid metabolomic analysis showed that the accumulation of flavonols (mainly Rutin and Quercetin-3-O-glucoside) and not the accumulation of carotenoids, caused ‘BY2’ to appear yellow at maturity. Meanwhile, the anthocyanins (mainly Cyanidin-3-O-glucoside) on the surface of the fruit peel caused ‘BY7’ to appear bright red at maturity. Here, 6805 DEGs between the ‘BY7’ and ‘BY2’ rambutan cultivars were identified through RNA-seq analysis and divided into 12 clusters using MFuzz analysis. Clusters 1, 4, and 5 contained developmental negative response genes, while cluster 11 contained developmental positive response genes. Through WGCNA, the genes in the MElightgreen, MEdarkgrey, MEdarkgreen, MEmidnightblue, MEpink, MEmagenta, MEred, and MEturquoise clusters were found to contribute to the regulation of flavonoid biosynthesis in rambutan. The key biosynthetic genes regulating the accumulation of flavonoids were found to be ERF, WRKY, bZIP, NAC, MYB, and bHLH TFs, all of which can act as both activators and repressors. The differential expression of anthocyanin, flavonol, and PA synthesis genes and the differential accumulation of pathway metabolites contributed to color differences in the two rambutan cultivars at maturity. These findings offer a comprehensive overview of rambutan flavonoid biosynthesis and coloring mechanism and also laid a theoretical foundation for the breeding of new color cultivars of rambutan.

Supplementary Materials

The following supporting information can be downloaded at https://www.mdpi.com/article/10.3390/horticulturae10030263/s1. Figure S1: GO analysis results of DEGs obtained by comparison between different cultivars of rambutan in three periods. Figure S2: Results of the Mfuzz clustering of differentially expressed transcripts. Table S1: Sequences of the primers used in this study. Table S2: Summary of the metabolites profiling results. Tables S3: Summary of the metabolites profiling results. Table S4: Summary of the differential genes results.

Author Contributions

Z.C. and M.L. conceived the project; J.W., W.Z. and C.Y. (Chengkun Yang) wrote and edited the manuscript; J.W. and W.Z. managed and collected the plant tissues. C.Y. (Chengkun Yang) and C.Y. (Chengchao Yang) collected the data and evidence and were responsible for project administration. S.F. and L.T. directed the investigation, methodology, and software analysis. Z.C. and M.L. performed the research and provided critical discussions and manuscript editing. All authors have read and agreed to the published version of the manuscript.

Funding

This research was funded by the Hainan Provincial Department of Agriculture and Rural Affairs ‘Rambutan Germplasm Resources Protection’ project and the Central Financial Forestry Science and Technology Promotion Demonstration Fund (other promotion demonstration) project ‘Rambutan BY-7 high-quality seedling breeding and highyield cultivation Technology Demonstration Promotion’ (Qiong [2018] TGO8).

Data Availability Statement

The datasets presented in this study can be found in online repositories. The transcriptome raw data were submitted to NCBI with the following ID number: PRJNA1048704.

Acknowledgments

Baoting Institute of Tropical Crops provided us with experimental materials. We are grateful for their kind help.

Conflicts of Interest

Author Zhifu Cui was employed by the company Hainan State Farms Academy of Sciences Group Co., Ltd. The remaining authors declare that the research was conducted in the absence of any commercial or financial relationships that could be construed as a potential conflict of interest.

References

  1. Winkel-Shirley, B. Flavonoid Biosynthesis. A Colorful Model for Genetics, Biochemistry, Cell Biology, and Biotechnology. Plant Physiol. 2001, 126, 485–493. [Google Scholar] [CrossRef]
  2. Yuan, H.; Zhang, J.; Nageswaran, D.; Li, L. Carotenoid Metabolism and Regulation in Horticultural Crops. Hort. Res. 2015, 2, 15036. [Google Scholar] [CrossRef]
  3. Cuthill, I.C.; Allen, W.L.; Arbuckle, K.; Caspers, B.; Chaplin, G.; Hauber, M.E.; Hill, G.E.; Jablonski, N.G.; Jiggins, C.D.; Kelber, A.; et al. The Biology of Color. Science 2017, 357, eaan0221. [Google Scholar] [CrossRef]
  4. Shi, B.; Wu, H.; Zheng, B.; Qian, M.; Gao, A.; Zhou, K. Analysis of Light-Independent Anthocyanin Accumulation in Mango (Mangifera indica L.). Horticulturae 2021, 7, 423. [Google Scholar] [CrossRef]
  5. Yue, P.; Jiang, Z.; Sun, Q.; Wei, R.; Yin, Y.; Xie, Z.; Larkin, R.M.; Ye, J.; Chai, L.; Deng, X. Jasmonate Activates a CsMPK6-CsMYC2 Module That Regulates the Expression of β-Citraurin Biosynthetic Genes and Fruit Coloration in Orange (Citrus sinensis). Plant Cell 2023, 35, 1167–1185. [Google Scholar] [CrossRef]
  6. Ni, J.; Zhao, Y.; Tao, R.; Yin, L.; Gao, L.; Strid, Å.; Qian, M.; Li, J.; Li, Y.; Shen, J.; et al. Ethylene Mediates the Branching of the Jasmonate-Induced Flavonoid Biosynthesis Pathway by Suppressing Anthocyanin Biosynthesis in Red Chinese Pear Fruits. Plant Biotechnol. J. 2020, 18, 1223–1240. [Google Scholar] [CrossRef]
  7. Chen, J.; Xie, F.; Cui, Y.; Chen, C.; Lu, W.; Hu, X.; Hua, Q.; Zhao, J.; Wu, Z.; Gao, D.; et al. A Chromosome-Scale Genome Sequence of Pitaya (Hylocereus undatus) Provides Novel Insights into the Genome Evolution and Regulation of Betalain Biosynthesis. Hort. Res. 2021, 8, 164. [Google Scholar] [CrossRef]
  8. Harborne, J.B.; Williams, C.A. Advances in Flavonoid Research since 1992. Phytochemistry 2000, 55, 481–504. [Google Scholar] [CrossRef]
  9. Schweiggert, R.M.; Carle, R. Carotenoid Deposition in Plant and Animal Foods and Its Impact on Bioavailability. Crit. Rev. Food Sci. Nutr. 2017, 57, 1807–1830. [Google Scholar] [CrossRef] [PubMed]
  10. Mellado-Ortega, E.; Hornero-Méndez, D. Carotenoids in Cereals: An Ancient Resource with Present and Future Applications. Phytochem. Rev. 2015, 14, 873–890. [Google Scholar] [CrossRef]
  11. Sarma, A.D.; Sharma, R. Anthocyanin-DNA Copigmentation Complex: Mutual Protection against Oxidative Damage. Phytochemistry 1999, 52, 1313–1318. [Google Scholar] [CrossRef]
  12. Lampila, P.; van Lieshout, M.; Gremmen, B.; Lähteenmäki, L. Consumer Attitudes towards Enhanced Flavonoid Content in Fruit. Food Res. Int. 2009, 42, 122–129. [Google Scholar] [CrossRef]
  13. Fang, T.; Chen, J.; Lin, Q.; Zhong, Y.; Duan, Y.; Bi, J. Phenolic Profiling Reveals the Metabolite Basis of Flesh Colour and Fresh-Cut Browning in Apple Fruit. Int. J. Food Sci. Technol. 2022, 57, 2257–2266. [Google Scholar] [CrossRef]
  14. Moise, A.R.; Al-Babili, S.; Wurtzel, E.T. Mechanistic Aspects of Carotenoid Biosynthesis. Chem. Rev. 2014, 114, 164–193. [Google Scholar] [CrossRef]
  15. Saito, K.; Yonekura-Sakakibara, K.; Nakabayashi, R.; Higashi, Y.; Yamazaki, M.; Tohge, T.; Fernie, A.R. The Flavonoid Biosynthetic Pathway in Arabidopsis: Structural and Genetic Diversity. Plant Physiol. Biochem. 2013, 72, 21–34. [Google Scholar] [CrossRef]
  16. Giuliano, G. Plant Carotenoids: Genomics Meets Multi-Gene Engineering. Curr. Opin. Plant Biol. 2014, 19, 111–117. [Google Scholar] [CrossRef]
  17. Dubos, C.; Stracke, R.; Grotewold, E.; Weisshaar, B.; Martin, C.; Lepiniec, L. MYB Transcription Factors in Arabidopsis. Trends Plant Sci. 2010, 15, 573–581. [Google Scholar] [CrossRef]
  18. Ye, J.; Hu, T.; Yang, C.; Li, H.; Yang, M.; Ijaz, R.; Ye, Z.; Zhang, Y. Transcriptome Profiling of Tomato Fruit Development Reveals Transcription Factors Associated with Ascorbic Acid, Carotenoid and Flavonoid Biosynthesis. PLoS ONE 2015, 10, e0130885. [Google Scholar] [CrossRef]
  19. Sirisompong, W.; Jirapakkul, W.; Klinkesorn, U. Response Surface Optimization and Characteristics of Rambutan (Nephelium lappaceum L.) Kernel Fat by Hexane Extraction. LWT Food Sci. Technol. 2011, 44, 1946–1951. [Google Scholar] [CrossRef]
  20. Chai, K.F.; Mohd Adzahan, N.; Karim, R.; Rukayadi, Y.; Mohd Ghazali, H. Selected Physicochemical Properties of Registered Clones and Wild Types Rambutan (Nephelium lappaceum L.) Fruits and Their Potentials in Food Products. Sains Malays. 2018, 47, 1483–1490. [Google Scholar] [CrossRef]
  21. O’Hare, T.J. Postharvest Physiology and Storage of Rambutan. Postharvest Biol. Technol. 1995, 6, 189–199. [Google Scholar] [CrossRef]
  22. Chai, K.F.; Mohd Adzahan, N.; Karim, R.; Rukayadi, Y.; Mohd Ghazali, H. Physicochemical Properties of Rambutan (Nephelium lappaceum L.) Seed during Natural Fermentation of the Whole Peeled Fruit. Int. Food Res. J. 2020, 27, 397–407. [Google Scholar]
  23. Lee, P.; Tan, R.; Yu, B.; Curran, P.; Liu, S. Sugars, Organic Acids, and Phenolic Acids of Exotic Seasonable Tropical Fruits. Food Sci. Nutr. 2013, 43, 267–276. [Google Scholar] [CrossRef]
  24. Deng, H.; Wu, G.; Zhang, R.; Yin, Q.; Xu, B.; Zhou, L.; Chen, Z. Comparative Nutritional and Metabolic Analysis Reveals the Taste Variations during Yellow Rambutan Fruit Maturation. Food Chem. X 2023, 17, 100580. [Google Scholar] [CrossRef]
  25. Ding, R.; Che, X.; Shen, Z.; Zhang, Y. Metabolome and Transcriptome Profiling Provide Insights into Green Apple Peel Reveals Light- and UV-B-Responsive Pathway in Anthocyanins Accumulation. BMC Plant Biol. 2021, 21, 351. [Google Scholar] [CrossRef]
  26. Chen, S.; Zhou, Y.; Chen, Y.; Gu, J. Fastp: An Ultra-Fast All-in-One FASTQ Preprocessor. Bioinformatics 2018, 34, i884. [Google Scholar] [CrossRef]
  27. Kim, D.; Langmead, B.; Salzberg, S.L. HISAT: A Fast Spliced Aligner with Low Memory Requirements. Nat. Methods 2015, 12, 357–360. [Google Scholar] [CrossRef]
  28. Varet, H.; Brillet-Guéguen, L.; Coppée, J.-Y.; Dillies, M.-A. SARTools: A DESeq2- and EdgeR-Based R Pipeline for Comprehensive Differential Analysis of RNA-Seq Data. PLoS ONE 2016, 11, e0157022. [Google Scholar] [CrossRef]
  29. Chen, C.; Xia, R.; Chen, H.; He, Y. TBtools, a Toolkit for Biologists Integrating Various HTS-Data Handling Tools with a User-Friendly Interface. bioRxiv 2018. [Google Scholar] [CrossRef]
  30. Agati, G.; Azzarello, E.; Pollastri, S.; Tattini, M. Flavonoids as Antioxidants in Plants: Location and Functional Significance. Plant Sci. 2012, 196, 67–76. [Google Scholar] [CrossRef]
  31. Espley, R.V.; Hellens, R.P.; Putterill, J.; Stevenson, D.E.; Kutty-Amma, S.; Allan, A.C. Red Colouration in Apple Fruit Is Due to the Activity of the MYB Transcription Factor, MdMYB10. Plant J. 2007, 49, 414–427. [Google Scholar] [CrossRef]
  32. Ban, Y.; Kondo, S.; Ubi, B.E.; Honda, C.; Bessho, H.; Moriguchi, T. UDP-Sugar Biosynthetic Pathway: Contribution to Cyanidin 3-Galactoside Biosynthesis in Apple Skin. Planta 2009, 230, 871–881. [Google Scholar] [CrossRef]
  33. Yi, D.; Zhang, H.; Lai, B.; Liu, L.; Pan, X.; Ma, Z.; Wang, Y.; Xie, J.; Shi, S.; Wei, Y. Integrative Analysis of the Coloring Mechanism of Red Longan Pericarp through Metabolome and Transcriptome Analyses. J. Agric. Food Chem. 2021, 69, 1806–1815. [Google Scholar] [CrossRef]
  34. Aida, R.; Yoshida, K.; Kondo, T.; Kishimoto, S.; Shibata, M. Copigmentation Gives Bluer Flowers on Transgenic Torenia Plants with the Antisense Dihydroflavonol-4-Reductase Gene. Plant Sci. 2000, 160, 49–56. [Google Scholar] [CrossRef]
  35. Zhou, X.-W.; Fan, Z.-Q.; Chen, Y.; Zhu, Y.-L.; Li, J.-Y.; Yin, H.-F. Functional Analyses of a Flavonol Synthase–like Gene from Camellia Nitidissima Reveal Its Roles in Flavonoid Metabolism during Floral Pigmentation. J. Biosci. 2013, 38, 593–604. [Google Scholar] [CrossRef]
  36. Kang, Y.; Li, Y.; Zhang, T.; Wang, P.; Liu, W.; Zhang, Z.; Yu, W.; Wang, J.; Wang, J.; Zhou, Y. Integrated Metabolome, Full-Length Sequencing, and Transcriptome Analyses Unveil the Molecular Mechanisms of Color Formation of the Canary Yellow and Red Bracts of Bougainvillea × Buttiana ‘Chitra’. Plant J. 2023, 116, 1441–1461. [Google Scholar] [CrossRef]
  37. Yuan, Y.-W.; Rebocho, A.B.; Sagawa, J.M.; Stanley, L.E.; Bradshaw, H.D. Competition between Anthocyanin and Flavonol Biosynthesis Produces Spatial Pattern Variation of Floral Pigments between Mimulus Species. Proc. Natl. Acad. Sci. USA 2016, 113, 2448–2453. [Google Scholar] [CrossRef]
  38. Shen, J.; Zou, Z.; Zhang, X.; Zhou, L.; Wang, Y.; Fang, W.; Zhu, X. Metabolic Analyses Reveal Different Mechanisms of Leaf Color Change in Two Purple-Leaf Tea Plant (Camellia sinensis L.) Cultivars. Hort. Res. 2018, 5, 7. [Google Scholar] [CrossRef]
  39. Kanzaki, S.; Ichihi, A.; Tanaka, Y.; Fujishige, S.; Koeda, S.; Shimizu, K. The R2R3-MYB Transcription Factor MiMYB1 Regulates Light Dependent Red Coloration of ‘Irwin’ Mango Fruit Skin. Sci. Hortic. 2020, 272, 109567. [Google Scholar] [CrossRef]
  40. Zhu, W.; Wu, H.; Yang, C.; Shi, B.; Zheng, B.; Ma, X.; Zhou, K.; Qian, M. Postharvest Light-Induced Flavonoids Accumulation in Mango (Mangifera indica L.) Peel Is Associated with the up-Regulation of Flavonoids-Related and Light Signal Pathway Genes. Front. Plant Sci. 2023, 14, 1136281. [Google Scholar] [CrossRef]
  41. Baudry, A.; Heim, M.A.; Dubreucq, B.; Caboche, M.; Weisshaar, B.; Lepiniec, L. TT2, TT8, and TTG1 Synergistically Specify the Expression of BANYULS and Proanthocyanidin Biosynthesis in Arabidopsis thaliana. Plant J. 2004, 39, 366–380. [Google Scholar] [CrossRef]
  42. Bogs, J.; Downey, M.O.; Harvey, J.S.; Ashton, A.R.; Tanner, G.J.; Robinson, S.P. Proanthocyanidin Synthesis and Expression of Genes Encoding Leucoanthocyanidin Reductase and Anthocyanidin Reductase in Developing Grape Berries and Grapevine Leaves. Plant Physiol. 2005, 139, 652–663. [Google Scholar] [CrossRef]
  43. Han, Y.; Vimolmangkang, S.; Soria-Guerra, R.E.; Korban, S.S. Introduction of Apple ANR Genes into Tobacco Inhibits Expression of Both CHI and DFR Genes in Flowers, Leading to Loss of Anthocyanin. J. Exp. Bot. 2012, 63, 2437–2447. [Google Scholar] [CrossRef]
  44. Ji, X.; Li, Z.; Zhang, M.; Lang, S.; Song, X. ChMYB1-ChbHLH42-ChTTG1 Module Regulates Abscisic Acid-Induced Anthocyanin Biosynthesis in Cerasus humilis. Hortic Plant J. 2023, 10, 51–65. [Google Scholar] [CrossRef]
  45. Heppel, S.C.; Jaffé, F.W.; Takos, A.M.; Schellmann, S.; Rausch, T.; Walker, A.R.; Bogs, J. Identification of Key Amino Acids for the Evolution of Promoter Target Specificity of Anthocyanin and Proanthocyanidin Regulating MYB Factors. Plant Mol. 2013, 82, 457–471. [Google Scholar] [CrossRef] [PubMed]
  46. Yao, G.; Ming, M.; Allan, A.C.; Gu, C.; Li, L.; Wu, X.; Wang, R.; Chang, Y.; Qi, K.; Zhang, S.; et al. Map-Based Cloning of the Pear Gene MYB114 Identifies an Interaction with Other Transcription Factors to Coordinately Regulate Fruit Anthocyanin Biosynthesis. Plant J. 2017, 92, 437–451. [Google Scholar] [CrossRef] [PubMed]
  47. He, G.; Zhang, R.; Jiang, S.; Wang, H.; Ming, F. The MYB Transcription Factor RcMYB1 Plays a Central Role in Rose Anthocyanin Biosynthesis. Hort. Res. 2023, 10, uhad080. [Google Scholar] [CrossRef] [PubMed]
  48. Jiang, L.; Yue, M.; Liu, Y.; Zhang, N.; Lin, Y.; Zhang, Y.; Wang, Y.; Li, M.; Luo, Y.; Zhang, Y.; et al. A Novel R2R3-MYB Transcription Factor FaMYB5 Positively Regulates Anthocyanin and Proanthocyanidin Biosynthesis in Cultivated Strawberries (Fragaria × Ananassa). Plant Biotechnol. J. 2023, 21, 1140–1158. [Google Scholar] [CrossRef] [PubMed]
  49. Wang, N.; Xu, H.; Jiang, S.; Zhang, Z.; Lu, N.; Qiu, H.; Qu, C.; Wang, Y.; Wu, S.; Chen, X. MYB12 and MYB22 Play Essential Roles in Proanthocyanidin and Flavonol Synthesis in Red-Fleshed Apple (Malus sieversii f. Niedzwetzkyana). Plant J. 2017, 90, 276–292. [Google Scholar] [CrossRef] [PubMed]
  50. Mehrtens, F.; Kranz, H.; Bednarek, P.; Weisshaar, B. The Arabidopsis Transcription Factor MYB12 Is a Flavonol-Specific Regulator of Phenylpropanoid Biosynthesis. Plant Physiol. 2005, 138, 1083–1096. [Google Scholar] [CrossRef] [PubMed]
  51. Tao, R.; Yu, W.; Gao, Y.; Ni, J.; Yin, L.; Zhang, X.; Li, H.; Wang, D.; Bai, S.; Teng, Y. Light-Induced Basic/Helix-Loop-Helix64 Enhances Anthocyanin Biosynthesis and Undergoes CONSTITUTIVELY PHOTOMORPHOGENIC1-Mediated Degradation in Pear. Plant Physiol. 2020, 184, 1684–1701. [Google Scholar] [CrossRef] [PubMed]
  52. Ni, J.; Premathilake, A.T.; Gao, Y.; Yu, W.; Tao, R.; Teng, Y.; Bai, S. Ethylene-Activated PpERF105 Induces the Expression of the Repressor-Type R2R3-MYB Gene PpMYB140 to Inhibit Anthocyanin Biosynthesis in Red Pear Fruit. Plant J. 2021, 105, 167–181. [Google Scholar] [CrossRef]
  53. Rajput, R.; Naik, J.; Stracke, R.; Pandey, A. Interplay between R2R3 MYB-Type Activators and Repressors Regulates Proanthocyanidin Biosynthesis in Banana (Musa acuminata). New Phytol. 2022, 236, 1108–1127. [Google Scholar] [CrossRef] [PubMed]
  54. Hu, R.; Zhu, M.; Chen, S.; Li, C.; Zhang, Q.; Gao, L.; Liu, X.; Shen, S.; Fu, F.; Xu, X.; et al. BnbHLH92a Negatively Regulates Anthocyanin and Proanthocyanidin Biosynthesis in Brassica napus. Crop J. 2023, 11, 374–385. [Google Scholar] [CrossRef]
  55. Zhang, J.; Xu, H.; Wang, N.; Jiang, S.; Fang, H.; Zhang, Z.; Yang, G.; Wang, Y.; Su, M.; Xu, L.; et al. The Ethylene Response Factor MdERF1B Regulates Anthocyanin and Proanthocyanidin Biosynthesis in Apple. Plant Mol. Biol. 2018, 98, 205–218. [Google Scholar] [CrossRef]
  56. Zhao, C.; Liu, X.; Gong, Q.; Cao, J.; Shen, W.; Yin, X.; Grierson, D.; Zhang, B.; Xu, C.; Li, X.; et al. Three AP2/ERF Family Members Modulate Flavonoid Synthesis by Regulating Type IV Chalcone Isomerase in Citrus. Plant Biotechnol. J. 2021, 19, 671–688. [Google Scholar] [CrossRef] [PubMed]
  57. Ni, J.; Wang, S.; Yu, W.; Liao, Y.; Pan, C.; Zhang, M.; Tao, R.; Wei, J.; Gao, Y.; Wang, D.; et al. The Ethylene-Responsive Transcription Factor PpERF9 Represses PpRAP2.4 and PpMYB114 via Histone Deacetylation to Inhibit Anthocyanin Biosynthesis in Pear. Plant Cell 2023, 35, 2271–2292. [Google Scholar] [CrossRef]
  58. Li, C.; Wu, J.; Hu, K.-D.; Wei, S.-W.; Sun, H.-Y.; Hu, L.-Y.; Han, Z.; Yao, G.-F.; Zhang, H. PyWRKY26 and PybHLH3 Cotargeted the PyMYB114 Promoter to Regulate Anthocyanin Biosynthesis and Transport in Red-Skinned Pears. Hort. Res. 2020, 7, 37. [Google Scholar] [CrossRef]
  59. Grunewald, W.; De Smet, I.; Lewis, D.R.; Löfke, C.; Jansen, L.; Goeminne, G.; Vanden Bossche, R.; Karimi, M.; De Rybel, B.; Vanholme, B.; et al. Transcription Factor WRKY23 Assists Auxin Distribution Patterns during Arabidopsis Root Development through Local Control on Flavonol Biosynthesis. Proc. Natl. Acad. Sci. USA 2012, 109, 1554–1559. [Google Scholar] [CrossRef]
  60. Wang, Y.; Wang, X.; Fang, J.; Yin, W.; Yan, X.; Tu, M.; Liu, H.; Zhang, Z.; Li, Z.; Gao, M.; et al. VqWRKY56 Interacts with VqbZIPC22 in Grapevine to Promote Proanthocyanidin Biosynthesis and Increase Resistance to Powdery Mildew. New Phytol. 2023, 237, 1856–1875. [Google Scholar] [CrossRef]
  61. Kobayashi, S.; Ishimaru, M.; Hiraoka, K.; Honda, C. Myb-Related Genes of the Kyoho Grape (Vitis labruscana) Regulate Anthocyanin Biosynthesis. Planta 2002, 215, 924–933. [Google Scholar] [CrossRef] [PubMed]
  62. Nguyen, N.H.; Lee, H. MYB-Related Transcription Factors Function as Regulators of the Circadian Clock and Anthocyanin Biosynthesis in Arabidopsis. Plant Signal. Behav. 2016, 11, e1139278. [Google Scholar] [CrossRef] [PubMed]
  63. Sun, Q.; Jiang, S.; Zhang, T.; Xu, H.; Fang, H.; Zhang, J.; Su, M.; Wang, Y.; Zhang, Z.; Wang, N.; et al. Apple NAC Transcription Factor MdNAC52 Regulates Biosynthesis of Anthocyanin and Proanthocyanidin through MdMYB9 and MdMYB11. Plant Sci. 2019, 289, 110286. [Google Scholar] [CrossRef] [PubMed]
  64. Li, C.; Pei, J.; Yan, X.; Cui, X.; Tsuruta, M.; Liu, Y.; Lian, C. A Poplar B-Box Protein PtrBBX23 Modulates the Accumulation of Anthocyanins and Proanthocyanidins in Response to High Light. Plant Cell Environ. 2021, 44, 3015–3033. [Google Scholar] [CrossRef]
Figure 1. (A) Appearance quality characteristics of the two rambutan cultivars ‘BY2’ and ‘BY7’ at three developmental stages. Changes in the color index L* (B), a* (C), and b* (D) of the ‘BY2’ and ‘BY7’ rambutan peels at three developmental stages. (EH) Time-dependent changes in chlorophyll, total carotenoid, and total anthocyanin levels in the peel of ‘BY2’ and ‘BY7’. Values represent the mean ± standard deviation (n = 3). * p < 0.05; ** p < 0.01 based on the Student’s t-test.
Horticulturae 10 00263 g001
Figure 2. (A) Hierarchical clustering analysis (HCA) heatmap of carotenoid metabolites detected in the peels of the ‘BY7’ and ‘BY2’ cultivars of rambutan at different developmental stages. The green (low) to red (high) colors on the scale represent the content of each metabolite. (B) The Venn diagram describes the relationship between different groups of differential carotenoid metabolites in the peels of the ‘BY7’ and ‘BY2’ cultivars of rambutan. (C) Hierarchical clustering analysis (HCA) heatmap of flavonoid metabolites detected in the peels of the two cultivars of rambutan at different developmental stages. The green (low) to red (high) colors on the scale represent the content of each metabolite. (D) The Venn diagram describes the relationship between different groups of differential flavonoid metabolites in the peels of the ‘BY7’ and ‘BY2’ cultivars of rambutan.
Horticulturae 10 00263 g002
Figure 3. The contents of major carotenoid and flavonoid components in the ‘BY7’ and ‘BY2’ rambutan cultivars at S1, S2, and S3 were determined using metabolomic analysis. Values represent the mean ± standard deviation (n = 3). * p < 0.05; ** p < 0.01 based on the Student’s t-test.
Horticulturae 10 00263 g003
Figure 4. (A) PCA of the transcriptome data of peel samples from the ‘BY7’ and ‘BY2’ rambutan cultivars at three stages (three biological replicates per cultivar at each development stage). (B) GO analysis results of DEGs obtained by comparison between different cultivars of rambutan at three stages. (CE) KEGG pathway enrichment analysis based on the DEGs screened from different rambutan cultivars at the three stages.
Horticulturae 10 00263 g004
Figure 5. WGCNA was performed on the main flavonoids and DEGs obtained from the RNA-seq of the two rambutan cultivars. The panel on the left represents genes, which were divided into 26 modules. Correlation coefficients and p-values between module genes and metabolites are shown in parentheses. The color change from blue to red on the scale toward the right of the figure represents the range of module trait correlations (from −1 to 1). The labels below the panel indicate the change in the content of the corresponding metabolite.
Horticulturae 10 00263 g005
Figure 6. Expression patterns of key flavonoid biosynthesis pathway-related structural genes in the peels of the ‘BY7’ and ‘BY2’ cultivars of rambutan at three stages of development. The change in color from green (low) to orange (high) indicates FKPM values.
Horticulturae 10 00263 g006
Figure 7. Transcription factors (TFs) regulating flavonoid biosynthesis in the peels of the two cultivars of rambutan (‘BY7’ and ‘BY2’). (A) Analysis of the number of members from different TF families. (B) Heatmaps showing the levels of various TFs involved in regulating flavonoid metabolites in the peels of the ‘BY7’ and ‘BY2’ rambutan cultivars during the three developmental stages. (MElightgreen) Positive correlation with anthocyanin content. (MEred) Negative correlation with anthocyanin content. (MEdarkgreen) Positive correlation with PA content. (MEdarkgrey, MEmidnightblue, and MEpink) Positive correlation with flavonol content. (MEmagenta and MEturquoise) Negative correlation with flavonol content.
Horticulturae 10 00263 g007
Figure 8. The reliability of transcriptome data was verified by qPCR. (A) Expression trends of eight DEGs were analyzed by qPCR (left picture) and RNA-seq (right picture). (B) Correlation between qPCR and RNA-seq results. Values represent the mean ± standard deviation (n = 3).
Horticulturae 10 00263 g008
Table 1. Overview of transcriptome sequencing data and quality inspection.
SampleRaw ReadsClean ReadsClean Base (G)Error Rate (%)Q20 (%)Q30 (%)GC Content (%)
BY2-S1-148,214,97846,952,4887.040.0397.192.1645.45
BY2-S1-245,776,30844,553,6866.680.0397.0592.0645.38
BY2-S1-347,594,68246,284,1406.940.0396.8991.7645.39
BY2-S2-150,542,42049,255,7507.390.0396.6891.345.59
BY2-S2-253,658,27452,363,5487.850.0396.8291.5945.6
BY2-S2-355,737,91054,482,6168.170.0396.8491.6345.55
BY2-S3-145,602,19444,623,9966.690.0396.9791.8245.38
BY2-S3-245,403,50844,327,4706.650.0397.4392.7345.4
BY2-S3-345,686,91644,736,9646.710.0397.2492.3445.48
BY7-S1-160,699,67458,961,6468.840.0396.9891.9445.88
BY7-S1-274,150,95471,883,73010.780.0397.2192.4445.83
BY7-S1-363,322,59461,633,5249.250.0396.9991.9445.88
BY7-S2-167,488,39465,868,2429.880.0397.1892.3545.51
BY7-S2-258,550,09057,328,0648.60.0397.1192.145.6
BY7-S2-356,373,22655,146,5908.270.0397.2592.4145.53
BY7-S3-159,593,58258,351,8268.750.0397.2192.3345.43
BY7-S3-247,865,31246,842,6287.030.0397.2292.4245.42
BY7-S3-362,324,62460,877,8689.130.0397.1492.245.51
Disclaimer/Publisher’s Note: The statements, opinions and data contained in all publications are solely those of the individual author(s) and contributor(s) and not of MDPI and/or the editor(s). MDPI and/or the editor(s) disclaim responsibility for any injury to people or property resulting from any ideas, methods, instructions or products referred to in the content.

