Article

Complete Chloroplast Genome Sequence of Dahlia imperialis (Asteraceae): Comparative Analysis and Phylogenetic Relationships

1
College of Horticulture, Agricultural University of Hebei, Baoding 071001, China
2
Zhangjiakou Academy of Agricultural Sciences, Zhangjiakou 075000, China
3
Shijiazhuang Botanical Garden, Shijiazhuang 050073, China
4
State Key Laboratory of Crop Improvement and Regulation in North China, Agricultural University of Hebei, Baoding 071001, China
*
Authors to whom correspondence should be addressed.
Horticulturae 2024, 10(1), 7; https://doi.org/10.3390/horticulturae10010007
Submission received: 10 November 2023 / Revised: 15 December 2023 / Accepted: 18 December 2023 / Published: 20 December 2023

Abstract

:
The genus Dahlia has approximately 40 species; however, the complete chloroplast genome has been reported only for one species. Due to this lack of information on the chloroplast genomes, the phylogenetic relationships within the Dahlia genus remain unclear. Therefore, the present study sequenced the complete chloroplast genome of D. imperialis for the first time. This genome was 152,084 bp long with a typical quadripartite structure and a GC content of 38.45%. A total of 134 genes were annotated in the genome, including 86 protein-coding genes, 38 transfer RNA genes, 8 ribosomal RNA genes, and 2 pseudogenes. The detailed analysis identified UUA as the most frequently used codon and found 62 intergenic repeat sequences and 157 SSR loci in the D. imperialis genome. Phylogenetic analysis based on 49 chloroplast genomes showed that Dahlia was a monophyletic group, with D. imperialis positioned at the base of this clade. Network evolution and gene flow analysis unveiled extensive hybridization events within the Heliantheae alliance, especially in Dahlia. Thus, the comprehensive analysis of the complete chloroplast genome of D. imperialis enriches the information on the genetic resources of the Dahlia species, provides valuable information for reconstructing their phylogeny, and reveals the evolutionary dynamics of the Dahlia chloroplast genome.

1. Introduction

Dahlia, also known as “sweet potato flower” and “Oriental chrysanthemum”, is a perennial bulbous flower of the Heliantheae alliance in the Asteraceae family. It is native to Mexico and is the country’s national flower [1,2]. In the early 16th century, it was introduced to the courtyards by locals, and in the 17th century, it was brought to Europe. Currently, there are more than 30,000 cultivated Dahlia varieties, making it one of the species with the most flower varieties in the world [3]. Dahlia is renowned for its prolonged flowering period and large and numerous flowers with diverse colors and shapes. Moreover, its tubers are rich in inulin. Dahlia is a multi-functional horticultural plant with ornamental, medicinal, and edible value [4,5,6,7]. In recent years, Dahlia has become increasingly popular as a cut flower, in addition to its use as a traditional potted plant and in flower arrangements. Dahlia’s cut and potted flower industries occupy a significant position in the floriculture economy of various countries; it is also one of the most important economic groups in the Heliantheae alliance (Asteraceae) [3]. Dahlia’s cultivation and domestication history can be traced back a few hundred years. However, research on the Dahlia genus mainly focused on functional components and breeding, especially in D. pinnata [8,9]. Therefore, other species of Dahlia have not been fully studied. In addition, there are approximately 40 species in the Dahlia genus [10], but existing horticultural cultivars are only derived from two distinctive species from Mexico: D. pinnata and D. coccinia [1,2,4]. These have since developed into an ornamental plant that is popular worldwide, with over 3000 decorative varieties. A significant number of genetic resources in the Dahlia genus remain underutilized.
The Heliantheae alliance, with more than 6600 species, is the largest tribe in the Asteraceae family. It comprises multiple subtribes and is found in all continents except Antarctica. However, more than 85% of these species are in South and North America [11]. The high species diversity and extensive distribution of the Heliantheae alliance have posed significant challenges for studying their phylogenetic relationships. Moreover, research has demonstrated inconsistencies in phylogenetic relationships within the Heliantheae alliance [12]. In the Asteraceae family, phylogenetic trees constructed based on nuclear genomes [13] and chloroplast gene loci [11] demonstrated apparent inconsistencies. Although the basic phylogenetic framework of Asteraceae species has been established, further research is needed to understand the phylogenetics of Dahlia with other subtribes and genera of the alliance.
Chloroplasts are semi-autonomous cell organelles in plant cells and have a genome composed of multiple copies of a circular DNA fragment (110–210 kb) [14]. The chloroplast genome is generally small and easy to assemble, has a low recombination rate, and is amenable to analysis. Most plant chloroplast DNAs have a typical quadripartite structure [15], including a large single-copy region (LSC), a small single-copy region (SSC), and a pair of inverted repeats (IRs). The chloroplast genome of most land plants contains 110–130 genes [16]. These chloroplast genes belong to the maternal lineage, and using them to construct phylogenetic trees helps avoid interference from paternal lineage genes. Moreover, compared to the nuclear genome, the chloroplast genome has evolved slowly and possesses higher sequence conservation [17], a major advantage in tree-building. Thus, the chloroplast genome is used in plant classification and species-level phylogenetics [18], such as Rheum (Polygonaceae) [19], Paphiopedilum (Orchidaceae) [20], etc. In addition, the phylogeny of the Dahlia genus, with approximately 40 species [1], remains unclear [10]. Only the chloroplast genome of D. pinnata has been reported, and it is crucial to generate the complete chloroplast genomes of other Dahlia species to elucidate the phylogeny.
Therefore, the present study aimed to enrich the information on the genetic resources of the Dahlia species and to determine the phylogenetic position of the Dahlia genus and the complex phylogenetic relationships among species within the Heliantheae alliance. We sequenced, assembled, and annotated the chloroplast genome of D. imperialis and systematically analyzed its basic structure and gene sequences. We further downloaded the complete chloroplast genomes of 46 Heliantheae alliance species and three outgroups from NCBI and reconstructed the phylogenetic relationships within the Heliantheae alliance. By studying the relationships of inconsistent phylogenetic groups within the Heliantheae alliance and conducting reticulate evolution and gene flow analysis, the study’s findings will improve our understanding of the phylogenetic relationships within the Heliantheae alliance and the evolution of Heliantheae alliance species. The interpretation of chloroplast genome information of D. imperialis will enrich the genetic information we have on Dahlia and will lay a foundation for the innovation and application of Dahlia germplasm resources.

2. Materials and Methods

2.1. Plant Materials

Fresh leaves of D. imperialis were collected from the greenhouse test park (38°82′ N, 115°44′ E) located within the east campus of Hebei Agricultural University in Baoding City, Hebei Province. One such specimen has been deposited at the College of Horticulture, Hebei Agricultural University (https://yuanyi.hebau.edu.cn/, accessed on 11 September 2021) under voucher number DLH20210911. Fresh leaves were disinfected with 75% alcohol, then rinsed with water 3 times and stored at −80 °C after liquid nitrogen precooling.

2.2. DNA Extraction, Genome Sequencing, and Annotation

Whole genomic DNA was extracted from fresh leaves using a rapid plant genomic DNA isolation kit (Sangon Biotech Co., Ltd., Shanghai, China). The quality of DNA was checked using a BioPhotometer Plus (nucleic acid protein detector, Eppendorf, Germany) and 1% agarose gels. The genomic DNA was physically disrupted (by ultrasonic oscillation) into fragments 350 bp in size. Then, the small fragment sequencing library was constructed with a TrueLib DNA Library Rapid Prep Kit for Illumina (Ikesai Biotechnology Co., Ltd., Shanghai, China). The genome sequencing was implemented utilizing the Illumina NovaSeq 6000 platform, and it generated approximately 10 Gb of raw data. The quality of the raw paired-end reads was assessed using FastQC v0.11.9 [21] software. The reads were assembled using GetOrganelle [22], and the assembled genome was checked using Burrows–Wheeler Aligner (BWA) [23] and SAMtools [24]. The assembled genome’s maximum and minimum read mapping depths were 1538× and 83×, respectively (Figure S1). Further, the genome was annotated using the online annotation tool CPGAVAS2 (http://47.96.249.172:16019/analyzer/annotate, accessed on 11 September 2023) [25] with Dahlia as a reference, and the annotation results were manually corrected. Finally, the assembled chloroplast genome was visualized using CPGview [26]. The annotated genome has been submitted to the NCBI database under GenBank accession number OP323060.1.

2.3. Codon Usage Analysis

The CDS was analyzed based on relative synonymous codon usage (RSCU) using CodonW 1.4.2 software [27]. The average of three bases (GC_all) and the GC content of the first codon base (GC1), second codon base (GC2), and third codon base (GC3), as well as the frequency of G or C in the third base (GC3S), were determined using the online program CUSP (http://itime.med.ucm.es/EMBOSS/, accessed on 11 September 2023), whereas the ENC (effective number of codons) values were generated using the CHIPS model (http://itime.med.ucm.es/EMBOSS/, accessed on 11 September 2023). We then analyzed the content of A, T, C, and G at the third position of each codon based on the parity rule 2 (PR2)-bias plot, generated using A3/(A3 + T3) as the ordinate and G3/(G3 + C3) as the abscissa. Each base composition was displayed in a plane, and the center point represented the codon state under unbiased usage; here, A = T and C = G. In addition, the vector distance between other points and the center point represented the degree and direction of bias [28]. Further, a neutrality plot was created, representing the GC3 value along the x-axis and the GC12 value (the average of GC1 and GC2 for each gene) along the y-axis. Each point in this plot represented an independent gene [29]. Then, the ENC plot and a two-dimensional scatter plot were generated using the GC3 value along the x-axis and the ENC value along the y-axis [30].

2.4. Interspersed Repeats and SSRs

The repetitive sequences in the chloroplast genome of D. imperialis were detected using the REPuter program [31] (BiBiServ2-REPuter (uni-bielefeld.de)) with the following set parameters: (1) a Hamming distance of 3, (2) a minimum size of 30 base pairs, and (3) a sequence identity of at least 90%. The analysis identified four types of repeats (palindromic, forward, reverse, and complement repeats).
Further, the SSRs in the chloroplast genome were identified using the online tool MISA [32] (https://webblast.ipk-gatersleben.de/misa/, accessed on 11 September 2023), with the following thresholds: eight repeats for mononucleotides, five for dinucleotides, four for trinucleotides, and three for tetranucleotides, pentanucleotides, and hexanucleotides.

2.5. Comparison of the Complete Chloroplast Genomes

Ten chloroplast genome datasets (Lasthenia burkei, Galinsoga quadriradiata, Tagetes erecta, Cosmos bipinnnatus, Helianthus grosseserratus, Bidens campylotheca, Eupatorium fortunei, D. pinnata, D. imperialis, Centipeda minima) were selected based on the phylogeny reconstructed using nuclear genomes [13] for comparative analysis, including those of the two Dahlia species for comparing sequence variation within the genus Dahlia. Dahlia, Bidens, and Cosmos species were used to compare the sequence variation in Coreopsis. In addition, one representative species was selected from the other five subtribes, along with the four Coreopsideae species and an outgroup, to compare sequence variation at the level of the Heliantheae alliance.
Then, to compare the homologous gene sequences across different plants, we employed MAFFT v7 [33]. The nucleotide diversity (Pi) value for each gene was calculated using DNAsp v5.0 [34], and the IR, SSC, and LSC boundaries were visualized using CPJSdraw v1.0.0 [35]. The Ka/Ks values of the genes were calculated using the Ka/Ks Calculator v2.0 [36] software.

2.6. Phylogenetic Analysis

In this study, to determine the phylogenetic position of D. imperialis, 46 complete chloroplast genomes of the Heliantheae alliance and 3 outgroup species, C. minima (NC 065155.1), Blumea balsamifera (BK013127.1), and Ligularia fischeri (NC 039352.1), were downloaded from NCBI (Table S1). All sequences were first aligned using MAFFT v7 [33]. Then, the best model, GTR + R, was determined, and the maximum likelihood analysis was performed using PhyML 3.0 [37]. The network evolution was analyzed using Splitstree v4.19.1 [38] software with default parameter settings. The gene flow was analyzed by running Treemix v1.13 [39] software for 1000 iterations, and the most likely eight instances of gene flow were selected.

3. Results

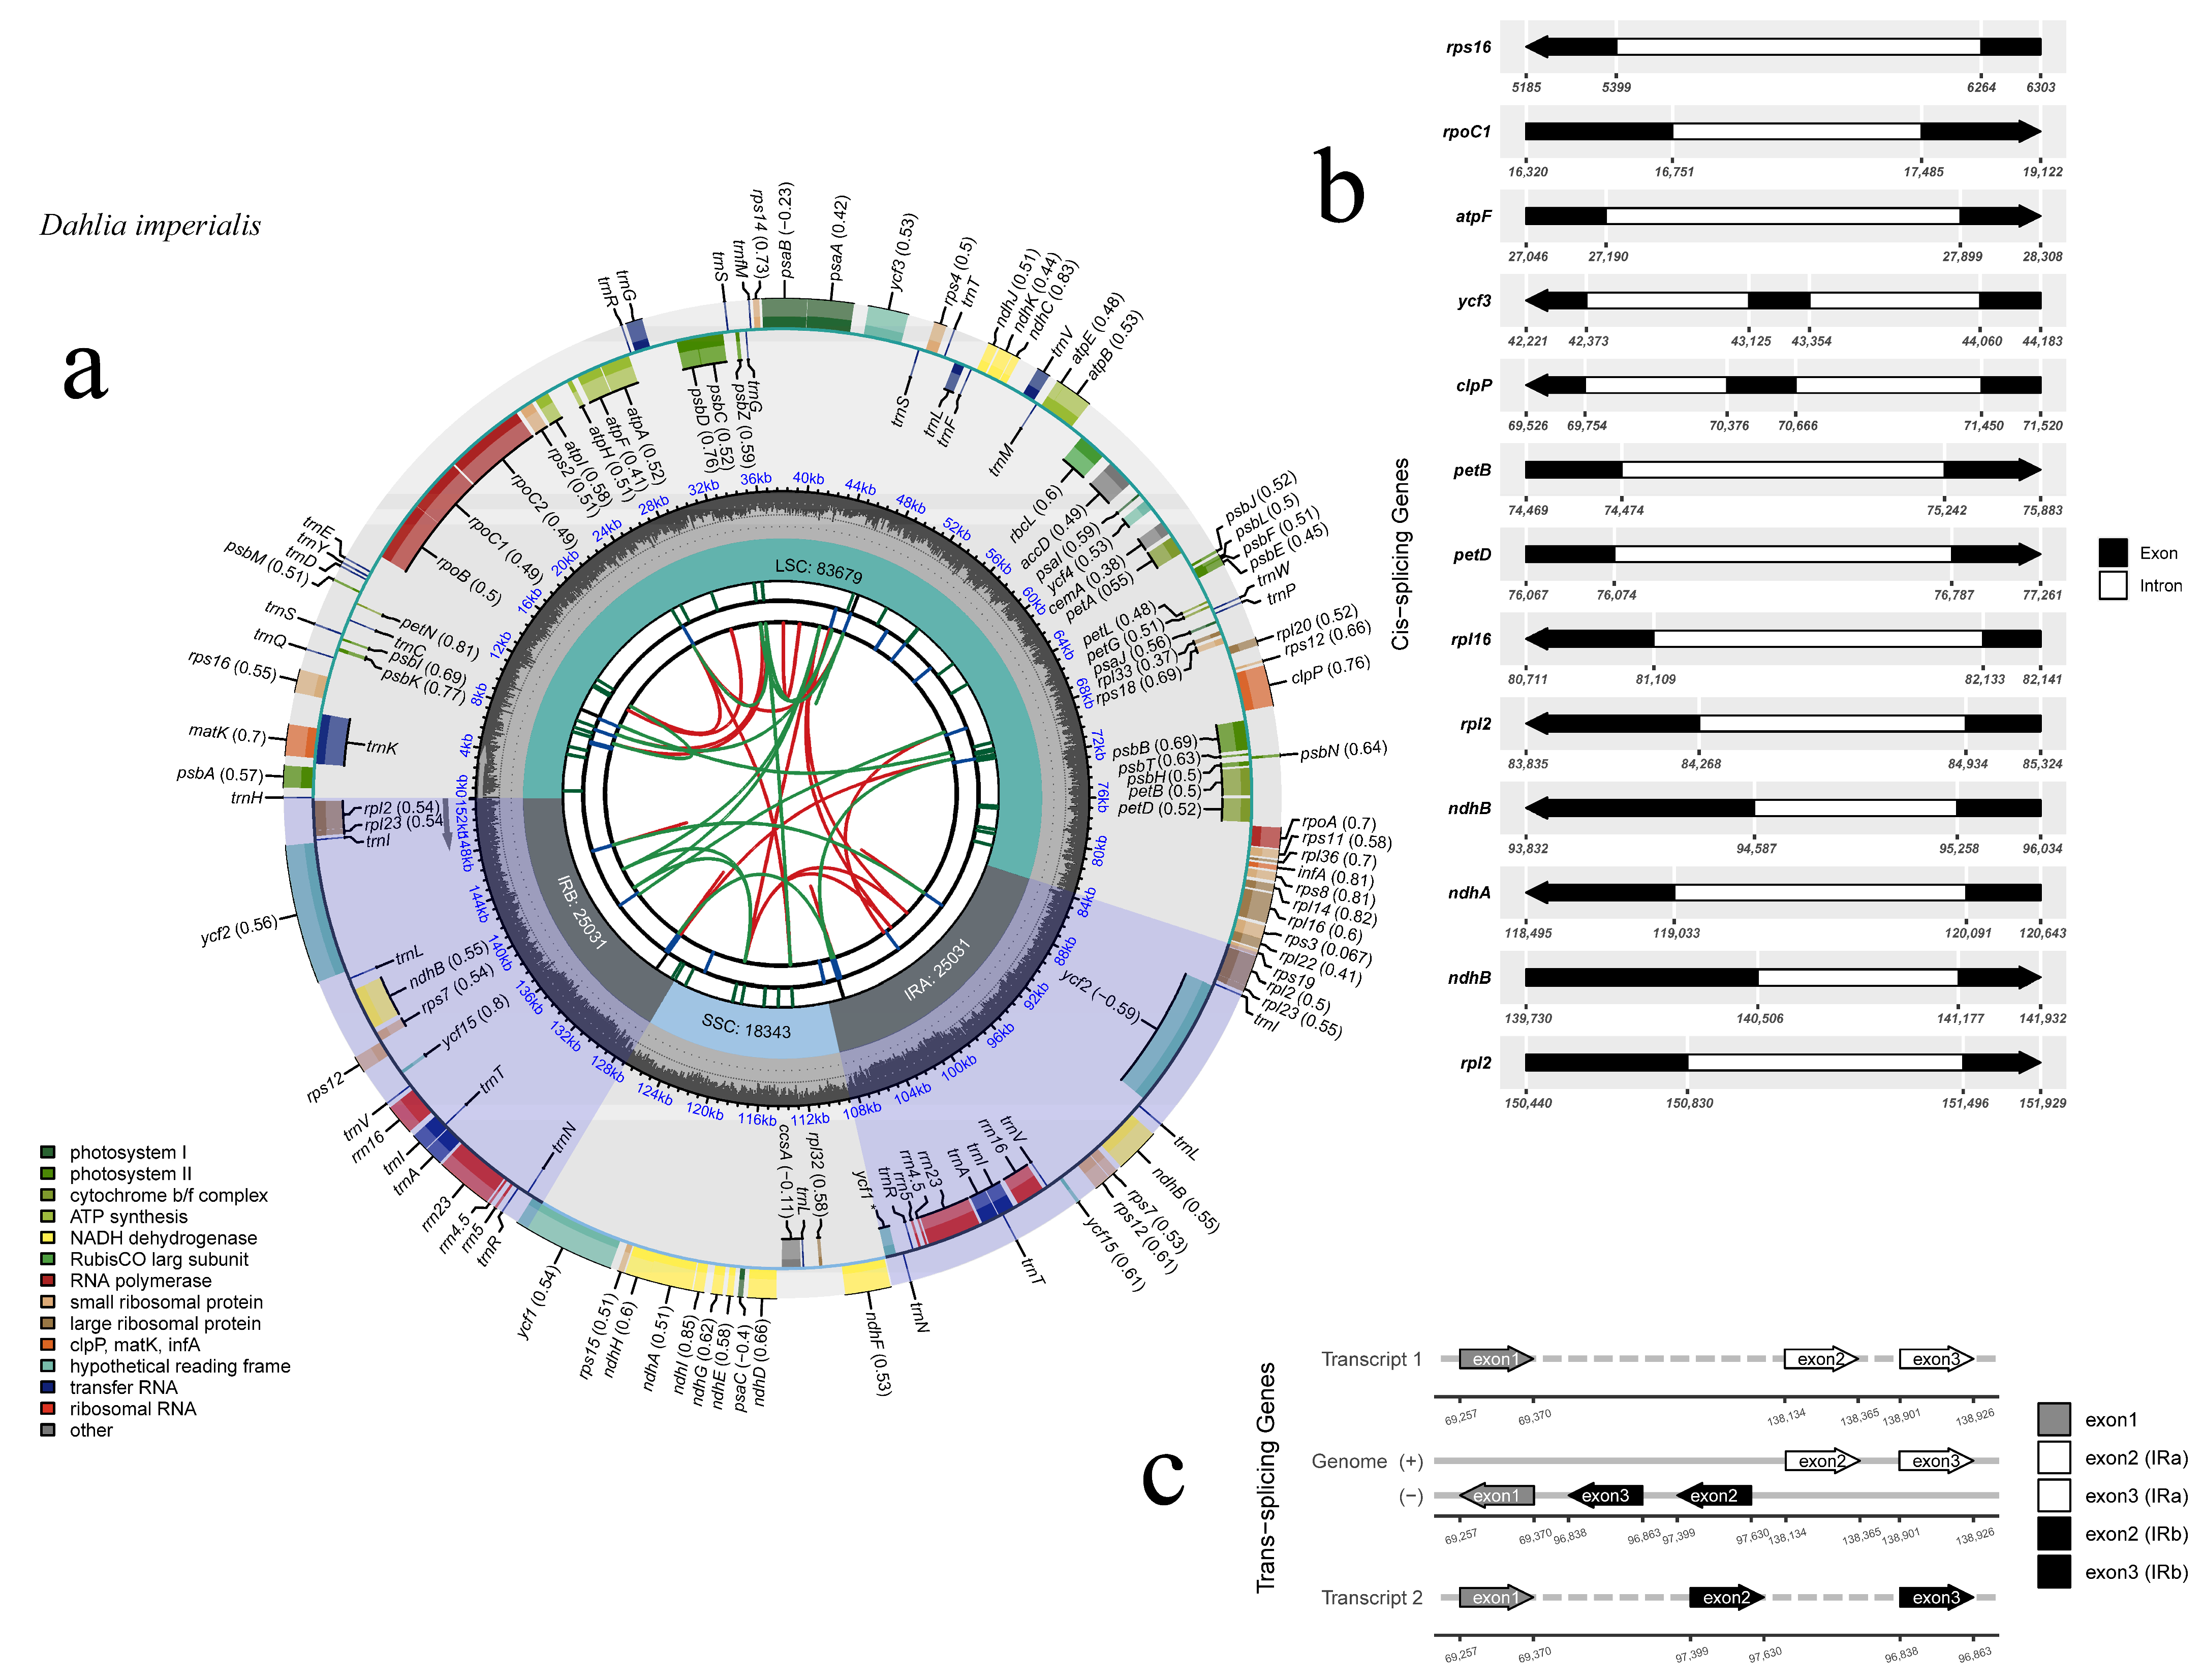
3.1. Chloroplast Genome Features

The chloroplast genome of D. imperialis had a typical circular quadripartite structure. The complete genome sequence was 152,084 bp long, with an LSC region of 83,679 bp, an SSC region of 18,343 bp, and IRa/b regions of 25,031 bp. The total GC content of the chloroplast genome was 38.45%, and the GC distribution was uneven within the genome, with the IR region (43.01%) having a higher GC content than the LSC (35.63%) and the SSC (31.15%) regions (Table 1). The chloroplast genome of D. imperialis was predicted to contain 134 genes (Figure 1, Table S2), including 86 protein-coding genes, 38 tRNA genes, 8 rRNA genes, and 2 pseudogenes. Among them, 15 genes (atpF, ndhA, ndhB, petB, petD, rpl2, rpl16, rps16, rpoC1, trnI-GAU, trnG-GCC, trnL-UAA, trnV-UAC, trnA-UGC, trnK-UUU) had a single intron and 4 (clpP, ycf3, and 2 rps12) had two introns.

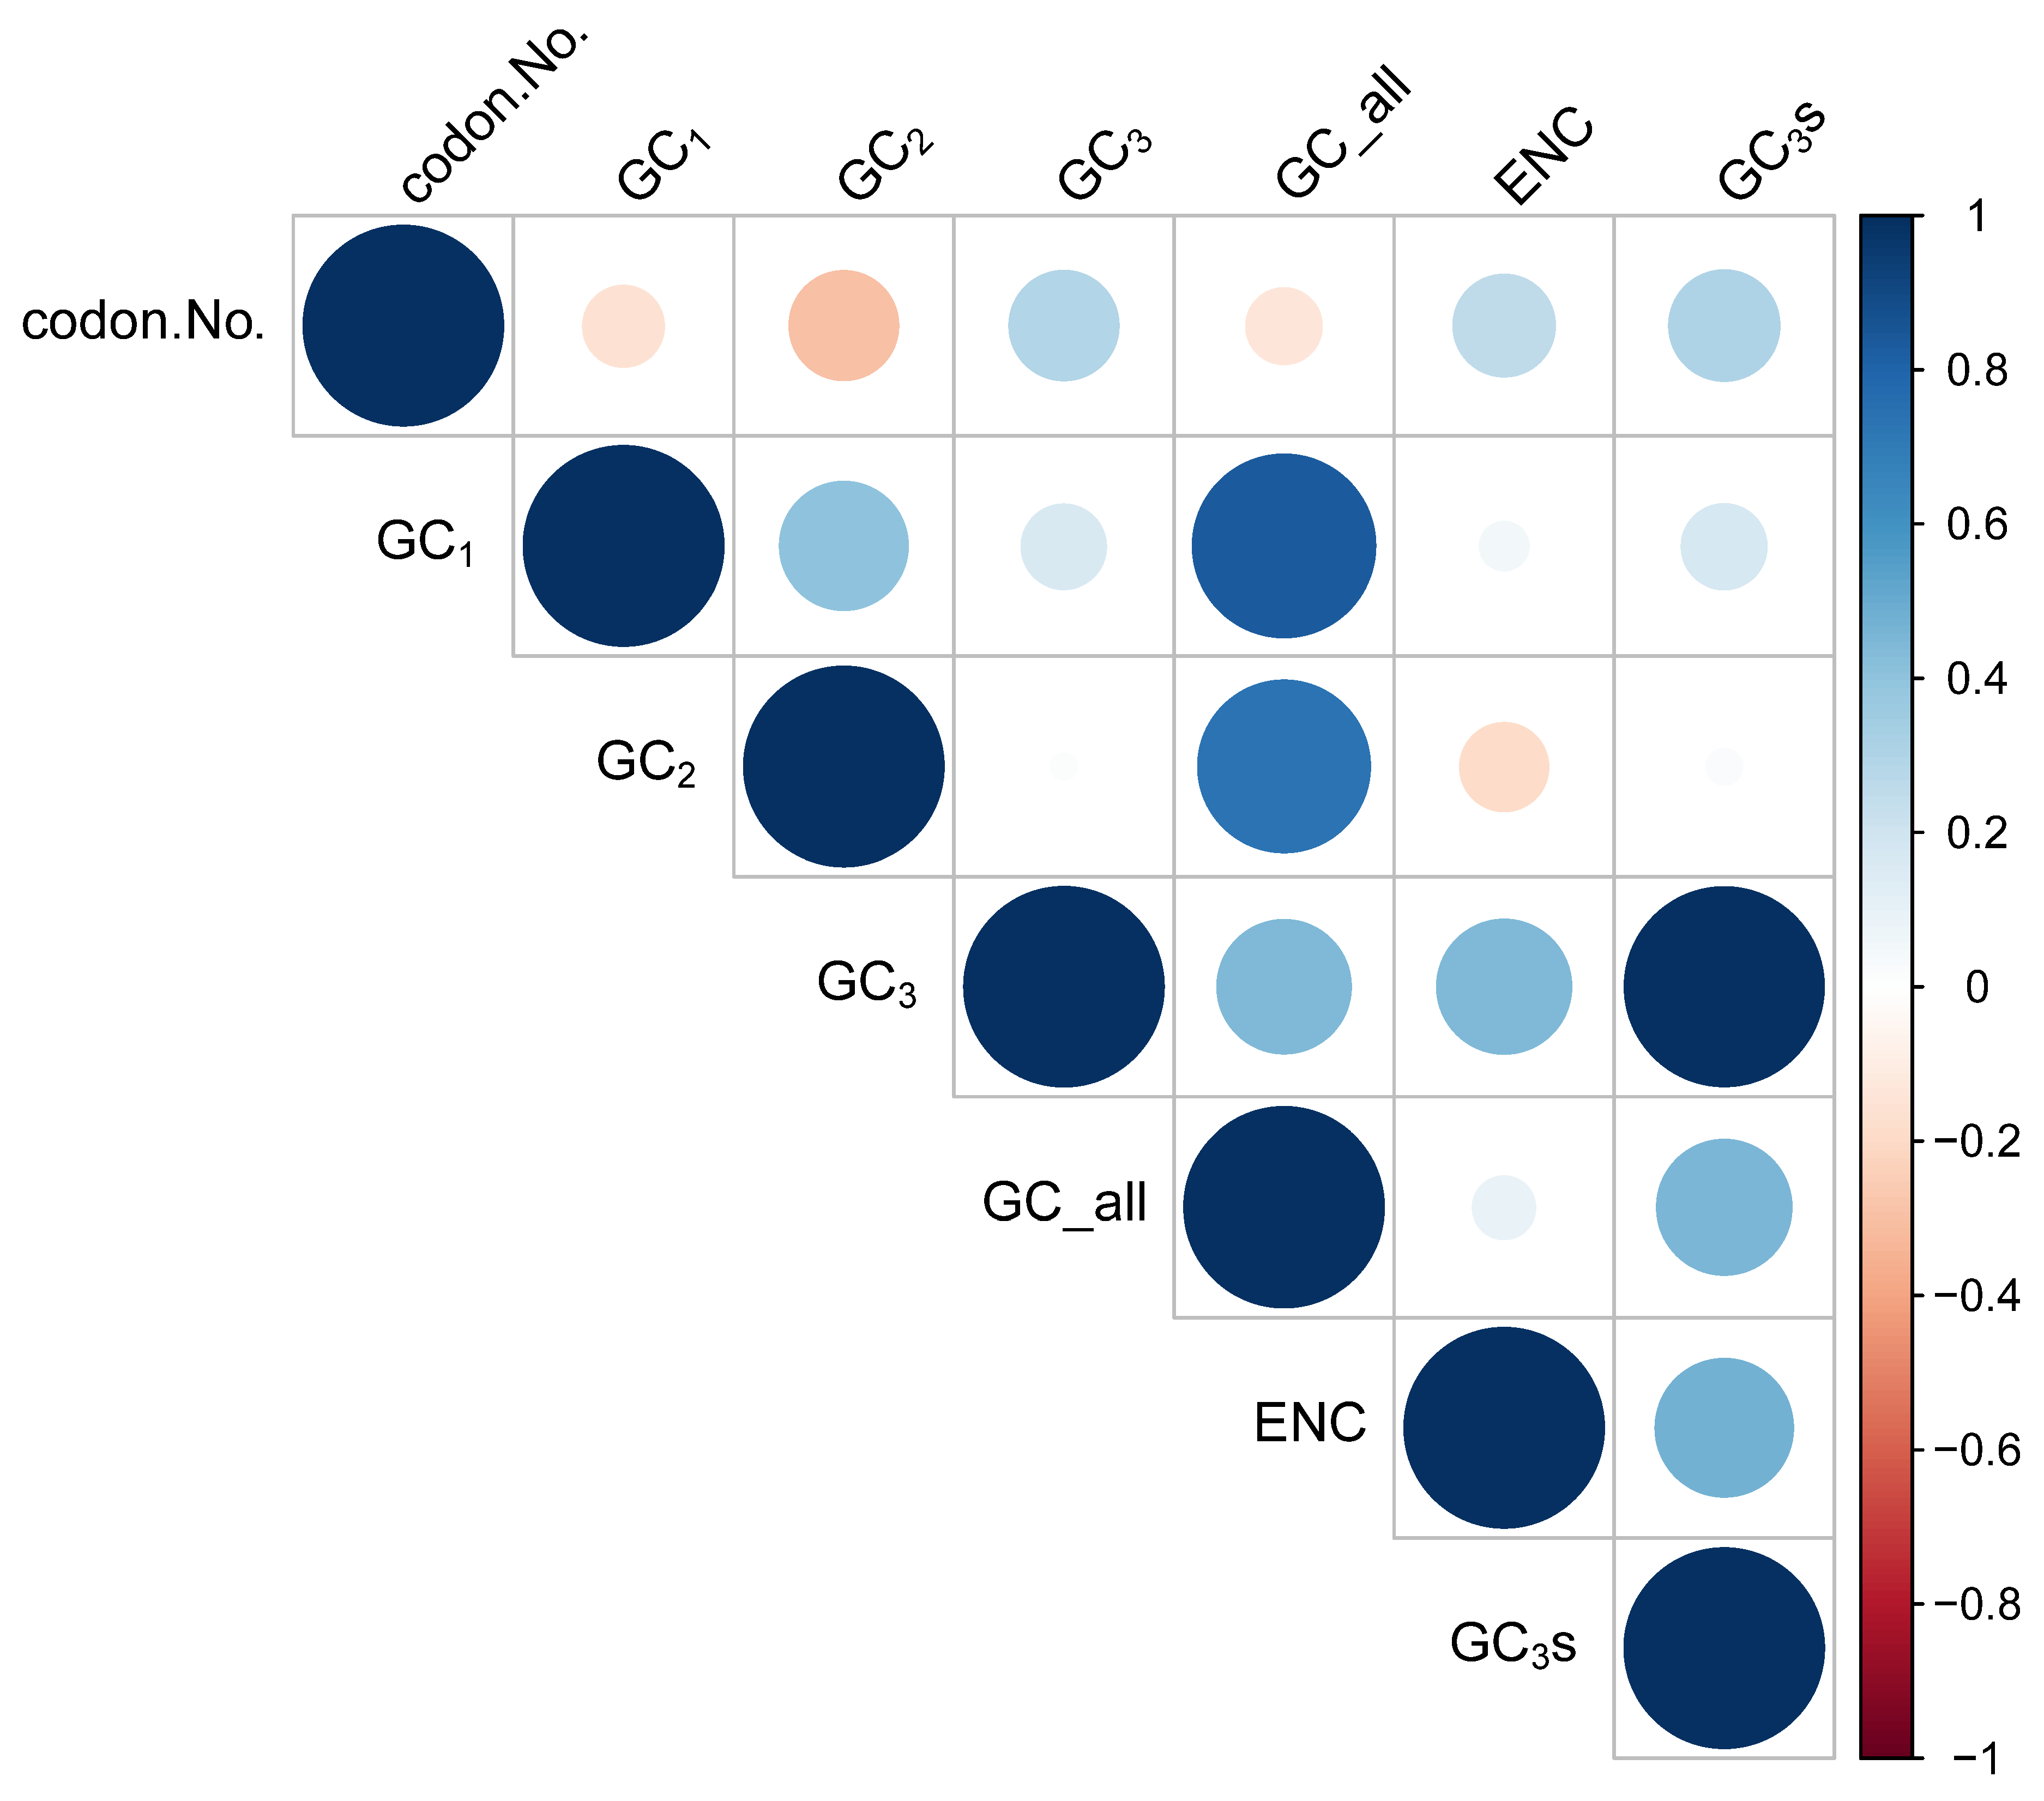
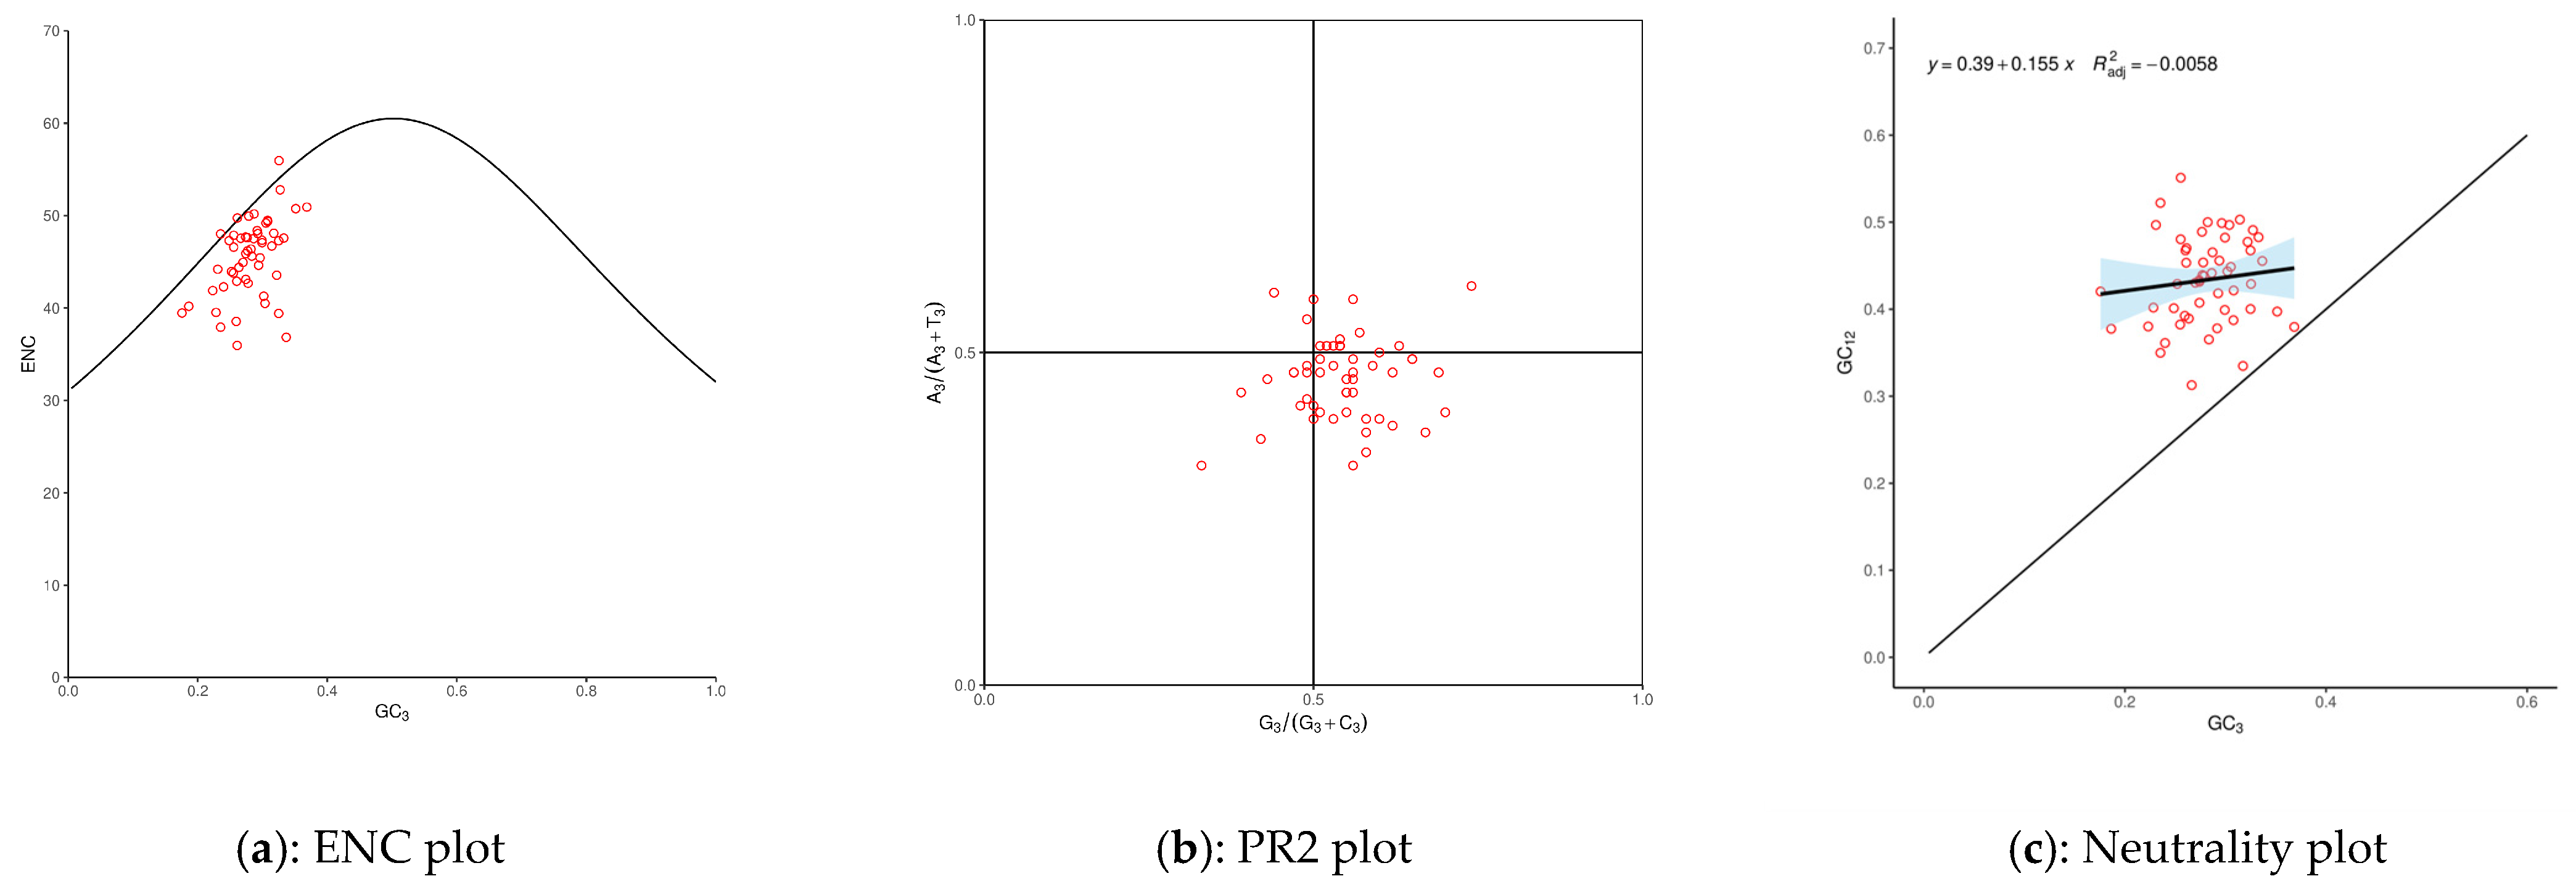
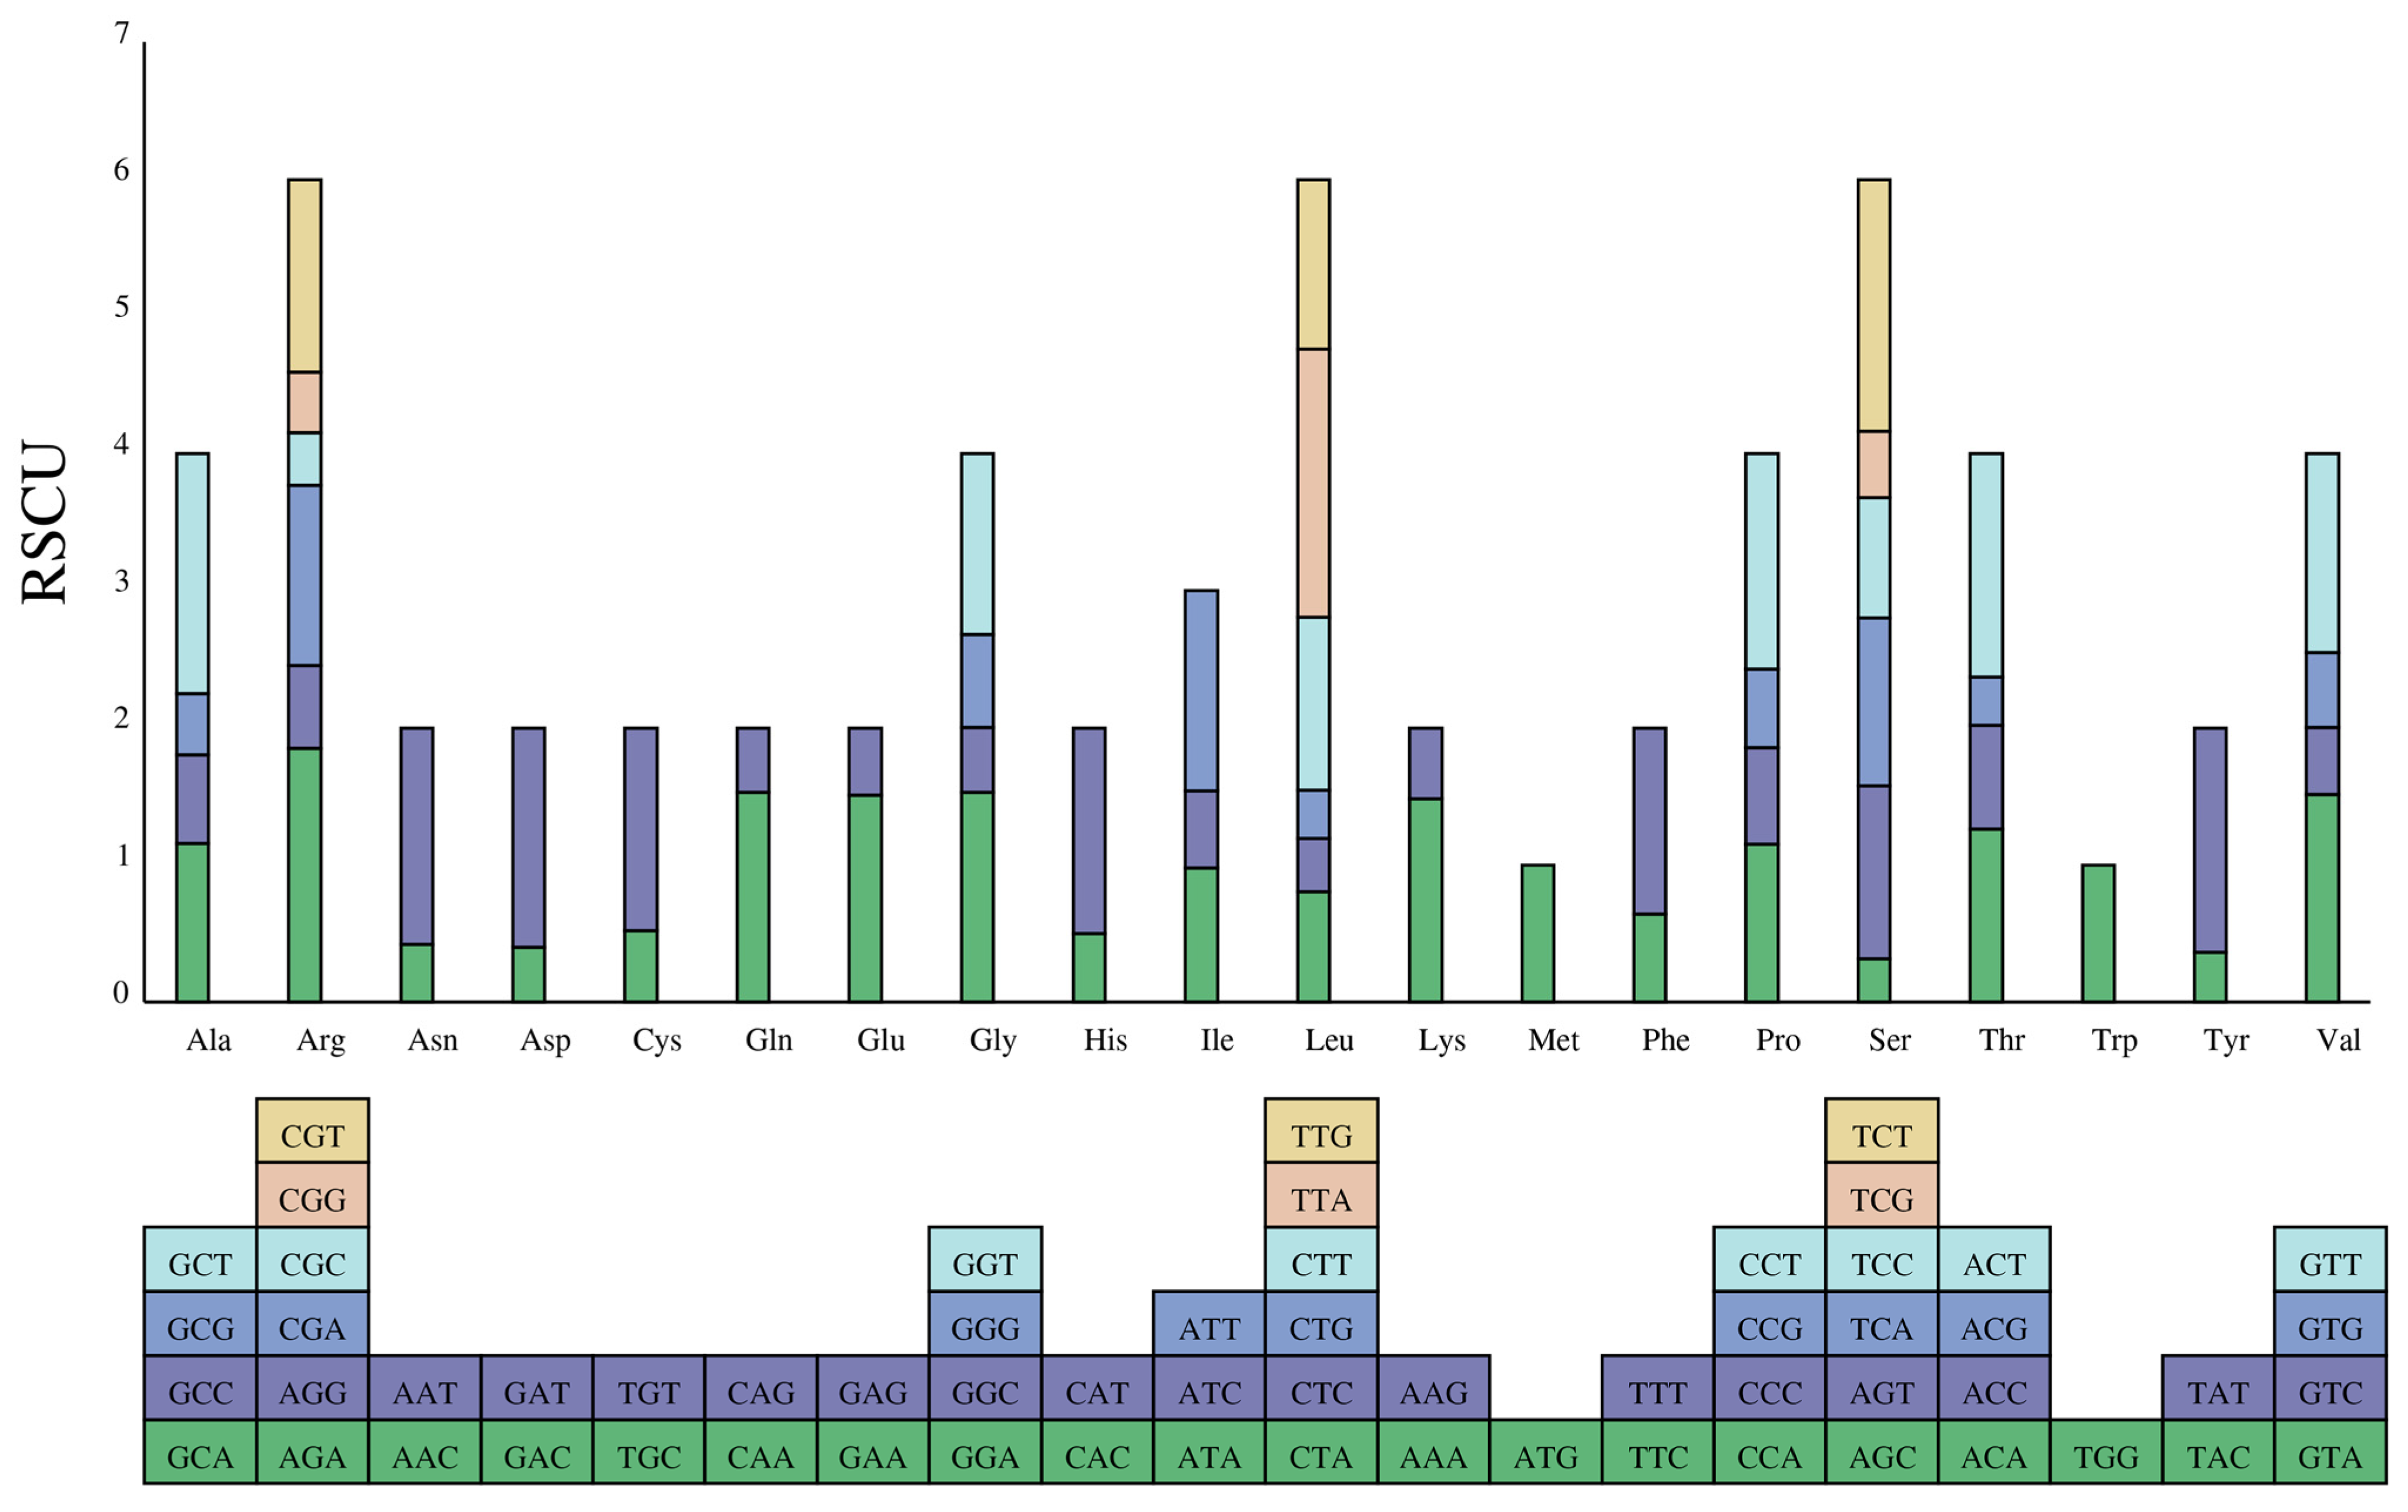
3.2. Codon Usage Bias (CUB)

A correlation analysis was performed to identify the relationship among the codon usage parameters of the D. imperialis chloroplast genome (Figure 2). The analysis revealed a highly significant correlation between GC1 and GC2 of the codons but no significant correlation between GC1, GC2, and GC3. Both GC2 and GC3 showed a correlation with the codon number (condon.No.). Furthermore, a highly significant correlation was detected between GC3 and the effective number of codons (ENCs), indicating a significant impact of the composition of the third base of the codon on codon preference. Meanwhile, the correlation between ENC and codon number was insignificant, suggesting a minimal effect of the sequence length on codon preference.
In addition, we analyzed the third base of the codons. Firstly, we explored the relationship between ENC and GC3 distribution (Figure 3a), with most data points falling within the standard curve and showing a non-uniform distribution. Furthermore, we analyzed the distribution of the third base of the codons (Figure 3b), with most data points mainly located in the lower-right quadrant, indicating a preference in the frequency of the third base of the codons, with C having a higher frequency of use than G and A having a higher frequency of use than T. Finally, we analyzed the synonymous mutations of the third base of degenerate codons (Figure 3c), with all data points located above the standard curve and most points distributed on both sides of the regression line. The R2 value of 0.0058 indicates no significant correlation between the GC3 and GC12. In conclusion, we speculate that the codon preference of D. imperialis is influenced not only by natural variation but also to some extent by natural selection.
CUB describes the variation in the usage of synonymous codons in DNA [40]. CUB varies between species and between genes within a species due to a combination of factors, including mutation, selection, and drift during the long-term evolutionary process [41]. In this study, we calculated the RSCU (relative synonymous codon usage) to assess the codon usage frequencies of protein-coding genes in the D. imperialis genome. Here, 21,098 codons (including three stop codons) were predicted to code for all proteins (Figure 4 and Table S3). Interestingly, leucine (Leu) had the highest number of codons (2235, 10.59%), followed by isoleucine (Ile) (1795, 8.51%) and serine (Ser) (1562, 7.40%), whereas cysteine (Cys) had the least common codon (226, 1.07%). A total of 30 codons (46.8%) had an RSCU value greater than 1. The most preferred codon was TTA, which encoded Leu with an RSCU value of 1.9572, followed by AGA, which encoded arginine (Arg) with an RSCU value of 1.8534. Our results also show a significantly higher frequency of A/T-ending codons than G/C-ending codons, indicating a clear codon usage preference in D. imperialis.

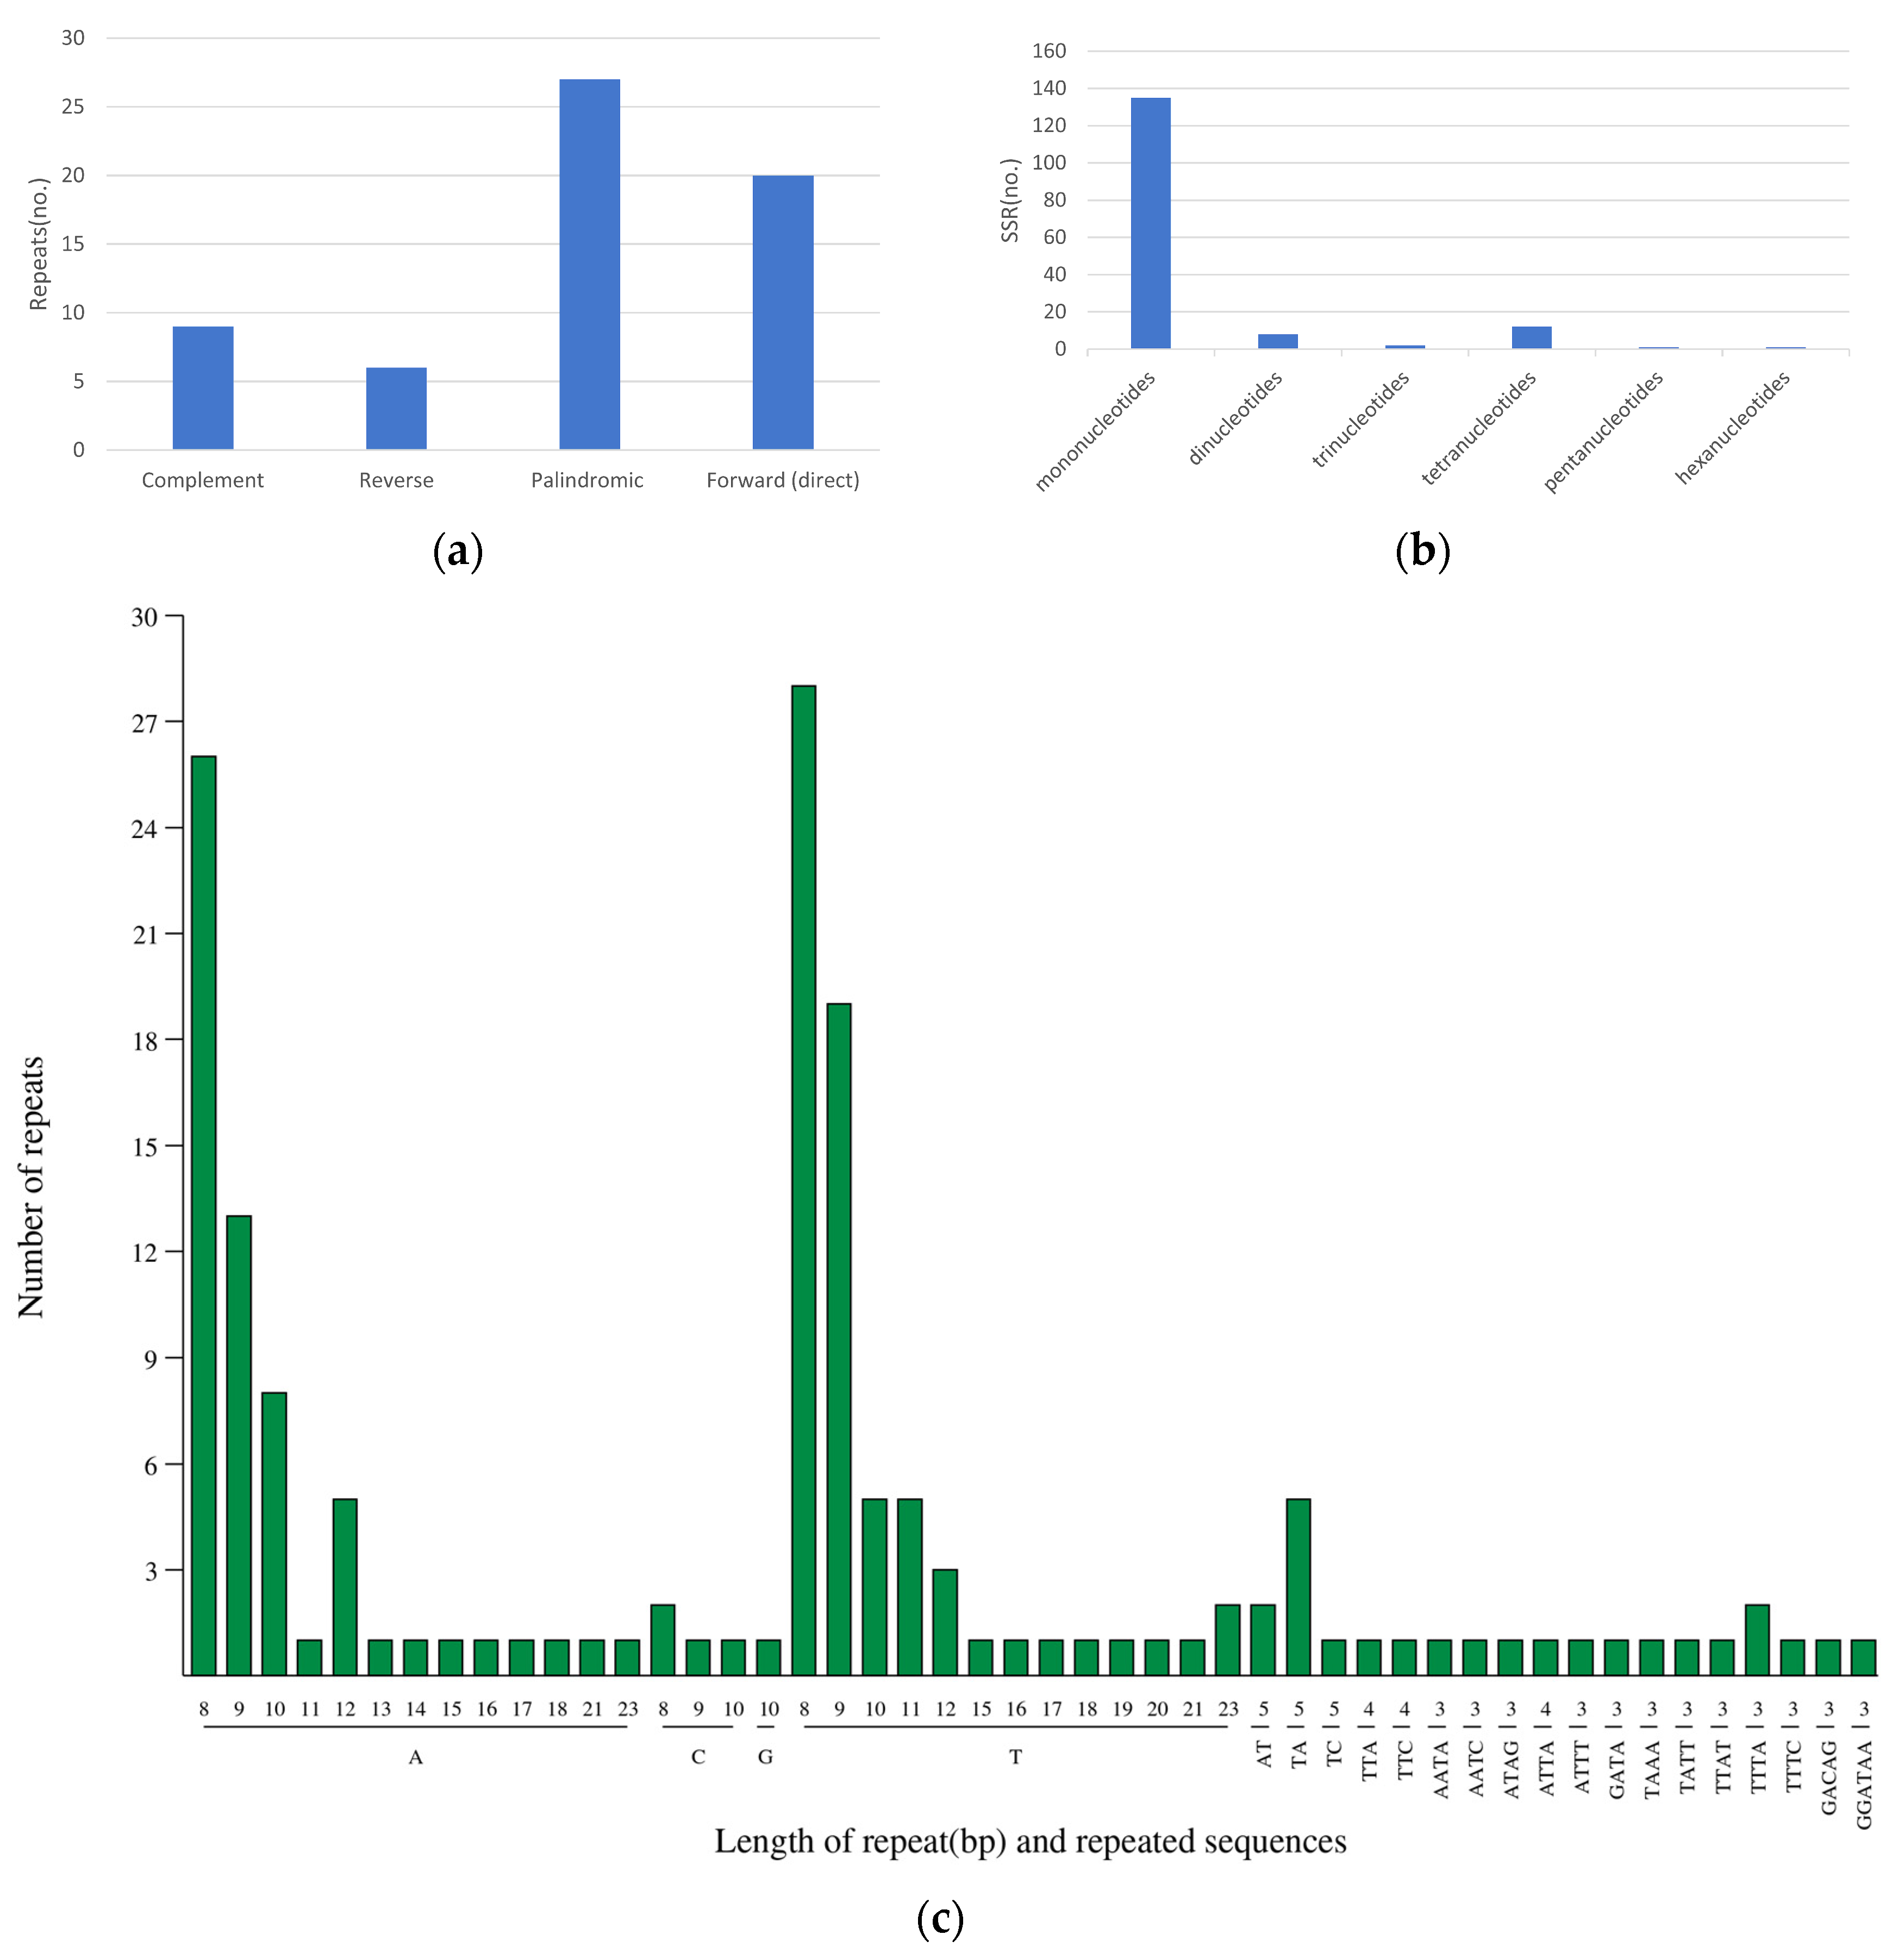
3.3. Interspersed Repeats and Simple Sequence Repeats (SSRs)

The study identified 62 interspersed repeats in the D. imperialis chloroplast genome, including 9 complementary repeats, 6 reverse repeats, 27 palindromic repeats, and 20 forward repeats (Figure 5a). These repetitive sequences were 30 to 25,031 bp long. Except for one repeat that was 25,031 bp long, the other repeats were only 30 to 48 bp long (Table S4).
Further analysis identified a total of 157 SSRs in the D. imperialis chloroplast genome, including 133 mononucleotide repeats, 8 dinucleotide repeats, 2 trinucleotide repeats, 12 tetranucleotide repeats, 1 pentanucleotide repeat, and 1 hexanucleotide repeat (Figure 5b). Among these, the most common SSR motif was a mononucleotide repeat containing 8 Ts, with a frequency of 28. The next most common SSR motif was a mononucleotide repeat containing 9 As, with a frequency of 26 (Figure 5c).

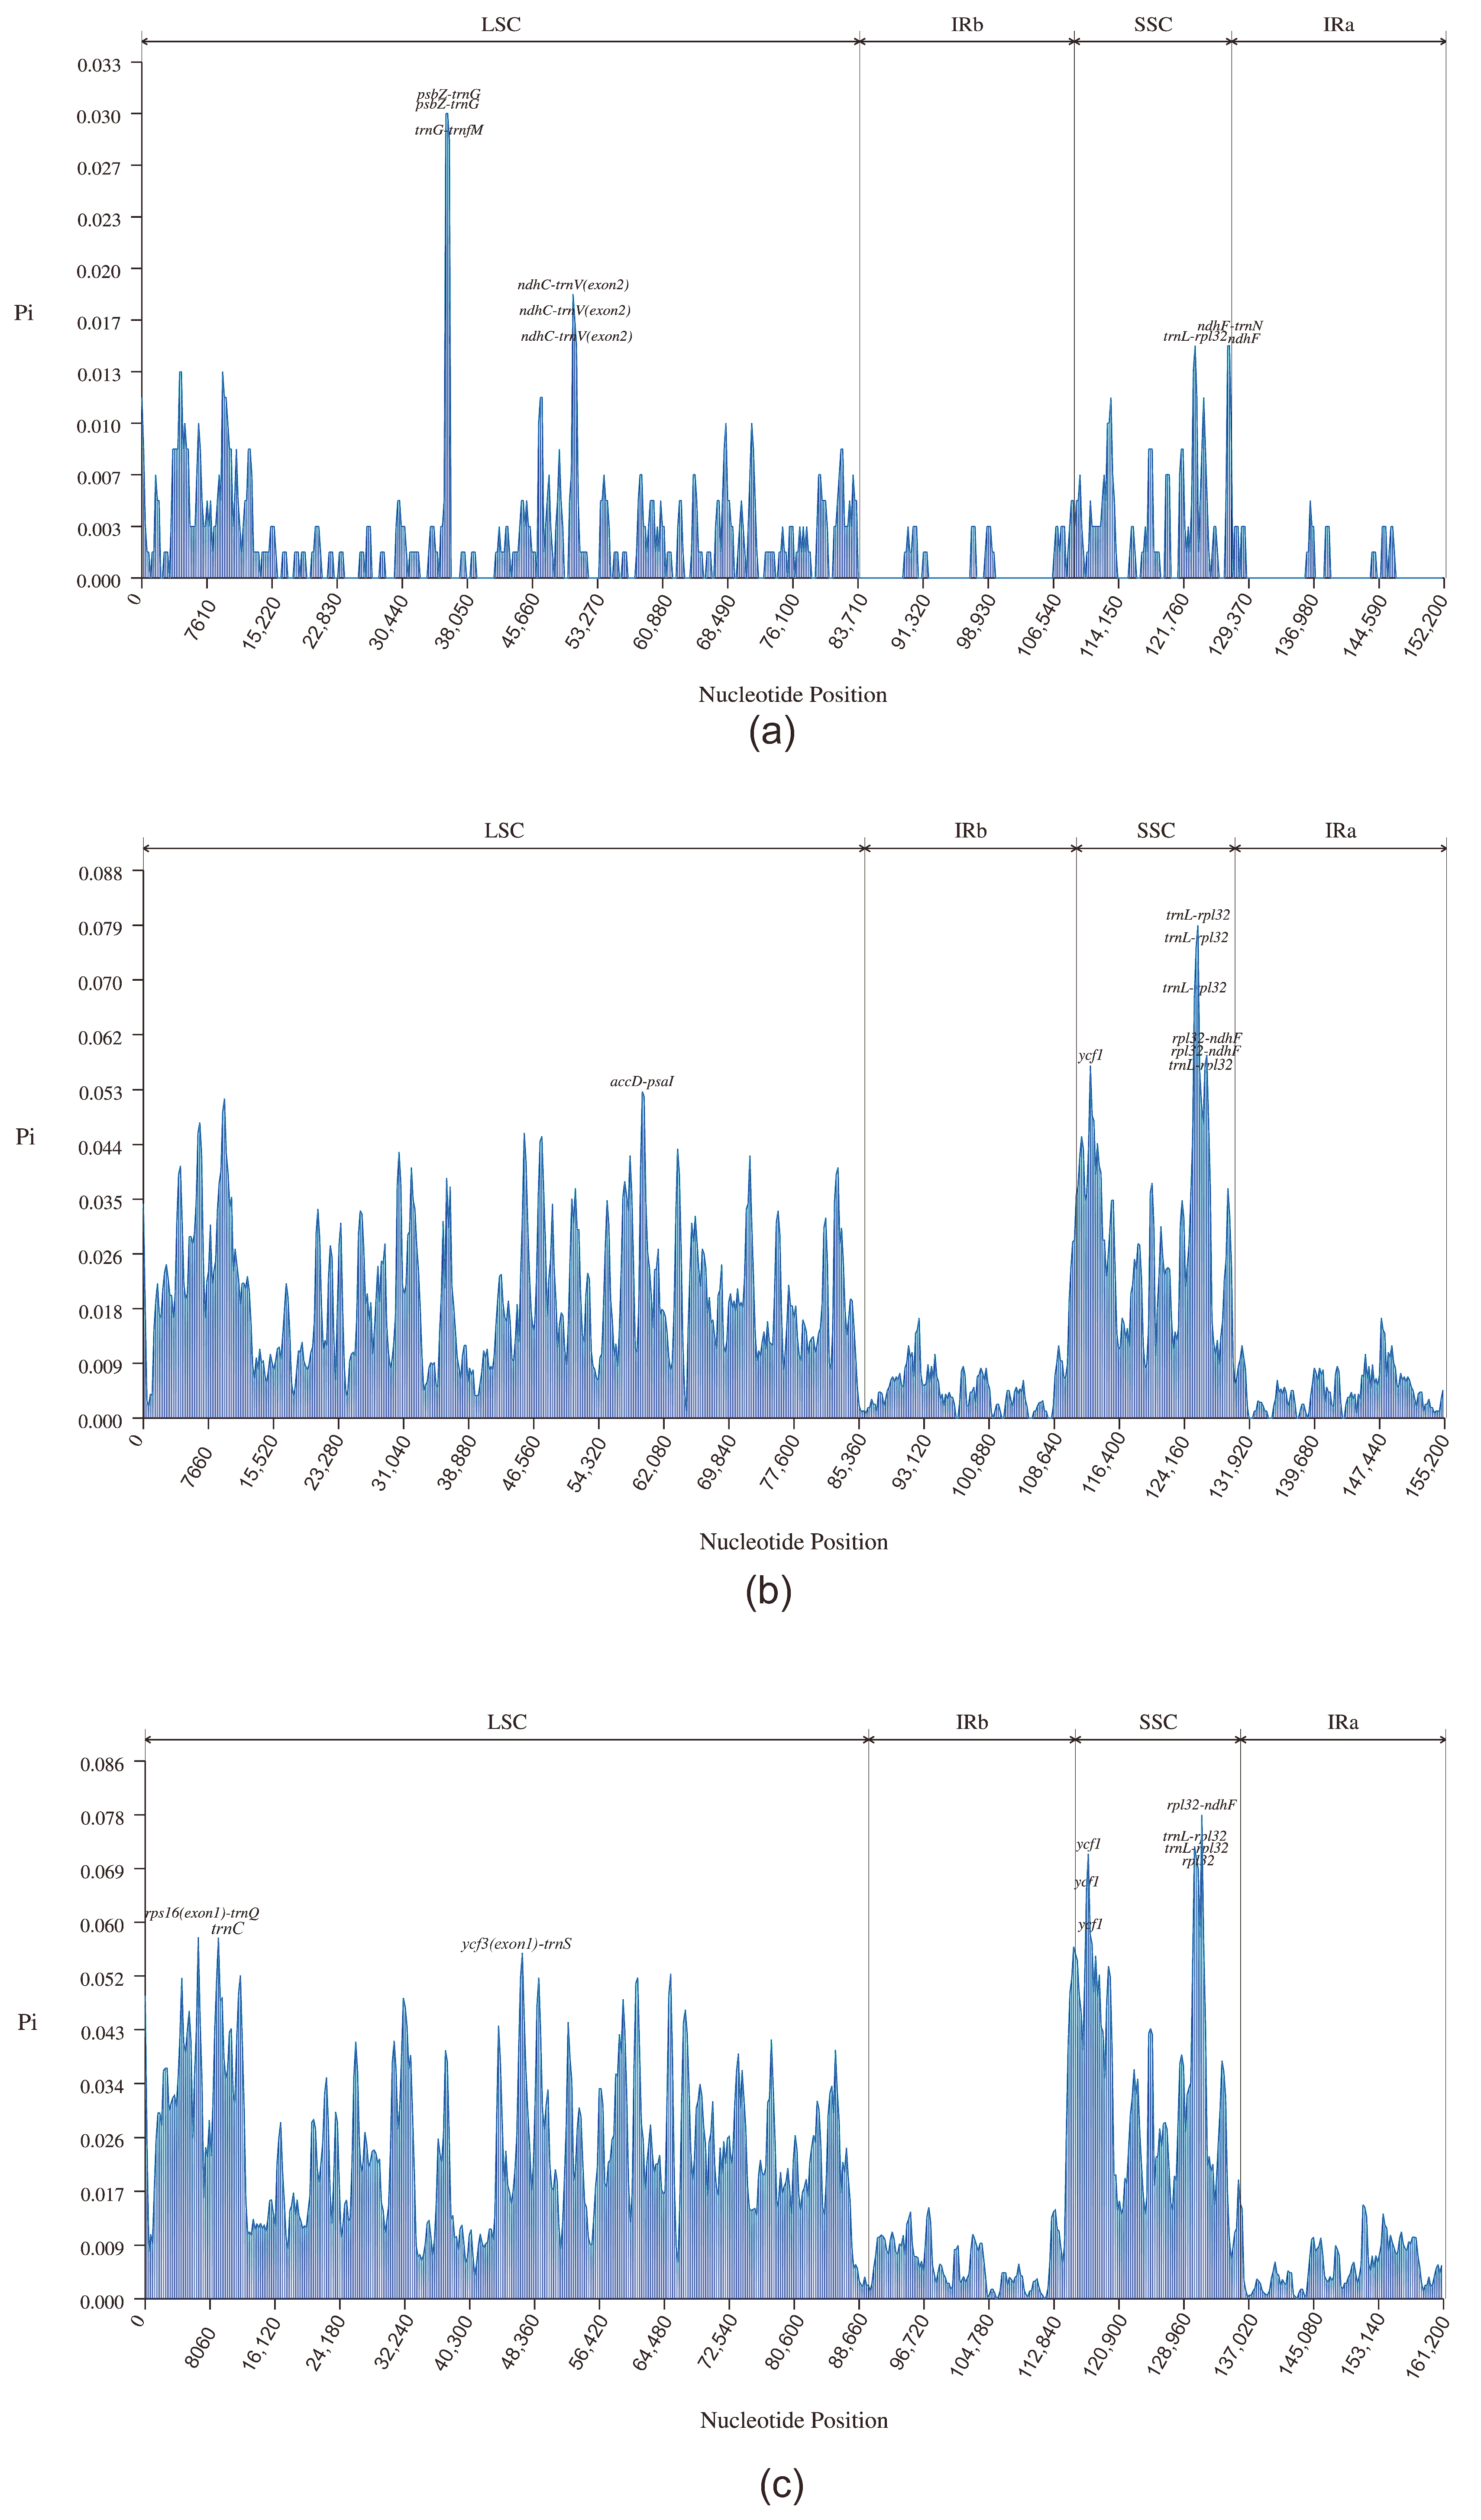
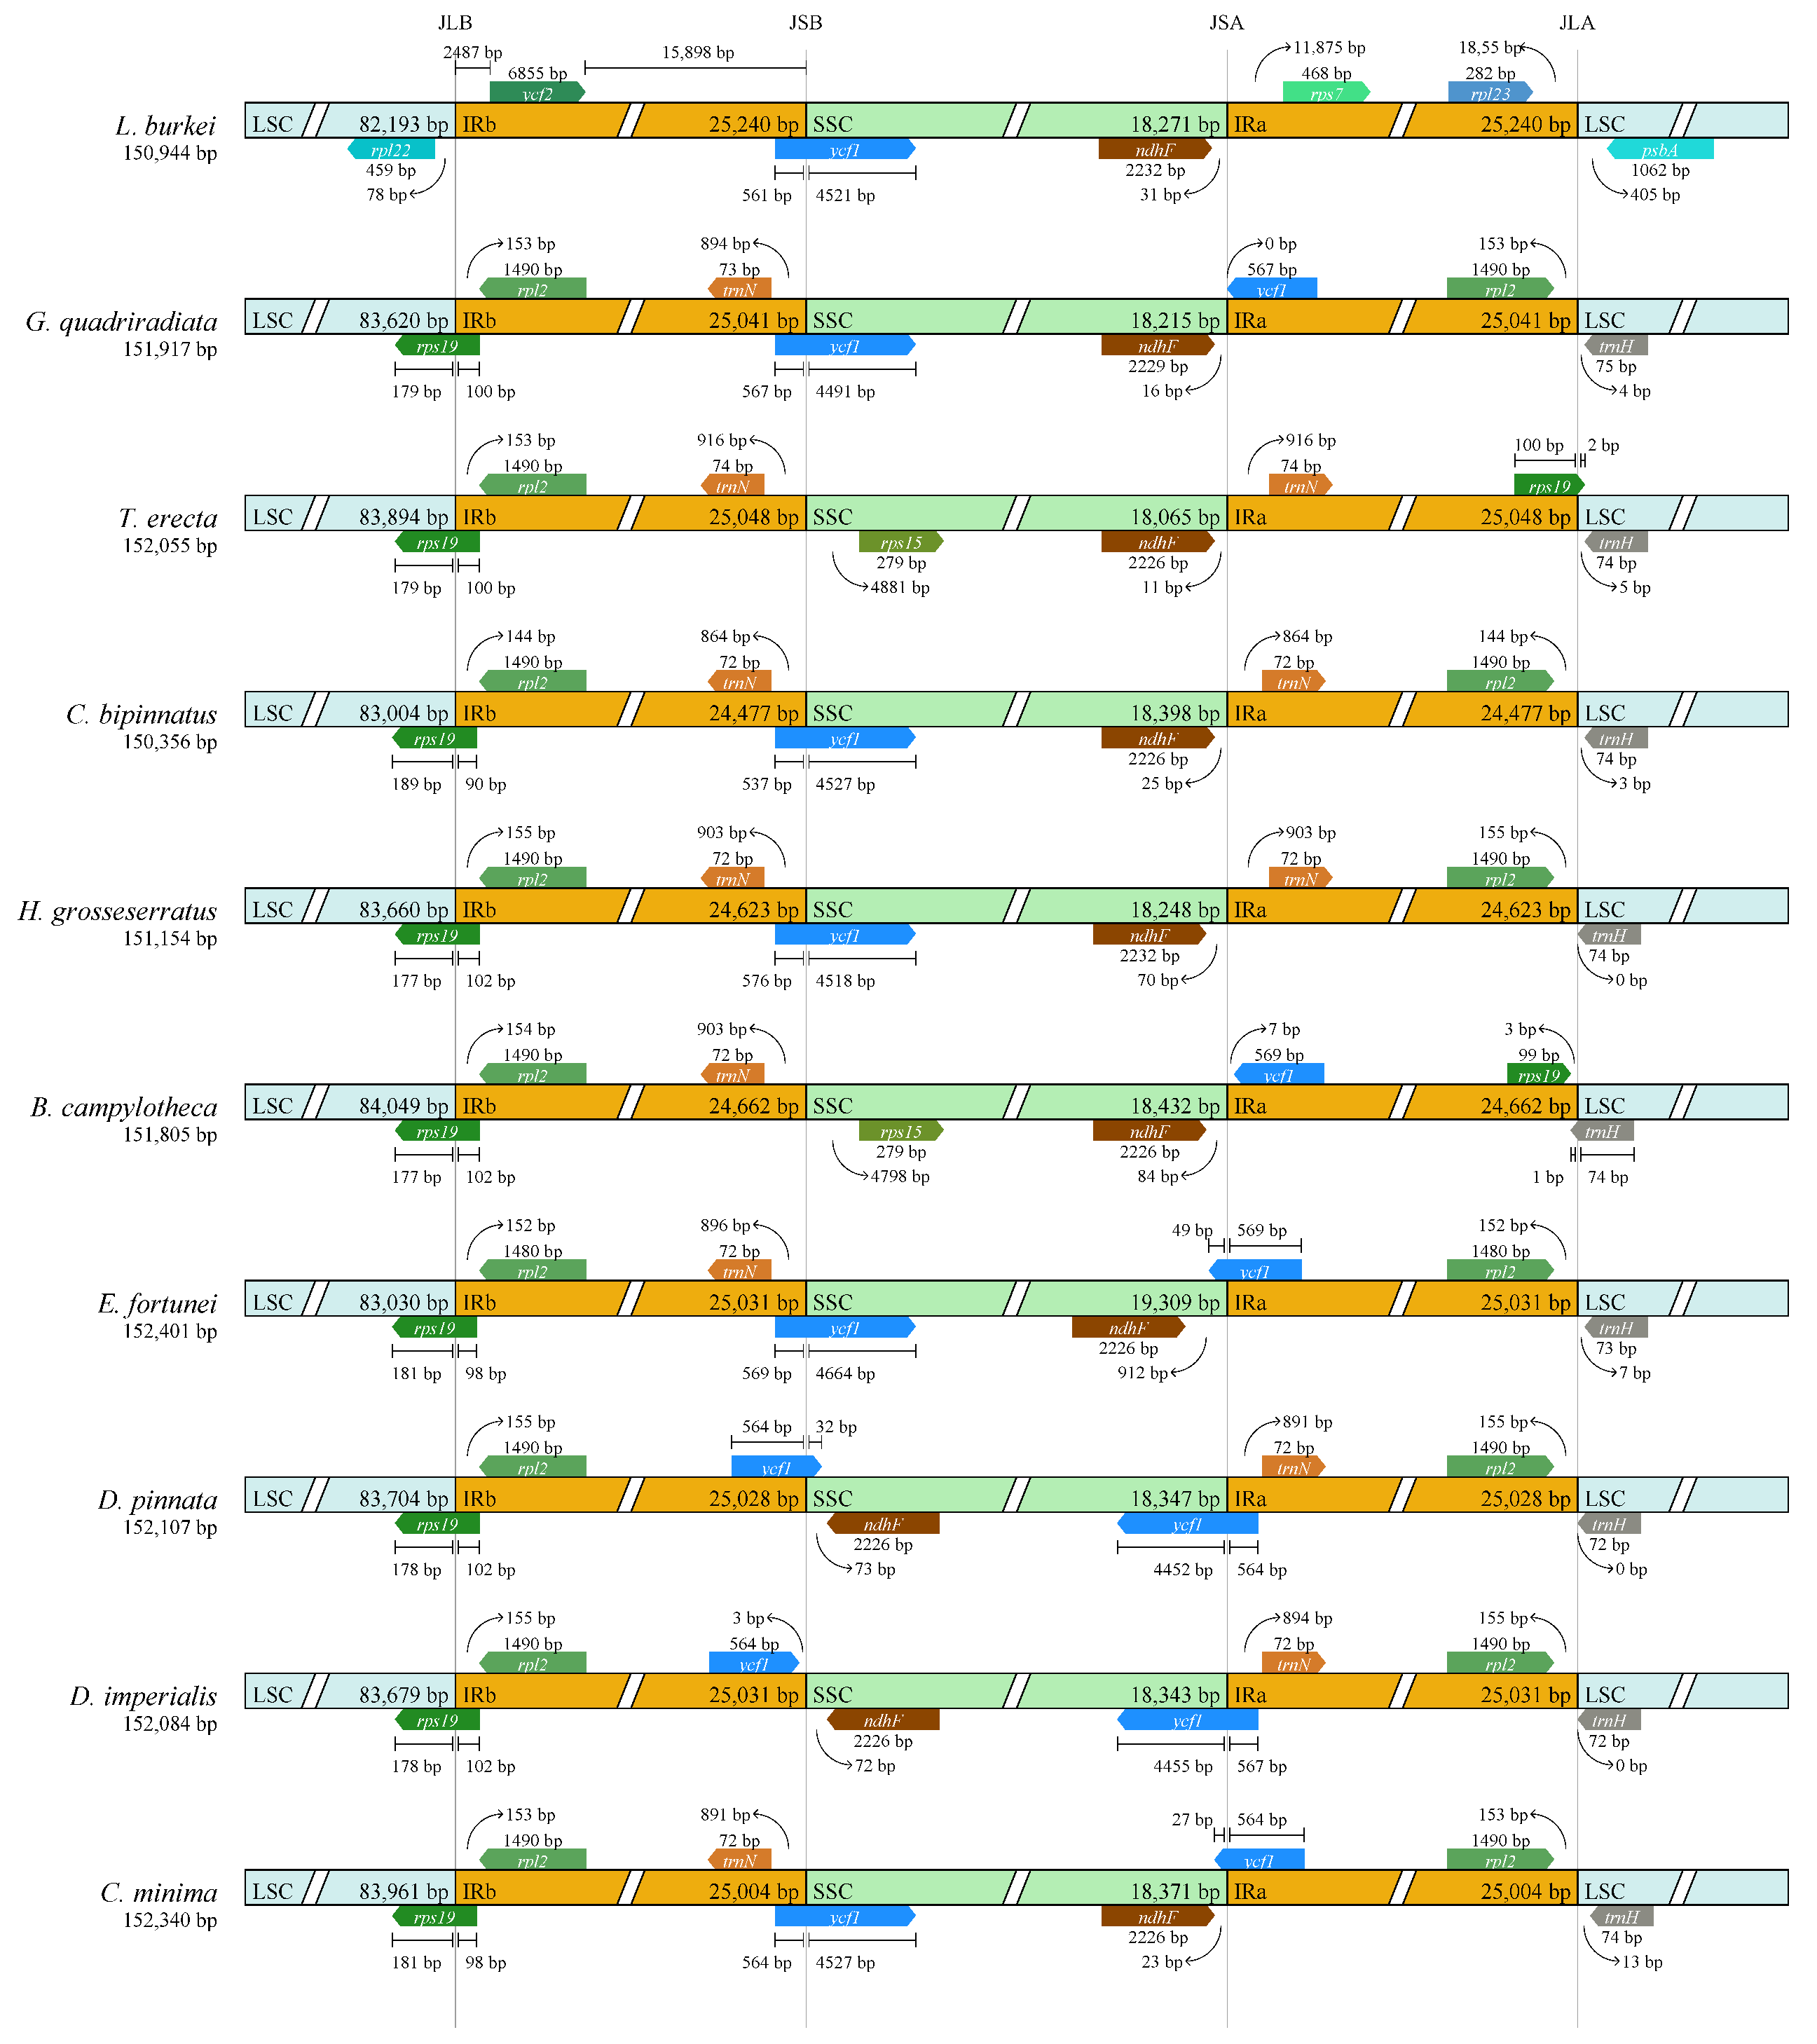
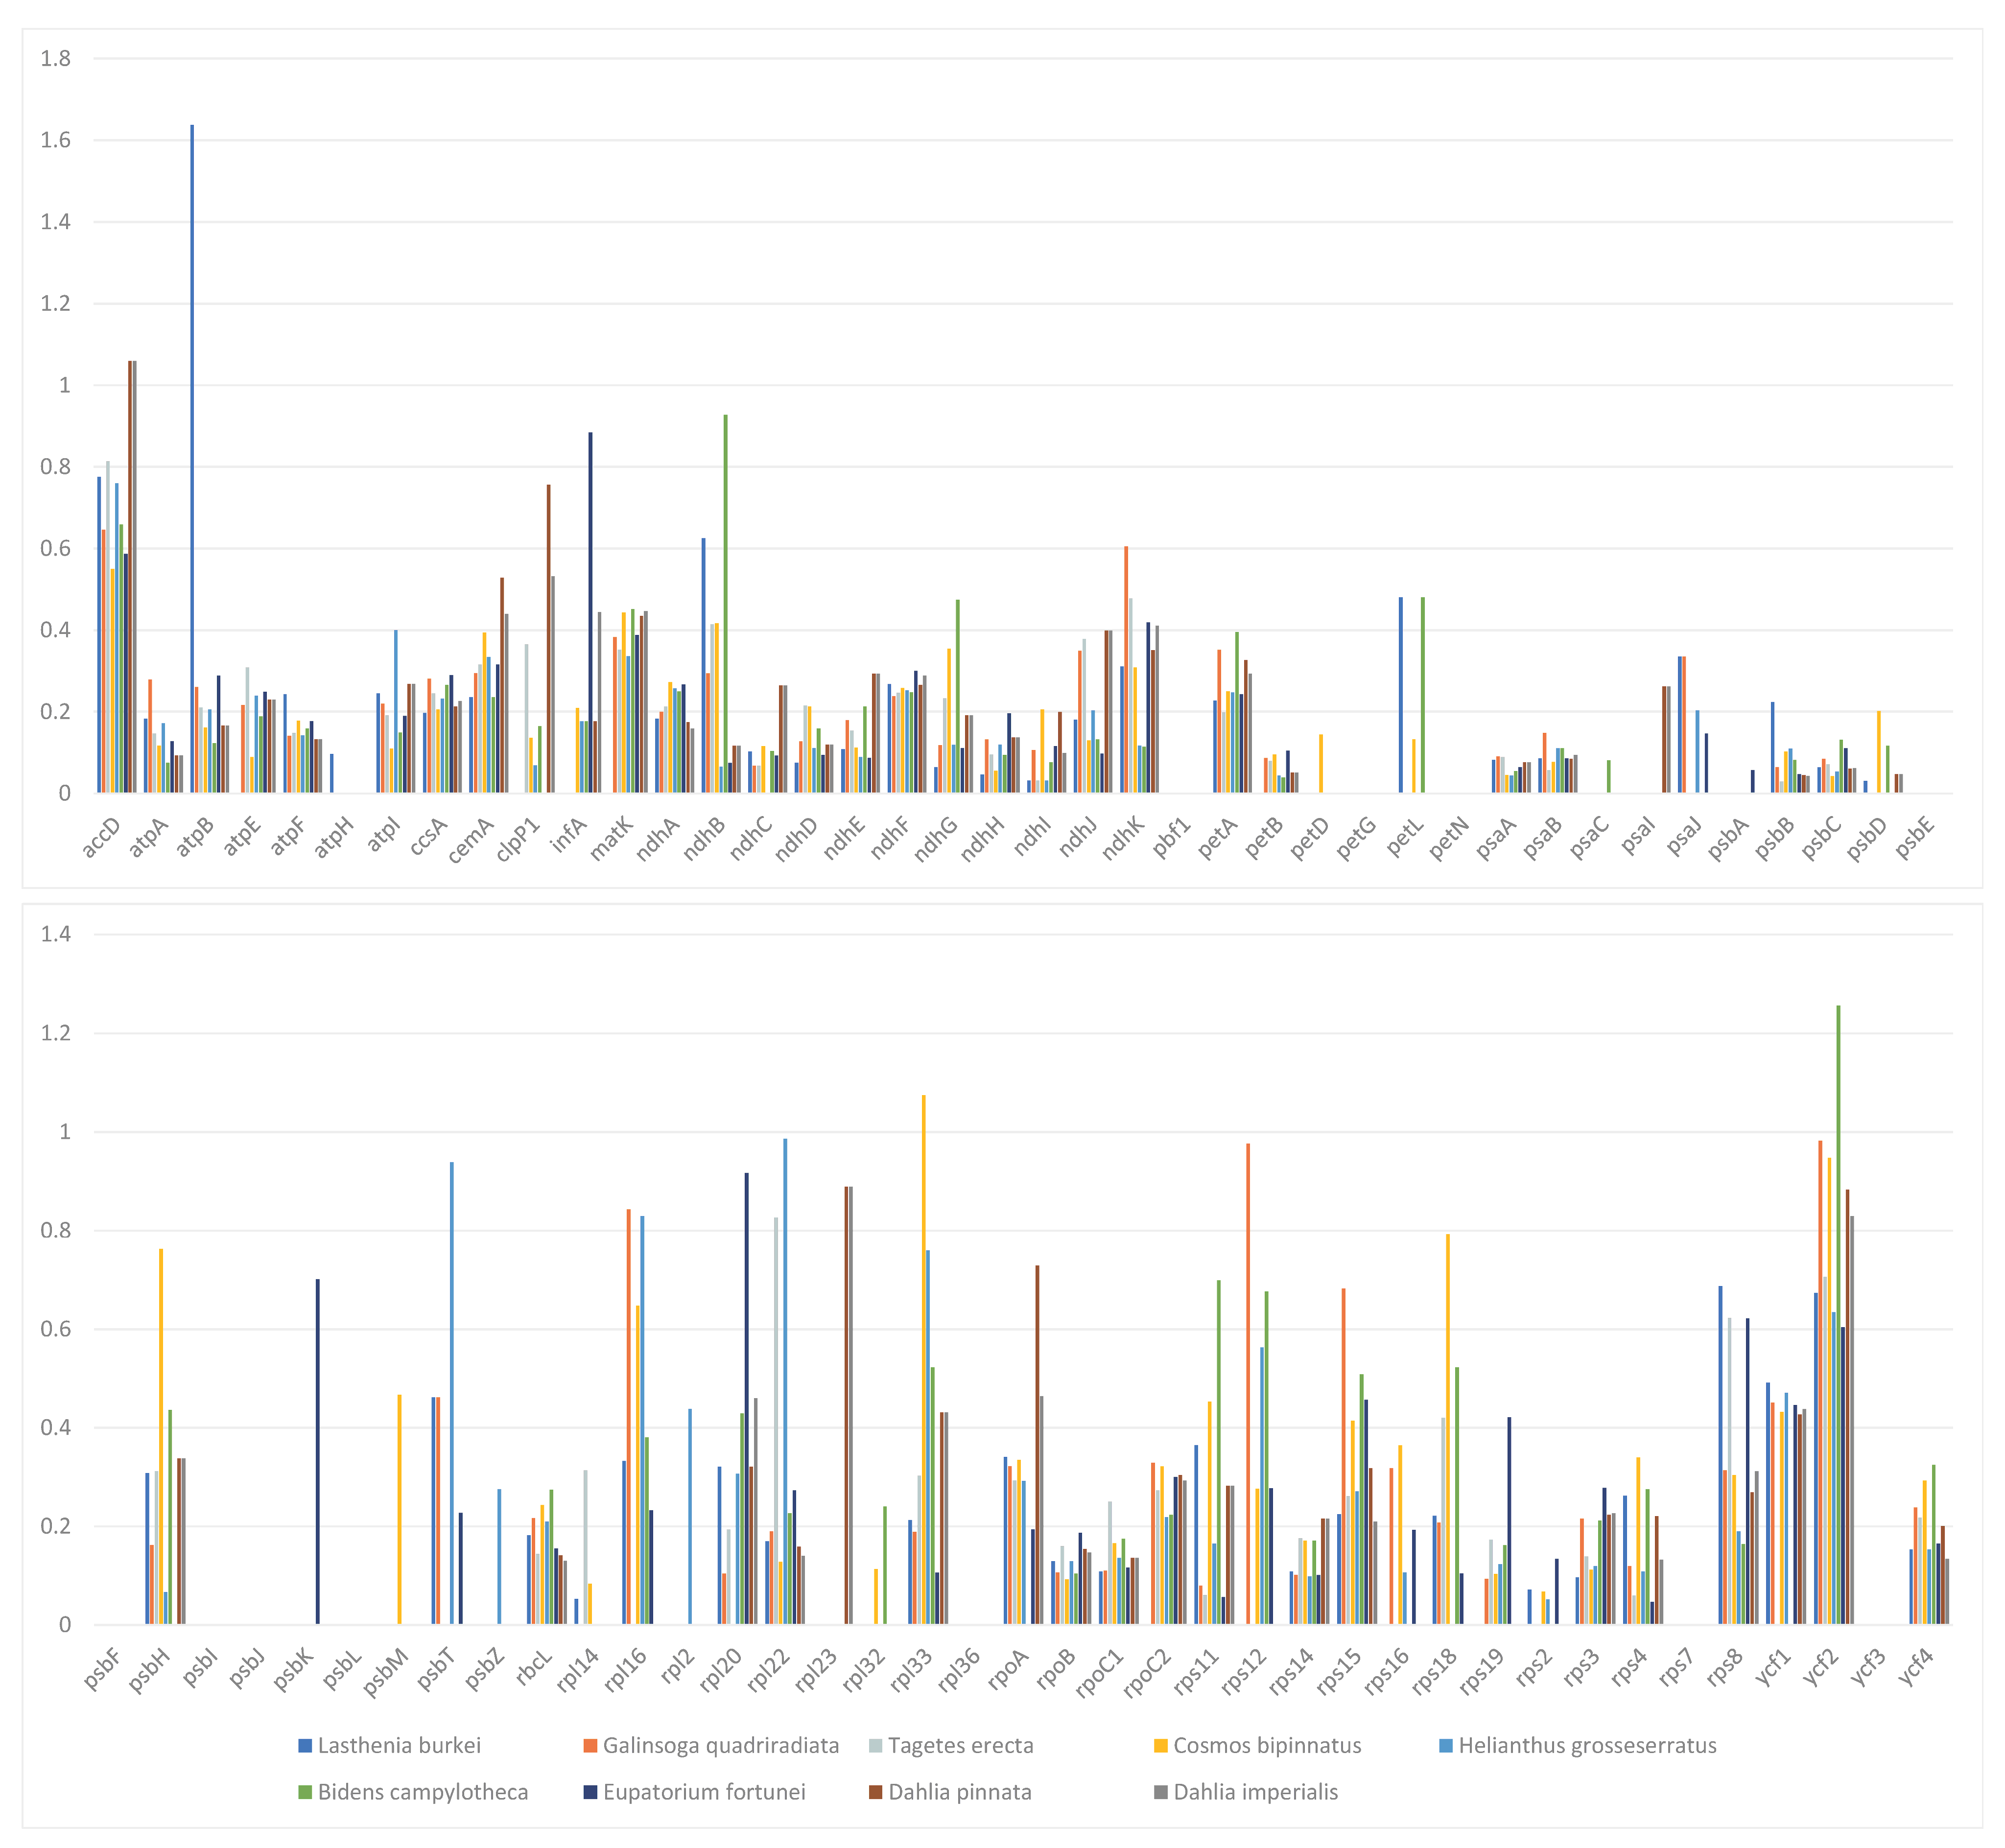
3.4. Comparative Analysis of the Chloroplast Genomes of D. imperialis and Its Related Species

Further, to assess the level of variation in DNA sequences of the Heliantheae alliance, we selected 2, 4, and 10 chloroplast genome data sets for sequence comparison among the Dahlia species, the Coreopsideae subtribe, and the Heliantheae alliance, respectively. First, we determined the nucleotide diversity (Pi) values of the complete chloroplast genome. The average Pi value was the highest for the SSC region for all three levels. The locus with the highest Pi value in the Dahlia genus (Figure 6a) was psbZ-trnG (0.03), located in the LSC region. In addition, psbZ-trnG, trnG-trnfM, ndhC-trnV (exon2), trnL-rpl32, ndhF, and ndhF-trnN had high Pi values within the Dahlia genus. Within this genus, psbZ was identified as a highly variable gene that may be used as a barcode for D. imperialis. At the intergeneric level within Coreopsideae (Figure 6b), the locus with the highest Pi value was trnL-rpl32 (0.79) in the SSC region. Additionally, rpl32-ndhF, ycf1, rpl32-ndhF, trnL-rpl32, and accD-psaI loci had high Pi values at the intergeneric level. Finally, rpl32, ndhF, ycf1, accD, and psaI were identified as the highly variable genes among these genera. At the subtribal level, rpl32-ndhF (0.07759), located in the SSC region, had the highest Pi value (Figure 6c). Additional loci with high Pi values were trnL-rpl32, ycf1, trnL-rpl32, rpl32, rps16(exon1)-trnQ, trnC, and ycf3(exon1)-trnS. Here, rpl32, ndhF, ycf1, rps16, and ycf3 were identified as highly variable genes, mainly located in the SSC region, with significant mutation.
We then analyzed the contraction and expansion of the IR/LSC and IR/SSC junctions across 10 chloroplast genomes. The results showed extremely high similarity within the Dahlia genus (Figure 7). Compared with D. pinnata, D. imperialis had a 3 bp contraction on the SSC side of the IR region. Within Coreopsideae, all four chloroplast genomes were extremely similar. Compared with Dahlia, the genera Bidens and Cosmos had a 30–50 bp shrinkage in the SSC region. Then, we compared the contraction and expansion of the IR/LSC and IR/SSC at the subtribal level. L. burkei had noticeably fewer bases than the other nine species (approximately 180 bp) in the LSC side but significantly more bases on the IRb side. This observation suggests a clear expansion from the IR region towards the LSC region in L. burkei. In addition, the bases of E. fortunei on both sides of the SSC (344 bp and 912 bp) were significantly longer than those in the other nine species, indicating an apparent contraction on the IR side close to E. fortunei’s SSC.
Finally, we compared the complete chloroplast genomes of nine representative species from six subtribes in the Heliantheae alliance using C. minima as a reference (Figure 8). Analysis of the Ka/Ks ratio of 79 protein-coding genes in these 9 chloroplast genomes showed values less than 1 for most encoded genes; however, a few genes had a Ka/Ks value of zero, indicating the conserved nature of these genes. No genes with a Ka/Ks value greater than 1 were identified among any of the nine species. However, the Ka/Ks value exceeded 1 for accD of D. imperialis and D. pinnata, rpoB of L. burkei, rpl33 of C. bipinnatus, and ycf2 of B. campylotheca, suggesting the influence of natural selection on the base mutations in these genes.

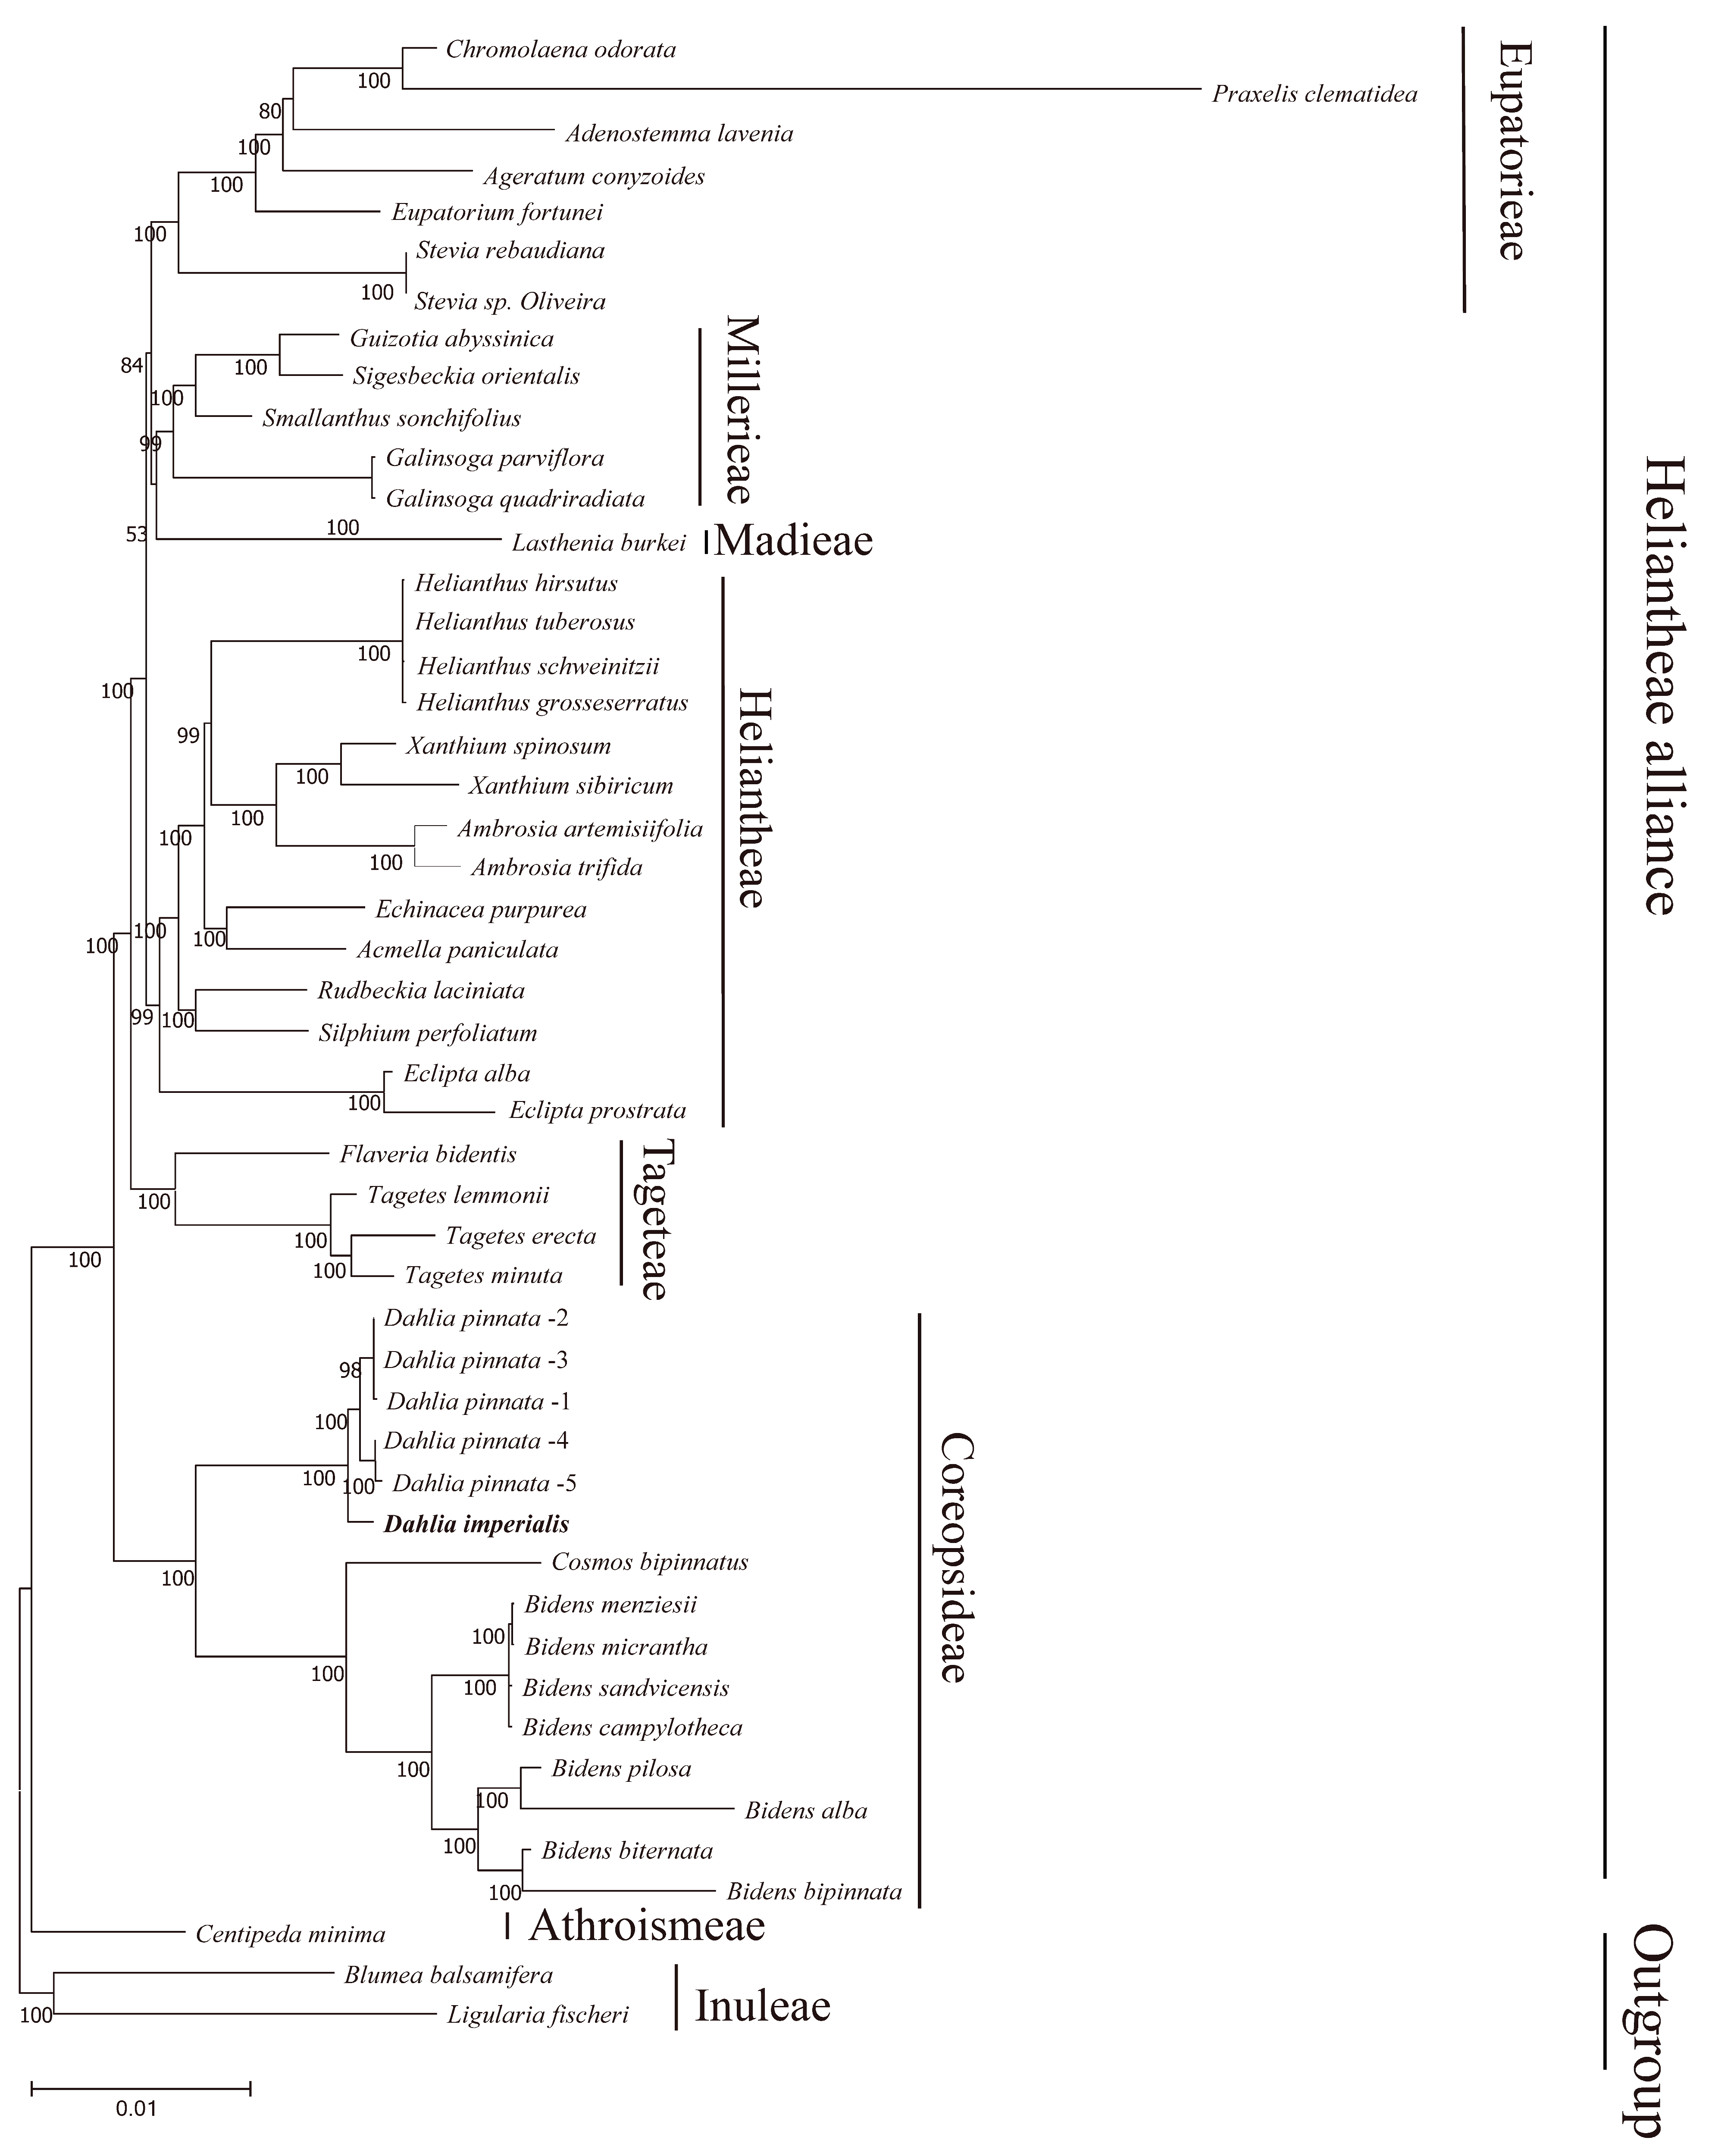
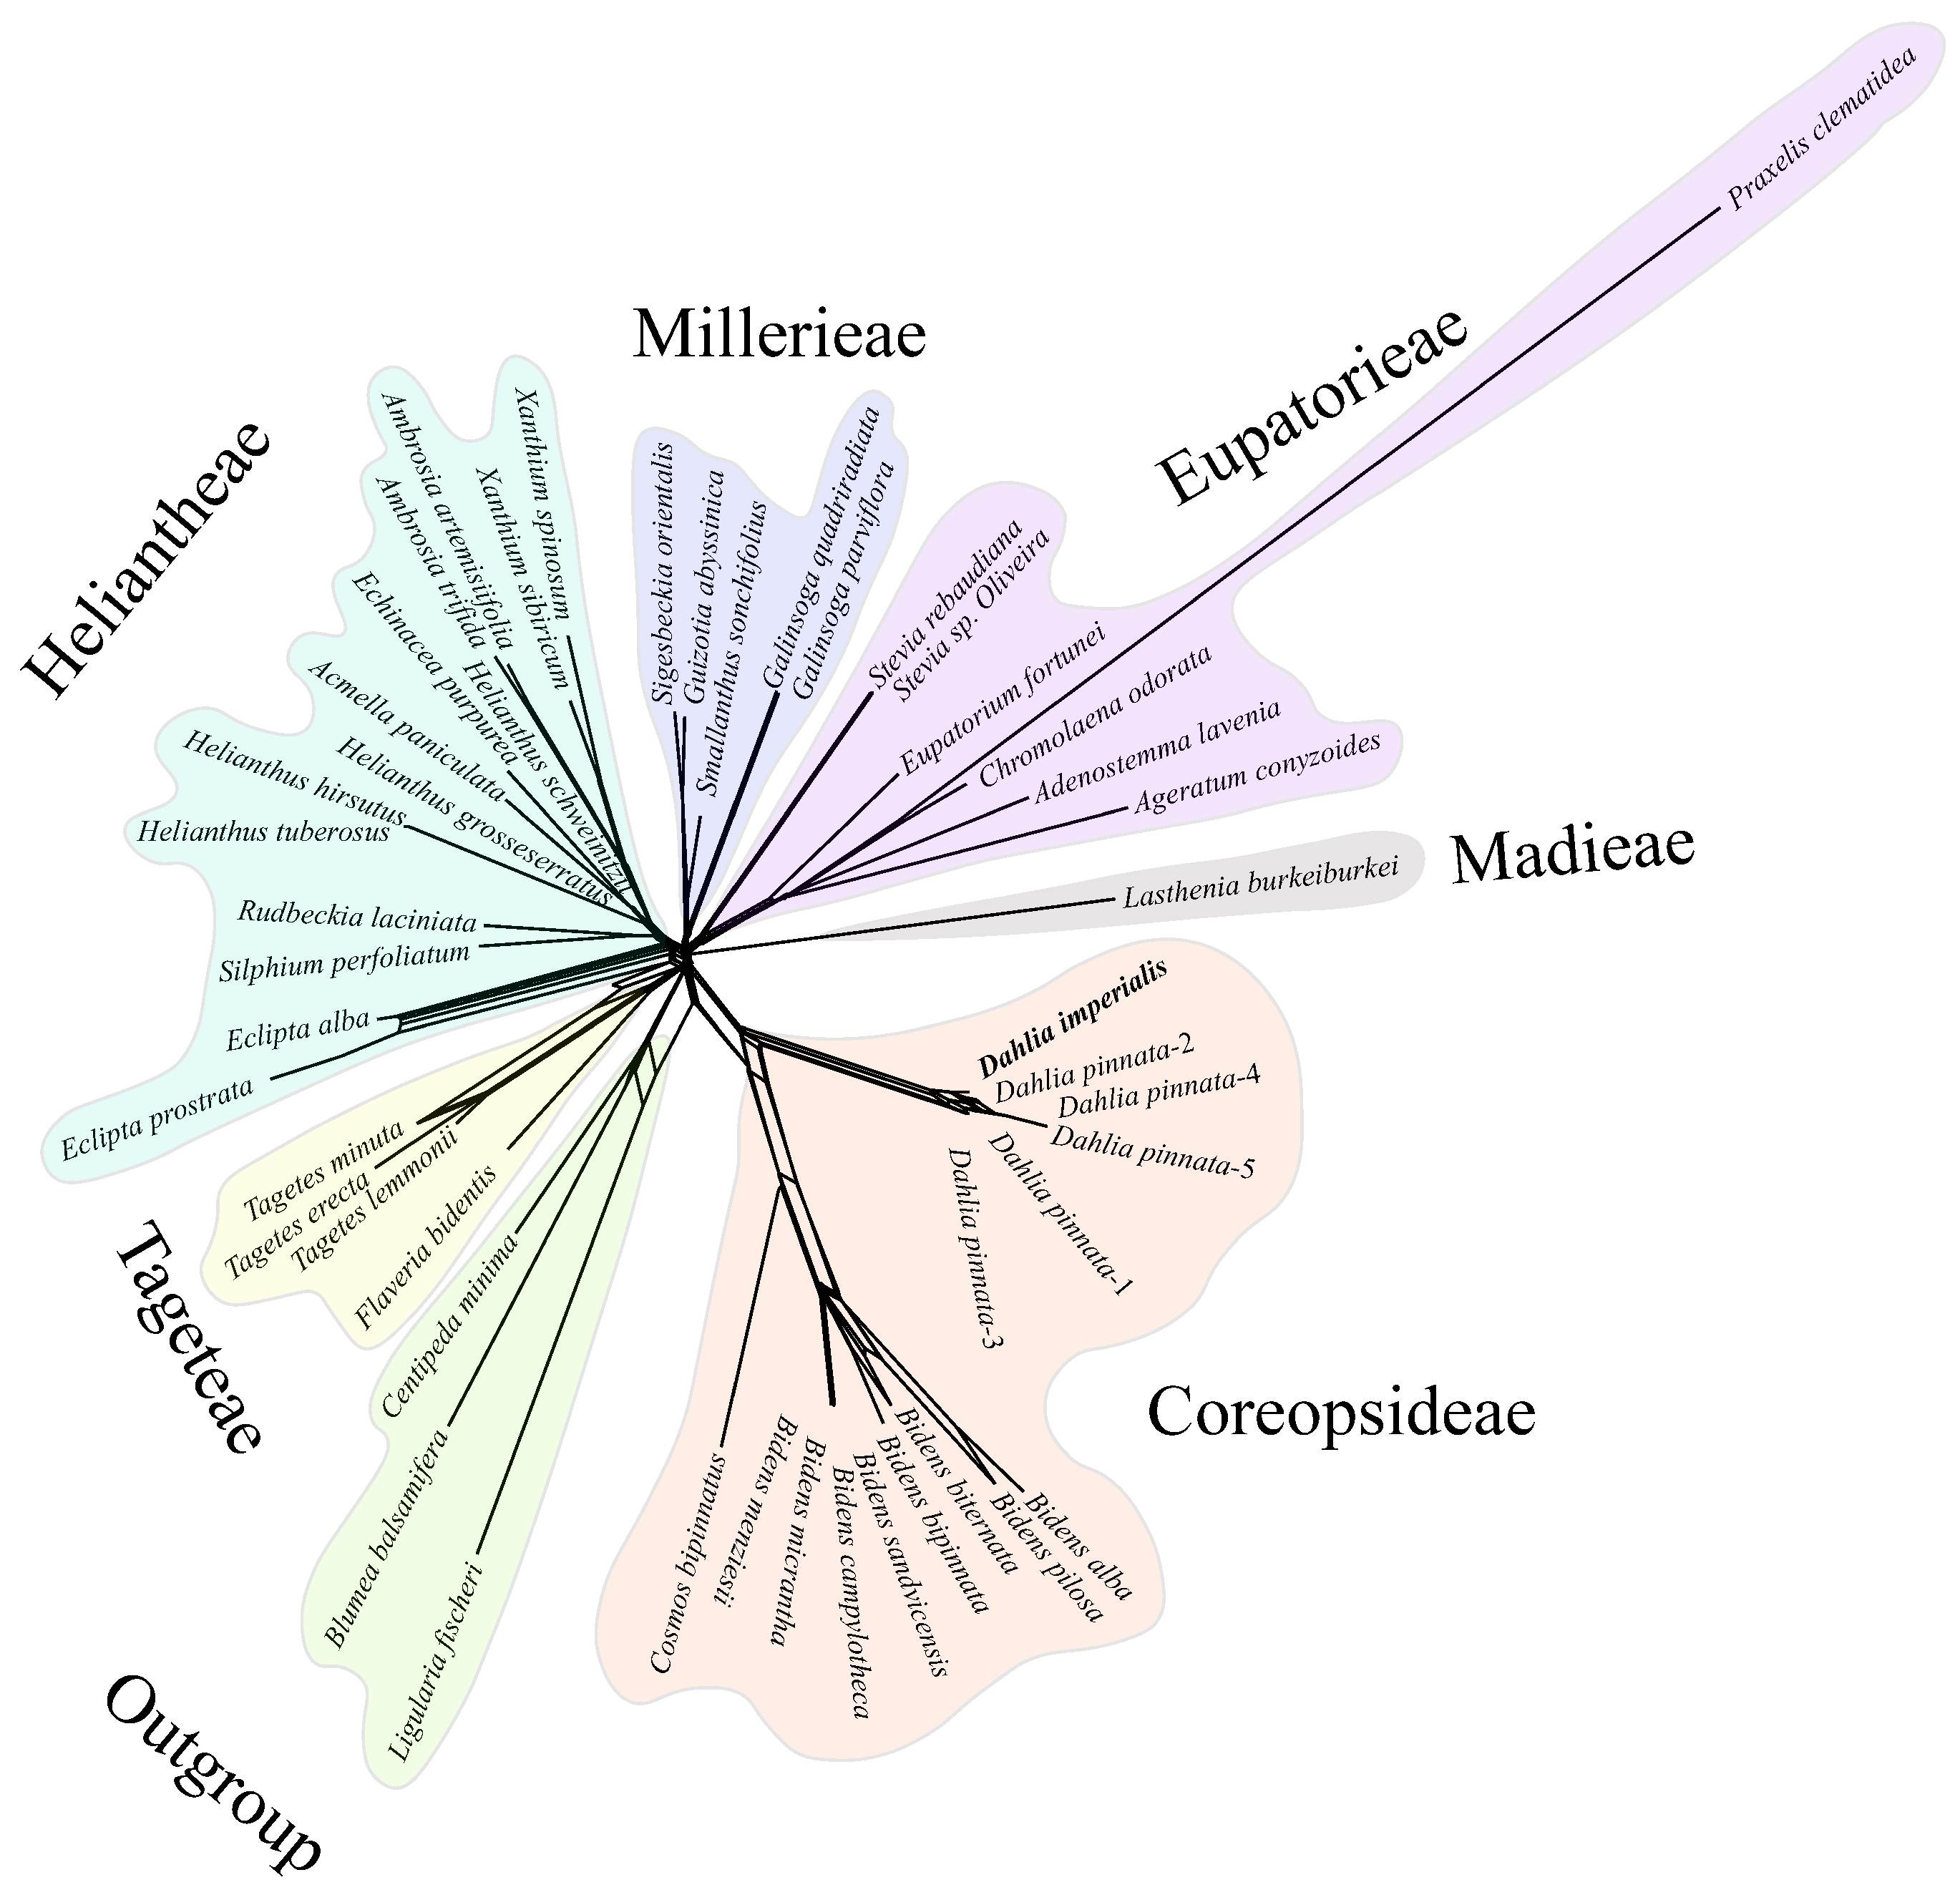
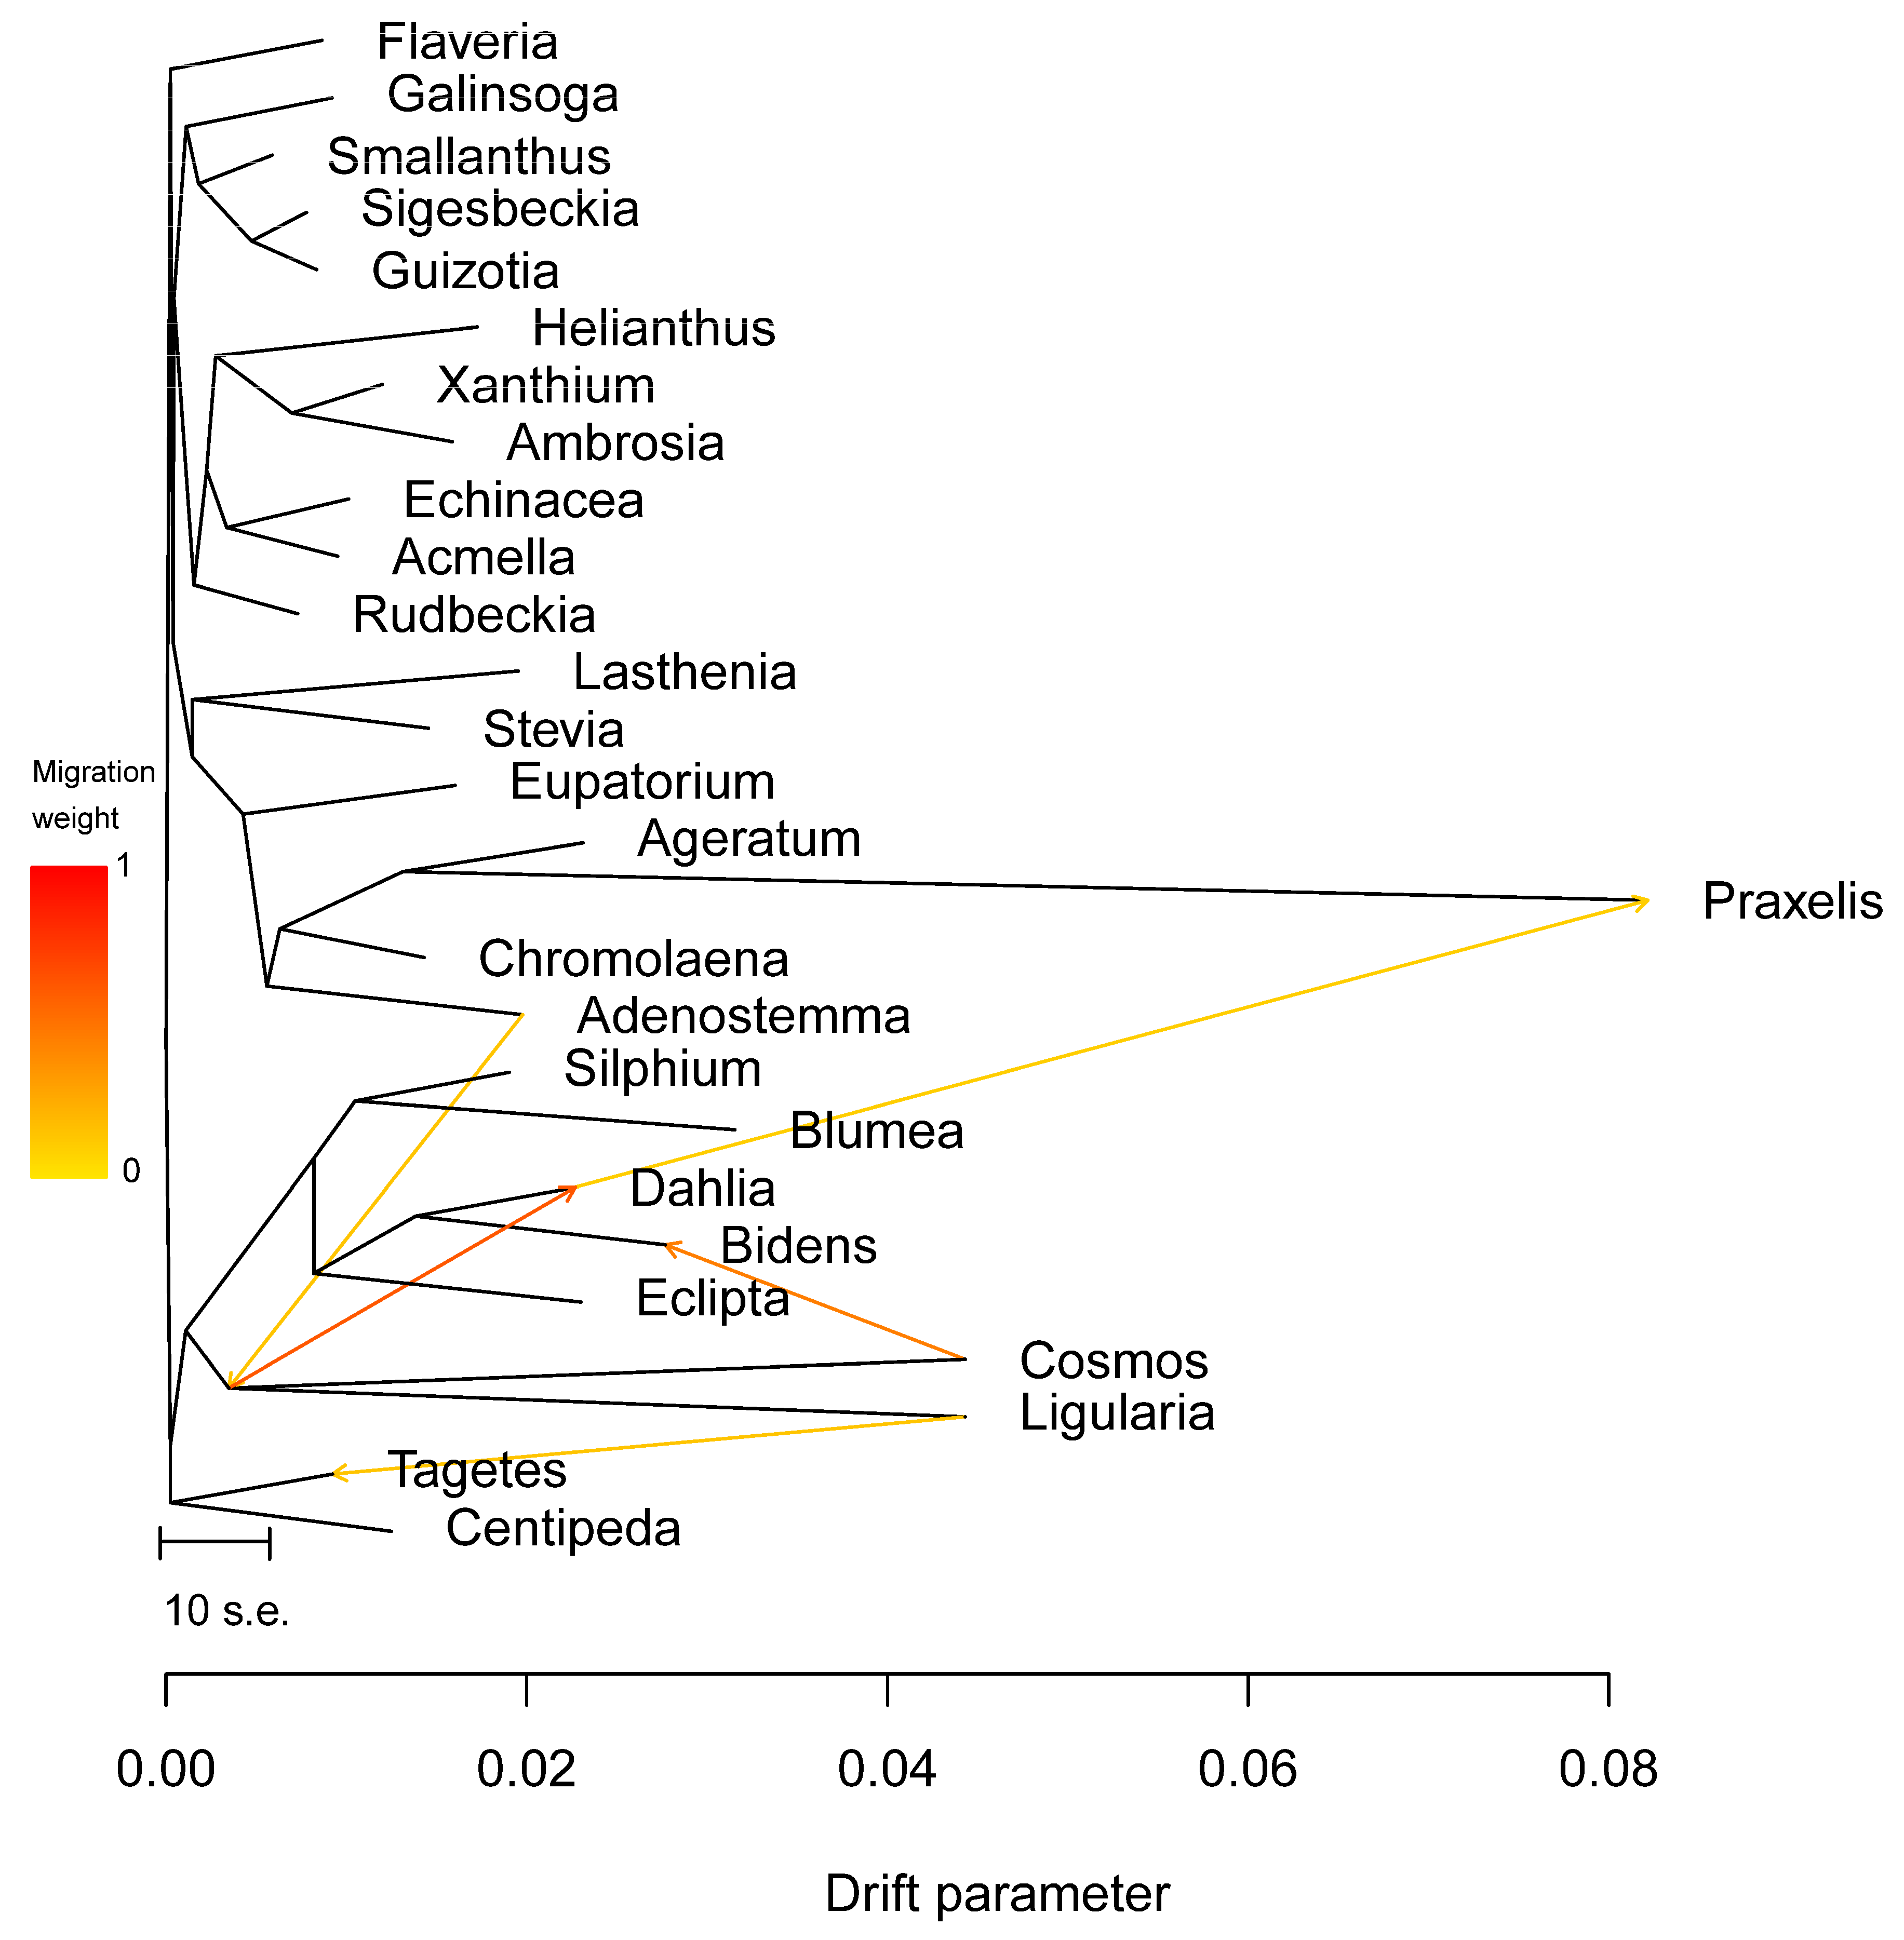
3.5. Phylogenetic Inference

In order to determine the position of D. imperialis in phylogeny, we downloaded 49 complete chloroplast genomes from NCBI, including 46 chloroplast genomes of the Heliantheae alliance and 3 outgroups, and reconstructed the phylogenetic tree of the Heliantheae alliance. The maximum likelihood tree reconstructed by PhyML had 42 nodes, of which only one node had a relatively low support rate (53%), six nodes had a support rate of 80–99%, and all others had a support rate of 100% (Figure 9). This observation indicated the high reliability of the clustering results. The phylogenetic tree showed that 45 complete chloroplast genomes of 24 genera covered 6 subtribes of the Heliantheae alliance. Here, the Dahlia species formed a monophyletic group, with D. imperialis located at the group’s base. In this study, Bidens was positioned as a sister group to Cosmos, whereas an earlier nuclear genome analysis indicated that Dahlia was the sister group to Cosmos [13]. Moreover, members of the Heliantheae subtribe demonstrated a closer phylogenetic relationship with Eupatieae–Madieae, whereas nuclear genomic topology previously revealed that Heliantheae and Corepsideae were sister groups.
Further, we conducted network evolution and gene flow analysis on 49 chloroplast genomes to explore the topological structure differences. The network evolution showed a complex network structure, indicating numerous hybridization events within Coreopsideae among Dahlia, Cosmos, and Bidens within the Dahlia genera and Bidens (Figure 10). Moreover, a few hybridization events were detected within Heliantheae. Subsequent gene flow analysis showed that the arrow color between Dahlia, Cosmos, and Bidens was the reddest, indicating that there was a high degree of gene exchange between the three based on the highest migration weight (Figure 11). Therefore, we speculated that frequent genetic exchange and hybridization events were the main reasons for the inconsistency in the phylogeny. We also assume that Cosmos might have formed due to hybridization between Dahlia (the paternal parent) and Bidens (the maternal parent).

4. Discussion

The cultivation history of Dahlia is short, and the commercial species have undergone multiple hybridizations and selections during the breeding process [3]. However, there are few species applied. The current commercial species of Dahlia is mainly formed through breeding, mutation backcrossing, and reciprocal crossbreeding techniques originating from D. pinnata and D. coccinia from Mexico and their hybrid offspring [1,4]. Therefore, for the genus Dahlia (about 40 species), a large number of species resources are not applied in the production practice of Dahlia. A multitude of wild traits and unknown superior genes lie dormant in numerous wild species of Dahlia. Effective interpretation, development, and utilization of the superior original species resources of Dahlia could bring new vitality to the research and industrial application. The interpretation of the chloroplast genome of D. imperialis is a good starting point.
Analyzing the chloroplast genome sequences provides comprehensive information for plant phylogenetic studies. In addition, using chloroplast markers in DNA barcoding helps identify plant species efficiently [42,43]. The Dahlia genus has approximately 40 species [1,2], of which only D. pinnata has a published complete chloroplast sequence. This limits its systematic evolution research. The present study successfully assembled the complete chloroplast genome of D. imperialis using Illumina sequencing data, providing resources for promoting phylogenetic studies.
Like most land plants, D. imperialis, the species analyzed in this study, has a chloroplast genome with a highly conserved structure and gene content. Similar to other flowering plants, D. imperialis also lacks chlB, chlL, chlN, and trnP-GGG genes [44]. Typically, a higher GC content increases DNA density, enhancing the sequence’s conservation and rigidity [45]. Our results showed variations in GC content amongst different regions, with the IR region exhibiting a higher GC content primarily due to the presence of rRNA [46]. The high GC content in these regions probably plays a crucial role in maintaining the chloroplast genome’s fundamental composition and structural stability.
Interspersed repeats and SSRs are widely present in plant chloroplast genomes [47]. Interspersed repeats are crucial for studying genome recombination and rearrangement and can cause substitutions and insertions in the chloroplast genome [48]. Due to the variations in the type, quantity, and location of repetitive sequences among species, they are widely used for identifying mutation loci and establishing phylogenetic relationships [49]. The present study identified numerous interspersed repeats and SSRs in D. imperialis compared to the Senecioneae [50] and Sonchus [51] species of the Asteraceae family, which is advantageous for Dahlia phylogenetic research. Moreover, these SSR markers, which are associated with desirable traits, can be utilized in breeding and developing improved target varieties [48].
Furthermore, the highest nucleotide diversity value was detected for the SSC in the chloroplast genome of D. imperialis. In addition, trnL-rpl32-ndhF was identified as the most highly mutative genetic locus shared at all three levels. In addition to the introns of trnL and ndh F, which have been used in the phylogeny of Asteraceae [11], we also found relatively high Pi values for accD, psbL, ycf1, psbZ, ycf3, and rps16, which serve as candidate regions for molecular markers at different levels. In addition, the Ka/Ks values of most genes in the six representative subtribe species of the Heliantheae alliance were less than 1, indicating that purifying selection was present among these species. Interestingly, the Ka/Ks values of accD in Dahlia, rpl33 in C. bipinnatus, and ycf2 in B. campylotheca were greater than 1, which indicates that these genes were affected by environmental selection. In Arabidopsis, variations in the editing efficiency of accD directly affect the activity of the fatty acid biosynthetic enzyme acetyl-CoA carboxylase (ACCase). This difference influences the synthesis of unsaturated fatty acids and the stability of biological membranes at high temperatures [52]. In Tobacco, rpl33 is essential for plants under cold stress [53]. However, the function of ycf2 is currently unknown. Therefore, accD and rpl33 are the genes involved in the response to abiotic stress. In addition, the genes with Ka/Ks values greater than 1 were different among the three species, which indicates the diversity in genetic loci and molecular mechanisms that these three species utilize in response to environmental selection.
Chloroplast genomes have been widely utilized in reconstructing phylogenetic relationships and understanding evolutionary history [54]. The phylogenetic tree reconstructed in this study based on 49 chloroplast genomes is largely consistent with those constructed from 10 chloroplast gene markers [10]. However, some topological differences exist compared to the phylogenetic tree reconstructed based on nuclear genomes [12]. Members of the Heliantheae subtribe demonstrated a closer phylogenetic relationship with Eupatieae–Madieae, whereas nuclear genomic topology previously revealed that Heliantheae and Corepsideae were sister groups, consistent with the findings of Liu et al. [12]. Based on phylogenetic inconsistency, we further performed networked evolution analysis and gene flow analysis. The results showed the occurrence of extensive hybridization events within Dahlia, similar to its breeding history with D. pinnata. The networked evolution analysis, gene flow analysis, and the differences in the topologies of nuclear and chloroplast genomes among the three genera (Dahlia, Cosmos, and Bidens) further support the significant role played by Dahlia in the origin of Cosmos. Additionally, we identified two sites of phylogenetic incongruence (putative hybrid origin sites) based on our limited samples. Thus, additional sites of phylogenetic incongruence within the Heliantheae alliance, the broader subfamily of Asteraceae, or even within a wider range of Asteraceae plants are unknown.

5. Conclusions

The present study determined the chloroplast genome sequence and structure of D. imperialis, which are highly similar to those of the Heliantheae alliance. The comprehensive analysis of the complete chloroplast genome of D. imperialis enriches the information we have on the genetic resources of Dahlia species. The work also detected codon usage preference in D. imperialis, which probably resulted from natural selection and mutations. We also identified numerous repeat sequences and SSRs, which could serve as potential sources for molecular markers. Comparative analysis of the chloroplast genomes revealed highly variable genes at different levels and differences in genes involved in environmental adaptation among species. The results of the phylogenetic, network evolution, and gene flow analysis indicate that extensive hybridization events have occurred within Dahlia, consistent with the artificial breeding history of this genus. It is necessary to obtain more chloroplast genome information of the Dahlia germplasm or Asteraceae species to further improve the phylogenetic relationship of Dahlia and Asteraceae.

Supplementary Materials

The following supporting information can be downloaded at: https://www.mdpi.com/article/10.3390/horticulturae10010007/s1, Figure S1: Read coverage depth map in D. imperialis chloroplast genome; Table S1: Reconstruction of the sequence information of the phylogenetic tree; Table S2: Gene composition in this chloroplast genome; Table S3: Codon usage in the D. imperialis chloroplast genome; Table S4: Interspersed repeat information in the D. imperialis chloroplast genome.

Author Contributions

Conceptualization, S.-C.N. and D.-F.C.; methodology, S.-C.N.; software, S.-D.D.; validation, Y.L., L.-H.H. and D.-Y.X.; formal analysis, S.-D.D.; investigation, D.-Y.X. and W.-B.Y.; resources, J.L. and W.-B.Y.; data curation, S.-C.N. and L.-H.H.; writing—original draft preparation, S.-D.D.; writing—review and editing, S.-C.N., S.-D.D., D.-F.C., L.-H.H. and Y.L.; visualization, Y.L.; supervision, S.-C.N., D.-F.C., J.L. and W.-B.Y.; project administration, S.-C.N. and D.-F.C.; funding acquisition, S.-C.N. and D.-F.C. All authors have read and agreed to the published version of the manuscript.

Funding

This work was supported by the Hebei Provincial Key R&D Program Project (20326814D), the Hebei Provincial Colleges and Universities Basic Research Task Fee Research Project (KY2021055), and the Natural Science Fund Project of Hebei Province (C2022204240).

Data Availability Statement

The genome sequence data that support the findings of this study are openly available in GenBank of NCBI at [https://www.ncbi.nlm.nih.gov] under the accession no. OP323060. The associated BioProject, SRA, and Bio-Sample numbers are PRJNA887522, SRR22094635, and SAMN31170944 respectively.

Conflicts of Interest

The authors declare no conflict of interest.

References

  1. Carrasco-Ortiz, M.; Munguía-Lino, G.; Castro-Castro, A.; Vargas-Amado, G.; Harker, M.; Rodríguez, A. Riqueza, distribución geográfica y estado de conservación del género Dahlia (Asteraceae) en México. Acta Bot. Mex. 2019, 126, 25. [Google Scholar] [CrossRef]
  2. Villaseñor, J.L.; Redonda-Martinez, R. A new species of Dahlia (Asteraceae, Coreopsideae) from the state of Oaxaca, Mexico. Phytotaxa 2018, 362, 239–243. [Google Scholar] [CrossRef]
  3. Yan, G.X. Overview and enlightenment of Dahlia industry development. Anhui Agric. Sci. Bull. 2020, 26, 38–39. (In Chinese) [Google Scholar]
  4. Whitley, G.R. The medicinal and nutritional properties of Dahlia spp. J. Ethnopharmacol. 1985, 14, 75–82. [Google Scholar] [CrossRef] [PubMed]
  5. Saravanan, Y.; Devaraj, B.S.; Velusamy, N.K.; Soundirarajan, P.S.; Kandaswamy, K. Phytochemical extracts of Leucas aspera and Dahlia pinnata exhibit antimicrobial properties in Escherichia coli and Enterococcus faecalis. Curr. Biotechnol. 2020, 9, 297–303. [Google Scholar] [CrossRef]
  6. Brighenti, F.; Casiraghi, M.C.; Canzi, E.; Ferrari, A. Effect of consumption of a ready-to-eat breakfast cereal containing inulin on the intestinal milieu and blood lipids in healthy male volunteers. Eur. J. Clin. Nutr. 1999, 53, 726–733. [Google Scholar] [CrossRef] [PubMed]
  7. Hilman, A.; Harmayani, E.; Cahyanto, M.N. The potential of Gembili (Dioscorea esculenta L.) and Dahlia (Dahlia spp L.) from Indonesia as prebiotic compound. In IOP Conference Series: Earth and Environmental Science; IOP Publishing: Bristol, UK, 2021; Volume 782, p. 032109. [Google Scholar]
  8. Pal, S.; Kumar, A.; Chaturvedi, P.; Srivastava, R.; Tripathi, S. Determination of lethal dose for gamma rays induced mutagenesis in different cultivars of Dahlia. J. Hill Agric. 2017, 8, 279–282. [Google Scholar] [CrossRef]
  9. Ohno, S.; Hori, W.; Hosokawa, M.; Tatsuzawa, F.; Doi, M. Petal color is associated with leaf flavonoid accumulation in a labile bicolor flowering Dahlia (Dahlia variabilis)‘Yuino’. Hort. J. 2016, 85, 177–186. [Google Scholar] [CrossRef]
  10. Saar, D.E.; Polans, N.O.; Sørensen, P.D. A phylogenetic analysis of the genus Dahlia (Asteraceae) based on internal and external transcribed spacer regions of nuclear ribosomal DNA. Syst. Bot. 2003, 28, 627–639. [Google Scholar]
  11. Panero, J.L.; Funk, V.A. The value of sampling anomalous taxa in phylogenetic studies: Major clades of the Asteraceae revealed. Mol. Phylogenet. Evol. 2008, 47, 757–782. [Google Scholar] [CrossRef]
  12. Liu, M.; Zhang, C.F.; Huang, J.X.; Ma, H. Reconstructing phylogenetic relationships among Asterinae subfamilies of Compositae using low-copy nuclear genes. Acta Bot. 2015, 50, 549. [Google Scholar]
  13. Zhang, C.F.; Huang, C.H.; Liu, M.; Hu, Y.; Panero, J.L.; Luebert, F.; Gao, T.G.; Ma, H. Phylotranscriptomic insights into Asteraceae diversity, polyploidy, and morphological innovation. J. Integr. Plant Biol. 2021, 63, 1273–1293. [Google Scholar] [CrossRef] [PubMed]
  14. Sugiura, M. The Chloroplast Genome; Springer: Dodrecht, The Netherlands, 1992; Volume 19, pp. 149–168. [Google Scholar]
  15. Lin, C.P.; Wu, C.S.; Huang, Y.Y.; Chaw, S.M. The complete chloroplast genome of Ginkgo biloba reveals the mechanism of inverted repeat contraction. Genome Biol. Evol. 2012, 4, 374–381. [Google Scholar] [CrossRef] [PubMed]
  16. Kang, H.I.; Lee, H.O.; Lee, I.H.; Kim, I.S.; Lee, S.W.; Yang, T.J.; Shim, D. Complete chloroplast genome of Pinus densiflora Siebold & Zucc. and comparative analysis with five pine trees. Forests 2019, 10, 600. [Google Scholar]
  17. Jansen, R.K.; Cai, Z.; Raubeson, L.A.; Daniell, H.; Depamphilis, C.W.; Leebens-Mack, J.; Boore, J.L. Analysis of 81 genes from 64 plastid genomes resolves relationships in angiosperms and identifies genome-scale evolutionary patterns. Proc. Natl. Acad. Sci. USA 2007, 104, 19369–19374. [Google Scholar] [CrossRef] [PubMed]
  18. Moore, M.J.; Soltis, P.S.; Bell, C.D.; Burleigh, J.G.; Soltis, D.E. Phylogenetic analysis of 83 plastid genes further resolves the early diversification of eudicots. Proc. Natl. Acad. Sci. USA 2010, 107, 4623–4628. [Google Scholar] [CrossRef] [PubMed]
  19. Zhang, H.J.; Zhang, X.; Landis, J.B.; Sun, Y.X.; Sun, J.; Kuang, T.H.; Li, L.J.; Bashir, B.T.; Deng, T.; Sun, H.; et al. Phylogenomic and comparative analyses of Rheum (Polygonaceae, Polygonoideae). J. Integr. Plant Biol. 2022, 60, 1229–1240. [Google Scholar] [CrossRef]
  20. Guo, Y.Y.; Luo, Y.B.; Liu, Z.J.; Wang, X.Q. Reticulate evolution and sea-level fluctuations together drove species diversification of slipper orchids (P aphiopedilum) in South-East Asia. Mol. Ecol. 2015, 24, 2838–2855. [Google Scholar] [CrossRef]
  21. Brown, J.; Pirrung, M.; McCue, L.A. FQC Dashboard: Integrates FastQC results into a web-based, interactive, and extensible FASTQ quality control tool. Bioinformatics 2017, 33, 3137–3139. [Google Scholar] [CrossRef]
  22. Jin, J.J.; Yu, W.B.; Yang, J.B.; Song, Y.; DePamphilis, C.W.; Yi, T.S.; Li, D.Z. GetOrganelle: A fast and versatile toolkit for accurate de novo assembly of organelle genomes. Genome Biol. 2020, 21, 241. [Google Scholar] [CrossRef]
  23. Li, H. Aligning sequence reads, clone sequences and assembly contigs with BWA-MEM. arXiv 2013, arXiv:1303.3997. [Google Scholar]
  24. Li, H.; Handsaker, B.; Wysoker, A.; Fennell, T.; Ruan, J.; Homer, N.; Marth, G.; Abecasis, G.; Durbin, R.; 1000 Genome Project Data Processing Subgroup. The sequence alignment/map format and SAMtools. Bioinformatics 2009, 25, 2078–2079. [Google Scholar] [CrossRef] [PubMed]
  25. Shi, L.; Chen, H.; Jiang, M.; Wang, L.; Wu, X.; Huang, L.; Liu, C. CPGAVAS2, an integrated plastome sequence annotator and analyzer. Nucleic Acids Res. 2019, 47, W65–W73. [Google Scholar] [CrossRef] [PubMed]
  26. Liu, S.; Ni, Y.; Li, J.; Zhang, X.; Yang, H.; Chen, H.; Liu, C. CPGView: A package for visualizing detailed chloroplast genome structures. Mol. Ecol. Resour. 2023, 23, 694–704. [Google Scholar] [CrossRef] [PubMed]
  27. Wong, E.H.; Smith, D.K.; Rabadan, R.; Peiris, M.; Poon, L.L. Codon usage bias and the evolution of influenza A viruses. Codon Usage Biases of Influenza Virus. BMC Evol. Biol. 2010, 10, 253. [Google Scholar] [CrossRef] [PubMed]
  28. Yang, G.F.; Su, K.L.; Zhao, Y.R.; Song, Z.; Sun, J. Analysis of codon usage in the chloroplast genome of Medicago truncatula. Cao Ye Xue Bao 2015, 24, 171–179. [Google Scholar]
  29. Wei, L.; He, J.; Jia, X.; Qi, Q.; Liang, Z.S.; Zheng, H.; Ping, Y.; Liu, S.Y.; Sun, J.C. Analysis of codon usage bias of mitochondrial genome in Bombyx mori and its relation to evolution. BMC Evol. Biol. 2014, 14, 262. [Google Scholar] [CrossRef] [PubMed]
  30. Wright, F. The ‘effective number of codons’ used in a gene. Gene 1990, 87, 23–29. [Google Scholar] [CrossRef]
  31. Kurtz, S.; Choudhuri, J.V.; Ohlebusch, E.; Schleiermacher, C.; Stoye, J.; Giegerich, R. REPuter: The manifold applications of repeat analysis on a genomic scale. Nucleic Acids Res. 2001, 29, 4633–4642. [Google Scholar] [CrossRef]
  32. Beier, S.; Thiel, T.; Münch, T.; Scholz, U.; Mascher, M. MISA-web: A web server for microsatellite prediction. Bioinformatics 2017, 33, 2583–2585. [Google Scholar] [CrossRef]
  33. Katoh, K.; Rozewicki, J.; Yamada, K.D. MAFFT online service: Multiple sequence alignment, interactive sequence choice and visualization. Brief. Bioinform. 2019, 20, 1160–1166. [Google Scholar] [CrossRef] [PubMed]
  34. Librado, P.; Rozas, J. DnaSP v5: A software for comprehensive analysis of DNA polymorphism data. Bioinformatics 2009, 25, 1451–1452. [Google Scholar] [CrossRef] [PubMed]
  35. Li, H.; Guo, Q.; Xu, L.; Gao, H.; Liu, L.; Zhou, X. CPJSdraw: Analysis and visualization of junction sites of chloroplast genomes. PeerJ 2023, 11, e15326. [Google Scholar] [CrossRef] [PubMed]
  36. Wang, D.; Zhang, Y.; Zhang, Z.; Zhu, J.; Yu, J. KaKs_Calculator 2.0: A toolkit incorporating gamma-series methods and sliding window strategies. Genom. Proteom. Bioinform. 2010, 8, 77–80. [Google Scholar] [CrossRef] [PubMed]
  37. Guindon, S.; Dufayard, J.F.; Lefort, V.; Anisimova, M.; Hordijk, W.; Gascuel, O. New algorithms and methods to estimate maximum-likelihood phylogenies: Assessing the performance of PhyML 3.0. Syst. Biol. 2010, 59, 307–321. [Google Scholar] [CrossRef] [PubMed]
  38. Huson, D.H.; Bryant, D. Estimating Phylogenetic Trees and Networks Using SplitsTree 4. Manuscript in Preparation, Software. 2005. Available online: https://www.splitstree.org (accessed on 20 September 2023).
  39. Pickrell, J.; Pritchard, J. Inference of population splits and mixtures from genome-wide allele frequency data. Nature Preced. 2012, 8, e1002967. [Google Scholar]
  40. Qian, W.; Yang, J.R.; Pearson, N.M.; Maclean, C.; Zhang, J. Balanced codon usage optimizes eukaryotic translational efficiency. PLoS Genet. 2012, 8, e1002603. [Google Scholar] [CrossRef]
  41. Parvathy, S.T.; Udayasuriyan, V.; Bhadana, V. Codon usage bias. Mol. Biol. Rep. 2022, 49, 539–565. [Google Scholar] [CrossRef]
  42. Kress, W.J.; García-Robledo, C.; Uriarte, M.; Erickson, D.L. DNA barcodes for ecology, evolution, and conservation. Trends Ecol. Evol. 2015, 30, 25–35. [Google Scholar] [CrossRef]
  43. Daniell, H.; Lin, C.S.; Yu, M.; Chang, W.J. Chloroplast genomes: Diversity, evolution, and applications in genetic engineering. Genome Biol. 2016, 17, 134. [Google Scholar] [CrossRef]
  44. Shahzadi, I.; Mehmood, F.; Ali, Z.; Ahmed, I.; Mirza, B. Chloroplast genome sequences of Artemisia maritima and Artemisia absinthium: Comparative analyses, mutational hotspots in genus Artemisia and phylogeny in family Asteraceae. Genomics 2020, 112, 1454–1463. [Google Scholar] [CrossRef] [PubMed]
  45. Cheng, Y.; Zhang, L.; Qi, J.; Zhang, L. Complete chloroplast genome sequence of Hibiscus cannabinus and comparative analysis of the Malvaceae Family. Front. Genet. 2020, 11, 227. [Google Scholar] [CrossRef] [PubMed]
  46. Shahzadi, I.; Mehmood, F.; Ali, Z.; Malik, M.S.; Waseem, S.; Mirza, B.; Ahmed, I.; Waheed, M.T. Comparative analyses of chloroplast genomes among three Firmiana species: Identification of mutational hotspots and phylogenetic relationship with other species of Malvaceae. Plant Gene 2019, 19, 100199. [Google Scholar]
  47. Qin, Z.; Wang, Y.; Wang, Q.; Li, A.; Hou, F.; Zhang, L. Evolution analysis of simple sequence repeats in plant genome. PLoS ONE 2015, 10, e0144108. [Google Scholar] [CrossRef] [PubMed]
  48. Chumley, T.W.; Palmer, J.D.; Mower, J.P.; Fourcade, H.M.; Calie, P.J.; Boore, J.L.; Jansen, R.K. The complete chloroplast genome sequence of Pelargonium × hortorum: Organization and evolution of the largest and most highly rearranged chloroplast genome of land plants. Mol. Biol. Evol. 2006, 23, 2175–2190. [Google Scholar] [CrossRef] [PubMed]
  49. Powell, W.; Morgante, M.; McDevitt, R.; Vendramin, G.G.; Rafalski, J.A. Polymorphic simple sequence repeat regions in chloroplast genomes: Applications to the population genetics of pines. Proc. Natl. Acad. Sci. USA 1995, 92, 7759–7763. [Google Scholar] [CrossRef]
  50. Gichira, A.W.; Avoga, S.; Li, Z.; Hu, G.; Wang, Q.; Chen, J. Comparative genomics of 11 complete chloroplast genomes of Senecioneae (Asteraceae) species: DNA barcodes and phylogenetics. Bot. Stud. 2019, 60, 17. [Google Scholar] [CrossRef]
  51. Wang, C.; Liu, J.; Su, Y.; Li, M.; Xie, X.; Su, J. Complete chloroplast genome sequence of sonchus brachyotus helps to elucidate evolutionary relationships with related species of asteraceae. BioMed Res. Int. 2021, 2021, 9410496. [Google Scholar] [CrossRef]
  52. Huang, C.; Liu, D.; Li, Z.A.; Molloy, D.P.; Luo, Z.F.; Su, Y.; Li, H.O.; Liu, Q.; Wang, R.Z.; Xiao, L.T. The PPR protein RARE1-mediated editing of chloroplast accD transcripts is required for fatty acid biosynthesis and heat tolerance in Arabidopsis. Plant Commun. 2023, 4, 100461. [Google Scholar] [CrossRef]
  53. Rogalski, M.; Schottler, M.A.; Thiele, W.; Schulze, W.X.; Bock, R. Rpl33, a nonessential plastid-encoded ribosomal protein in Tobacco, is required under cold stress conditions. Plant Cell 2008, 20, 2221–2237. [Google Scholar] [CrossRef]
  54. Rogalski, M.; Schottler, M.A.; Thiele, W.; Schulze, W.X.; Bock, R. Plastid phylogenomic analysis of green plants: A billion years of evolutionary history. Am. J. Bot. 2018, 105, 291–301. [Google Scholar]
Figure 1. Chloroplast genomic map of D. imperialis. (a) The circle map of the complete plastome of D. imperialis. Genes drawn inside the circle are transcribed clockwise, whereas those outside are transcribed counterclockwise. Genes belonging to different functional groups are color coded. The dashed area in the inner circle indicates the GC content. (b) The black–white arrow shows the cis-spliced genes, and (c) the black–grey–white arrow shows the trans-spliced genes (rps12).
Horticulturae 10 00007 g001
Figure 2. Correlation among the D. imperialis chloroplast genome codon usage parameters. GC_all: the average content of G or C in the three bases of the codon. GC1: the G or C content in the first base of the codon. GC2: the G or C content in the second base of the codon. GC3: the G or C content in the third base of the codon. GC3s: the frequency of G or C in the third base of the codon. ENC: effective number of codons. Codon.No.: number of codons. The larger the circle, the higher the correlation.
Horticulturae 10 00007 g002
Figure 3. Codon usage preference in D. imperialis chloroplast genome. ENC: effective number of codons. GC12: the average value of GC1 and GC2 for each gene. GC3: the G or C content in the third base of the codon. A3/(A3 + T3): the probability of A when the third base of the codon is A or T. G3/(G3 + C3): the probability of G when the third base of codon is G or C.
Horticulturae 10 00007 g003
Figure 4. The RSCU of amino acids in the D. imperialis chloroplast genome. The color of the histogram is the same as the codon color.
Horticulturae 10 00007 g004
Figure 5. SSR types in the chloroplast genome of D. imperialis. The horizontal axis represents SSR repeat types, and the vertical axis shows the number of repeats. (a) the identification of four types of repeats; (b) the type and frequency of each identified SSR; and (c) the detail information of all SSR types.
Horticulturae 10 00007 g005
Figure 6. Comparative analysis of nucleotide diversity at three levels. The horizontal coordinate indicates the nucleotide position and the vertical coordinate indicates the Pi value (window length: 600 bp; step size: 200 bp). (a): the internal species level of Dahlia; (b): the internal genus level of Coreopsideae; and (c): the internal subtribal level of the Heliantheae alliance.
Horticulturae 10 00007 g006
Figure 7. Comparison of LSC, SSC, and IR regional boundaries of chloroplast genomes between 10 species. JLB: junction line between LSC and IRb; JSB: junction line between IRb and SSC; JSA: junction line between SSC and IRa; JLA: junction line between IRa and LSC. The start and end of each gene from the junctions is shown with arrows.
Horticulturae 10 00007 g007
Figure 8. The Ka/Ks ratios of 79 protein-coding genes from the chloroplast genomes of D. imperialis and nine related species. The same color represents the same species. Blue rectangle: L. burkei; orange–red rectangle: G. quadriradiata; light grey rectangle: T. erecta; orange rectangle: C. bipinnnatus; light blue rectangle: H. grosseserratus; green rectangle: B. campylotheca; dark blue rectangle: E. fortunei; brown rectangle: Dahlia pinnata; dark gray rectangle: Dahlia imperialis.
Horticulturae 10 00007 g008
Figure 9. Phylogenetic tree based on 49 chloroplast genomes. A phylogenetic tree based on complete chloroplast genomes was generated using maximum likelihood (ML) analysis with 1000 bootstrap replicates. The numbers at each node indicate the bootstrap support values. Five D.pinnata chloroplast genomes were distinguished by 1–5.
Horticulturae 10 00007 g009
Figure 10. Networked evolutionary relationships among 49 chloroplast genomes. The same color module represents the same subtribe. Five D.pinnata chloroplast genomes were distinguished by 1–5.
Horticulturae 10 00007 g010
Figure 11. Maximum likelihood tree of 49 chloroplast genomes. Populations with inferred migration edges. The arrow represents the infiltration event.
Horticulturae 10 00007 g011
Table 1. Characteristics of D. imperialis chloroplast genome.
CategoryItemDescribe
Cp genome structureCp genome/bp152,084
LSC/bp83,679
SSC/bp18,343
IRa/IRb/bp25,031
Gene compositionCp gene134
tRNA38
rRNA8
Protein coding86
Pseudo2
GC content (%)Cp gene38.45
LSC35.63%
SSC31.15%
IRa/IRb43.01%
Disclaimer/Publisher’s Note: The statements, opinions and data contained in all publications are solely those of the individual author(s) and contributor(s) and not of MDPI and/or the editor(s). MDPI and/or the editor(s) disclaim responsibility for any injury to people or property resulting from any ideas, methods, instructions or products referred to in the content.

