Article

Impact of Spontaneous Fermentation and Inoculum with Natural Whey Starter on Peptidomic Profile and Biological Activities of Cheese Whey: A Comparative Study

1
Department of Food and Dairy Sciences and Technology, Damanhour University, Damanhour 22516, Egypt
2
Department of Life Sciences, University of Modena and Reggio Emilia, Via Amendola, 2-Pad. Besta, 42100 Reggio Emilia, Italy
3
NBFC, National Biodiversity Future Center, 90133 Palermo, Italy
*
Author to whom correspondence should be addressed.
Fermentation 2023, 9(3), 270; https://doi.org/10.3390/fermentation9030270
Submission received: 9 February 2023 / Revised: 4 March 2023 / Accepted: 8 March 2023 / Published: 10 March 2023
(This article belongs to the Special Issue Fermentation and Bioactive Metabolites 4.0)

Abstract

:
Fermentation is a promising solution to valorize cheese whey, the main by-product of the dairy industry. In Parmigiano Reggiano cheese production, natural whey starter (NWS), an undefined community of thermophilic lactic acid bacteria, is obtained from the previous day residual whey through incubation at gradually decreasing temperature after curd cooking. The aim of this study was to investigate the effect of fermentation regime (spontaneous (S) and NWS-inoculated (I-NWS)) on biofunctionalities and release of bioactive peptides during whey fermentation. In S and I-NWS trials proteolysis reached a peak after 24 h, which corresponded to the drop out in pH and the maximum increase in lactic acid. Biological activities increased as a function of fermentation time. NWS inoculum positively affected antioxidant activity, whilst S overcame I-NWS in angiotensin-converting enzyme (ACE) and DPP-IV (dipeptidyl peptidase IV) inhibitory activities. Peptidomics revealed more than 400 peptides, mainly derived from β-casein, κ-casein, and α-lactalbumin. Among them, 49 were bioactive and 21 were ACE-inhibitors. Semi-quantitative analysis strongly correlated ACE-inhibitory activity with the sum of the peptide abundance of ACE-inhibitory peptides. In both samples, lactotripeptide isoleucine-proline-proline (IPP) was higher than valine-proline-proline (VPP), with the highest content in S after 24 h of fermentation. In conclusion, we demonstrated the ability of whey endogenous microbiota and NWS to extensively hydrolyze whey proteins, promoting the release of bioactive peptides and improving protein digestibility.

Graphical Abstract

1. Introduction

While a small fraction of microbes is pathogenic, the majority are beneficial or neutral and essential for life and biogeochemical cycles. A significant amount of evidence has demonstrated how microbes could significantly contribute to sustainable development, providing solutions to counteract hunger, climate change, and pollution [1]. Among microbes, lactic acid bacteria (LAB) are a group of Gram-positive and ‘generally recognized as safe’ (GRAS) bacteria, which play a key role in food production, as well as in human health and nutrition [2]. Humankind is using lactic fermentation from centuries to enhance food shelf-life [3], and, recently, many attempts harnessed the metabolic potential of LAB to produce healthy molecules for humans [4], as well as to convert organic waste into valuable bioproducts [5,6,7,8]. In addition to the ability to convert sugars into lactic acid, LAB cells are suited with an efficient proteolytic system which breaks down food proteins into smaller oligopeptides and free amino acids, assuring high digestibility of protein fraction and enhancing texture and sensorial attributes of fermented food. Furthermore, food protein hydrolysis can generate bioactive peptides, a group of peptides embedded within the sequences of native proteins and consisting in fewer than 20 amino acid residues, which exert a plethora of positive functions on human cells [9,10,11].
Cheese whey is the yellow liquid resulting after the removal of coagulated curd from milk. Dairy industries produce an average of 2.5 L of wastewater per L of processed milk, as well as about 9–10 L of cheese whey per kg of cheese produced, resulting in approximately 400 billion L of wastewater per year [12]. As the main waste stream of cheesemaking production, whey is a severe hazard for the environment because of the value of Biochemical Oxygen Demand (BOD) that can exceed 35,000 ppm and a Chemical Oxygen Demand (COD) of more than 60,000 ppm [13]. A typical sweet whey resulted from rennet-coagulated milk contains 6–10 g/L proteins, 46–52 g/L lactose, and 2.5–4.7 g/L minerals [14].
Several physical, chemical, and biological treatments have been applied to valorize organic fraction of cheese whey into biofuels (methane, hydrogen, and ethanol), electric energy, and/or chemical commodities (carboxylic acids, proteins, and biopolymers). Among them, lactic fermentation represents a valuable and cheap method to convert sugars into lactic acid and proteins in peptides, including bioactive peptides [15]. Even if LAB proteases are more suitable to degrade milk caseins, some LAB strains were able to hydrolyze whey proteins and have been proposed as candidates to produce whey-based fermented beverages enriched in bioactive peptides [16]. For example, Lactobacillus delbrueckii CRL656 [17], Pediococcus acidilactici SDL1414 [18], and Streptococcus thermophilus CRL804, as well as some strains of Lactobacillus acidophilus [17,19] and Lactobacillus helveticus [19,20], were able to release bioactive peptides from whey proteins concentrates or isolates. Natural microbiota inhabiting cheese whey was also proven to release anti-hypertensive peptides during whey fermentation [21,22]. In addition to whey-based fermented beverages with healthy properties, whey protein hydrolysates can be used as supplements in food processing due to their technological properties, including oil and water holding, emulsifying capacity, foam capacity, and solubility [23]. Alternatively, whey protein hydrolysates can fortify other food and beverages in bioactive peptides [24]. Therefore, there is an increasing interest in searching LAB single cultures or mixed communities suitable to grow and hydrolyze whey proteins.
Parmigiano Reggiano cheese is an Italian, cooked, and long-ripened Protected Designated Origin (PDO) cheese produced according to specifications rules of the Parmigiano Reggiano cheese consortium. The process entails the use of calf rennet and a natural whey starter (NWS) to coagulate partially skimmed raw cow milk. NWS is a mixed community of homofermentative and thermophilic LAB species obtained daily by incubating the cooked whey from the previous cheesemaking phase in a bioreactor under controlled decreasing temperature which starts at 52–54 °C and ends at 27–30 °C 20 h later [25]. Consequently, NWS is enriched in LAB species well-adapted to grow in whey at relatively high temperatures and low pH, such as S. thermophilus, L. delbrueckii subsp. lactis, and L. helveticus [26,27,28,29,30]. Accordingly, we previously demonstrated that three S. thermophilus strains isolated from Parmigiano Reggiano NWS release bioactive peptides from whey protein concentrate, suggesting that NWS is a bioresource of whey protein-hydrolyzing LAB [31]. Furthermore, whey from Parmigiano Reggiano cheese could be a safe substrate for fermented beverage formulations. The high temperature of curd cooking (55 °C) enriches the remaining non-acidified cooked whey (here abbreviated as cheese whey) in thermophilic LAB [32] and reduces the load of dangerous psychotropic bacteria, such as Pseudomonas spp. [33].
Based on these considerations, our experimental hypothesis was that Parmigiano Reggiano cheese whey, fermented either by its native microbiota or by NWS mixed community, could be a valuable solution to produce whey hydrolysates enriched in bioactive peptides. To test this hypothesis, we compared two Parmigiano Reggiano cheese whey batches, one obtained by spontaneous fermentation and the other by NWS-inoculum for microbiological counts, protein hydrolysis, antioxidant, anti-hypertensive, and anti-diabetic activities of peptide fractions, as well as for peptidomics profiles.

2. Materials and Methods

2.1. Chemicals and Materials

All chemicals and media were purchased from Sigma Aldrich (St. Louis, MO, USA) and Oxoid (Basingstoke, Hampshire, UK), respectively, except where differently indicated. Oligonucleotides and synthetic peptides valine-proline-proline (VPP) and isoleucine-proline-proline (IPP), with 99% of purity, were purchased from Bio-Fab Research (Rome, Italy). Type strains were from DSMZ (Deutsche Sammlung von Mikroorganismen und Zellkulturen, Braunschweig, Deutschland). Amicon Ultra-0.5 regenerated cellulose filters (cut-off of 10 kDa) used for ultrafiltration were obtained from Millipore (Milan, Italy). Cheese whey (W) and natural whey starter (NWS) were obtained from a dairy farm according to the Specifications of Parmigiano Reggiano Cheese (https://www.parmigianoreggiano.com/consortium/rules_regulation_2/default.aspx, accessed on 13 January 2023). Fresh W and NWS were aseptically sampled after the production and immediately brought in laboratory under refrigerated conditions for the subsequent processing.

2.2. Fermentation Trials and Chemico-Physical Analysis

Two sets of fresh cheese whey samples (40 mL each) were placed in sterile scraw cap bottles (100 mL); one was incubated at 42 °C under static conditions to perform spontaneous fermentation (trial S), while the other one was inoculated with NWS (2% v/v inoculum) as seed culture and incubated under the same conditions (trial I-NWS). Fermentation batches were monitored at 0, 6, 24, 48, 72, and 96 h. After fermentation time, samples were cooled and kept frozen (−20 °C) until further analyses. The fermentation experiments were carried out in triplicate. The pH was monitored with a XS pH meter (XS Instruments, Carpi, Italy). Lactic acid and lactose were enzymatically determined according to the manufacturer’s instructions (Megazyme International; Wicklow, Ireland).

2.3. Microbiological Analysis

Samples were serially ten-fold diluted and poured into agar plates containing specific media and incubated under specific conditions as follows: de Man, Rogosa, and Sharpe Agar medium (MRS) at pH 6.5, incubated at 42 °C for 72 h under anaerobic conditions for the enumeration of thermophilic lactobacilli; M17 medium supplemented with 7% v/v of sterile skimmed milk (SSW) (Morga AG, Ebnat-Kappel, Switzerland) (M17-SSW), incubated at 42 °C for 72 h under aerobiosis for the numeration of streptococci [30]; YPDA (1% w/v yeast extract, 2% w/v peptone, 2% w/v dextrose, and 2% w/v agar) and YPLA (1% w/v yeast extract, 2% w/v peptone, 2% w/v lactose, and 2% w/v agar) media, incubated at 27 °C and 42 °C for 48 h for the enumeration of mesophilic and thermophilic yeasts, respectively. Media for bacterial enumeration was supplemented with cycloheximide (50 mg/L final concentration), whilst media for yeast enumeration contained 0.01% chloramphenicol. All microbiological analyses were performed in triplicate and the counts were expressed as Log10 CFU/mL.
For the starter culture characterization, bacterial and yeast isolates were isolated from plates with 20–200 colonies through at least two rounds of streaking on the same isolation medium. Bacterial isolates were checked for cellular morphology, Gram staining, and catalase reaction and, finally, identified through 16S-ARDRA assay, as previously reported [30]. Yeast cell morphology was verified before identifying yeast isolates through PCR-RFLP analysis of ITS regions as reported by Martini et al. [34]. For ITS PCR-RFLP profiles, species attribution was carried out through the interrogation of the Yeast-ID database (www.yeast-id.org, accessed on 22 June 2022) with rank parameter at ±20 bp. For 16S-ARDRA restriction profiles, data were compared with those obtained from type strains L. delbrueckii subsp. lactis DSM20072T, S. thermophilus DSM20617T, and L. helveticus DSM 20075T.

2.4. Assessment of Protein Hydrolysos during the Fermnetation Trials

Samples withdrawn during the fermentation trials were analyzed to verify the extent of protein hydrolysis by quantifying the free amino-groups through the TNBS assay as described in Adler-Nissen [35]. Non hydrolyzed proteins were removed, before the analysis, by adding 10 μL of trichloroacetic acid (TCA) 50% to 100 μL of sample. After 10 min of incubation at room temperature samples were centrifuged (12,000× g; 10 min; 4 °C) and the supernatant analyzed for the TNBS assay.

2.5. Low-Molecular Weight Peptide Fractions Extraction and Biological Activity Assays

Low-molecular weight peptide (LMWP) fractions were obtained as previously reported [36], from samples withdrawn after 0, 6, 24, and 48 h of fermentation, by ultrafiltration at 10 kDa cut-off.
Antioxidant activity was ascertained by the ABTS (2,2-azino-bis(3-ethylbenzothiazoline-6-sulphonic acid)) assay on the LMWP as described in Re et al. [37]. Results were expressed as mg of ascorbic acid/L of fermented cheese whey.
The angiotensin-converting enzyme (ACE)-inhibitory activity of LMWP fractions was determined as described in Solieri et al. [31] by using as substrate the tripeptide N-[3-(2-furyl)acryloyl]-L-phenylalanylglycyl-glycine (FAPGG).
The dipeptidyl-peptidase-IV (DPP-IV)-inhibitory activity of LMWP fractions was assayed through the method reported in Tagliazucchi et al. [38] with the substrate glycine-proline-p-nitroanilide (Gly-Pro-pNA).
The α-glucosidase-inhibitory activity of LMWP fractions was evaluated by applying the protocol reported in Martini et al. [39] by using p-nitrophenyl-glucose as substrate.
Enzymatic assays data were stated as IC50 values expressed as μL of fermented cheese whey/mL. IC50 is defined as the amount of fermented cheese whey able to inhibit the enzymatic activity by 50%. Non-linear regression analysis was applied to calculate the IC50 values by plotting the base-10 logarithm of the added volumes of fermented cheese whey versus the percentage of inhibition.

2.6. Analysis of the Peptide Profiles by High-Resolution Mass Spectrometry

LMWP fractions were characterized for their peptide profiles by high-resolution mass spectrometry analysis. The instrument used was a Q Exactive Hybrid Quadrupole-Orbitrap Mass Spectrometer (Thermo Scientific, San Jose, CA, USA) coupled with a UHPLC (UHPLC Ultimate 3000 separation module, Thermo Scientific, San Jose, CA, USA). Separation of the peptides was carried out by using a C18 column (Acquity UPLC HSS C18 reversed phase, 2.1 × 100 mm, 1.8 μm particle size, Waters, Milan, Italy). The applied method was already fully described, for both chromatographic conditions and mass spectrometry parameters, in Martini et al. [39].

2.7. Peptidomics Analysis

2.7.1. Peptides Sequencing

The identification and sequencing of the peptides were carried out by using the software Mascot [40] and applying the following parameters: enzyme, none; peptide mass tolerance, ±5 ppm; fragment mass tolerance, ±0.1 Da; variable modification, oxidation (M), phosphorylation (ST), deamidation (NQ); and maximal number of post-translational modifications permitted in a single peptide, 5. Peptides identification was considered significant only when the expectation value was lower than 0.05.

2.7.2. Label-Free MS Peak Quantification

Peptidomics analysis was carried out by applying the protocol reported in Dallas and Nielsen [41] using the Skyline software [42]. In the first step, a specific peptide library was created in Skyline by using the lists of peptides identified by Mascot software saved as a .dat file. Then, the full-scan mass spectral raw data acquired by high-resolution mass spectrometry analysis from the different samples were processed for the MS peak relative quantification of each identified peptide [41]. The obtained data were then filtered and peaks that did not meet the criteria or were too close to the noise level to be visually discernible were excluded from the dataset. The criteria used were a mass tolerance ≤5 ppm and an isotope scalar product score (idotp) ≥80. The peak area values of identical peptides but with different modifications (such as different protonation pattern, methionine oxidation, and glutamine/asparagine deamidation) were summed. Only peptides belonging to the major milk proteins (β-casein, αS1-casein, αS2-casein, κ-casein, β-lactoglobulin, and α-lactalbumin) were considered.

2.7.3. Bioactive Peptides Identification and Relative Quantification

Peptides with 100% homology with previously reported bioactive peptides were identified through the Milk Bioactive Peptide Database (MBPDB, http://mbpdb.nws.oregonstate.edu/, accessed on 23 January 2023) [43]. Relative quantification of identified bioactive peptides was carried out by using the Skyline dataset as described above.

2.8. Absolute Quantification of the Bioactive Peptides IPP and VPP

Absolute quantification of selected bioactive peptides (VPP and IPP) was carried out by applying the parallel reaction monitoring procedure reported in Martini, Conte, and Tagliazucchi [44]. The calibration curves were built by using synthetic peptides (purity ≥ 99%).

2.9. Statistical Analysis

Data were shown as mean ± standard deviation (SD) for triplicate experiments. Two-way ANOVA followed by Tukey post hoc test was used for statistical analysis through GraphPad Prism 9.0 (GraphPad Software, San Diego, CA, USA). Differences were considered significant when p < 0.05.

3. Results and Discussion

3.1. NWS Microbial Caracterization

In this study we used cheese whey resulted from the Parmigiano Reggiano cheesemaking production, which entails the rennet-based milk coagulation. The pH was 5.74 ± 0.01, that is typical of a sweet whey [14]. In addition to rennet, Parmigiano Reggiano specification rules include the usage of NWS. According to the native microbiota mainly composed by homofermentative LAB [30], NWS sample showed a pH of 3.45 ± 0.03. Lactobacilli and streptococci counts were 8.91 ± 0.01 and 7.97 ± 0.08 Log10 CFU/mL, whilst thermophilic and mesophilic yeasts were 1.78 ± 0.07 and 1.54 ± 0.34 Log10 CFU/mL, respectively. In total, 16 bacterial isolates were isolated from this sample and identified as belonging to the species S. thermophilus (56%, mainly isolated from M17-SSW), L. helveticus (31%), and L. delbrueckii subsp. lactis (13%) (Supplementary Table S1). Eight yeasts isolates were identified as belonging to K. marxianus (six isolates) and Saccharomyces cerevisiae (two isolates) (Supplementary Table S2). The data confirmed that the NWS used here exhibits bacterial and yeast species composition profiles like other previously characterized NWS samples [30,34]. Furthermore, both these LAB [31] and yeasts [34] species were previously proved to be proteolytic toward whey protein concentrates, suggesting that NWS could be able to hydrolyze whey proteins in sweet whey too.

3.2. Whey Fermentation

Cheese whey (trial S) and cheese whey inoculated with NWS (trial I-NWS) were incubated at 42 °C. The temperature was chosen considering the microbial composition of NWS, mainly composed by thermophilic LAB and yeasts species. Trends of pH over time are shown in Figure 1A. Immediately after NWS addition (T0), I-NWS sample was significant lower in pH value than S batch (p < 0.05), as expected by the acidic pH of NWS inoculum. Subsequently, we observed a significant decrease in pH, that reached values ≤ 4 after 6 h of fermentation in both S and I-NWS batches (p < 0.05). A slight further decrease in pH was observed from 6 to 24 h of fermentation, after that pH values were almost constant until 72 h, without any significant difference between S and I-NWS (Figure 1A).
Fermentation process was also monitored as lactic acid production over time (Figure 1B). According to the acidification trend, lactic acid concentration increased significantly after 6 h of fermentation both in S and in I-NWS. S sample reached the highest value (14.50 ± 3.01 mg/mL) after 24 h, while I-NWS after 48 h (14.93 ± 2.88 mg/mL). No significant differences were observed between S and I-NWS in lactic acid concentration. As expected, lactose concentration showed an opposite trend compared with lactic acid (Supplementary Figure S1). Overall, these data suggested that lactic acid fermentation successfully took place in both S and I-NWS whey batches.

3.3. Enumeration of Lactic Acid Bacteria and Yeasts Populations

S and I-NWS samples differed in thermophilic lactobacilli and yeast counts as shown in Figure 2. Regarding LAB, I-NWS overcame S sample in thermophilic lactobacilli counts at T0 (p < 0.05), as expected by NWS species composition enriched in thermophilic LAB (Figure 2A). In S, an increase of 2 Log was observed in lactobacilli counts from 0 to 24 h, reaching values like I-NWS (p > 0.05). This increase agreed with that observed for the amount of lactic acid (Figure 1B) and corresponds to the drop of lactose concentration at the same time (Supplementary Figure S1). Then, lactobacilli decreased to 4.14 ± 0.48 Log10 CFU/mL after 72 h. In I-NWS, lactobacilli counts slightly decreased over time and reached 6.16 ± 0.34 Log10 CFU/mL after 72 h. Comparison of Log10 counts scored in I-NWS from MRS and M17-SSW media suggested that streptococci became comparable to thermophilic lactobacilli only at 72 h (Figure 2B).
Yeast counts increased at different extents in S and I-NWS fermentation trials (Figure 2, panels C and D). I-NWS exhibited higher mesophilic and thermophilic yeast counts in almost all sampling times (p < 0.05), confirming that NWS is a source of thermophilic and lactose fermenting yeasts [34].

3.4. Assessment of Proteolytic Activity during Whey Fermentation

Hydrolysis of whey proteins during S and I-NWS whey fermentation trials was evaluated as amount of released free amino groups. In both samples, the maximum proteolytic activity was recorded in the first 24 h of fermentation (Figure 3), corresponding to the maximum decrease in pH and increase in lactic acid concentration (Figure 1).
After 6 h of fermentation the amount of free amino groups significantly increased (p < 0.05) from 0.77 ± 0.07 and 0.67 ± 0.04 to 1.69 ± 0.11 and 1.87 ± 0.24 in trials S and I-NWS, respectively. No significant differences (p > 0.05) were found between the sample S and I-NWS both at 0 and 6 h of fermentation. Protein hydrolysis further increased after 24 h of fermentation in both S and I-NWS trials, with sample I-NWS showing a significantly higher (p < 0.05) proteolysis than sample S. After that, the amount of released amino groups reached a plateau without any significant differences among times and samples (p > 0.05). The extent of proteolysis agreed with previous observations on the proteolytic ability of microbes inhabiting Parmigiano Reggiano cheese whey and NWS, such S. thermophilus and L. helveticus strains, as well as yeast strains of K. marxianus during whey protein concentrate fermentation [31,34,45].

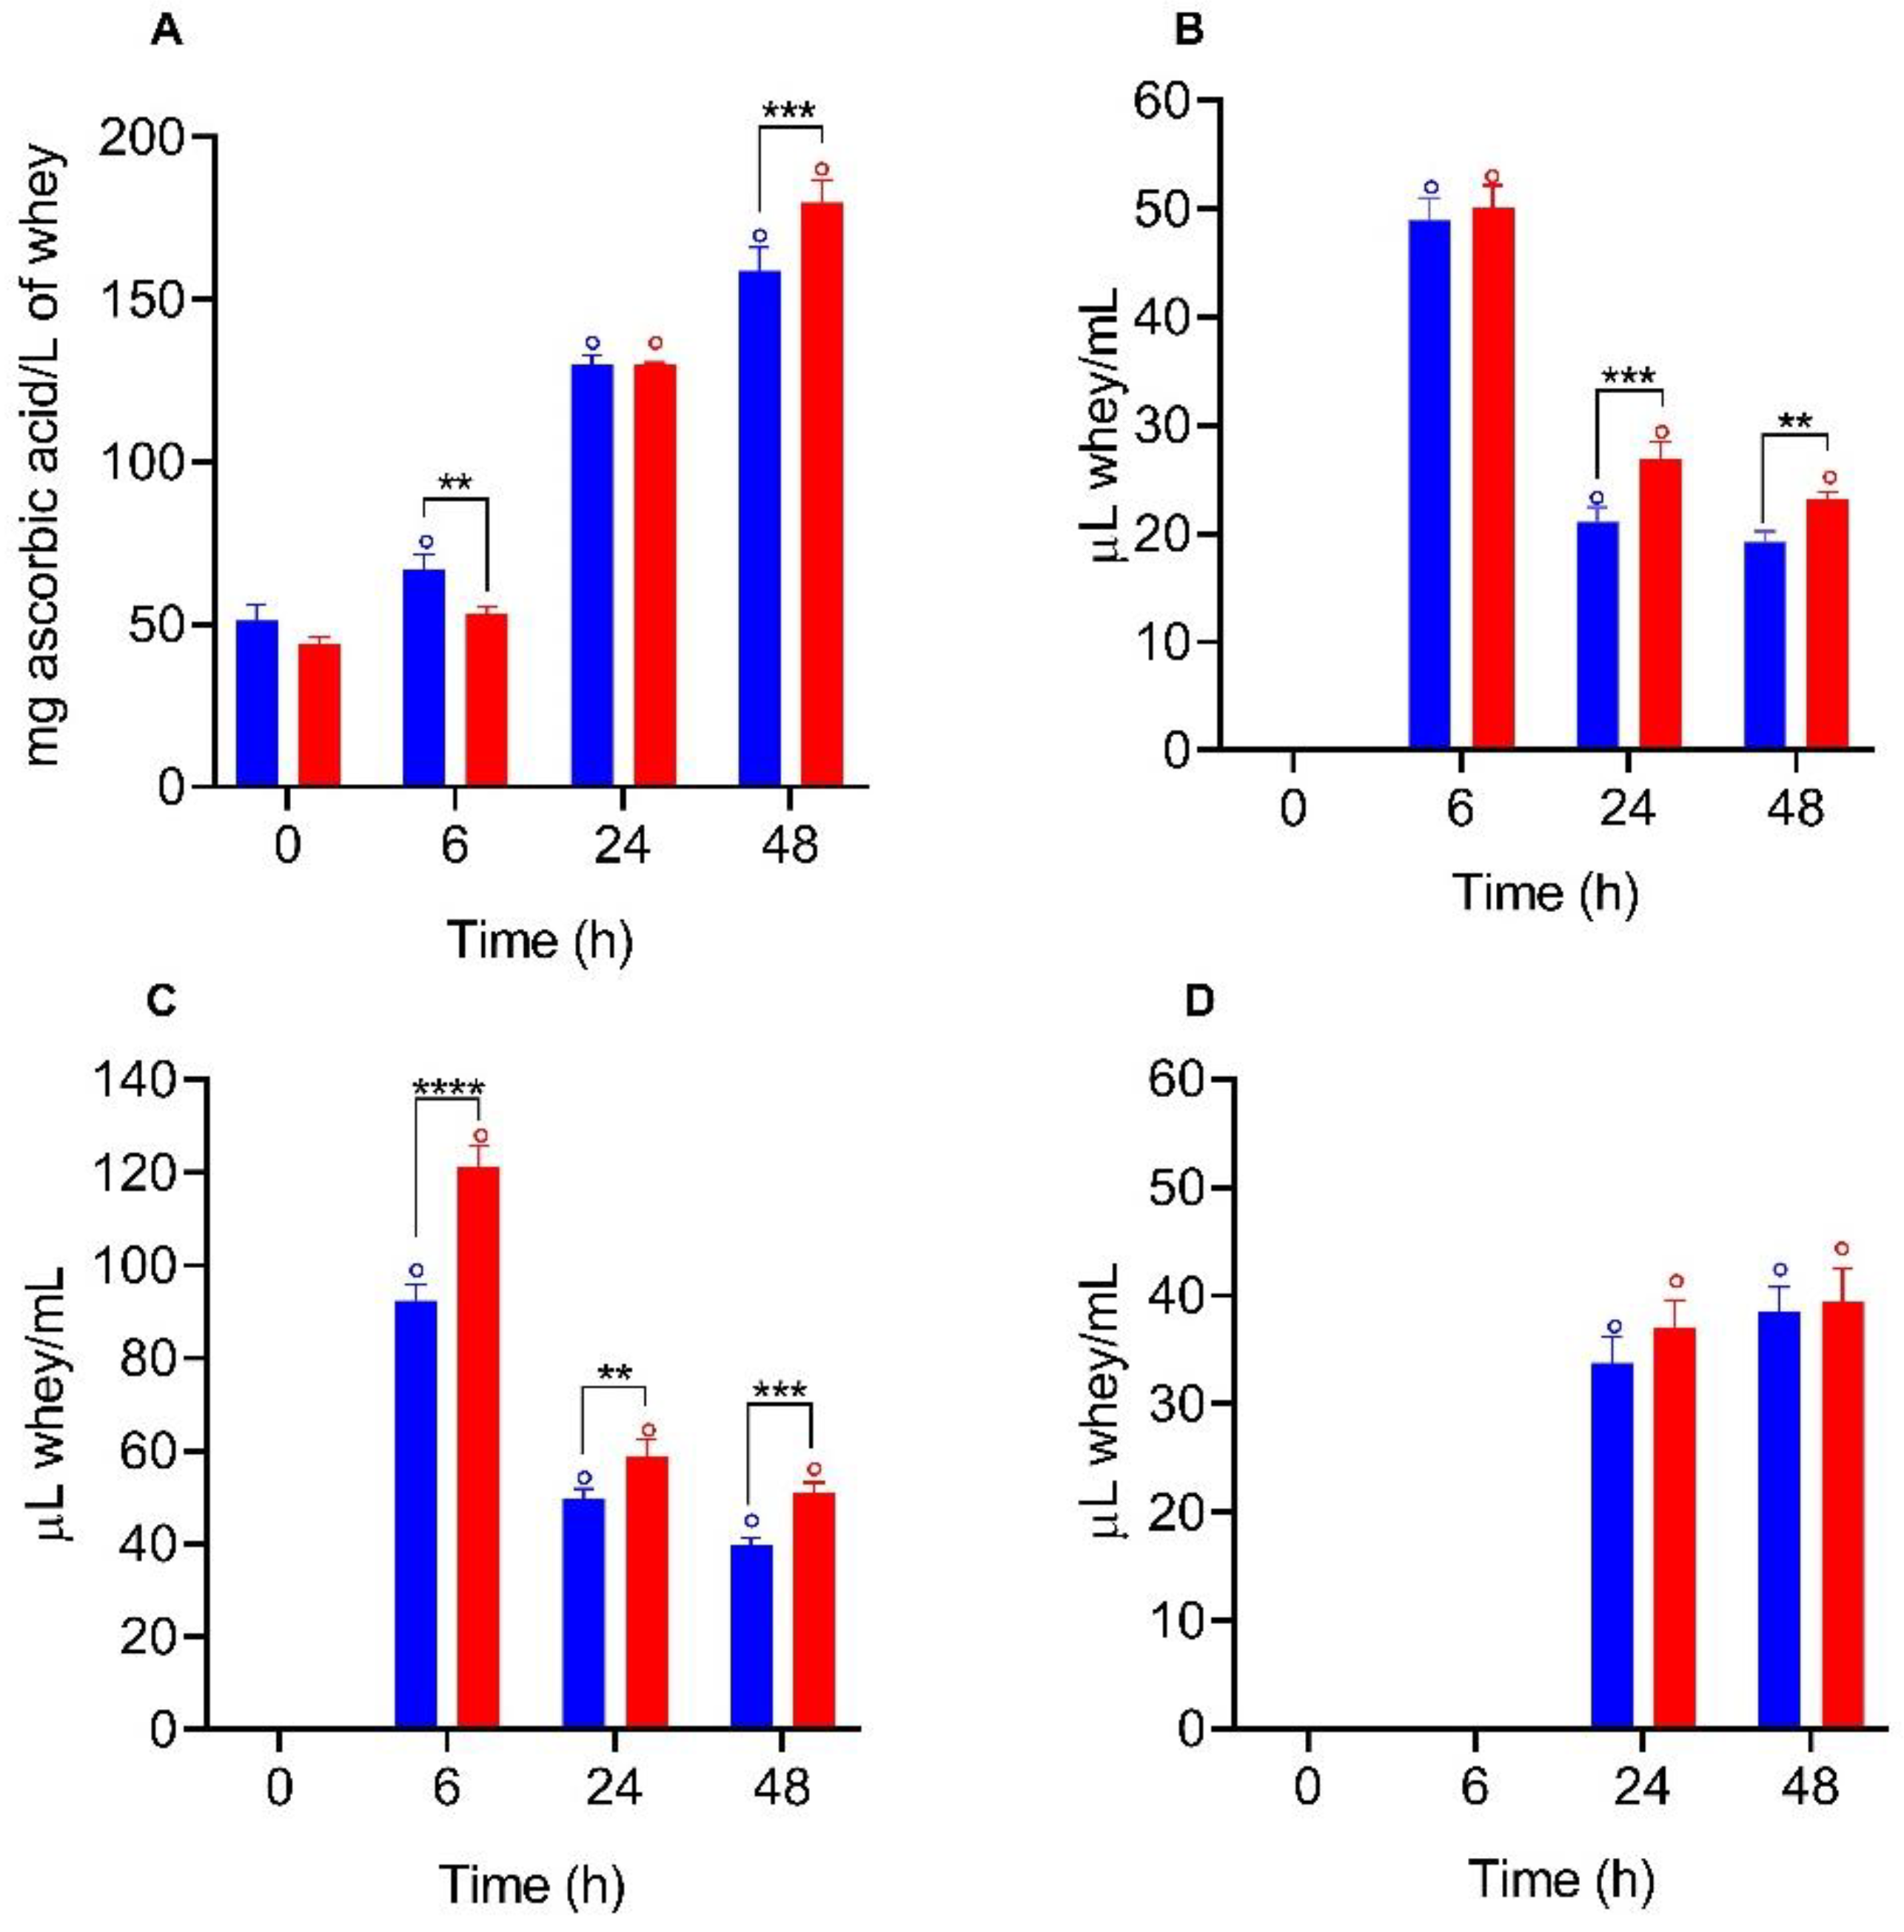
3.5. Biological Activities Determination

As displayed in Figure 4A, the antioxidant activity of LMWP fractions extracted from cheese whey increased accordingly to the fermentation time in both S and I-NWS trials. The highest antioxidant activity values were detected after 48 h of fermentation in LMWP fractions extracted from both S and I-NWS fermented cheese whey. The antioxidant activity was significantly higher (p < 0.05) in I-NWS sample respect to the S sample (179.93 ± 6.88 and 158.79 ± 7.36 mg of ascorbic acid equivalent/L of whey, respectively).
Similarly, the ACE-inhibitory activity of LMWP fractions increased during fermentation in both the S and I-NWS samples (as evidenced by the decrease in the IC50 values) reaching the maximum activity after 48 h of fermentation although there were no significant differences (p > 0.05) between the data obtained after 24 and 48 h of fermentation (Figure 4B). In this case, the LMWP fractions from S samples extracted after 24 and 48 h of fermentation showed significantly higher (p < 0.05) ACE-inhibitory activity then I-NWS samples.
A similar trend was reported by Mazorra-Manzano et al. [21] that found an increasing ACE-inhibitory activity for spontaneously fermented cheese whey as the fermentation time increased. They found an inhibitory activity of about 50% with 10 μL of 48 h fermented whey which was higher than the activity observed in this study. Furthermore, an ACE inhibitory activity like that reported here was observed for goat cheese whey fermented with S. thermophilus and L. casei [46]. Moreover, a lower ACE-inhibitory activity was assessed after whey proteins fermentation with Enterococcus faecalis [47].
A similar behavior was also observed in the case of DPP-IV-inhibitory activity as displayed in Figure 4C. The highest DPP-IV-inhibitory activity was found for LMWP fractions extracted from S and I-NWS samples after 48 h of fermentation and the inhibitory activity was significantly higher in S sample than in I-NWS sample at any time.
The α-glucosidase inhibitory activity was detected in LMWP fractions for both the samples only after 24 and 48 h of fermentation. No significant differences were observed between the S and I-NWS samples, as well as between 24 and 48 h of fermentation (Figure 4D).

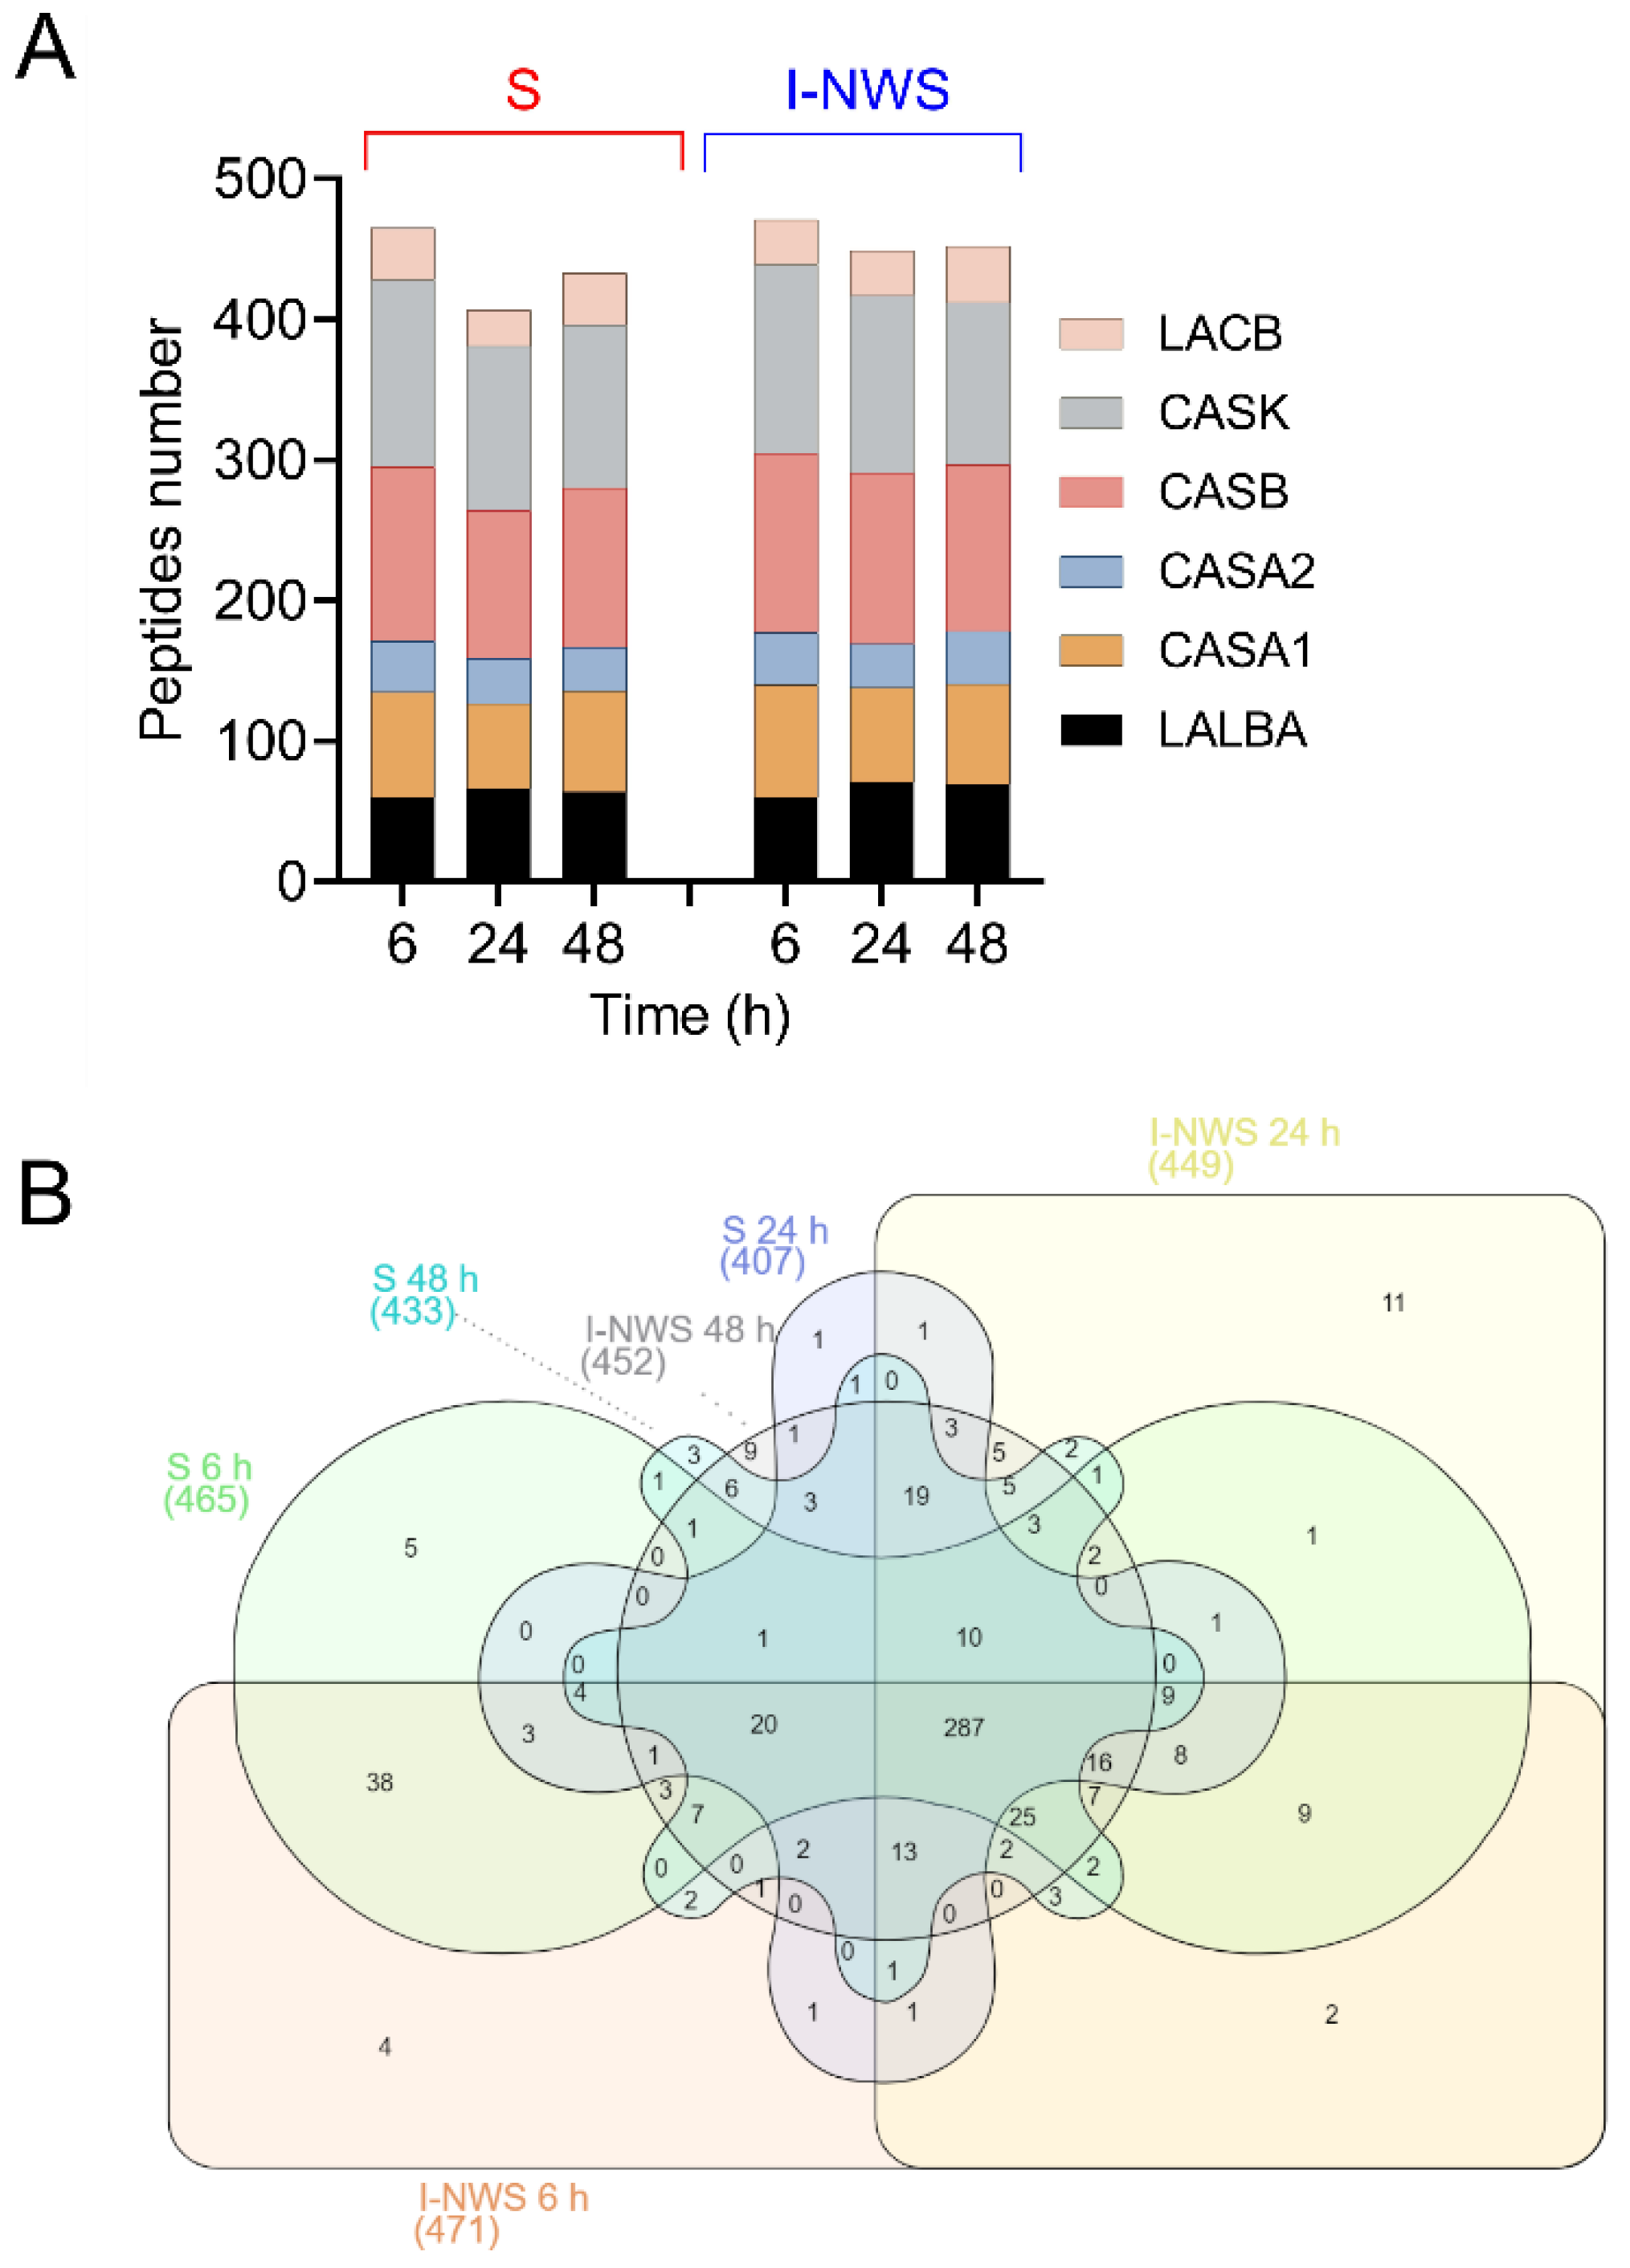
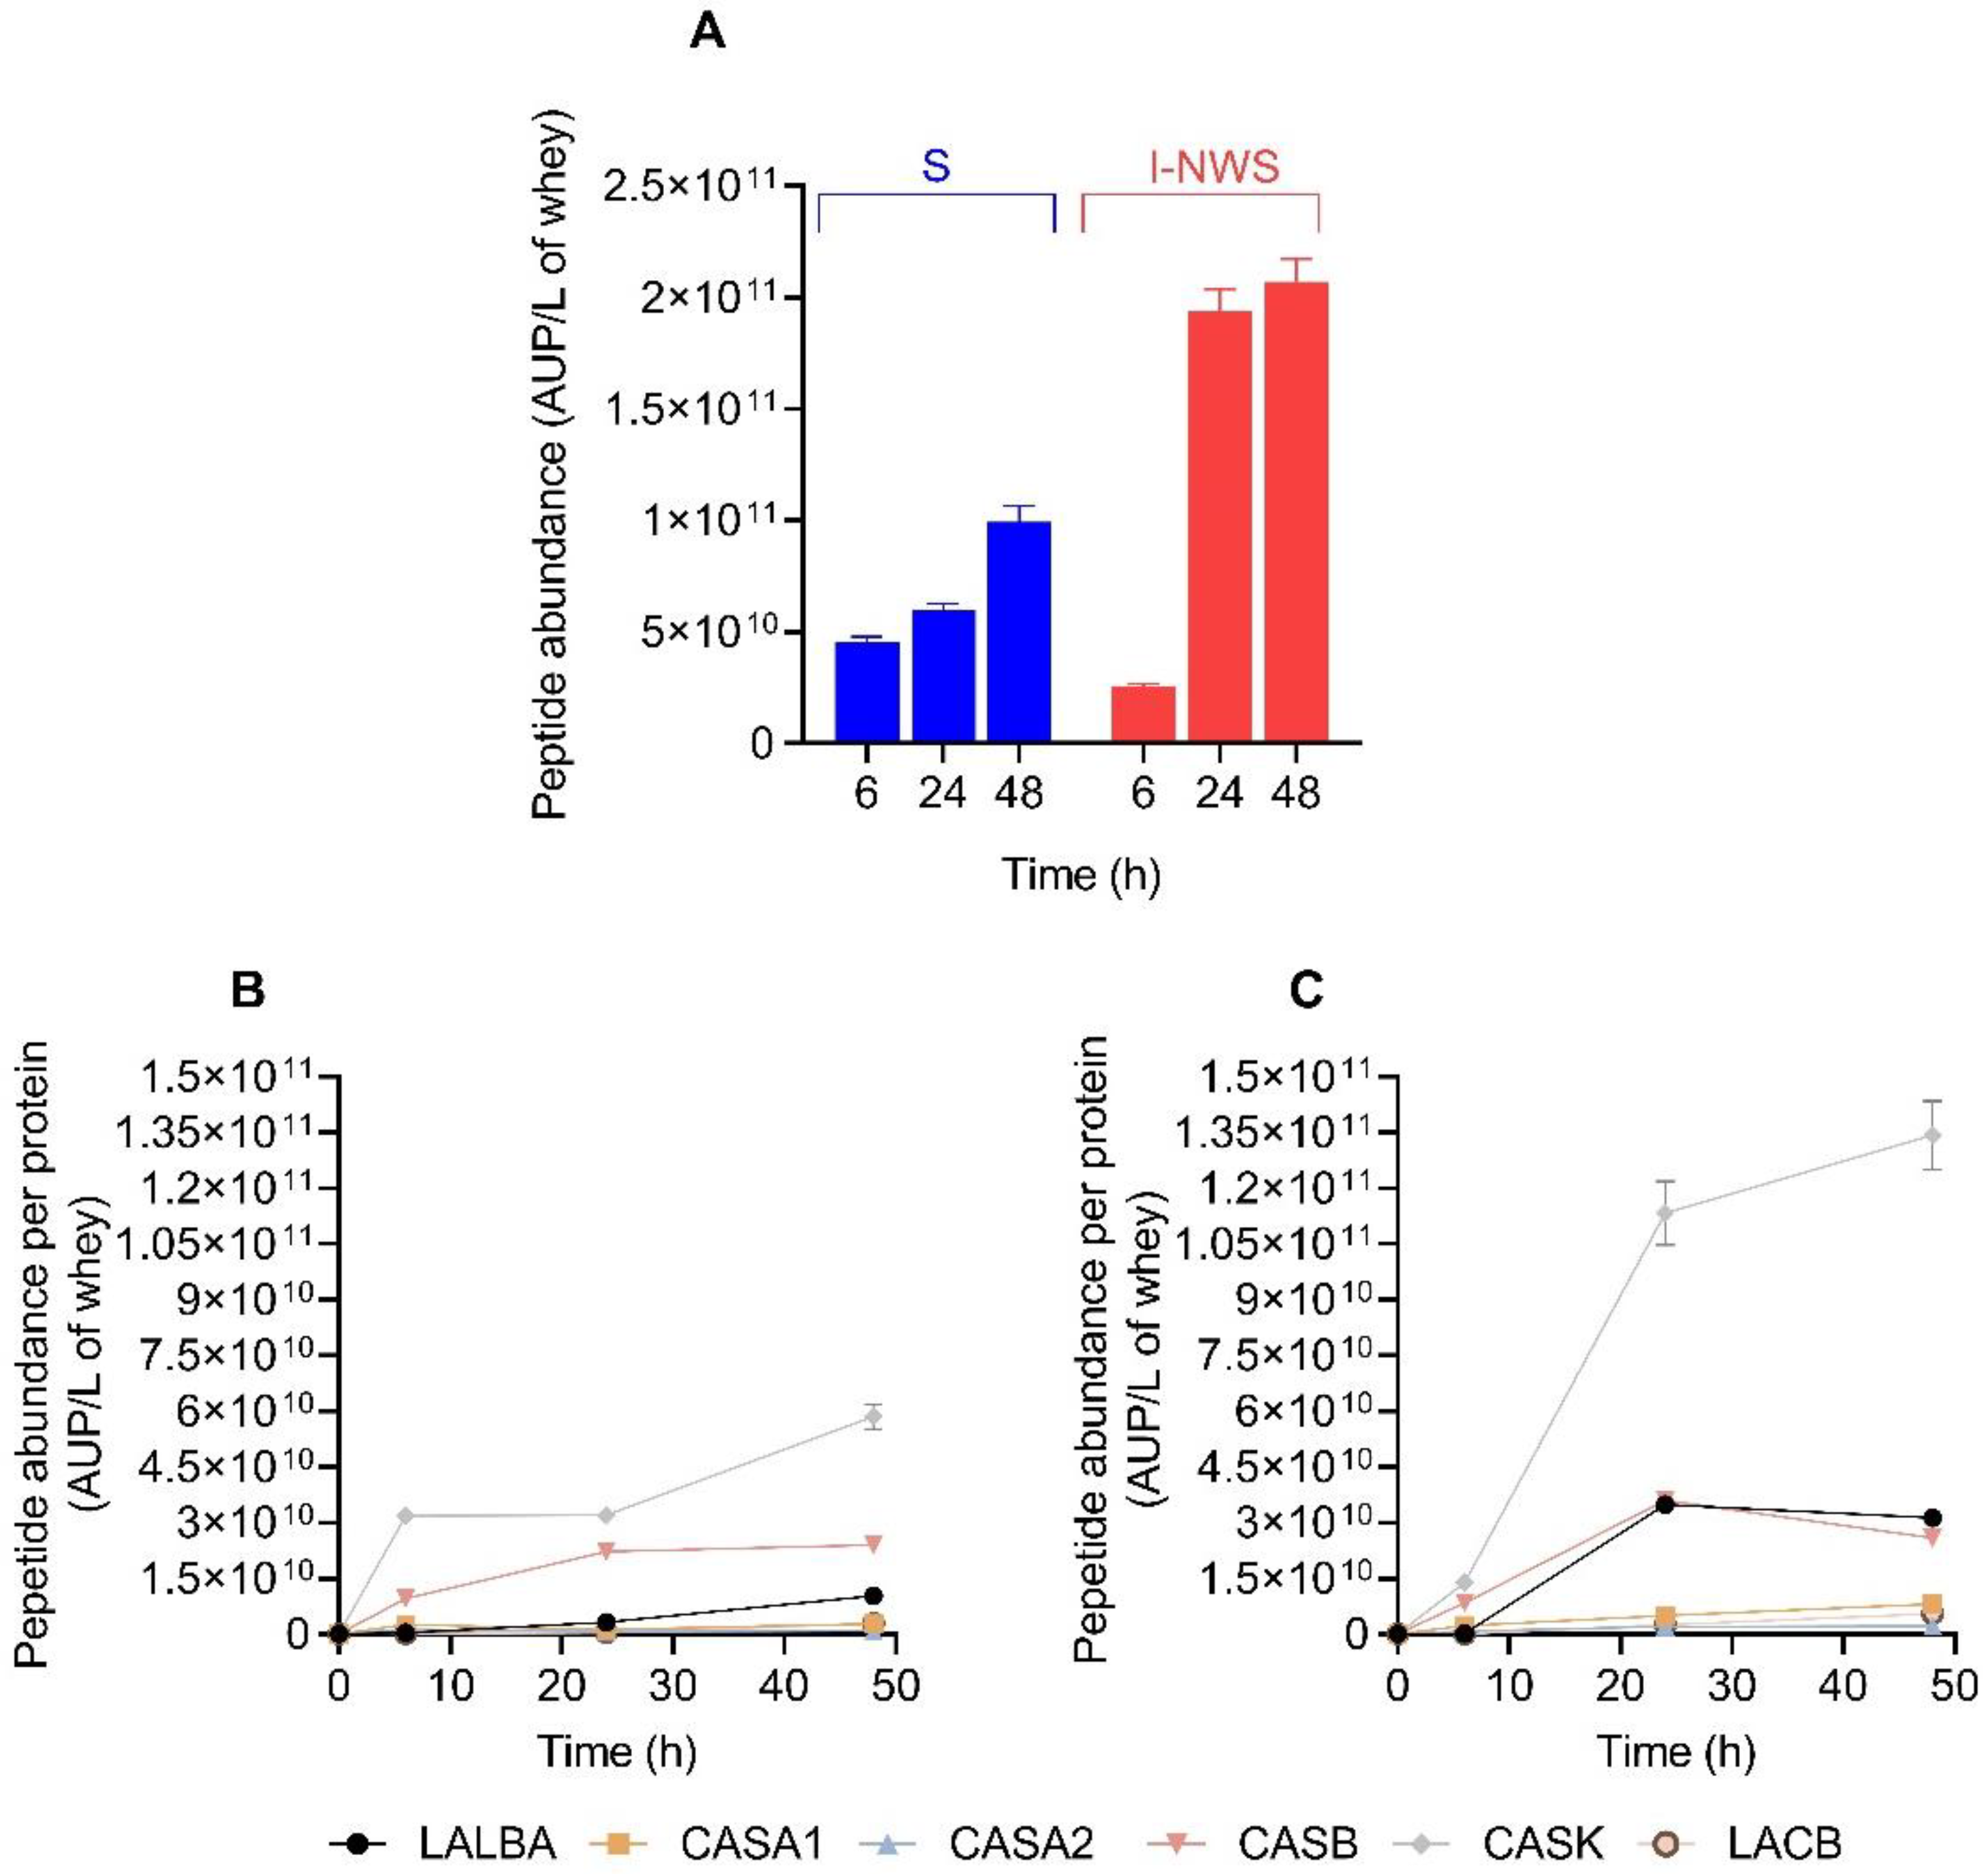
3.6. Peptidomics Profile of Fermented Cheese Whey

High-resolution mass spectrometry and in silico analysis were carried out on samples collected after 6, 24, and 48 h of fermentation to perform peptidomics study. The Mascot and Skyline data for the different fermented whey samples are showed in Supplementary Table S3.
The number of identified peptides ranged between 407 in the 24 h fermented S sample to 472 in the 6 h fermented I-NWS sample (Figure 5A). The highest number of identified peptides originated from β-casein and κ-casein, whereas only a minor portion was released from the serum proteins β-lactoglobulin and α-lactalbumin. According to previous studies, caseins are the preferred substrates for lactobacilli and yeast proteases, being serum proteins more resistant to the action of proteases [19,20,31,34].
The Venn diagram (Figure 5B) revealed that S and I-NWS samples analyzed at different times were similar in terms of type of identified peptides. The number of unique peptides (peptides identified in only one sample) was very low and below the 7% of total identified peptides. On the contrary the 50.6% of total identified peptides were detected in any sample at any time of fermentation.
Therefore, the type of identified peptides and their number is not enough to explain the observed differences in the degree of protein hydrolysis and biological activities among the samples.
To understand if differences among the samples were mainly quantitative rather than qualitative, semi-quantitative analysis was performed by using Skyline software. As reported in Figure 6A, the sum of the intensity (peptide abundance measured as area under the peak for each specific peptide) of all the sequenced peptides increased accordingly to the fermentation time reaching the maximum values after 48 h of fermentation for both the S and I-NWS trials.
The peptide abundance detected at 24 and 48 h was significantly higher (p < 0.05) for I-NWS samples respect to S samples, whereas S sample showed significantly higher (p < 0.05) peptides intensity than I-NWS after 6 h of fermentation. These results do not coincide with those shown in Figure 3 regarding the determination of the hydrolysis degree, except for time 24 h where the sample I-NWS displayed higher peptides abundance and hydrolysis degree than the S sample. This discrepancy may be due mainly to the different methods of peptide extraction. In the hydrolysis degree determination peptides were extracted by TCA precipitation, whereas for the mass spectrometry experiments peptides were extracted by ultrafiltration. This last separation technique allows for the recovery of peptides only in function of their molecular weight (i.e., peptides lower than 10 kDa), removing theoretically all the proteins/peptides with a molecular weight higher than the membrane cut-off. Instead, TCA precipitation is not only related to the size of the proteins/peptides but also to their hydrophobicity and may precipitate also small peptides [48].
The analysis of peptide abundance per protein (Figure 6B,C) revealed a time dependent increase in the sum of peptide intensity for protein in both the fermentation trials. The highest peptide intensity was found for κ-casein in both the fermentation trials with I-NWS samples collected after 24 and 48 h of fermentation having significantly higher values (p < 0.05) than S samples. In LWMP fractions from S sample, β-casein was the second protein showing the greatest peptide abundance at any time (Figure 6B). Differently, in I-NWS the sum of peptide intensity was similar for β-casein and α-lactalbumin, apart for the time 6 h where β-casein peptide abundance overcame that of α-lactalbumin (Figure 6C). For both the fermentation trials, after 6 h of fermentation κ-casein and β-casein accounted for most of the peptide abundance (about 87% and 90% of total peptide abundance for I-NWS and S, respectively), suggesting that these proteins were cleaved quickly and more efficiently than the others. The percentage of incidence of the peptide abundance of serum proteins was very low after 6 h of fermentation (below the 1%); however, the incidence started to increase after 24 h of fermentation in both the trials reaching values near to the 18% and 13% of the total peptide abundance after 48 h of fermentation of I-NWS and S, respectively (Figure 6B,C). Therefore, these results suggested that caseins were the preferred substrate for LAB and yeast proteases, however, they were able also to cleave, although slowly and with a less efficiency, serum proteins, and especially α-lactalbumin [31,34,49].

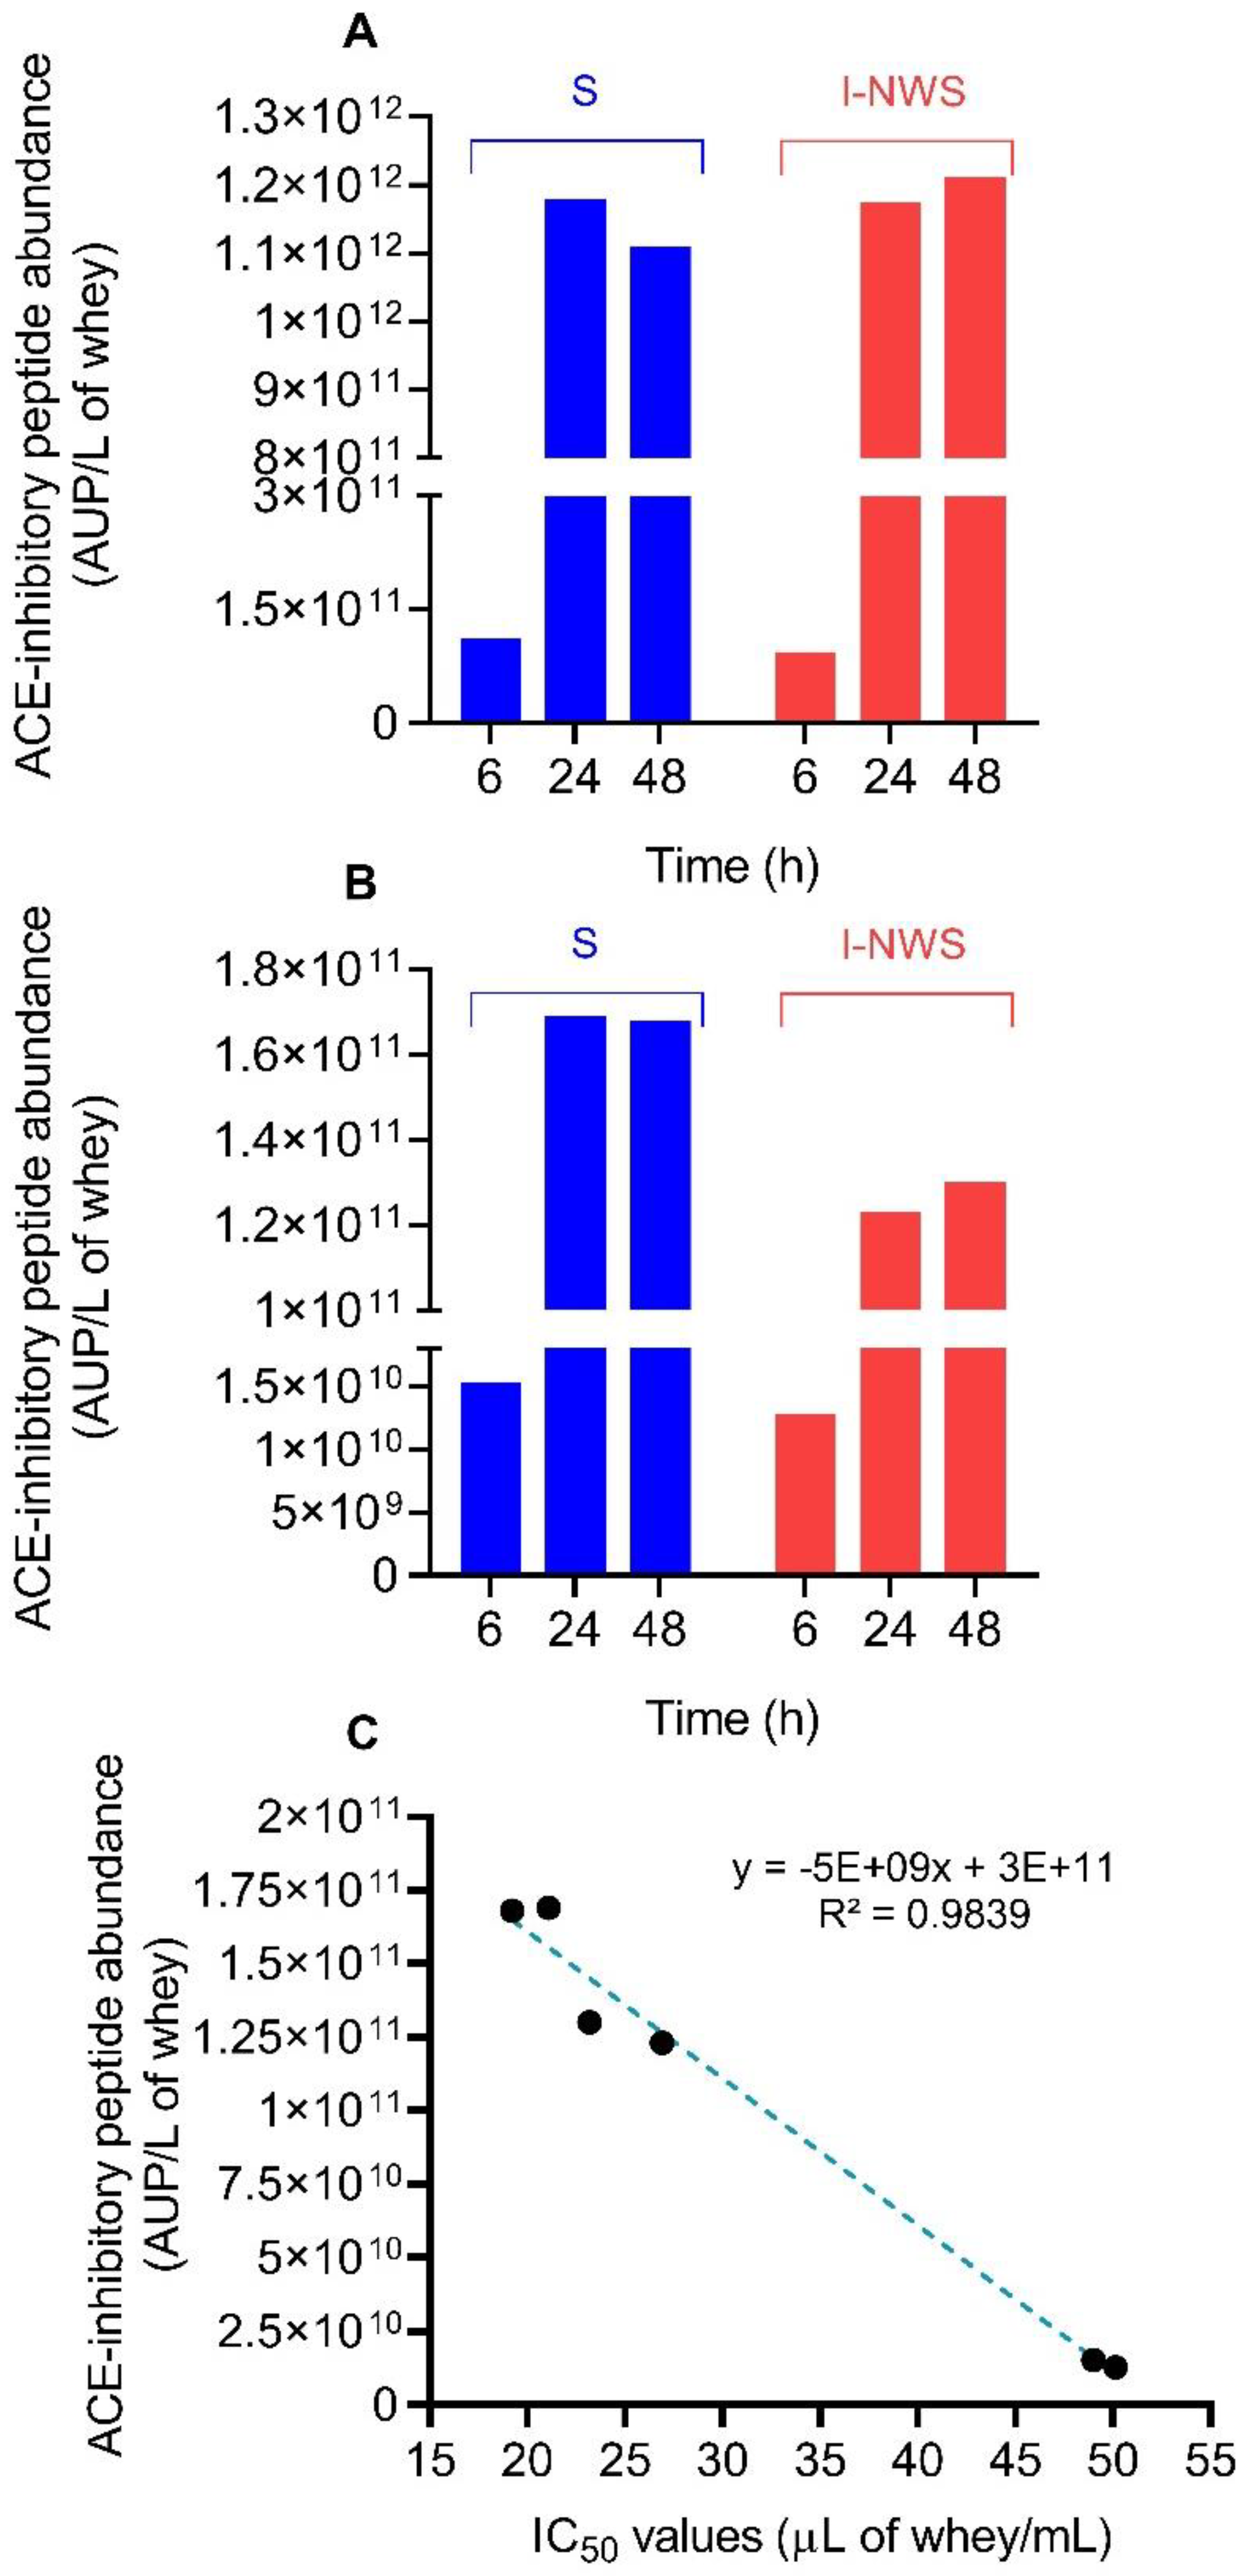
3.7. Bioactive Peptides Profile of Fermented Cheese Whey

A total of 39 peptides previously reported as bioactive were identified considering all the samples (Table 1). The majority of identified peptides were ACE-inhibitors (21 peptides), antioxidant (9 peptides) and anti-microbial (8 peptides). In addition, peptides with anti-inflammatory (5 peptides), immunomodulatory (4 peptides), opioid (3 peptides), DPP-IV-inhibitory (2 peptides), calcium absorption promoting (2 peptides), and anti-cancer (1 peptide) activities were identified. Some peptides were multifunctional and presented more than one biological activity. The lower number of bioactive peptides was found in the LMWP fractions extracted after 6 h of fermentation in both the trials. The number of bioactive peptides found in the LMWP fractions extracted from I-NWS samples was higher than the number found in S samples regardless the sampling time.
Some of the identified ACE-inhibitory peptides, such as the β-casein-derived peptides VPP, IPP, PLP, and LPLP, the αS1-casein-derived peptide AYFYPEL, and the α-lactalbumin-derived peptide DKVGINYW, were also found active in vivo decreasing the blood pressure in spontaneously hypertensive rats [10,50]. The tripeptides VPP and IPP exhibited anti-hypertensive activity in human volunteers, especially in pre-hypertensive and hypertensive subjects [51,52]. Furthermore, three additional peptides (the β-casein-derived NLHLPLP, the αS1-casein-derived peptide ENLLRF, and the β-lactoglobulin derived peptide LLF) exhibited IC50 values lower than 100 μmol/L [53,54,55].
The distribution of ACE-inhibitory peptides among the samples (Table 1) indicated that there was not a direct correlation between the number of these peptides and the ACE-inhibitory activity of the LMWP fractions analyzed. In particular, the LMWP fractions from S samples displayed higher ACE-inhibitory activity than that extracted from I-NWS samples, but they hold a lower number of ACE-inhibitory peptides. To obtain more information about the role of the identified ACE-inhibitory peptides on the bioactivity of LMWP fractions, semi-quantitative analysis was performed. Firstly, the peptide intensity of each ACE-inhibitory peptides (expressed as area under peak per L of cheese whey) identified in LMWP fractions was summed and correlated with the IC50 values against ACE of the same LMWP fractions. As can be seen by comparing data in Figure 4B and Figure 7A, a strong and significant inverse correlation (Pearson r coefficient of −0.9765; p < 0.05) was observed between the peptide abundance and the IC50 values against ACE.
The inverse relationship was more evident (Pearson r coefficient of −0.9919; p < 0.05) when the IC50 values against ACE was correlated with the sum of the peptide abundance of ACE-inhibitory peptides considering the individual peptide potency (Figure 7B). In this dataset, the peptide abundance (area under the peak) of each individual peptide was normalized by dividing it for the corresponding IC50 value. Furthermore, linear regression analysis (Figure 7C) revealed a strong inverse linear relationship between the IC50 values against ACE and the sum of the normalized peptide abundance of ACE-inhibitory peptides (R2 = 0.9839; p < 0.05). Therefore, correlation and linear regression analysis suggest that the identified ACE-inhibitory peptides were responsible for the observed ACE-inhibitory activity of LMWP fractions.
The same conclusion cannot be drawn for the DPP-IV-inhibitory activity of LMWP fractions and the identified DPP-IV-inhibitory peptides since only two peptides with this bioactivity (the β-casein-derived peptide IPP and the α-lactalbumin-derived peptide LKGYGGVSLPE) were identified in the samples. In this case, the presence of not yet identified DPP-IV-inhibitory peptides in the LMWP fractions may be presumed.
Concerning the antioxidant activity, a total of nine antioxidant peptides were identified in the different samples. The majority of these peptides contained in their sequences the antioxidant amino acid Y, a feature considered of paramount importance in determining the antioxidant activity of a peptide [56]. Some of the identified peptides exhibited ABTS-radical scavenging activity, such as the β-casein-derived peptides SQSKVLPVPQKAVPYPQ, LLY, and PYPQ, as well as the α-lactalbumin-derived peptide YGLF and β-lactoglobulin-derived peptide YLL [57,58,59]. These peptides can be responsible for the ABTS-radical scavenging activity of the analyzed LMWP fractions. However, the presence of numerous additional Y-containing peptides in the LMWP fractions (see Supplementary Table S3) pointed out the presence of not yet identified antioxidant peptides in fermented cheese whey.
Finally, no α-glucosidase-inhibitory peptides were found in any LMWP fractions.

3.8. Quantification of the Anti-Hypertensive Lactotripeptides VPP and IPP

The lactotripeptides VPP and IPP, showing anti-hypertensive effects on human subjects [51], were quantified in the different samples and results are reported in Table 2.
In general, the amount of IPP was higher than that of VPP at any fermentation times. This was probably related to the fact that VPP is only present in β-casein sequence whereas IPP was found both in β-casein and κ-casein sequences. The lower amount of VPP was found after 6 h of fermentation without significant differences between I-NWS and S (p > 0.05). Afterwards, the concentration of VPP increased after 24 h of fermentation in both the samples, reaching a plateau in trial S whereas continued to increase after 48 h of fermentation in trial I-NWS. Similarly, the lowest concentrations of IPP were found after 6 h of fermentation, once again without any significant differences between the LMWP fractions extracted from I-NWS and S (p > 0.05). Finally, the amount of IPP strongly increased after 24 h reaching then a plateau in both the fermentation trials. LMWP fractions from S 24 h and S 48 h samples displayed significant higher amount of IPP with respect to the I-NWS samples at the same fermentation time (p < 0.05).

4. Conclusions

In this study, we proved that both S and I-NWS-driven fermentation of Parmigiano Reggiano cheese whey can release several bioactive peptides with anti-hypertensive, anti-diabetic, and antioxidant activities. Whereas no differences were found in the protein hydrolysis and peptides number between S and I-NWS fermentation, the addition of NWS gave raise a higher abundance in peptides intensity. Despite this, spontaneous fermentation resulted in a higher ACE-inhibitory and DPP-IV-inhibitory activities than I-NWS fermentation. In the case of ACE-inhibitory activity this was related to the highest abundance of ACE-inhibitory peptides in S than in I-NWS samples, as revealed by peptidomics analysis. Furthermore, the presence of NWS induced a higher hydrolysis of α-lactalbumin and β-lactoglobulin, which are considered allergenic proteins. Therefore, the present study indicates that whey endogenous microbiota and NWS microorganisms hydrolyze whey proteins extensively. Considering that NWS is daily produced by each dairy farm, including in the Parmigiano Reggiano PDO area, S and I-NWS fermentations could be two technologically scalable and economically cheap solutions to valorize the byproduct of Parmigiano Reggiano cheesemaking into a fermented whey-based beverages with healthy properties. These solutions may be beneficial to consumers since promote the release of functional peptides with various biological activities and improves whey protein digestibility, potentially reducing its allergenicity.

Supplementary Materials

The following supporting information can be downloaded at: https://www.mdpi.com/article/10.3390/fermentation9030270/s1, Figure S1: Trends of lactose concentration (mg/mL) during S and I-NWS whey fermentation. Values are expressed as means of at least three replicates. Asterisks indicate significant differences over time in the same fermentation batch, while dots significant differences among samples at the same fermentation time (p < 0.05). Table S1: Phenotypic and molecular characterization of LAB isolates from NWS used as inoculum in this study; Table S2: Phenotypic and molecular characterization of yeast isolates from NWS used as inoculum in this study; Table S3: Peptidomics data for peptide identification in S and I-NWS samples. Data are the average of three experiments.

Author Contributions

Conceptualization, D.T., L.S. (Lisa Solieri) and A.H.; Methodology, L.S. (Lisa Solieri) and D.T.; Formal analysis, L.S. (Lisa Solieri); Investigation, G.S., A.H. and L.S. (Laura Sola); Resources, L.S. (Lisa Solieri); Data curation, L.S. (Lisa Solieri), C.N. and D.T.; Writing—original draft preparation, L.S. (Lisa Solieri); Writing—review and editing, L.S. (Lisa Solieri) and D.T.; Visualization, L.S. (Lisa Solieri); Supervision, L.S. (Lisa Solieri) and D.T.; Funding acquisition, L.S. (Lisa Solieri). All authors have read and agreed to the published version of the manuscript.

Funding

This research was funded by a grant from Department of Life Sciences, University of Modena and Reggio Emilia. Research project FAR2020 “Sviluppo di un approccio di BioREFining basato sull’impiego di batteri lattici e lieviti per la valorizzazione dei sottoprodotti dell’industria lattiero-casearia (BioREFMilk)”.

Data Availability Statement

The data presented in this study are available herein.

Acknowledgments

The authors acknowledge the Ministry of Higher Education of the Arab Republic of Egypt for funding Ahmed Helal with a Post-Doc scholarship (mission 2020/2021 part 2). The authors also acknowledge the Fondazione Cassa di Risparmio di Modena for funding the HPLC-ESI-Q Exactive Hybrid Quadrupole-Orbitrap Mass Spectrometer system at the Centro Interdipartimentale Grandi Strumenti (CIGS).

Conflicts of Interest

The authors declare no conflict of interest.

References

  1. Timmis, K.; de Vos, W.M.; Ramos, J.L.; Vlaeminck, S.E.; Prieto, A.; Danchin, A.; Verstraete, W.; de Lorenzo, V.; Lee, S.Y.; Brüssow, H.; et al. The contribution of microbial biotechnology to sustainable development goals. Microbial. Biotechnol. 2017, 10, 984–987. [Google Scholar] [CrossRef] [PubMed]
  2. Hatti-Kaul, R.; Chen, L.; Dishisha, T.; Enshasy, H.E. Lactic acid bacteria: From starter cultures to producers of chemicals. FEMS Microbiol. Lett. 2018, 365, fny213. [Google Scholar] [CrossRef] [PubMed] [Green Version]
  3. Gänzle, M. The periodic table of fermented foods: Limitations and opportunities. Appl. Microbiol. Biotechnol. 2022, 106, 2815–2826. [Google Scholar] [CrossRef] [PubMed]
  4. Gaspar, P.; Carvalho, A.L.; Vinga, S.; Santos, H.; Neves, A.R. From physiology to systems metabolic engineering for the production of biochemicals by lactic acid bacteria. Biotechnol. Adv. 2013, 31, 764–788. [Google Scholar] [CrossRef] [PubMed]
  5. López-Gómez, J.P.; Pérez-Rivero, C.; Venus, J. Valorisation of solid biowastes: The lactic acid alternative. Process Biochem. 2020, 99, 222–235. [Google Scholar] [CrossRef]
  6. Sharma, P.; Gaur, V.K.; Kim, S.H.; Pandey, A. Microbial strategies for bio-transforming food waste into resources. Bioresour. Technol. 2020, 299, 122580. [Google Scholar] [CrossRef]
  7. Khubber, S.; Marti-Quijal, F.J.; Tomasevic, I.; Remize, F.; Barba, F.J. Lactic acid fermentation as a useful strategy to recover antimicrobial and antioxidant compounds from food and by-products. Curr. Opin. Food Sci. 2022, 43, 189–198. [Google Scholar] [CrossRef]
  8. Raman, J.; Kim, J.S.; Choi, K.R.; Eun, H.; Yang, D.; Ko, Y.J.; Kim, S.J. Application of lactic acid bacteria (LAB) in sustainable agriculture: Advantages and limitations. Int. J. Mol. Sci. 2022, 23, 7784. [Google Scholar] [CrossRef]
  9. Daliri, E.B.-M.; Lee, B.H.; Oh, D.H. Current trends and perspectives of bioactive peptides. Crit. Rev. Food Sci. Nutr. 2018, 58, 2273–2284. [Google Scholar] [CrossRef]
  10. Tagliazucchi, D.; Martini, S.; Solieri, L. Bioprospecting for bioactive peptide production by lactic acid bacteria isolated from fermented dairy food. Fermentation 2019, 5, 96. [Google Scholar] [CrossRef] [Green Version]
  11. Chourasia, R.; Chiring Phukon, L.; Abedin, M.M.; Padhi, S.; Singh, S.P.; Rai, A.K. Bioactive peptides in fermented foods and their application: A critical review. Syst. Microbiol. Biomanuf. 2023, 3, 88–109. [Google Scholar] [CrossRef]
  12. Agriculture, Forestry and Fishery Statistics, Eurostat, 2018 Edition. Available online: https://ec.europa.eu/eurostat/web/products-statistical-books/-/ks-fk-18-001 (accessed on 18 February 2023).
  13. Smithers, G.W. Whey and Whey Proteins—From ‘gutter-to-gold’. Int. Dairy J. 2008, 18, 695–704. [Google Scholar] [CrossRef]
  14. Jelen, P. Whey processing: Utilization and products. In Encyclopedia of Dairy Sciences, 1st ed.; Roginski, H., Fuquay, J.W., Fox, P.F., Eds.; Academic Press: New York, NY, USA, 2003; pp. 2739–2745. [Google Scholar]
  15. Dullius, A.; Goettert, M.I.; de Souza, C.F.V. Whey protein hydrolysates as a source of bioactive peptides for functional foods—Biotechnological facilitation of industrial scale-up. J. Funct. Foods 2018, 42, 58–74. [Google Scholar] [CrossRef]
  16. Zotta, T.; Solieri, L.; Iacumin, L.; Picozzi, C.; Gullo, M. Valorization of cheese whey using microbial fermentations. Appl. Microbiol. Biotechnol. 2020, 104, 2749–2764. [Google Scholar] [CrossRef]
  17. Pescuma, M.; Hébert, E.M.; Mozzi, F.; de Valdez, G.F. Functional fermented whey-based beverage using lactic acid bacteria. Int. J. Food Microbiol. 2010, 141, 73–81. [Google Scholar] [CrossRef]
  18. Daliri, E.B.-M.; Lee, B.H.; Park, B.-J.; Kim, S.-H.; Oh, D.-H. Antihypertensive peptides from whey proteins fermented by lactic acid bacteria. Food Sci. Biotechnol. 2018, 27, 1781–1789. [Google Scholar] [CrossRef]
  19. Ali, E.; Nielsen, S.D.; Abd-El Aal, A.; El-Leboudy, A.; Saleh, E.; LaPointe, G. Use of mass spectrometry to profile peptides in whey protein isolate medium fermented by Lactobacillus helveticus LH-2 and Lactobacillus acidophilus La-5. Front. Nutr. 2019, 6, 152. [Google Scholar] [CrossRef] [Green Version]
  20. Skrzypczak, K.; Gustaw, W.; Fornal, E.; Kononiuk, A.; Michalak-Majewska, M.; Radzki, W.; Waśko, A. Functional and technological potential of whey protein isolate in production of milk beverages fermented by new strains of Lactobacillus helveticus. Appl. Sci. 2020, 10, 7089. [Google Scholar] [CrossRef]
  21. Mazorra-Manzano, M.A.; Robles-Porchas, G.R.; González-Velázquez, D.A.; Torres-Llanez, M.J.; Martínez-Porchas, M.; García-Sifuentes, C.O.; González-Córdova, A.F.; Vallejo-Córdoba, B. Cheese whey fermentation by its native microbiota: Proteolysis and bioactive peptides release with ACE-inhibitory activity. Fermentation 2020, 6, 19. [Google Scholar] [CrossRef] [Green Version]
  22. Mazorra-Manzano, M.A.; Robles-Porchas, G.R.; Martínez-Porchas, M.; Ramírez-Suárez, J.C.; García-Sifuentes, C.O.; Torres-Llanez, M.J.; González-Córdova, A.F.; Hernández-Mendoza, A.; Vallejo-Cordoba, B. Bacterial Diversity and Dynamics during Spontaneous Cheese Whey Fermentation at Different Temperatures. Fermentation 2022, 8, 342. [Google Scholar] [CrossRef]
  23. León-López, A.; Pérez-Marroquín, X.A.; Estrada-Fernández, A.G.; Campos-Lozada, G.; Morales-Peñaloza, A.; Campos-Montiel, R.G.; Aguirre-Álvarez, G. Milk Whey Hydrolysates as High Value-Added Natural Polymers: Functional Properties and Applications. Polymers 2022, 14, 1258. [Google Scholar] [CrossRef] [PubMed]
  24. Ferreira, M.V.S.; Cappato, L.P.; Silva, R.; Rocha, R.S.; Guimarães, J.T.; Balthazar, C.F.; Esmerino, E.A.; Freitas, M.Q.; Rodrigues, F.N.; Granato, D.; et al. Ohmic heating for processing of whey-raspberry flavored beverage. Food Chem. 2019, 297, 125018. [Google Scholar] [CrossRef] [PubMed]
  25. Mucchettti, G.; Gatti, M.; Nocetti, M.; Reverberi, P.; Bianchi, A.; Galati, F.; Petroni, A. Segmentation of Parmigiano Reggiano dairies according to cheese-making technology and relationships with the aspect of the cheese curd surface at the moment of its extraction from the cheese vat. J. Dairy Sci. 2014, 97, 1202–1209. [Google Scholar] [CrossRef] [PubMed] [Green Version]
  26. Bottari, B.; Agrimonti, C.; Gatti, M.; Neviani, E.; Marmiroli, N. Development of a multiplex real time PCR to detect thermophilic lactic acid bacteria in natural whey starters. Int. J. Food Microbiol. 2013, 160, 290–297. [Google Scholar] [CrossRef]
  27. Gatti, M.; Lazzi, C.; Rossetti, L.; Mucchetti, G.; Neviani, E. Biodiversity in Lactobacillus helveticus strains present in natural whey starter used for Parmigiano Reggiano cheese. J. Appl. Microbiol. 2003, 93, 463–470. [Google Scholar] [CrossRef]
  28. Rossetti, L.; Fornasari, M.E.; Gatti, M.; Lazzi, C.; Neviani, E.; Giraffa, G. Grana Padano cheese whey starters: Microbial composition and strain distribution. Int. J. Food Microbiol. 2008, 127, 168–171. [Google Scholar] [CrossRef]
  29. Santarelli, M.; Gatti, M.; Lazzi, C.; Bernini, V.; Zapparoli, G.A.; Neviani, E. Whey Starter for Grana Padano Cheese: Effect of technological parameters on viability and composition of the microbial community. J. Dairy Sci. 2008, 91, 883–891. [Google Scholar] [CrossRef] [Green Version]
  30. Sola, L.; Quadu, E.; Bortolazzo, E.; Bertoldi, L.; Randazzo, C.L.; Pizzamiglio, V.; Solieri, L. Insights on the bacterial composition of Parmigiano Reggiano Natural Whey Starter by a culture-dependent and 16S rRNA metabarcoding portrait. Sci. Rep. 2022, 12, 17322. [Google Scholar] [CrossRef]
  31. Solieri, L.; Valentini, M.; Cattivelli, A.; Sola, L.; Helal, A.; Martini, S.; Tagliazucchi, D. Fermentation of whey protein concentrate by Streptococcus thermophilus strains releases peptides with biological activities. Process Biochem. 2022, 121, 590–600. [Google Scholar] [CrossRef]
  32. Bertani, G.; Levante, A.; Lazzi, C.; Bottari, B.; Gatti, M.; Neviani, E. Dynamics of a natural bacterial community under technological and environmental pressures: The case of natural whey starter for Parmigiano Reggiano cheese. Food Res. Int. 2020, 129, 108860. [Google Scholar] [CrossRef]
  33. da Silva Duarte, V.; Carlot, M.; Pakroo, S.; Tarrah, A.; Lombardi, A.; Santiago, H.; Corich, V.; Giacomini, A. Comparative evaluation of cheese whey microbial composition from four Italian cheese factories by viable counts and 16S rRNA gene amplicon sequencing. Int. Dairy J. 2020, 104, 104656. [Google Scholar] [CrossRef]
  34. Martini, S.; Bonazzi, M.; Malorgio, I.; Pizzamiglio, V.; Tagliazucchi, D.; Solieri, L. Characterization of yeasts isolated from Parmigiano Reggiano cheese natural whey starter: From spoilage agents to potential cell factories for whey valorization. Microorganisms 2021, 9, 2288. [Google Scholar] [CrossRef] [PubMed]
  35. Adler-Nissen, J. Determination of the degree of hydrolysis of food protein hydrolysates by trinitrobenzene sulfonic acid. J. Agric. Food Chem. 1979, 27, 1256–1262. [Google Scholar] [CrossRef] [PubMed]
  36. Tagliazucchi, D.; Shamsia, S.; Helal, A.; Conte, A. Angiotensin-converting enzyme inhibitory peptides from goats’ milk released by in vitro gastro-intestinal digestion. Int. Dairy J. 2017, 71, 6–16. [Google Scholar] [CrossRef]
  37. Re, R.; Pellegrini, N.; Proteggente, A.; Pannala, A.; Yang, M.; Rice-Evans, C. Antioxidant activity applying an improved ABTS radical cation decolorization assay. Free Rad. Biol. Med. 1999, 26, 1231–1237. [Google Scholar] [CrossRef]
  38. Tagliazucchi, D.; Martini, S.; Shamsia, S.; Helal, A.; Conte, A. Biological activity and peptidomic profile of in vitro digested cow, camel, goat and sheep milk. Int. Dairy J. 2018, 81, 19–27. [Google Scholar] [CrossRef] [Green Version]
  39. Martini, S.; Solieri, L.; Cattivelli, A.; Pizzamiglio, V.; Tagliazucchi, D. An Integrated Peptidomics and In Silico Approach to Identify Novel Anti-Diabetic Peptides in Parmigiano-Reggiano Cheese. Biology 2021, 10, 563. [Google Scholar] [CrossRef]
  40. Perkins, D.N.; Pappin, D.J.; Creasy, D.M.; Cottrell, J.S. Probability-based protein identification by searching sequence databases using mass spectrometry data. Electrophoresis 1999, 20, 3551–3567. [Google Scholar] [CrossRef]
  41. Dallas, D.; Nielsen, S.D. Milk peptidomics to identify functional peptides and for quality control of dairy products. Methods Mol. Biol. 2018, 1719, 223–240. [Google Scholar]
  42. MacLean, B.; Tomazela, D.M.; Shulman, N.; Chambers, M.; Finney, G.L.; Frewen, B.; Kern, R.; Tabb, D.L.; Liebler, D.C.; MacCoss, M.J. Skyline: An open source document editor for creating and analyzing targeted proteomics experiments. Bioinformatics 2010, 26, 966–968. [Google Scholar] [CrossRef] [Green Version]
  43. Nielsen, S.D.; Beverly, R.L.; Qu, Y.; Dallas, D.C. Milk bioactive peptide database: A comprehensive database of milk protein-derived bioactive peptides and novel visualization. Food Chem. 2017, 232, 673–682. [Google Scholar] [CrossRef] [PubMed]
  44. Martini, S.; Conte, A.; Tagliazucchi, D. Effect of ripening and in vitro digestion on the evolution and fate of bioactive peptides in Parmigiano-Reggiano cheese. Int. Dairy J. 2020, 105, 104668. [Google Scholar] [CrossRef]
  45. Pescuma, M.; Valdez, G.F.D.; Mozi, F. Whey-derived valuable products obtained by microbial fermentation. Appl. Microbiol. Biotechnol. 2015, 99, 6183–6196. [Google Scholar] [CrossRef] [PubMed]
  46. Pereira, Á.M.S.; de Farias, D.R.B.; de Queiroz, B.B.; Nobre, M.S.C.; Cavalcanti, M.T.; Salles, H.O.; Dos Santos, K.M.O.; de Medeiros, A.C.D.; Florentino, E.R.; Alonso Buriti, F.C. Influence of a Co-culture of Streptococcus thermophilus and Lactobacillus casei on the Proteolysis and ACE-Inhibitory Activity of a Beverage Based on Reconstituted Goat Whey Powder. Probiotics Antimicrob. Proteins 2019, 11, 273–282. [Google Scholar] [CrossRef]
  47. Worsztynowicz, P.; Białas, W.; Grajek, W. Integrated approach for obtaining bioactive peptides from whey proteins hydrolysed using a new proteolytic lactic acid bacteria. Food Chem. 2020, 312, 126035. [Google Scholar] [CrossRef]
  48. Yvon, M.; Chabanet, C.; Pélissier, J.P. Solubility of peptides in trichloroacetic acid (TCA) solutions. Hypothesis on the precipitation mechanism. Int. J. Pept. Protein Res. 1989, 34, 166–176. [Google Scholar] [CrossRef]
  49. Kieliszek, M.; Pobiega, K.; Piwowarek, K.; Kot, A.M. Characteristics of the proteolytic enzymes produced by lactic acid bacteria. Molecules 2021, 26, 1858. [Google Scholar] [CrossRef]
  50. Tavares, T.; Sevilla, M.Á.; Montero, M.J.; Carrón, R.; Malcata, F.X. Acute effect of whey peptides upon blood pressure of hypertensive rats, and relationship with their angiotensin-converting enzyme inhibitory activity. Mol. Nutr. Food Res. 2012, 56, 316–324. [Google Scholar] [CrossRef]
  51. Cicero, A.F.G.; Gerocarni, B.; Laghi, L.; Borghi, C. Blood pressure lowering effect of lactotripeptides assumed as functional foods: A meta-analysis of current available clinical trials. J. Hum. Hypertens. 2011, 25, 425–436. [Google Scholar] [CrossRef] [Green Version]
  52. Fekete, A.A.; Givens, D.I.; Lovegrove, J.A. Casein-derived lactotripeptides reduce systolic and diastolic blood pressure in a meta-analysis of randomised clinical trials. Nutrients 2015, 7, 659–681. [Google Scholar] [CrossRef] [Green Version]
  53. Kohmura, M.; Nio, N.; Kubo, K.; Minoshima, Y.; Munekata, E.; Ariyoshi, Y. Inhibition of Angiotensin-converting Enzyme by Synthetic Peptides of Human β-Casein. Agric. Biol. Chem. 1989, 53, 2107–2114. [Google Scholar]
  54. Quirós, A.; Hernández-Ledesma, B.; Ramos, M.; Amigo, L.; Recio, I. Angiotensin-converting enzyme inhibitory activity of peptides derived from caprine kefir. J. Dairy Sci. 2005, 88, 3480–3487. [Google Scholar] [CrossRef] [PubMed] [Green Version]
  55. Hernández-Ledesma, B.; Recio, I.; Ramos, M.; Amigo, L. Preparation of ovine and caprine β-lactoglobulin hydrolysates with ACE-inhibitory activity. Identification of active peptides from caprine β-lactoglobulin hydrolysed with thermolysin. Int. Dairy J. 2002, 12, 805–812. [Google Scholar] [CrossRef]
  56. Tagliazucchi, D.; Helal, A.; Verzelloni, E.; Conte, A. Bovine milk antioxidant properties: Effect of in vitro digestion and identification of antioxidant compounds. Dairy Sci. Technol. 2016, 96, 657–676. [Google Scholar] [CrossRef] [Green Version]
  57. Tonolo, F.; Fiorese, F.; Moretto, L.; Folda, A.; Scalcon, V.; Grinzato, A.; Ferro, S.; Arrigoni, G.; Bindoli, A.; Feller, E.; et al. Identification of New Peptides from Fermented Milk Showing Antioxidant Properties: Mechanism of Action. Antioxidants 2020, 9, 117. [Google Scholar] [CrossRef] [PubMed] [Green Version]
  58. Amigo, L.; Martínez-Maqueda, D.; Hernández-Ledesma, B. In Silico and In Vitro Analysis of Multifunctionality of Animal Food-Derived Peptides. Foods 2020, 9, 991. [Google Scholar] [CrossRef]
  59. Sowmya, K.; Mala, D.; Bhat, M.I.; Kumar, N.; Bajaj, R.K.; Kapila, S.; Kapila, R. Bio-accessible milk casein derived tripeptide (LLY) mediates overlapping anti- inflammatory and anti-oxidative effects under cellular (Caco-2) and in vivo milieu. J. Nutr. Biochem. 2018, 62, 167–180. [Google Scholar] [CrossRef]
Figure 1. Acidification (A) and lactic acid concentration (mg/mL) (B) in S (blue) and I-NWS (red) whey fermentation. Values are expressed as means of at least three replicates. Statistical analysis used two-way ANOVA with Tukey’s HSD post hoc test, where asterisks indicate significant differences over time in the same fermentation batch, while dots significant differences among samples at the same fermentation time (p < 0.05).
Fermentation 09 00270 g001
Figure 2. Count enumeration of LAB and yeast population in S and I-NWS whey fermentation. (A) Thermophilic lactobacilli count scored on MRS plates incubated at 42 °C in anaerobiosis; (B) thermophilic lactobacilli and streptococci counts scored on MRS plates incubated at 42 °C in anaerobiosis and M17-SSW at 42 °C in aerobiosis, respectively; (C) mesophilic yeast counts scored on YPDA plates incubated at 27 °C; and (D) thermophilic yeast counts scored on YPDL plates incubated at 42 °C. Statistical analysis used two-way ANOVA with Tukey’s HSD post hoc test, where asterisks (*, p < 0.05; **, p < 0.01; ****, p < 0.0001) indicate significant differences among samples at the same fermentation time, while dots significant differences over time in the same fermentation batch (p < 0.05).
Fermentation 09 00270 g002
Figure 3. Evolution of protein hydrolysis in S (blue) and I-NWS (red) whey fermentation trials. Statistical analysis used two-way ANOVA with Tukey’s HSD post hoc test, where asterisks indicate significant differences over time in the same fermentation batch, while dots significant differences among samples at the same fermentation time (p < 0.05).
Fermentation 09 00270 g003
Figure 4. Analysis of biological activities in LMWP fractions extracted from S (blue) and I-NWS (red) cheese whey fermentation trials. Samples were withdrawn at times 0, 6, 24, and 48 h. LMWP fractions were obtained as described in materials and methods sections. (A) Antioxidant activity determined by the ABTS assay. Results were expressed as mg of ascorbic acid equivalent/L. (B) ACE-inhibitory activity. Data are reported as IC50 values (μL of whey/mL) defined as the amount of whey necessary to inhibit the enzymatic activity by 50%. (C) DPP-IV-inhibitory activity. Data are reported as IC50 values (μL of whey/mL) defined as the amount of whey necessary to inhibit the enzymatic activity by 50%. (D) α-glucosidase-inhibitory activity. Data are reported as IC50 values (μL of whey/mL) defined as the amount of whey necessary to inhibit the enzymatic activity by 50%. Statistical analysis used two-way ANOVA with Tukey’s HSD post hoc test, where asterisks (**, p < 0.01; ***, p <0.001; ****, p < 0.0001) indicate significant differences among samples at the same fermentation time, while dots (blue for S and red for I-NWS) significant differences over time in the same fermentation batch (p < 0.05). Abbreviations: LMWP, low weight molecular peptides; ABTS, 2,2-azino-bis(3-ethylbenzothiazoline-6-sulphonic acid); ACE, angiotensin-converting enzyme; DPP-IV, dipeptidyl-peptidase-IV.
Fermentation 09 00270 g004
Figure 5. Peptidomics analysis of LMWP fractions extracted from S and I-NWS cheese whey fermentation trials. Samples analyzed were withdrawn at times 6, 24, and 48 h. LMWP fractions were obtained as described in materials and methods sections. (A) Number of peptides identified in the different samples grouped by protein. (B) Venn diagram showing differences and similarity in the peptide profiles. The complete list of identified peptides can be found in Supplementary Table S3. Abbreviations: LACB, β-lactoglobulin; CASK, casein κ; CASB, casein β; CASA1, casein α1; CASA2, casein α2; and LALBA, α-lactalbumin.
Fermentation 09 00270 g005
Figure 6. Semi-quantitative peptidomics analysis of LMWP fractions extracted from S (blue) and I-NWS (red) cheese whey fermentation trials. Samples analyzed were withdrawn at times 6, 24, and 48 h. LMWP fractions were obtained as described in the Materials and Methods sections. (A) Peptide abundance reported as the sum of the intensity of the entire pool of identified peptides. (B) Peptide abundance per protein in S samples. (C) Peptide abundance per protein in I-NWS samples. Data are reported as the sum of the intensity of each identified peptide measured as area under the peak (AUP) by Skyline analysis. Values are mean of at least three replicates and bars, when visible, represent standard deviation. The complete list of identified peptides can be found in Supplementary Table S3. Abbreviations: LACB, β-lactoglobulin; CASK, casein κ; CASB, casein β; CASA1, casein α1; CASA2, casein α2; and LALBA, α-lactalbumin.
Fermentation 09 00270 g006
Figure 7. Semi-quantitative peptidomics analysis of ACE-inhibitory peptides identified in LMWP fractions extracted from S and I-NWS cheese whey fermentation trials. Samples analyzed were withdrawn at times 6, 24, and 48 h. LMWP fractions were obtained as described in the Materials and Methods sections. (A) Peptide abundance reported as the sum of the intensity of the ACE-inhibitory peptides. Data are reported as the sum of the intensity of each identified peptide measured as area under the peak (AUP) by Skyline analysis. (B) Peptide abundance of ACE-inhibitory peptides identified in LMWP fractions normalized for the respective IC50 values. The AUP of each peptide was divided for the respective IC50 value. (C) Linear regression analysis. Relationship between the peptide abundance of ACE-inhibitory peptides normalized for the IC50 values of each peptide and the IC50 values against ACE. The complete list of identified peptides can be found in Supplementary Table S3. Abbreviations: ACE, angiotensin-converting enzyme; LMWP, low molecular weight proteins; and AUP, area under peak.
Fermentation 09 00270 g007
Table 1. Peptides with 100% homology with formerly reported biologically active peptides identified in the low-molecular weight peptide (LMWP) fractions of fermented cheese whey.
Peptide Sequence 1Protein FragmentBioactivitySample
RELEELNVPGEIVESLSpSSpEESITRβ-casein (1–25)Immunomodulatory, promote calcium uptakeI-NWS24h; S6h; S24h; S48h
FQSpEEQQQTEDELQDKβ-casein (33–48)Promote calcium uptakeI-NWS6h; S6h
YPFPβ-casein (60–63)Opioid, anti-cancerI-NWS6h; I-NWS24h; I-NWS48h; S6h; S24h
IPPβ-casein (74–76)
κ-casein (108–110)
ACE-inhibitor (IC50 = 5 μmol/L), DPP-IV-inhibitor (IC50 = 169 μmol/L), antioxidant, anti-inflammatoryI-NWS6h; I-NWS24h; I-NWS48h; S6h; S24h; S48h
PVVVPPFLQPEβ-casein (81–91)Anti-microbialI-NWS6h; I-NWS48h; S6h; S24h; S48h
VPPβ-casein (84–86)ACE-inhibitor (IC50 = 8 μmol/L), antioxidant, anti-inflammatoryI-NWS6h; I-NWS24h; I-NWS48h; S6h; S24h; S48h
NLHLPLPLLβ-casein (132–140)ACE-inhibitor (IC50 = 15 μmol/L)I-NWS24h; S48h
LHLPLPLβ-casein (133–139)ACE-inhibitor (IC50 = 425 μmol/L)I-NWS24h; I-NWS48h; S48h
LPLPβ-casein (135–138)ACE-inhibitor (IC50 = 720 μmol/L)I-NWS6h; I-NWS24h; I-NWS48h; S6h; S24h; S48h
PLPβ-casein (136–138)ACE-inhibitor (IC50 = 430 μmol/L)I-NWS6h; I-NWS24h; I-NWS48h; S6h; S24h; S48h
SQSKVLPVPQKAVPYPQβ-casein (166–182)AntioxidantI-NWS6h; I-NWS24h; I-NWS48h; S6h; S24h; S48h
PYPQβ-casein (179–182)AntioxidantI-NWS24h; I-NWS48h; S24h; S48h
RDMPIQAFβ-casein (183–190)ACE-inhibitor (IC50 = 209 μmol/L)I-NWS6h; I-NWS48h; S24h
LLYβ-casein (191–193)Antioxidant, immunomodulatory, anti-inflammatoryI-NWS48h; S48h
YQEPVLGPVRGPFPIIVβ-casein (193–209)ACE-inhibitor (IC50 = 101 μmol/L), immunomodulatory, anti-microbialI-NWS6h; I-NWS24h; I-NWS48h; S48h
QEPVLGPVRGPFPIIVβ-casein (194–209)ACE-inhibitor (IC50 = 600 μmol/L)I-NWS48h; S24h
ENLLRFαS1-casein (18–23)ACE-inhibitor (IC50 = 82 μmol/L)I-NWS6h; I-NWS24h; I-NWS48h; S6h; S24h; S48h
VPSERYLαS1-casein (86–92)ACE-inhibitor (IC50 = 250 μmol/L)I-NWS24h; I-NWS48h; S48h
LRLKKYKVPQLαS1-casein (99–109)Anti-microbialI-NWS6h; I-NWS24h; I-NWS48h; S6h; S24h; S48h
AYFYPELαS1-casein (143–149)ACE-inhibitor (IC50 = 7 μmol/L), antioxidant, opioidI-NWS24h; I-NWS48h
PELαS1-casein (147–149)AntioxidantI-NWS48h
VYQHQKAMKPWIQPKTKVIPYVRYLαS2-casein (183–207)Anti-microbialI-NWS24h; I-NWS48h; S24h; S48h
TKVIPYVRYLαS2-casein (198–207)Anti-microbialI-NWS6h; I-NWS24h; I-NWS48h; S24h; S48h
TKVIPαS2-casein (198–207)ACE-inhibitor (IC50 = 400 μmol/L)I-NWS24h
VESTVATLκ-casein (139–146)Anti-microbialI-NWS6h; I-NWS24h; I-NWS48h; S6h; S24h; S48h
STVATLκ-casein (141–146)Anti-microbialI-NWS6h; I-NWS24h; I-NWS48h; S6h; S24h; S48h
PPEINκ-casein (156–160)ACE-inhibitor (IC50 = 510 μmol/L)I-NWS6h; I-NWS24h; I-NWS48h; S6h; S24h; S48h
VQVTSTAVκ-casein (162–169)Anti-microbialI-NWS6h; I-NWS24h; I-NWS48h; S6h; S24h; S48h
AVFβ-lactoglobulin (80–82)Anti-inflammatoryI-NWS6h; I-NWS24h; I-NWS48h; S6h; S24h; S48h
YLLβ-lactoglobulin (102–104)ACE-inhibitor (IC50 = 519 μmol/L), antioxidantI-NWS6h; I-NWS24h; I-NWS48h; S6h; S48h
LLFβ-lactoglobulin (103–105)ACE-inhibitor (IC50 = 80 μmol/L)I-NWS6h; I-NWS24h; I-NWS48h; S6h; S24h; S48h
LKGYGGVSLPEα-lactalbumin (15–25)DPP-IV-inhibitory (IC50 = 486 μmol/L)I-NWS6h; I-NWS24h; I-NWS48h; S6h; S24h; S48h
YGGα-lactalbumin (18–20)ImmunomodulatorI-NWS6h; I-NWS24h; I-NWS48h; S6h; S24h; S48h
YGLα-lactalbumin (50–52)ACE-inhibitor (IC50 = 409 μmol/L)I-NWS6h; I-NWS24h; I-NWS48h; S6h; S24h; S48h
YGLFα-lactalbumin (50–53)ACE-inhibitor (IC50 = 733 μmol/L)I-NWS6h; I-NWS24h; I-NWS48h; S6h
DKVGINYWα-lactalbumin (97–104)ACE-inhibitor (IC50 = 25 μmol/L)I-NWS6h; I-NWS24h; S6h
DKVGINYα-lactalbumin (97–103)ACE-inhibitor (IC50 = 100 μmol/L)I-NWS6h; I-NWS24h; I-NWS48h; S24h; S48h
WLAα-lactalbumin (104–106)Anti-inflammatoryI-NWS6h; I-NWS24h; I-NWS48h; S24h; S48h
LAHKALα-lactalbumin (105–110)ACE-inhibitor (IC50 = 621 μmol/L)I-NWS6h; I-NWS24h; I-NWS48h; S6h; S24h; S48h
1 Sp means phosphorylated serine residue. Peptide bioactivities and IC50 values were obtained from the Milk Bioactive Peptides Database. Abbreviations; ACE: angiotensin-converting enzyme; and DPP-IV: dipeptidyl peptidase IV.
Table 2. Concentrations of VPP and IPP in low-molecular weight peptide fractions of fermented cheese whey. Results are reported as mg/L of whey.
SequenceI-NWS 6 hI-NWS 24 hI-NWS 48 hS 6 hS 24 hS 48 h
VPP0.59 ± 0.05 a3.83 ± 0.11 b6.24 ± 0.52 c0.70 ± 0.07 a4.52 ± 0.31 d4.68 ± 0.39 d
IPP1.65 ± 0.12 a16.80 ± 1.01 b16.21 ± 1.23 b1.96 ± 0.18 a24.04 ± 1.99 c23.87 ± 2.01 c
Different letters in the same row indicate significantly different values (p < 0.05).
Disclaimer/Publisher’s Note: The statements, opinions and data contained in all publications are solely those of the individual author(s) and contributor(s) and not of MDPI and/or the editor(s). MDPI and/or the editor(s) disclaim responsibility for any injury to people or property resulting from any ideas, methods, instructions or products referred to in the content.

