Article

Use of Mixed Cultures for the Production of Grape–Plum Low-Alcohol Fermented Beverages

by
Daniel Moreno
1,*,
Patricia Redondo
1,
Eduardo Lozano
1,
M. Esperanza Valdés
1 and
Francisco Pérez-Nevado
2,*
1
CICYTEX, Instituto Tecnológico Agroalimentario de Extremadura (INTAEX), (Junta de Extremadura), 06071 Badajoz, Spain
2
Departamento de Producción Animal Y Ciencia de Los Alimentos, Escuela de Ingenierías Agrarias, Instituto Universitario de Investigación de Recursos Agrarios (INURA) Universidad de Extremadura, 06007 Badajoz, Spain
*
Authors to whom correspondence should be addressed.
Fermentation 2023, 9(1), 29; https://doi.org/10.3390/fermentation9010029
Submission received: 7 December 2022 / Revised: 24 December 2022 / Accepted: 26 December 2022 / Published: 29 December 2022
(This article belongs to the Special Issue Enological Repercussions of Non-saccharomyces Species 4.0)

Abstract

:
This work presents the attempt to develop a production technology for grape–plum low-alcohol beverages and enhance their chemical composition and flavor complexity through the non-Saccharomyces species. Saccharomyces cerevisiae (SC) pure cultures were used as reference beverages. Pure cultures of Lachancea thermotolerans (LT) and co-inoculated Lachancea thermotolerans with Saccharomyces cerevisiae (MIX) were included for grape–plum must fermentation at a pilot scale. The process involves two steps: a primary alcoholic fermentation in stainless steel tanks (F1) and a secondary fermentation in a bottle after dextrose syrup addition (F2). The chemical compositions of all beverages obtained in F1 and F2 were studied. Compared to SC, must inoculated with L. thermotolerans (LT and MIX) required four more days to complete the fermentation of sugars during F1. SC fermentation tended to have slightly higher pH and titratable acidity values and lower concentrations of total phenols. Final levels of aromatic precursor nitrogen and sulfur amino nitrogen were obtained more in SC than in LT and MIX. SC treatment had higher final levels of histidine, phenylalanine, isoleucine, lysine, methionine, threonine, valine, and cysteine. Related to individual amino acids, SC treatment had higher final levels of histidine, phenylalanine, isoleucine, lysine, methionine, threonine, valine, and cysteine. Analysis of the volatile composition showed that, compared with SC, MIX had the highest percentage of higher alcohols (3-methyl-1-butanol and 2-methyl-1-butanol) and acetates (isoamyl acetate and isobutyl acetate) which are associated with fruity and banana aromas. A decreasing trend in volatile fatty acids was observed in LT and MIX compared to SC. LT application, both in pure and mixed culture, significantly modified the values of the percentage of 5 of the 10 ethyl ester compounds analyzed. Finally, the sensory analysis showed that there were no significant differences, even though the non-Saccharomyces had a higher percentage of volatile metabolites. The results have shown that through this process an innovative and high-quality product was obtained: a low-alcohol beverage made from grapes and plums, which could be developed at an industrial level due to the increasing interest of consumers in this type of product.

Graphical Abstract

1. Introduction

The production of low-alcohol beverages from fruits with attractive color and high fermentation capacity is one of the profitable alternatives available, in response to increasing consumer demand for novel, special, and valuable products characterized by interesting and diversified flavors [1,2]. Innovation in this type of beverages is focused on the proliferation of new products, launching different beverages with a wide variety of flavors (watermelon, lime, plum, etc.) in order to attract new consumers. The genus Saccharomyces, and in particular S. cerevisiae, is a model microorganism used in several technological processes such as wine (fermentation of grape juice), cider (fermentation of apple juice), beer (fermentation of malted cereals), and distilled beverages produced by condensation of alcohol from fermentation [3]. Proper selection of yeasts and bacteria and early detection of potential spoilage microorganisms is essential to provide fermented beverages with improved and differentiating characteristics, with a consequent competitive advantage. Many selected bacteria and yeasts play a role in many technological and industrial processes [4]. In recent years, several studies have been carried out to evaluate the use of controlled mixed fermentations using Saccharomyces yeasts and other species of non-Saccharomyces from the wine environment. There are non-Saccharomyces species such as Candida stellata and Torulaspora delbrueckii that positively affect the flavor of alcoholic beverages, thus indicating that their addition to musts may be beneficial [5,6,7]. Lachancea thermotolerans (LT), formerly Kluyveromyces thermotolerans, is a yeast that can be found in many natural media and relatively frequently in grapes [7,8,9,10,11]. It has a medium fermentative power (4–10% v/v), so it should be used in a mixed or sequential manner with other species, such as S. cerevisiae, which allow it to completely ferment the sugars in the must [12]. It is characterized by a high production of lactic acid during fermentation [10,13,14,15,16]; this acid will be very stable throughout the lifetime of the wine or beverage because it is more difficult to degrade than other acids through microbiological action. Due to the high lactic acid production of this yeast, pH drops of 0.5 points or even more have been recorded. This yeast can also synthesize a higher proportion of glycerol and 2-phenylethanol, compounds that provide body and sweetness and rose aroma, respectively [11,12,14]. Besides chemical composition, sensory properties of LT wines were also studied [12,14,17,18]. Thus, it was demonstrated that some non-Saccharomyces strains such as L. thermotolerans showed an appropriate fermentation profile to be used as starter culture for alcoholic fermentation, especially in sequential inoculation with Saccharomyces cerevisiae.
This study was aimed at developing a production technology for grape–plum low-alcohol beverage and to assess the potential effect of L. thermotolerans on their chemical composition and sensory quality when used in mixed fermentations with Saccharomyces cerevisiae.

2. Materials and Methods

2.1. Yeast Strains

The following yeast species were used in this study: commercial Saccharomyces cerevisiae Mauribrew ALE 514 (Mauri yeast Australia, Queensland, Australia) and commercial Lachancea thermotolerans Laktia (Lallemand, Montreal, Canada, LAKTIATM).

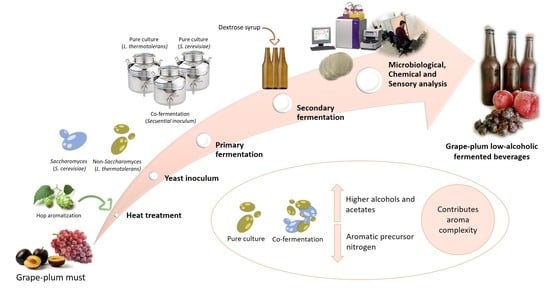
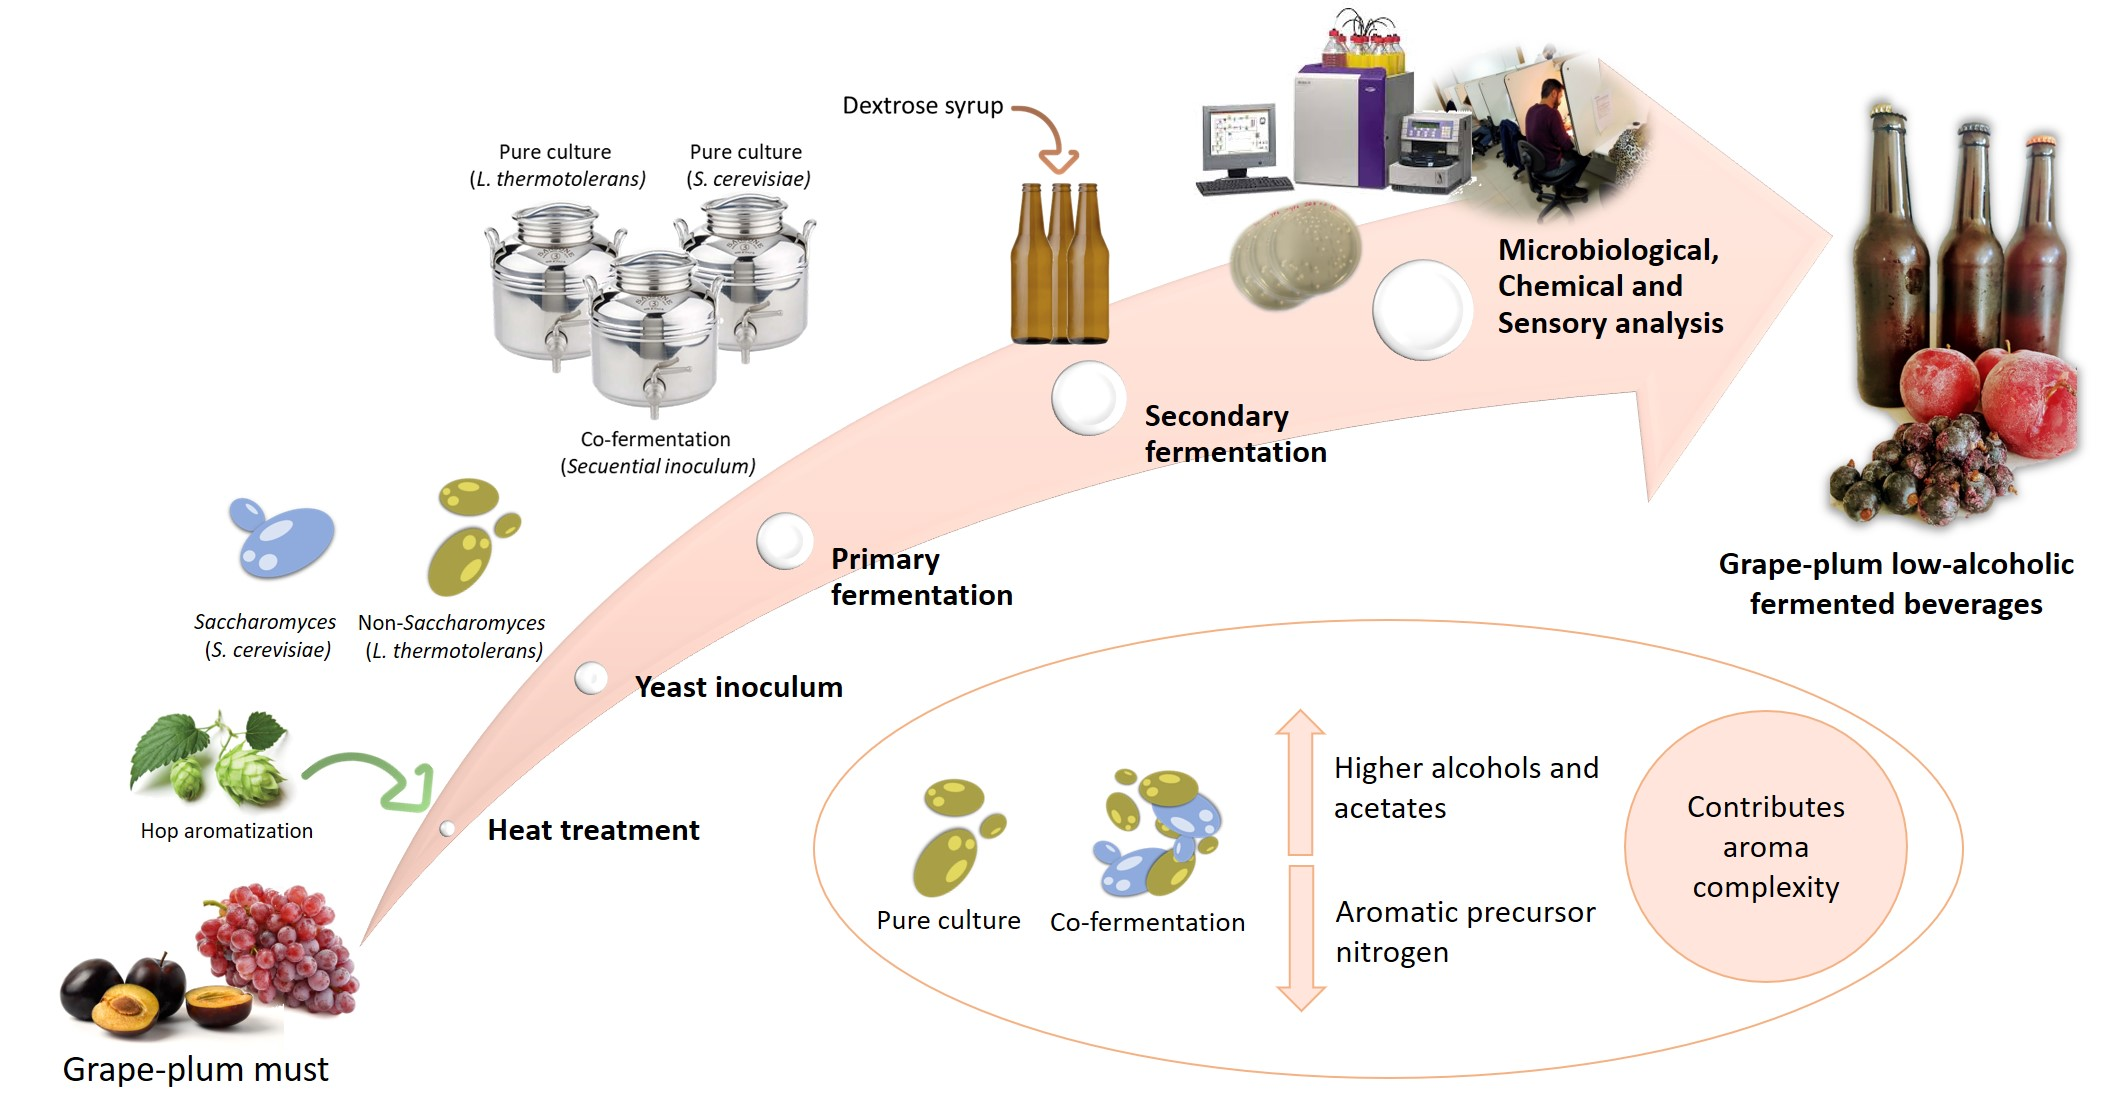
2.2. Preparation of Samples and Pure and Co-Inoculated Fermentation Process

Laboratory-scale alcoholic fermentation trials were made using grape (Red Globe) and plum (Black Kat) juice. A total of 25 kg of grapes (25 kg of each variety) were mechanically crushed and de-stemmed (Micra/15, Agrovin, España). Grape pomace was subjected to three pressing cycles (2 bar for 2 min per cycle) using a hydropneumatic vertical press (40 L, 1.5 bar, Prosinox, Jerez de la Frontera, Spain) to obtain grape juice. Plums (40 kg) were subjected to a mechanical pitting process using a pitting machine (Chaconsa, Murcia, Spain) and were pressed under the same condition as grape pomace to obtain plum juice. Grape and plum juices were mixed in a 1:2 ratio in a 50 L stainless steel tank. Subsequently, the fruit juice was diluted by mineral water (Los Riscos, Badajoz, Spain) to obtain a fermentable must density suitable (1.040 g mL−1) for obtaining a probable alcoholic strength of approximately 5% (v/v) in the fermented beverages. The must obtained was subjected to a heat treatment up to boiling (100 °C). Subsequently, it was aromatized with the addition of 1.5 g L−1 of hops (Cascade, 6.7% alpha-acids) and they were kept boiling for 30 min. Then, hops were removed and the heat-treated must was subjected to a rapid cooling process in a cold tunnel (−20 °C for four hours). Later, it was homogeneously distributed in 9 stainless steel tanks of 5 L capacity, previously disinfected with ethanol (96%). Table 1 shows the physicochemical composition of plum and grape must before primary fermentation (F1).
Three types of experimental micro-fermentations were performed as follows (all in triplicate), inoculating with the two commercial yeast strains that were rehydrated and inoculated according to the manufacture indications (Figure 1): (a) SC: fruit must inoculate with a pure culture of Saccharomyces cerevisiae yeast at a dose of 30 g hL−1. (b): LT: fruit must inoculate with a pure culture of Lachancea thermotolerans yeast (30 g hL−1). (c) MIX: fruit must co-inoculate, initially with L. thermotolerans yeast (20 g hL−1) and after 72 h, inoculated with S. cerevisiae yeast (10 g hL−1). Primary alcoholic fermentation process (F1) was carried out at 18 °C in a temperature-controlled cold room and was monitored daily, measuring density and temperature using a digital density meter (DMA 35, Anton Paar, Austria). The process was completed when the value of the density of the fermented remained constant for 72 h. Then, they were stored in a thermostatic chamber at a temperature of 4 °C for 1 week to promote the stabilization and fining process. After this time, dextrose syrup at a dose of 7 g L−1 was added to each of the obtained fermented and then subjected to a “champagne-type” process with a secondary fermentation (F2), performed with the cells remaining in suspension after the natural fining process, in amber bottles of 330 mL volume capped with crown caps in a thermostatized chamber at a controlled temperature of 18 °C for one month. Subsequently, they were stored at 4 °C until analysis.

2.3. Microbiological Analysis

During the primary and secondary fermentation process, samples were taken aseptically from the musts/beverage with prior shaking to resuspend the settled microorganism cells in the bottom. Yeast populations were measured by plating, after serial dilutions, in YPD (1% yeast extract, 2% peptone, 2% glucose, and 2% agar) (detection of molds and yeasts) supplemented with chloramphenicol (0.1 g L−1). Colonies were counted after incubation at 28 °C for 48–72 h. On the other hand, at the end of the primary and secondary fermentations, direct seeding was performed in GYC medium (Condalab, Spain) for the detection of acetic acid bacteria; SPS medium (Condalab, Spain) for the detection of Clostridium perfringens; and MYP medium (Condalab, Spain), supplemented with egg yolk tellurite emulsion, for the detection of Bacillus cereus. Counts were made after incubation at 37 °C for 48–72 h.

2.4. Must and Fermented Beverages Chemical Analysis

2.4.1. General Parameters

Fermentable fruit must was analyzed for total soluble solids (TSS, °Brix) by refractometry (ATR ST plus, Schmidt + Hansch, Berlin, Germany). In must/fermented beverages pH and titratable acidity (TA, g L−1 malic acid) (Crison Micro pH-meter, Barcelona, Spain) were determined according to the official methods of the OIV [19]. The content of tartaric acid (TH2, g L−1) was determined by spectrophotometry method [20,21]. Malic (MH2, g L−1) and lactic acid (LH2, g L−1) were determined using the enzymatic method [20,22]. All determinations were carried out in a Y15 autoanalyzer (Biosystems, Barcelona, Spain). Fermented beverage ethanol (% v/v) and volatile acidity (VA, g acetic acid L−1) were analyzed according to OIV methods [19] by an automatic distiller (P Selecta DE-1626, Barcelona, Spain) and residual reducing sugars (g L−1) were quantified by spectrophotometric (UV visible Genesys 10S UV-Vis, Thermo Scientific, Waltham, MA, USA) according to [20,22].

2.4.2. Phenolic Content and Chromatic Characteristics

Total phenolic content (TP, mg gallic acid L−1) was determined by the reaction with Folin–Ciocalteu reagent [23] (Singleton y Rossi, 1965) and anthocyanins (AN, mg malvidine-3-glycoside chloride L−1) were determined following the pH difference method described by Lee et al. [24]. Both determinations were performed in a Y15 autoanalyzer (Biosystems, Barcelona, Spain). Color intensity (CI) was calculated as the sum of absorbance at 420, 520, and 620 nm, and color hue (CT) as the ratio of the absorbance at 420 nm and 520 nm [25]. The CIELAB coordinates lightness (L*), chroma (C*ab), hue angle (hab), red−greenness (a*), and yellow−blueness (b*) were determined according to Ayala et al. [26] and the data were processed with the MSCV (Simplified Wine Color Method) software. Absorbance measurements for phenolic and chromatic determinations were taken using a UV-visible spectrophotometer (Thermo Fisher Scientific, Waltham, MA, USA) with data system control software.
The following phenolic indices (expressed as u.a) were determined, after previous dilution of the beverages with distilled water (1:10), according to Andres-Lacueva et al. [27]:
Total hydroxycinnamic acid index (THA): estimated from the absorbance at 320 mn by the equation:
THA = (A320 − 1.4)
Total flavonoid compounds index (TFI): estimated from the absorptions at 280 and 320 mn by the equation:
TFI = (A280−4) − [0.66 × (Abs320 − 1.4)]

2.4.3. Total Antioxidant Activity

Total antioxidant activity (TAA) was quantified by the DPPH assay (TAADPPH) [28]) and by the ABTS assay (TAAABTS) [29]. The TAADPPH method, based on the stability of the 1,1-diphenyl-2-picrylhydrazyl radical (DPPH), gives the sample a violet coloration characterized by an absorption band, in ethanolic solution, centered around 515 nm. The TAAABTS is a kinetic method using ABTS (2,2′-Azino-Bis-3-Ethylbenzothiazoline-6-Sulfonic Acid) as a reagent. Both methods were calibrated using a Trolox calibration curve (1–0.1 mmol Trolox). The results are presented as the content of Trolox equivalents (TE) per liter of the sample (mmol TE L−1), as the average of three replicates.

2.5. Determination of Amino Acids in Musts and Fermented Beverages

The amino acids, ammonia, and nitrogen substances were separated and quantified by ion exchange chromatography (HPLC), followed by post-column ninhydrin derivatization and photometric detection (at 440 nm for Pro and Hyp, and at 570 nm for the rest of the amino acids) using a Biochrom 30 series amino acid analyzer (Biochrom Ltd., Cambridge Science Park, England) [30]. Samples were deproteinized by the addition of sulfosalicylic acid (2.5% w/v) (PA Panreac, Barcelona, Spain) and kept at 1 h at 4 °C and then centrifuged at 14.000 rpm for 5 min (Microfuge JOUAN A14, Italy). The supernatant was filtered (0.2 μm, Millex-GV; PVDF, 33 mm diameter, Merck Millipore, Germany) and chromatographic analysis of the sample was performed. Separation was performed in an ion exchange column, using lithium citrate buffers of different concentrations (0.2 M; 0.3 M; 0.5 M; 0.9 M; 1.65 M) as eluents. The amino acids and ammonium compounds were identified according to their elution order and by comparison with the retention times of the available commercial standards (Sigma-Aldrich Ref. A6407/A6282, St. Louis, MO, USA). For quantification, chromatograms were extracted at 570 nm and 440 nm (hydroxyproline and proline), and the calibration graphs of the respective standards (R2 > 0.999) were used.
From the concentrations of the individual amino acids and ammonium, the following nitrogenous indices were calculated [31]:
Total amino content (TAC, mg L−1).
Free amino nitrogen (FAN, mgN L−1): calculated as the sum of the nitrogen concentration of all quantified free amino acids.
Yeast assimilable nitrogen (YAN, mgN L−1): calculated as the exclusion of the concentration of nitrogen contributed by hydroxyproline and proline amino acids from the FAN value and the sum of the concentration of nitrogen contributed by the ammonium ion.
Aromatic precursor nitrogen (APN, mgN L−1): calculated as the sum of the nitrogen concentration contributed by the amino acids’ aspartic acid (Asp), isoleucine (Ille), leucine (Leu), threonine (Thr), tyrosine (Tyr), and valine (Val).
Sulfur amino nitrogen (SAN, mgN L−1): calculated as the sum of the nitrogen concentration contributed by the amino acids’ taurine (Tau), cysteine (Cys), and methionine (Met).
Amines (AM, mgN L−1): calculated as the nitrogen concentration contributed by the amino acid ethanolamine (Ethan).

2.6. Analysis of the Volatile Compounds by GC-MS

Concentrations of fermented beverage volatiles were determined by gas chromatography (GC) as described by Rodrigues et al. [32]. Higher alcohols, volatile fatty acids, ethyl esters of fatty acids, acetates of higher alcohols, and terpenes were extracted with SPME, using a 1 cm-long fiber and 65 μm film of polydimethylsiloxane/divinylbenzene (PDMS/DVD) with Stable Flex, purchased from Supelco (Bellefonte, PA, USA). The analysis was performed by incubating the samples at 60 °C for 60 min. Subsequently, the volatiles were thermally desorbed in the injection port for 15 min at 250 °C. Compound separation was performed on a 30 m, 0.25 mm, 0.25 µm VF-5MS column. The analysis starts at 45 °C for 1 min passing to 200 °C at a rate of 5 °C/min and then maintaining this temperature for 5 min. Finally, the temperature is raised to 250 °C at a rate of 20 °C/min and maintained for 5 min. The recording was carried out with full scan and the identification of the compounds was performed by using the NIST Mass Spectral library. The quantification was according to the absolute peak area for each compound.

2.7. Sensory Analysis

Sensory analysis of the bottled beverages was carried out after five months of refrigeration. The tasting panel consisted of eight tasters (5 males, 3 females); previously, the tasters had signed an informative document on the future use of the data obtained. Beverages were brought into the sensory laboratory at least 24 h before testing and kept refrigerated (8 °C) in order to maintain the consumption temperature of this type of beverage. The tasting session took place in the tasting room of the Instituto Tecnológico Agroalimentario de Extremadura (INTAEX), which complied with ISO 8589:2010 [33] standards. Beverages (20 mL/tasting glass) were evaluated in triplicate and presented in random order at 8 ± 2 °C and coded with 3-digit random numbers. The sensory evaluation took place in one session including nine beverage samples. Beverages were presented one at a time under incandescent light and data were collected on paper ballots. Four visual descriptors (color intensity, salmon color hue, cleanliness, and sparkling persistence), four aroma descriptors (frankness, aromatic intensity, intensity of fruity aroma, and intensity of floral aroma), and four flavor-by-mouth descriptors (alcoholic, acidity, sweetness, and bitterness) were chosen to describe the beverage. Each panelist also evaluated the overall impression. A scale of 1 to 10 to rate the intensity of each attribute was used.

2.8. Statistical Analysis

A statistical analysis of variance test (ANOVA) was performed, taking the different parameters analyzed as dependent variables and the different experimental treatments as explanatory variables. When the difference between the values of the means was significant, a comparison of means test was performed using Tukey’s method (univariate analysis), which determines the minimum difference between the means of each group for it to be statistically significant (p < 0.05). A principal component analysis (PCA) was performed using the values of the physicochemical parameters in which significant differences were found after ANOVA together with those corresponding to the results obtained in the sensory analysis of the processed beverages. All statistical analyses were performed using XLSTAT software (Addinsoft, Paris, France).

3. Results and Discussion

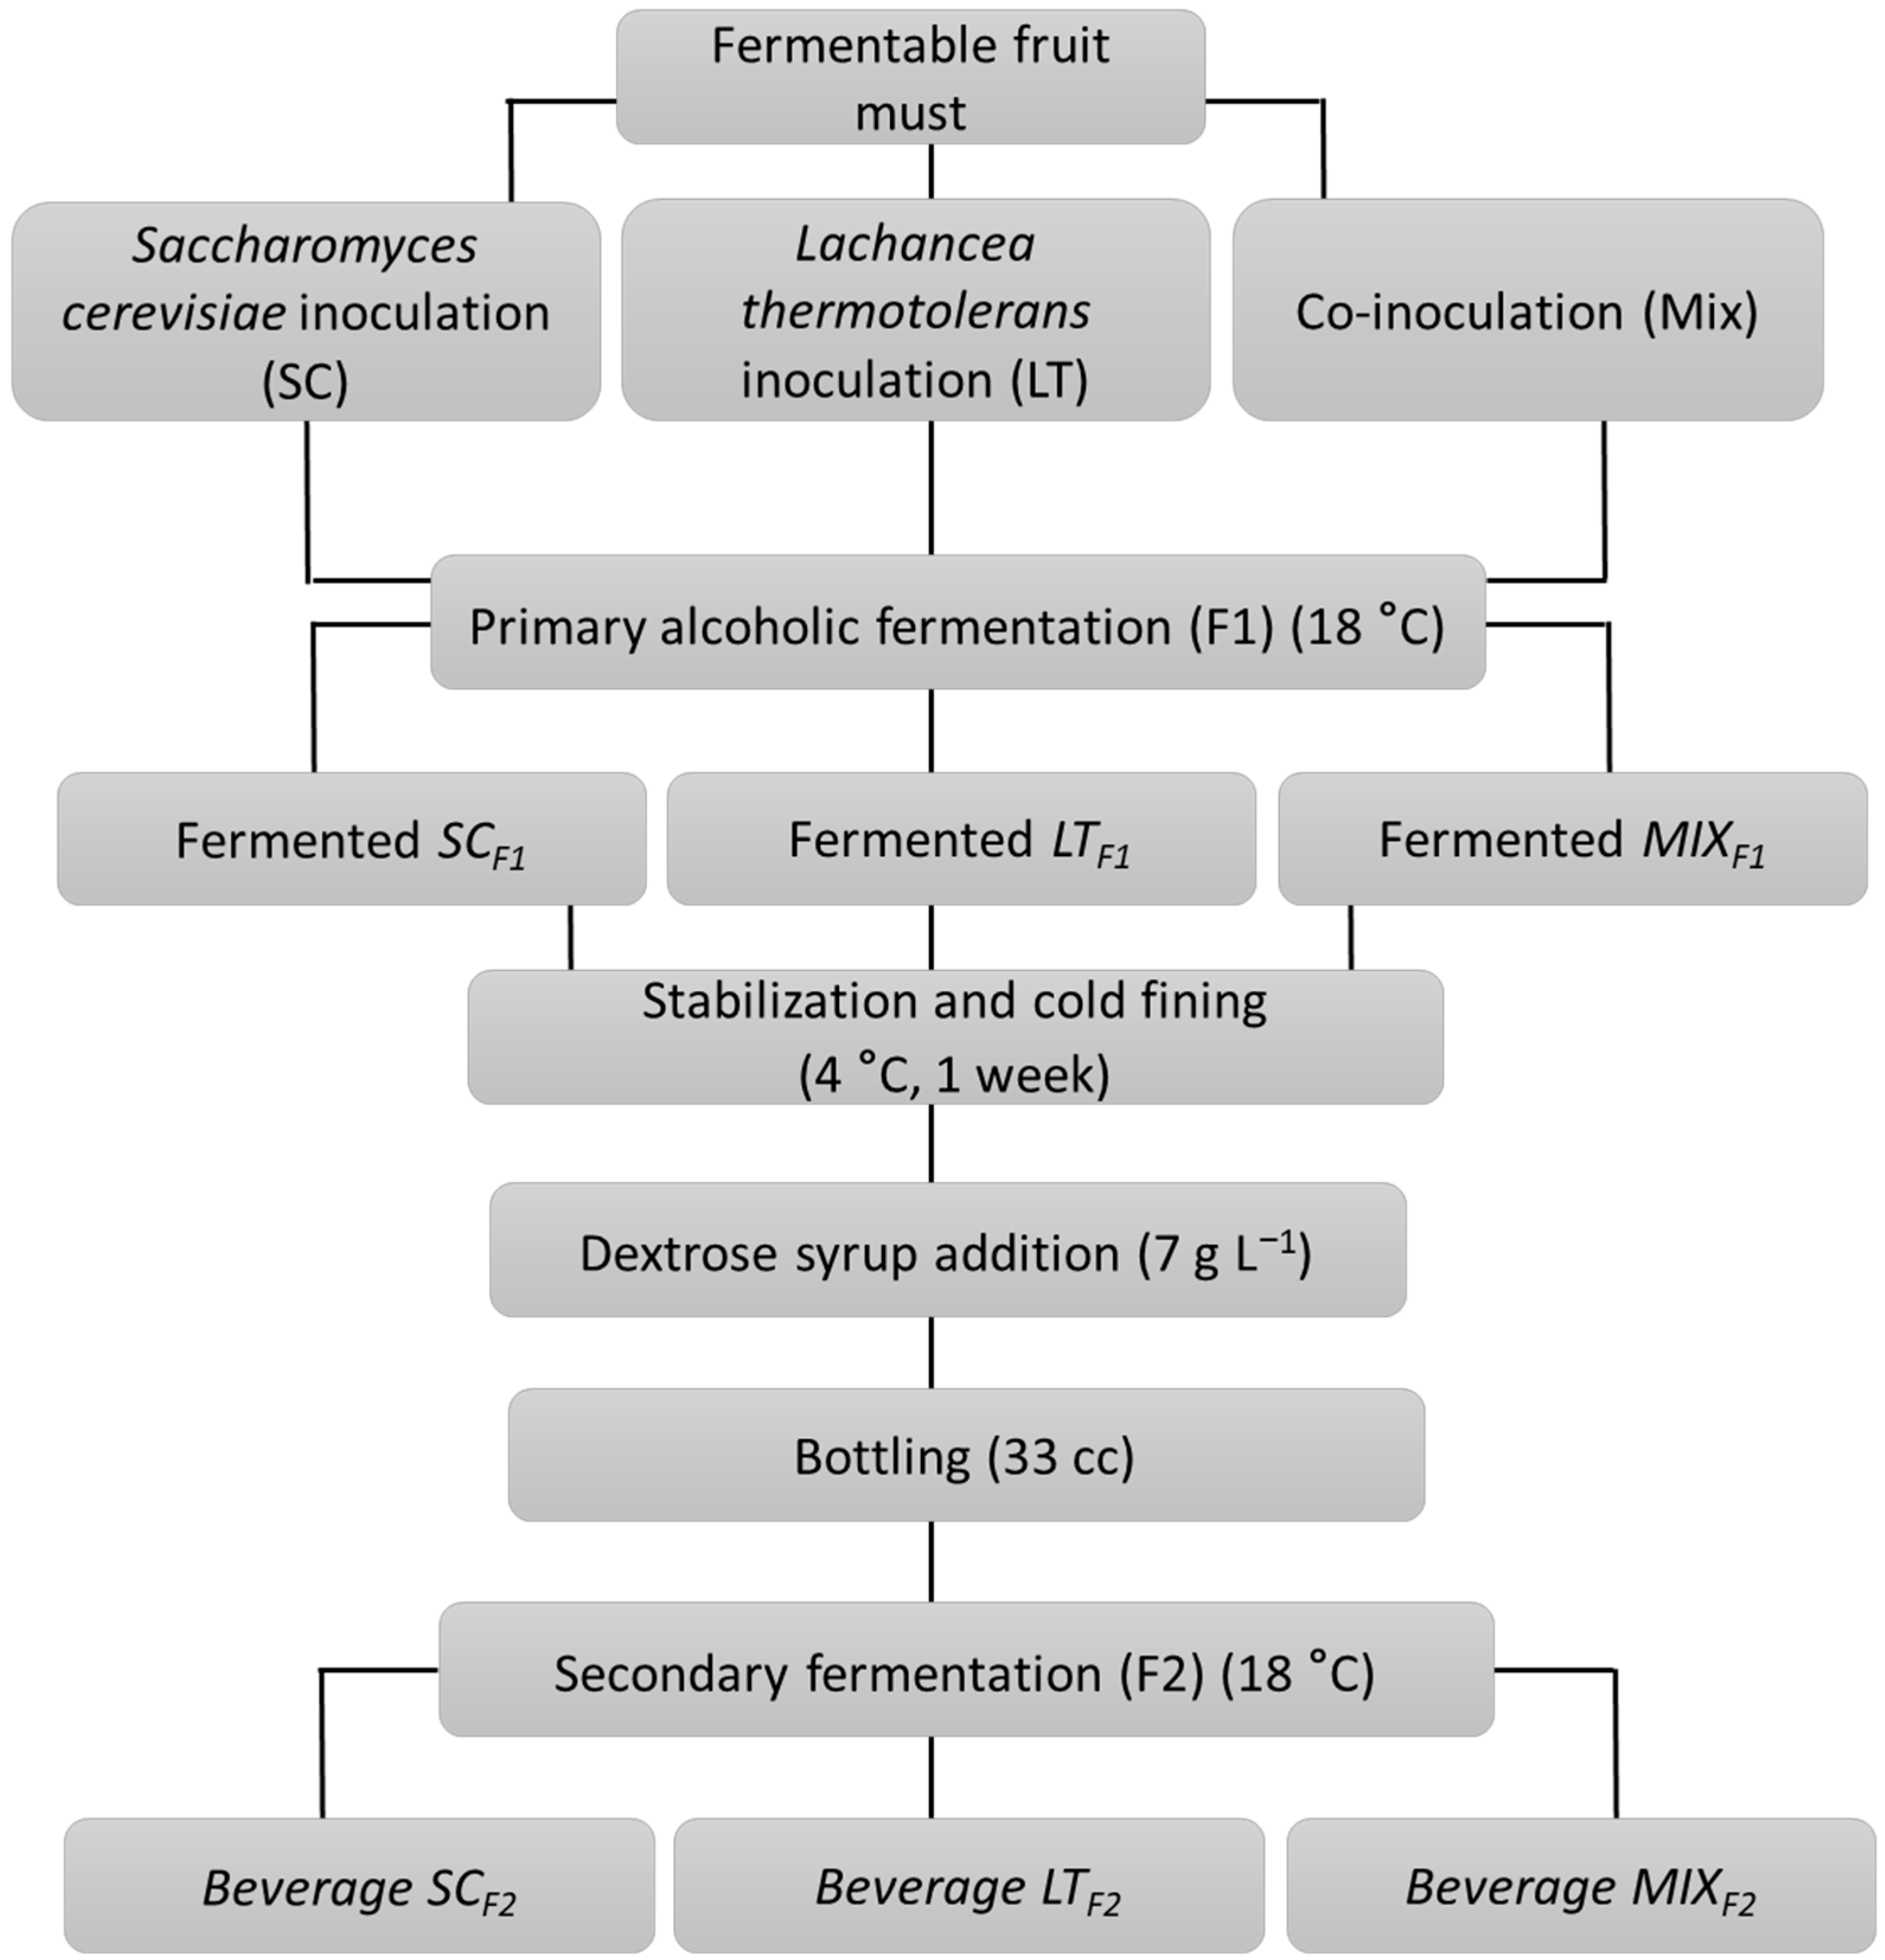
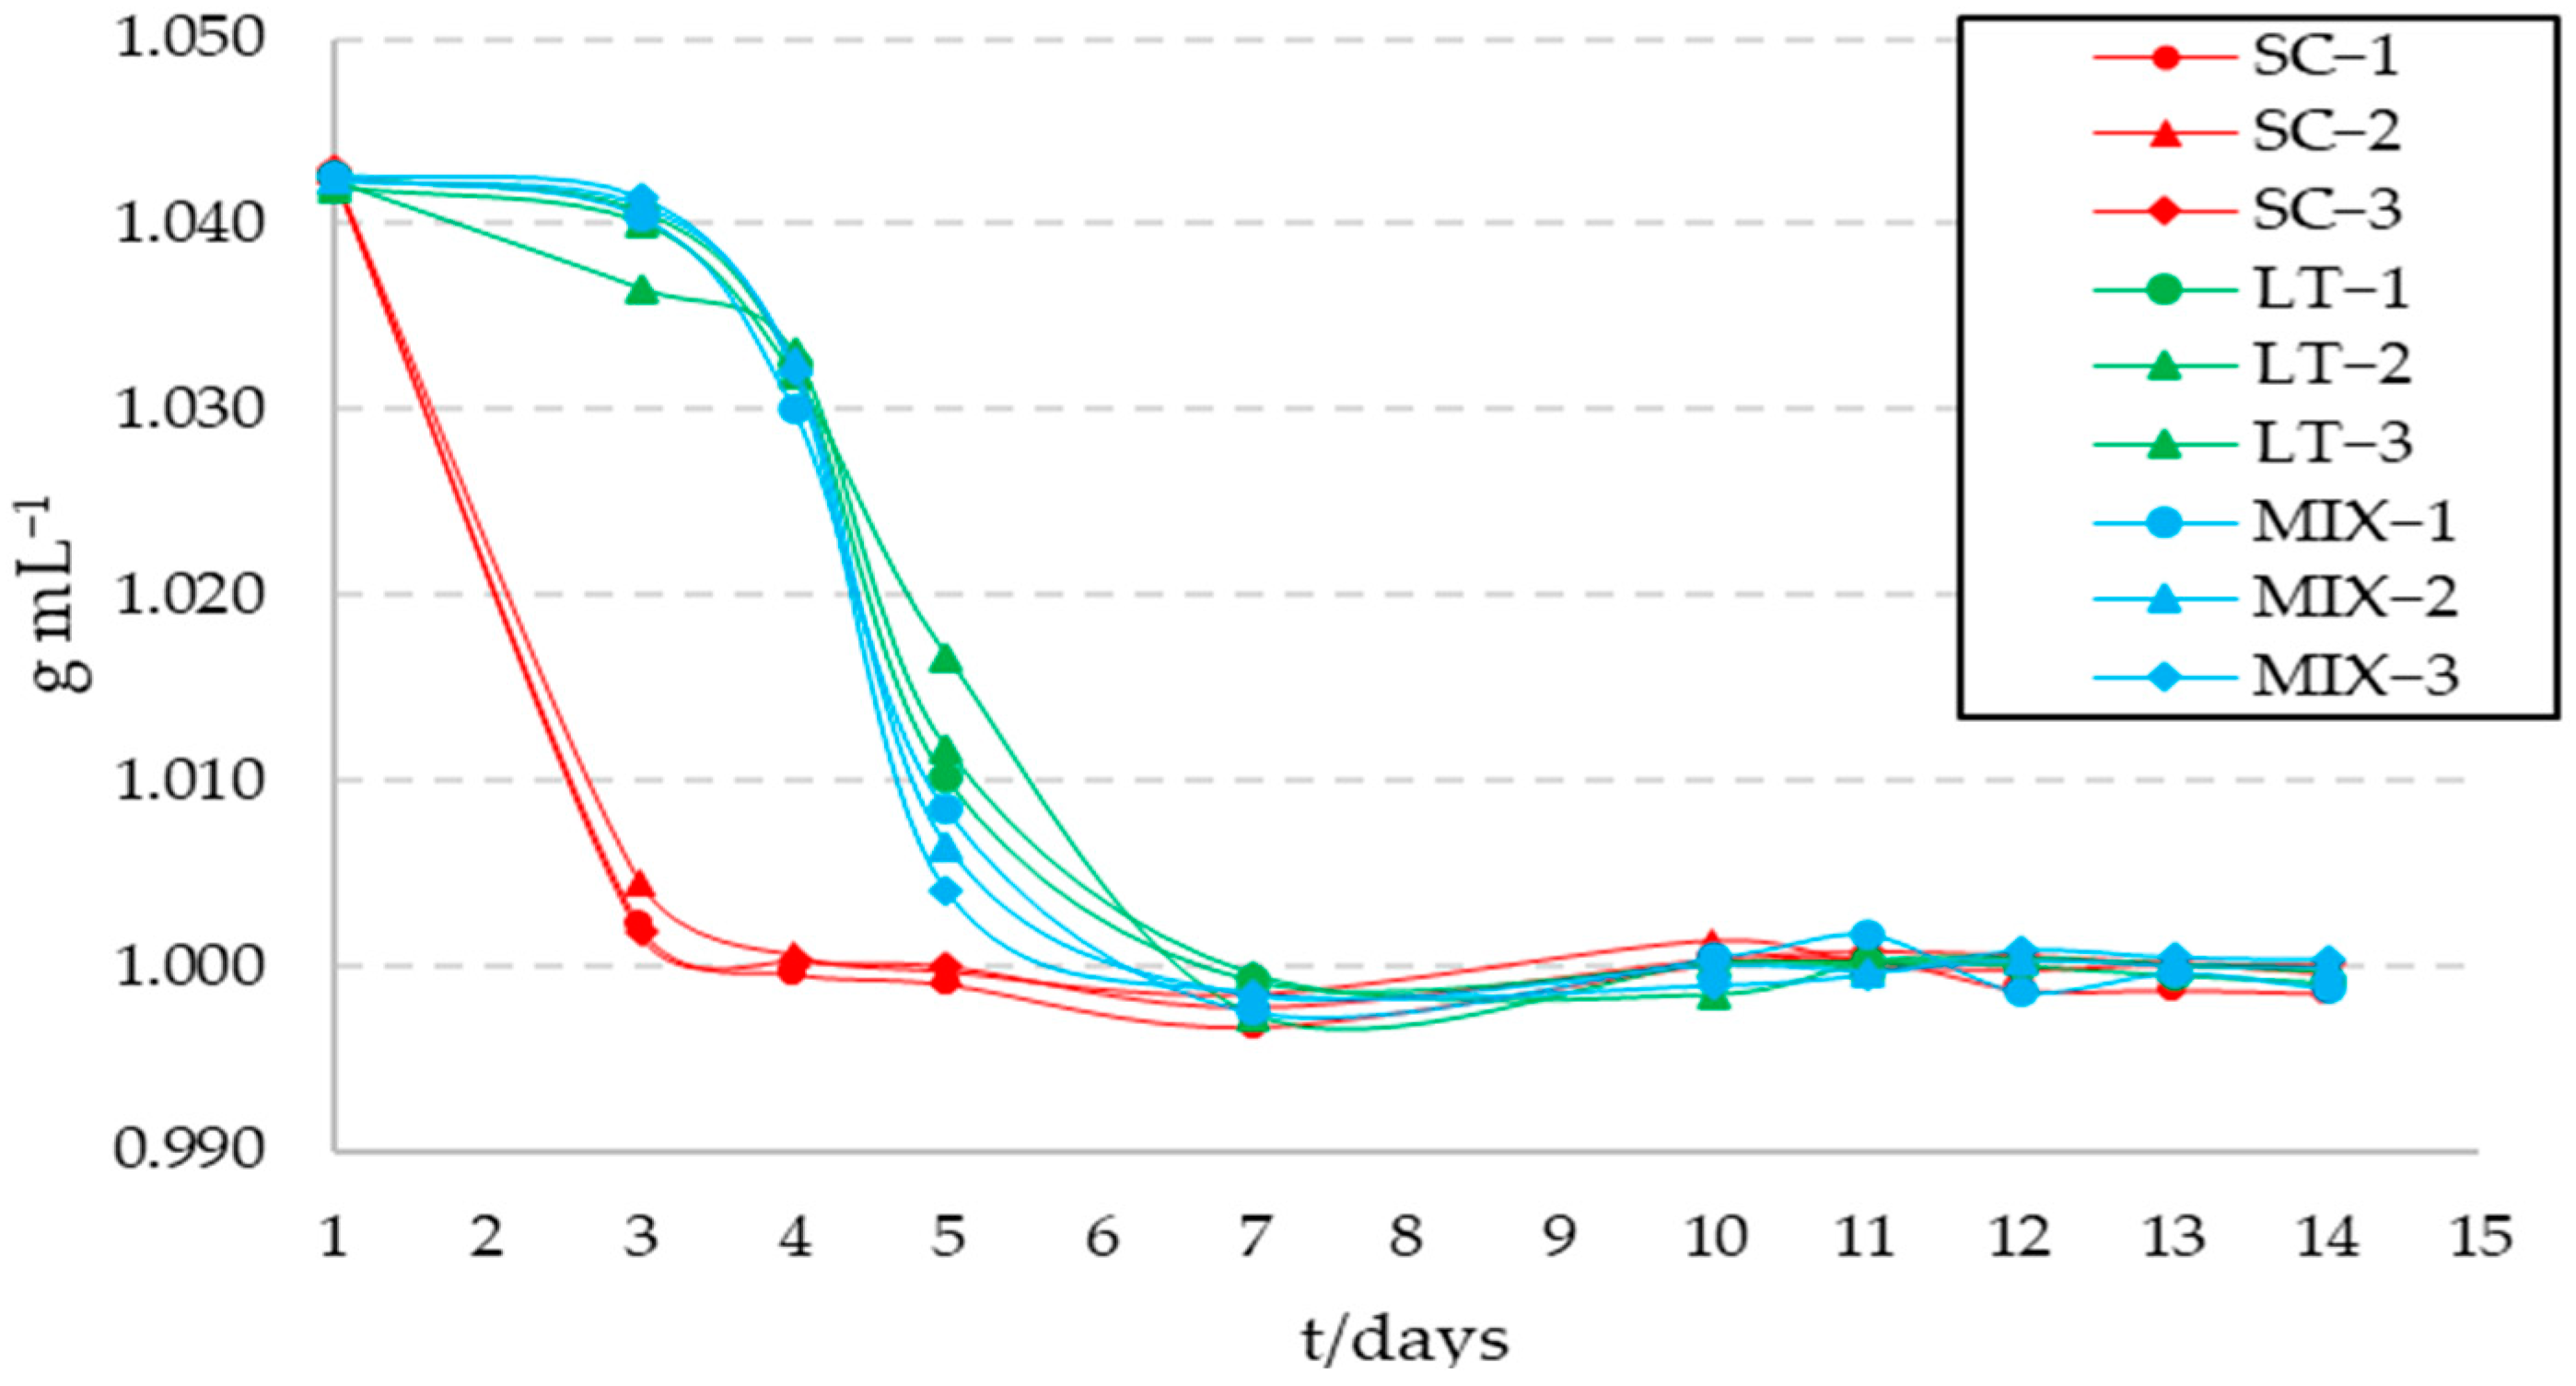
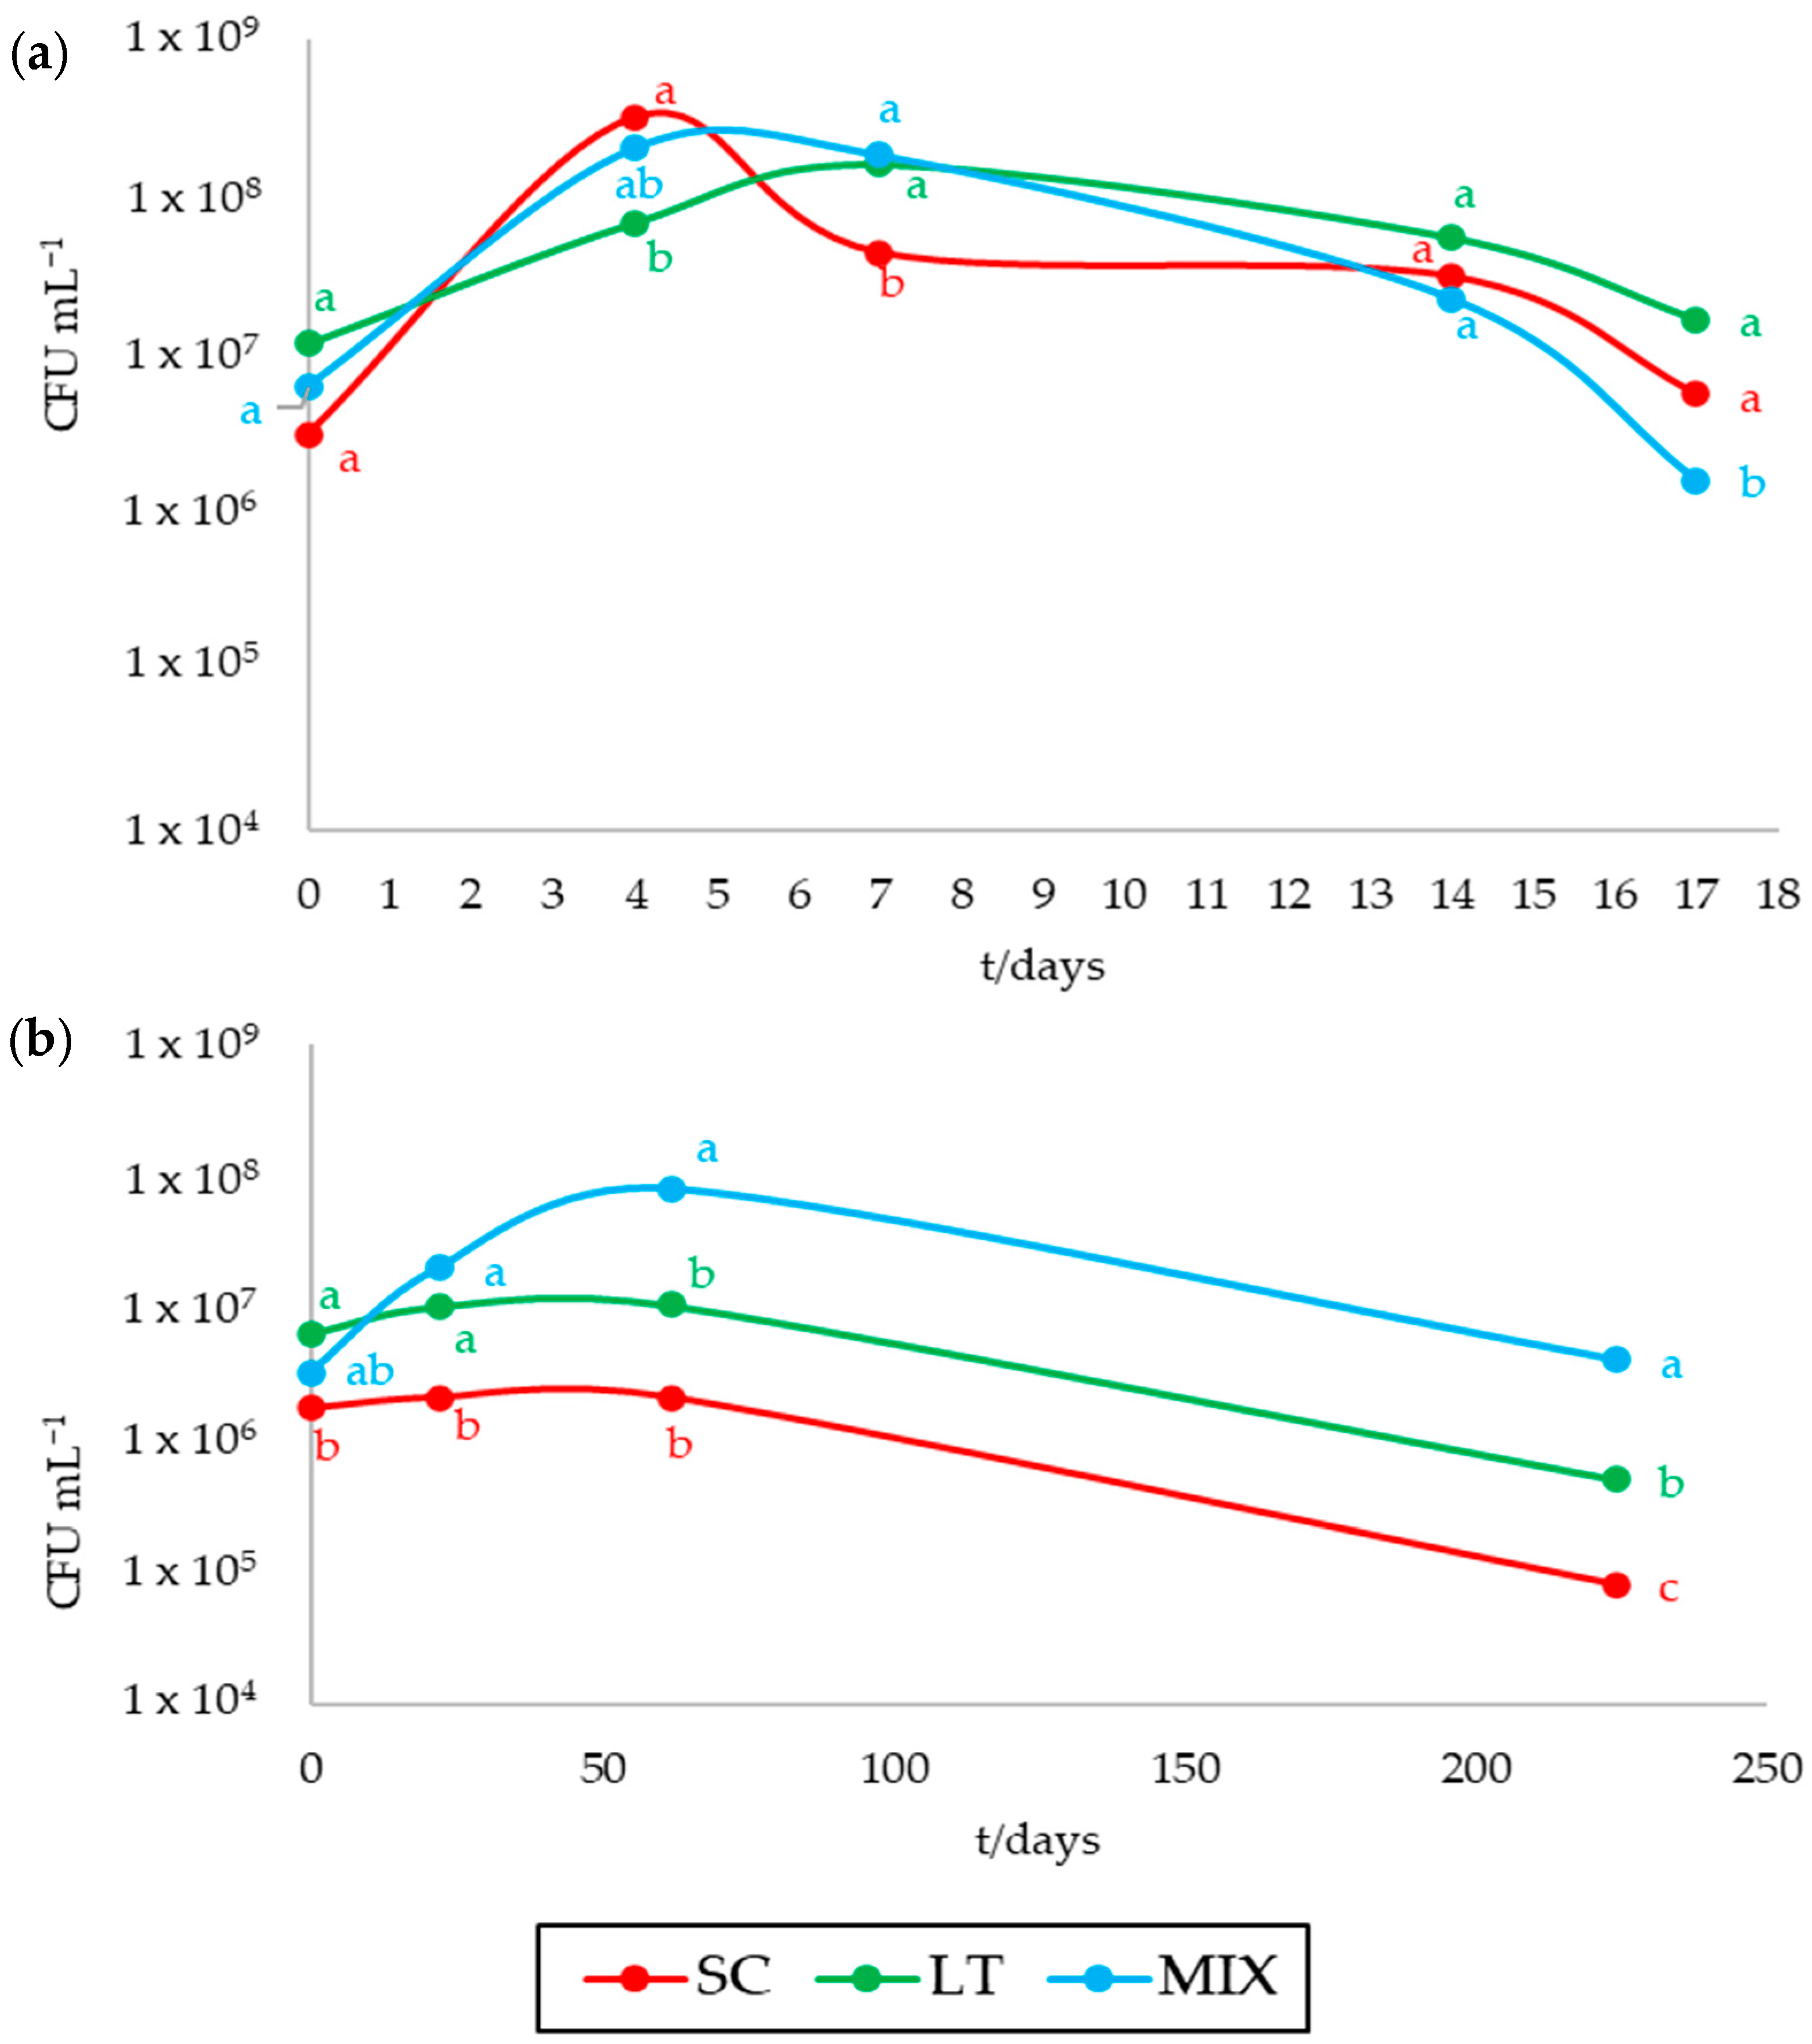
3.1. Fermentation and Microbiological Parameters

Fermentation Dynamics Control

The fermentation of the 5 L steel tanks was monitored for 14 days to evaluate the fermentative kinetics. Figure 2 shows the evolution of the density during alcoholic fermentation. Fermentation kinetics were affected by the different inoculum strategies. The S. cerevisiae yeast strain showed the fastest fermentative kinetics (red lines, Figure 2). Compared to S. cerevisiae, must inoculated with L. thermotolerans (LT and MIX, green and blue lines, respectively) required four more days to reach values of density close to 1 g mL−1. This could have been caused by the higher adaptability of the SC strain to the fermentation conditions. The fermentation dynamics presented by the musts of the LT and MIX treatments were similar in the first three days. From the fourth day, LT treatment showed a slower dynamic compared to the MIX treatment. Fermentations were considered finished at day 17. These findings correspond to previous reports for L. thermotolerans in mixed-culture fermentations [14,15,34,35]. The values of density released for day seven of the process for all samples began to stabilize. Among treatments, the fermentation rate was variable depending on the yeast strain used.
The fast fermentation speed of S. cerevisiae yeasts during the first days of the process was similar to the situation described by Porter et al. [34] working with two yeasts, L. thermotolerans (Concerto and Y940) and S. cerevisiae using synthetic grape juice. In that study, in monoculture fermentations, Lachancea spp. strains displayed considerably lower fermentation rates than S. cerevisiae and became sluggish towards the middle of the fermentation. Additionally, Balikci et al. [35], found that wine fermentation carried out with pure cultures of S. cerevisiae and with mixed cultures of S. cerevisiae and L. thermotolerans showed a faster rate of sugar consumption than those performed with pure cultures of L. thermotolerans. Similar results were obtained by Gobbi et al. [14] using pure, mixed, and sequential inoculations employing yeasts of these same species.
Figure 3a shows the development of different yeast strains during alcoholic fermentation (F1). The initial yeast strain count was around 106–107 CFU mL−1 for the three types of fermentations. The total yeast cell concentration in SC treatment started to decrease after 7 days of fermentation, consistent with the kinetics results shown above. In LT and sequential fermentation (MIX), yeast count values did not change significantly during the first 7 days. After that, the population of SC, LT, and MIX decreased to a minimum of 106–107 CFU mL−1 at the end of fermentation (day 17). These growth patterns agree with previous reports of pure culture fermentations with S. cerevisiae and L. thermotolerans [10,13,14].
Figure 3b shows the evolution of the yeast concentration during the second fermentation in the bottle (F2). The results obtained in this fermentation were slightly different from those of the first fermentation. These results revealed that the beverages from the MIX treatment showed clear yeast growth; however, yeast counts in the SC and LT treatments remained stable. The higher growth of the beverages made from the sequential inoculum in the primary fermentation could be due to a synergy between the different yeast strains and thus grow more, or also autolysis of the yeasts releasing nutritional compounds that favor the development of other yeasts [36,37].
At the end of the primary and secondary fermentations, the presence of different bacteria (acetic acid bacteria, Clostridium perfringens, and Bacillus cereus) was analyzed. In both phases, a total absence of these microorganisms was observed (data not shown).

3.2. Chemical Analysis of Processed Beverages

3.2.1. General Oenological Parameters

Table 2 shows the results of the analysis of the chemical composition of the beverages fermented with the selected yeast strains. After primary fermentation (F1), the alcohol content in the beverages ranged from 5.27% to 5.34% (v/v). Secondary fermentation in bottle (F2) resulted in a total increase of about 0.3–0.4% in the alcohol content of the final beverage. Despite the differences found in the yeast growth kinetic, no significant differences were observed in the volume of ethanol produced using different yeast strains. The slower growth of L. thermotolerans during the F1 fermentation does not seem to influence its ethanol yield, reaching similar alcohol production to S. cerevisiae yeasts. In contrast, Zdaniewicz et al. [38], comparing the use of pure cultures of L. thermotolerans and S. cerevisiae in brewing fermentations, observed lower ethanol contents in beers fermented using L. thermotolerans. The level of alcohol in fermented fruit beverages depends on many factors, including the variety and ripeness of fruits [39], or the number of fruits used in the production process [40]. From the point of view of using L. thermotolerans when producing fermented beverages with reduced alcohol content, resistance to a high concentration of alcohol is not the key criterion and its use can be a positive factor [16,41,42].
The fermentation processes practically did not alter the pH and tartaric acid values of the different beverages compared to the must before fermentation (Table 1), although a slight decrease in the malic acid concentration was observed after F1, as well as an increase in its total acidity, mainly after F2 (Table 2). The use of L. thermotolerans resulted in lower levels of total acidity compared to SC; this agrees with previous studies [10,13,14,15,43]. The highest concentration of malic acid was present in the LT treatment (4.5 g L−1). This result is contradictory to those reported in other studies, which indicate a slight degradation of malic acid by LT [10,14]. At the end of F2, SC treatment beverages had the highest titratable acidity value as well as a slightly higher concentration of tartaric acid compared to the rest of the treatments. Several studies have reported lactic acid production and low acetic acid concentrations in wine when L. thermotolerans is involved [10,13,14,15,16,44]. A small concentration of lactic acid in the analyzed strain contradicts these studies and no significant differences were observed for volatile acidity depending on the type of yeast used.

3.2.2. Total Concentration of Phenols, Chromatic Characteristics, and Antioxidative Properties

At the end of primary fermentation (F1), a significant increase in total phenolics content and color hue was observed in fermentations with L. thermotolerans (MIX and LT), compared to SC (Table 2). After secondary fermentation (F2), a decrease in hue angle and color hue was observed in MIX. In contrast to our results, previous studies have reported a significant increase in higher final levels of anthocyanins [45,46,47] and in color intensity [17] in sequential fermentations of L. thermotolerans with S. cerevisiae compared to inoculated with pure cultures of S. cerevisiae.
The statistical analysis of results achieved with the DPPH and ABTS methods showed no significant differences in the antioxidative capabilities of beverages manufactured with the selected yeast strains.

3.3. Results of the Detailed Amino Acid Profile

Nitrogen compounds play an important role in the production of alcoholic beverages. According to different research, YAN values higher than 150 mg N L−1 are necessary for yeasts to carry out the complete fermentation of sugars present in grape musts [48,49]. Although initial YAN values observed in the must (Table 1) were slightly lower than the recommended value, they were sufficient for adequate fermentation of the musts from the different treatments (Figure 2). Table 3 shows the amino acid content of the three types of beverages after the primary (F1) and secondary fermentation (F2) of the different beverages. No differences in YAN consumption due to the use of different yeast starter cultures were observed. In the study developed by Roca-Mesa et al. [50], in which nitrogen preferences during alcoholic fermentation of different non-Saccharomyces yeasts in synthetic must were evaluated, they observed that S. cerevisiae and T. delbrueckii showed similar nitrogen consumption, depleting nitrogen in 48 h, whereas L. thermotolerans showed different rates depending on the nitrogen composition of the medium. S. cerevisiae and L. thermotolerans, both pure and sequential cultures, consumed all ammonium (below 2 mg N L−1 remaining).
In F1, significant inter-treatment differences were only observed in the case of sulfur amino nitrogen (SAN) (p < 0.05), showing the highest values in SC compared to the rest of the treatments. However, after F2, significant inter-treatment differences were observed in most of the parameters analyzed. The amines presented significant differences; LT beverages had the lowest values. Histidine also presented significant inter-treatment differences (p < 0.05), with the SC beverages showing the highest values. The highest levels of aromatic precursor nitrogen (APN) and SAN were obtained in the SC fermentation. Related to individual amino acids, SC treatment had higher final levels of histidine, phenylalanine, isoleucine, lysine, methionine, threonine, valine, and cysteine. Higher final levels of amino acids such as leucine, isoleucine, and threonine are often related to a decrease in the production of higher alcohols, such as 3-methylbutanol and 2-methylbutanol [16]. The highest concentration of arginine was found in MIX fermentations. In a study that evaluated the quality and composition of white wine fermented using L. thermotolerans and S. cerevisiae [16], higher amounts of histidine, glycine, and leucine were reported in S. cerevisiae pure culture and mixed fermentation of S. cerevisiae and L. thermotolerans, compared to the sequential fermentation of these strains. However, higher levels of alanine, lysine, and serine were obtained in the sequential fermentation. The lower concentration of histidine (precursor of biogenic amine) found in our LT and MIX fermentations could be considered positive, contributing to reducing the potential risk of histamine formation by bacteria. In addition, Benito et al. [16] found that L. thermotolerans did not produce higher levels of biogenic amines than S. cerevisiae.

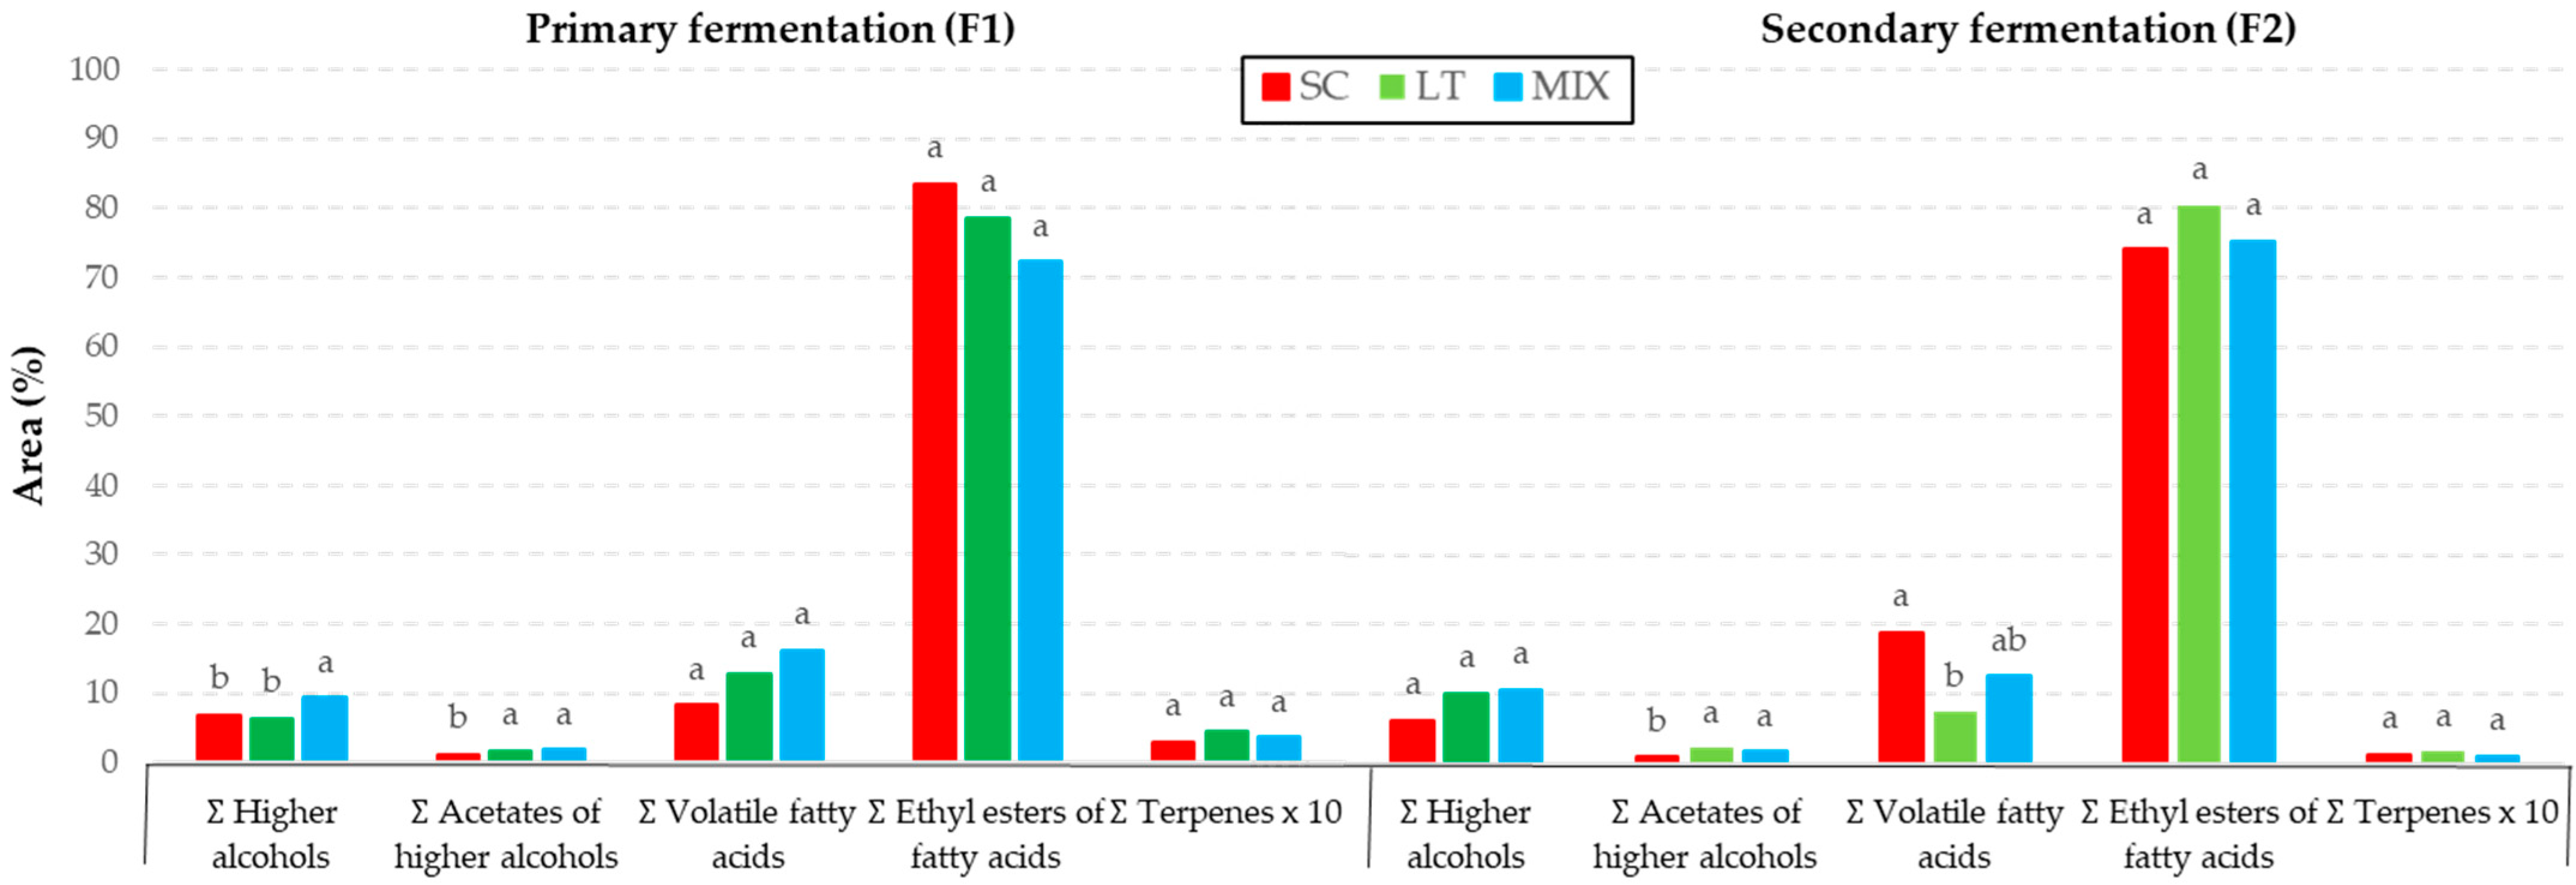
3.4. Volatile Beverage Compounds

A total of twenty-one volatile compounds were quantified. The main compounds that influence the aroma of alcoholic beverages are esters, higher alcohols, terpenes, acids, and so on [51]. Figure 4 shows percentages of volatile compounds grouped by families (higher alcohols, acetates of higher alcohols, volatile fatty acids, ethyl esters of fatty acids, and terpenes) analyzed after the primary (F1) and secondary fermentation (F2). Regardless of the experimental treatment and sampling time, the main family of compounds in the beverages was ethyl esters. In F1, different yeast starters induced changes in the percentage of higher alcohols and acetates of higher alcohols, whereas in F2, this change was observed in acetates of higher alcohols and volatile fatty acids. After F1, compared with SC, MIX treatment showed a higher percentage of higher alcohols and acetates, whereas LT also showed an increase in the production of acetate esters. After secondary fermentation in bottle (F2) the same trend was observed in the production of higher alcohols and acetates observed in F1, although significant differences were only observed in the case of the latter family. The value of the percentage of volatile fatty acids also showed significant differences, with SC beverages showing the highest values and LT the lowest, whereas the MIX treatment showed intermediate values between these two treatments. In the work of Comiti et al. [13], an increase in the concentration of higher alcohols was also observed compared to sequential fermentations of L. thermotolerans and S. cerevisiae to a pure culture of S. cerevisiae.
Higher alcohols, represented by three compounds, showed differences between treatments in F1 but not in F2 (Table 4). The most prevalent higher alcohol in all of the beverages was 3-methyl-1-butanol (isoamyl alcohol), followed by 2-phenylethanol. MIX treatment increased 3-methyl-1-butanol and 2-methyl-1-butanol, related to burnt, alcohol, nail polish, whiskey [52], and malt aroma [53], respectively. This result may be due to the lower concentration of amino acid precursors of higher alcohols found in this treatment mentioned above. In the work of Comitini et al. [13], mixed fermentations of these two yeasts increased the total concentration of higher alcohols, compared to a pure culture of S. cerevisiae. Higher production of 3-methyl-1-butanol in wines from sequential LT cultures was previously reported [54]. Previous studies observed an increase in 2-phenylethanol in mixed fermentations with LT strains [12,13,14].
The effect of yeast starters was also demonstrated for acetates of a higher alcohol compound family, represented by two compounds. LT and MIX treatments exhibited the highest percentages of isoamyl acetate, in F1 and F2, whereas isobutyl acetate was only increased by the LT treatment at F2, both compounds associated with fruity and banana aromas [55]. Hranilovic et al. [47] reported increases in the total acetate esters that varied from 29 to 33%. In contrast, in studies that compared pure culture L. thermotolerans and S. cerevisiae fermentations, L. thermotolerans has been reported as a weaker acetate producer than S. cerevisiae [14,56].
Respecting volatile fatty acids, compounds related to fatty and rancid aromas [55,57], pure culture fermentation of L. thermotolerans formed lower amounts of butyl caprate (F1 and F2), octanoic acid, and n-decanoic acid (F2) than in SC. MIX treatment significantly reduced the values of butyl caprate (F1 and F2) and n-decanoic acid (F2 sampling times) (Table 2). Lower fatty-acid concentrations have also been reported for these L. thermotolerans pure culture fermentations compared with S. cerevisiae [56]. In the study of Zdaniewicz et al. [38], beers produced with L. thermotolerans yeasts showed a decrease in concentrations of hexanoic, octanoic, and n-decanoic acid. Research by Comitini et al. [13] showed that mixed cultures of L. thermotolerans have shown a lower production of hexanoic acid and octanoic acid, whereas no effects have been observed for decanoic acid.
In the case of ethyl ester compounds, mainly associated with fruity aromas [58], the inoculation with L. thermotolerans, in pure and mixed culture, significantly modified the concentration of 5 of the 10 compounds analyzed. In LT treatments, the content of isopentyl decanoate, isopentyl laurate, ethyl myristate (F1 and F2), and ethyl 9-hexadecenoate (F2) were significantly lower than in SC, whereas the ethyl octanoate was formed in higher percentage compared to SC at both sampling times (F1 and F2). In MIX treatments, the content of ethyl myristate (F1 and F2 sampling times) and ethyl 9-hexadecenoate (F2 sampling time) were significantly lower than in SC, whereas in the case of ethyl octanoate, a similar trend was observed as in LT treatment. The obtained results agree with other studies [35] proving the lower amount of ester in L. thermotolerans products. In contrast, Benito et al. [16] reported an increase in the concentration of wine isoamyl alcohol, ethyl octanoate, and isoamyl acetate in mixed fermentations of L. thermotolerans-S. cerevisiae and pure culture of S. cerevisiae compared to sequential fermentation of both yeasts.
Terpenes are the main constituents of hops’ essential oils. Humulene consumption of more than 50% was observed in all samples after secondary fermentation in bottle (F2) and the values were comparable among all treatments.

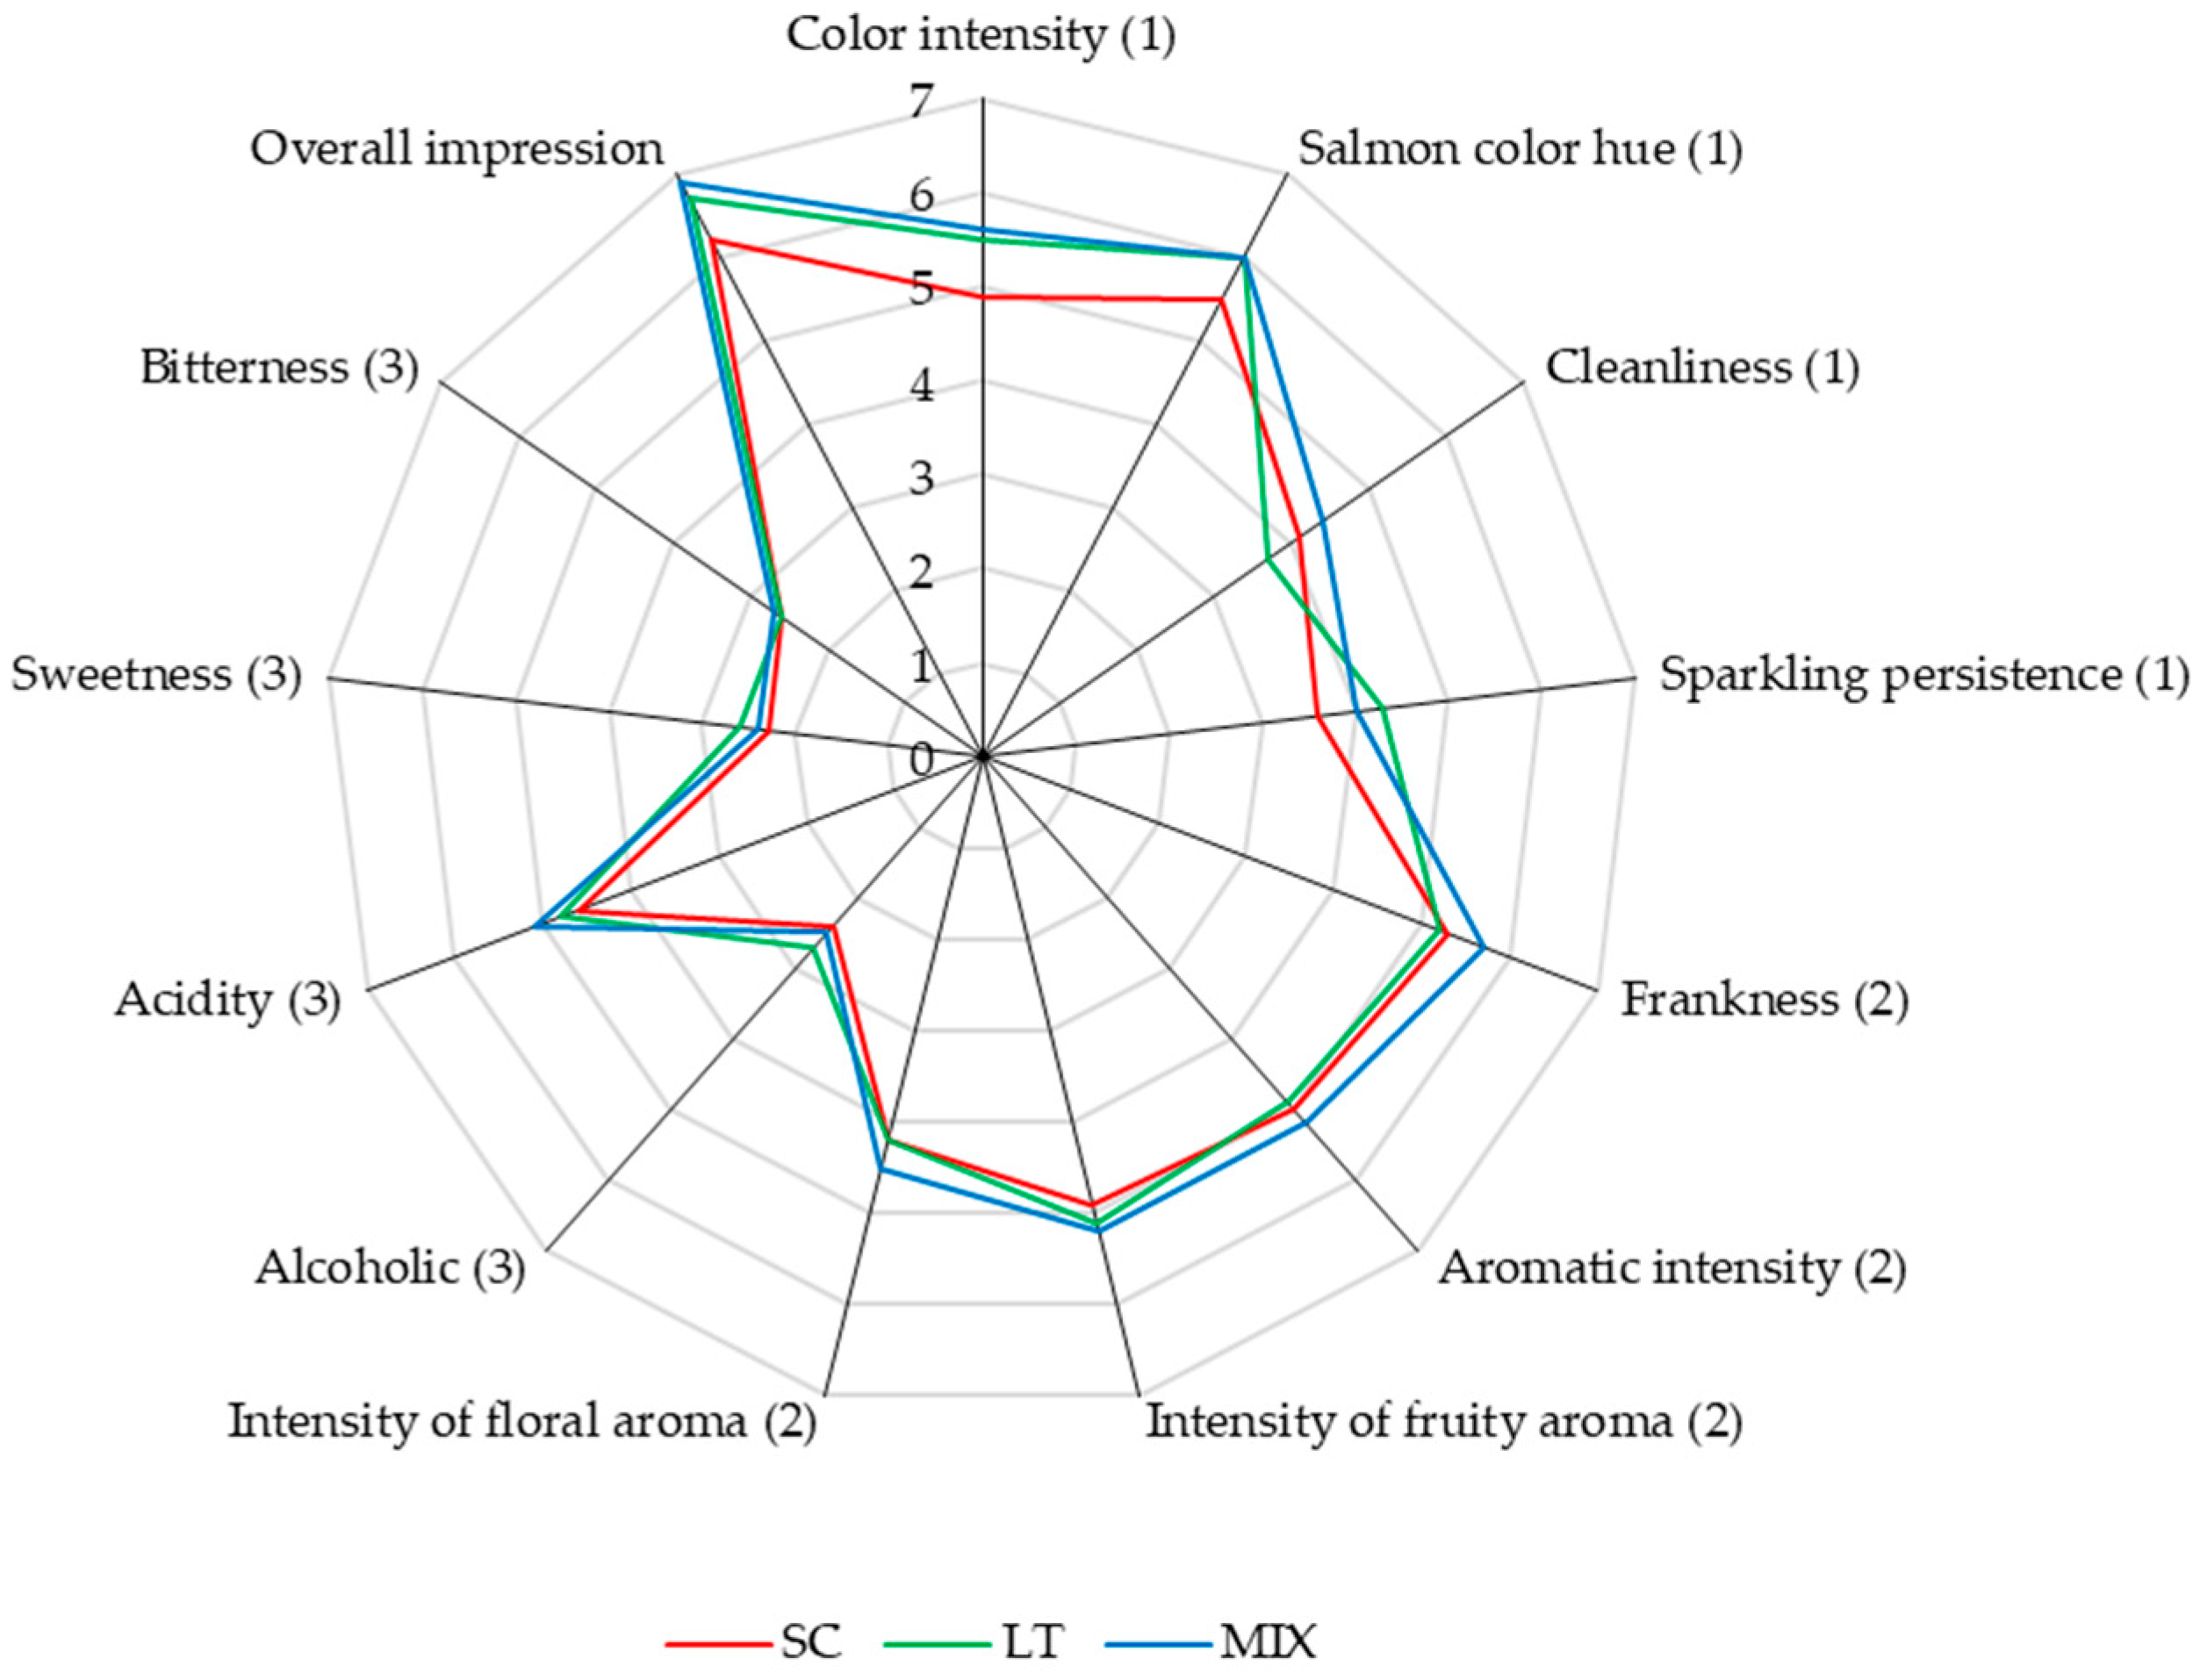
3.5. Sensory Analysis

Results from the ANOVA showed that there were no significant differences for none of the descriptors analyzed and in no case were any defects identified by the panelists. It can be seen that ‘salmon color hue’, ‘frankness’, and ‘acidity’ were the prominent characteristics descriptors in beverages (Figure 5). In addition, ‘intensity of fruity aroma’ and ‘intensity of floral aroma’, as well as ‘color intensity’ and ‘overall impression’ dominated LT and MIX treatments. Therefore, any of the methodologies used would be adequate to obtain an innovative and high-quality product.
In the study elaborated by Benito et al. [16], mentioned above, better sensory properties and acidity were obtained in wines with sequential inoculation, in addition to greater aromatic intensity and quality and a higher overall impression. Wines obtained with mixed fermentation and those obtained only with S. cerevisiae had the highest sweetness scores. This could be due to the high lactic acid production of L. thermotolerans.
Some cherry wines produced with commercial mixed cultures of M. pulcherrima and S. cerevisiae strains showed an increase in sweet, green, and fatty sensory descriptors, whereas wines produced with T. delbrueckii strains and commercial cultures of S. cerevisiae showed improvements in fruity attributes and reduced green notes [59]. These authors also reported cherry wines with enhanced fruity and floral descriptors when using a native strain of T. delbrueckii in mixed culture with S. cerevisiae; the use of this mixed culture improved wine quality [60].

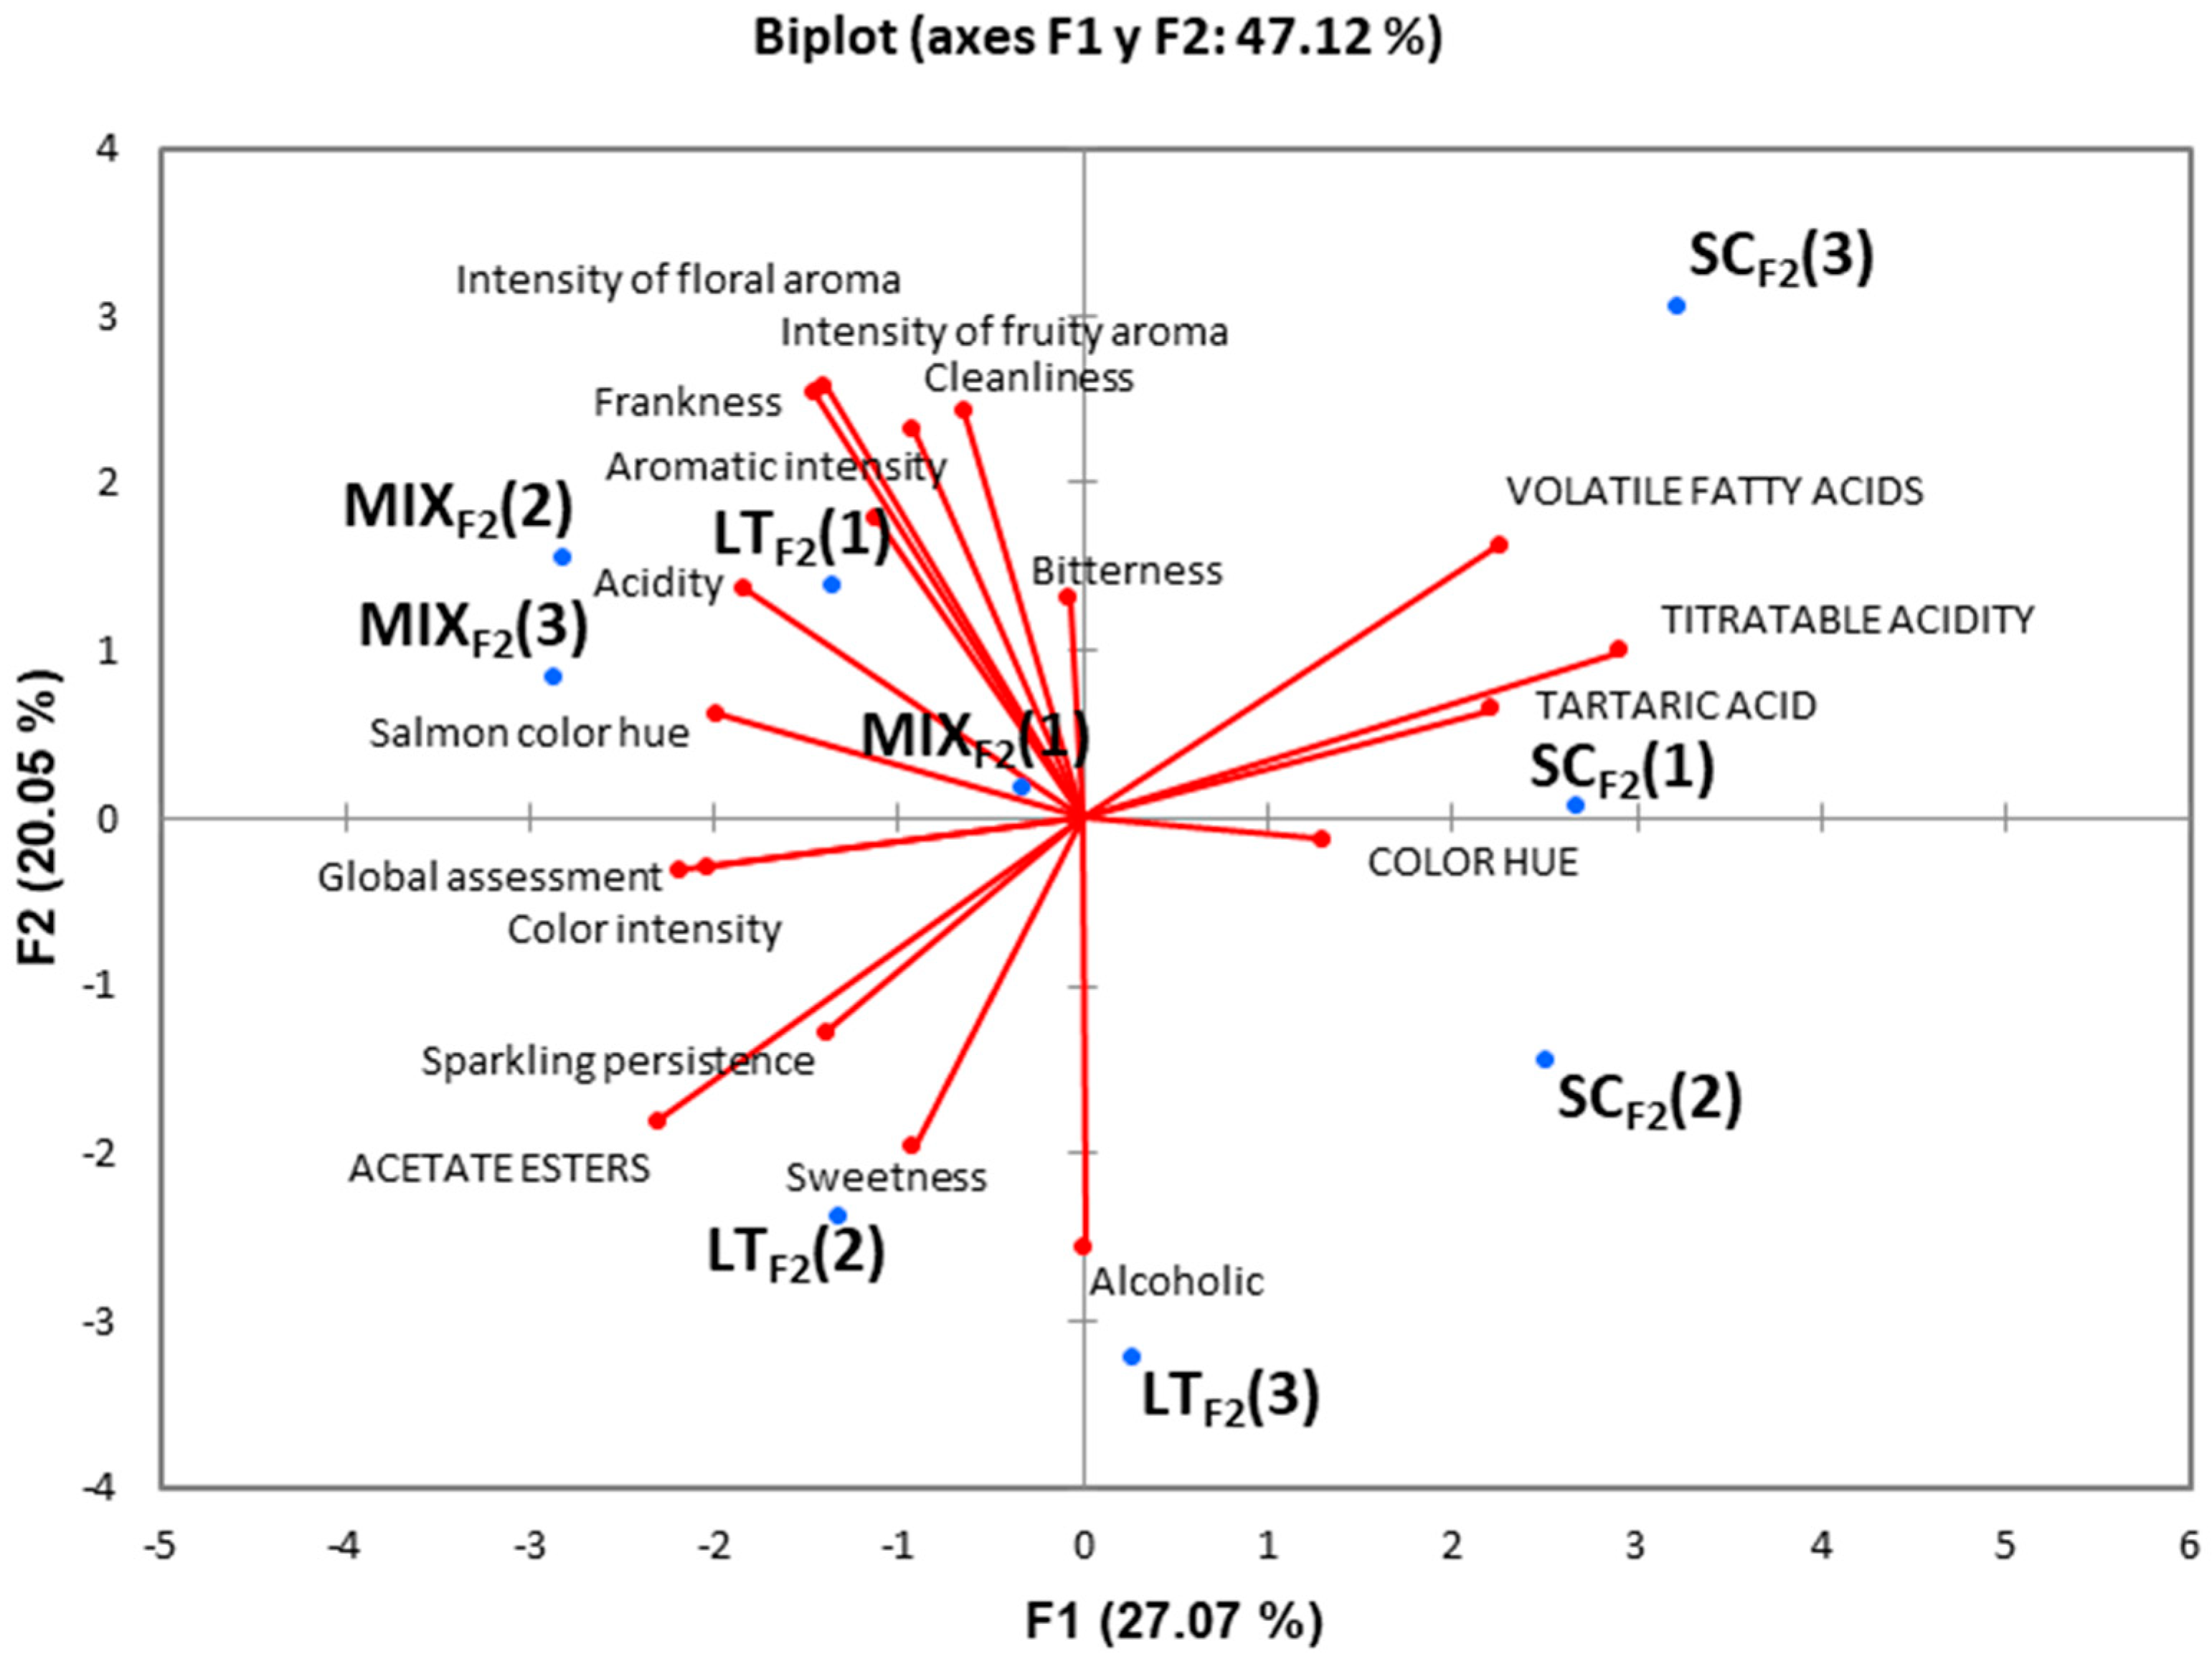
3.6. Principal Component Analysis

The values of the chemical parameters for which significant differences were found, together with those corresponding to the sensory attributes, were subjected to principal component analysis (PCA). As shown in Figure 6, although the analysis only explained 47.12% of the inter-sample variance, it was able to differentiate the SCF2 samples from the rest. The SCF2 samples, although quite dispersed, are all located on the positive side of F1, characterized mainly by acidity parameters, whereas LTF2 and MIXF2, located on the negative side of that axis, were characterized by higher values of acetate esters and all sensory attributes. On the other hand, it is very interesting to note that the group formed by the MIXF2 samples was the one in which the least dispersion of the samples was observed.

4. Conclusions

This comprehensive study provides new insights into mixed fermentation using L. thermotolerans yeast in the production of a grape–plum low-alcohol beverage. The process involves two steps: a primary alcoholic fermentation of plum and grape juice in stainless steel tanks (F1) and a secondary fermentation in a bottle after dextrose syrup addition (F2). When different cultures (S. cerevisiae (SC), L. thermotolerans (LT), and a mix of LS and LC (MIX) were used in F1, the non-Saccharomyces strains of L. thermotolerans showed an optimal fermentation profile to be used as starters for alcoholic fermentation, especially in sequential inoculation with S. cerevisiae. The chemical compositions and sensorial properties of varying beverages were evaluated and the modulation effect was illustrated by a comparison between different fermentation styles. Fermentations with LT and MIX resulted in low levels of aromatic precursor nitrogen and sulfur amino nitrogen. GC-MS analysis, coupled with sensory analysis, revealed that beverages from both pure culture of L. thermotolerans and co-inoculation with S. cerevisiae showed the highest intensity of fruity aroma, mainly due to the high production of acetate esters (isoamyl acetate and ethyl myristate). Therefore, the use of L. thermotolerans, both in pure culture and sequentially with S. cerevisiae, seems to be more appropriate if the aim is to improve the aromatic composition of the beverages obtained. Thus, through this process, an innovative and high-quality product was obtained, a low-alcohol beverage made from grapes and plums, which could be developed at an industrial level due to the increasing interest of consumers in this type of product.

Author Contributions

Conceptualization, D.M. and F.P.-N.; methodology, D.M., M.E.V. and F.P.-N.; software, D.M. and P.R.; formal analysis, D.M., M.E.V. and F.P.-N.; investigation, D.M., P.R., E.L., M.E.V. and F.P.-N.; resources, D.M. and F.P.-N.; data curation, D.M., P.R. and E.L.; writing—original draft preparation, D.M., P.R., M.E.V. and F.P.-N.; writing—review and editing, D.M., P.R., M.E.V. and F.P.-N.; supervision, D.M., P.R., E.L., M.E.V. and F.P.-N.; project administration, D.M..; funding acquisition, D.M. All authors have read and agreed to the published version of the manuscript.

Funding

This research was co-funded by European Regional Development Fund (ERDF) Operational Programme for Extremadura 2014–2020.

Institutional Review Board Statement

Not applicable.

Informed Consent Statement

Informed consent was obtained from all subjects involved in the study.

Data Availability Statement

Data are contained within the article.

Acknowledgments

Authors are grateful to Project IMPROTEC “Implementación y optimización de procesos tecnológicos para mejorar la competitividad de productos agroalimentarios de Extremadura”. D. Moreno, P. Redondo-Garcia, E. Lozano-Escobar, and M. E. Valdés thank the Junta de Extremadura (ref. GR21196–AGA001). F. Pérez-Nevado thanks the Junta de Extremadura (ref. GR21121–AGA008) and the European Regional Development Fund (ERDF) for their support.

Conflicts of Interest

The authors declare no conflict of interest.

References

  1. Podstawski, R.; Wesołowska, E.; Choszcz, D.; Markowski, P.; Klimczak, J. Drinking behaviours and alcohol preferences of female and male students at a Polish university in 2000–2016. DrugsEduc. Prev. Policy 2017, 26, 280–286. [Google Scholar] [CrossRef]
  2. Muggah, E.M.; McSweeney, M.B. Females’ attitude and preference for beer: A conjoint analysis study. Int. J. Food Sci. 2017, 52, 808–816. [Google Scholar] [CrossRef]
  3. Gschaedler, A. Contribution of Non-Conventional Yeasts in Alcoholic Beverages. Curr. Opin. Food Sci. 2017, 13, 73–77. [Google Scholar] [CrossRef]
  4. Fleet, G.H. Yeast interactions and wine flavour. Int. J. Food Microbiol. 2003, 86, 11–22. [Google Scholar] [CrossRef]
  5. Ciani, M.; Maccarelli, F. Oenological properties of non-Saccharomyces yeasts associated with wine-making. World J. Microbiol. Biotechnol. 1997, 14, 199–203. [Google Scholar] [CrossRef]
  6. Ciani, M.; Comitini, F.; Mannazzu, I.; Domizio, P. Controlled mixed culture fermentation: A new perspective on the use of non-Saccharomyces yeasts in winemaking. FEMS Yeast Res. 2010, 10, 123–133. [Google Scholar] [CrossRef] [Green Version]
  7. Jolly, N.P.; Varela, C.; Pretorius, I.S. Not your ordinary yeast: Non-Saccharomyces yeasts in wine production uncovered. FEMS Yeast Res. 2014, 14, 215–237. [Google Scholar] [CrossRef] [Green Version]
  8. Mora, J.; Barbas, J.I.; Ramis, B.; Mulet, A. Yeast microflora associated with some Majorcan musts and wines. Am. J. Enol. Vitic. 1988, 39, 344–346. [Google Scholar]
  9. Torija, M.J.; Rozes, N.; Poblet, M.; Guillamón, J.M.; Mas, A. Yeast population dynamics in spontaneous fermentations: Comparison between two different wine-producing areas over a period of three years. Antonie Van Leeuwenhoek Anton. Leeuw Int. J. G. 2001, 79, 345–352. [Google Scholar] [CrossRef]
  10. Kapsopoulou, K.; Kapaklis, A.; Spyropoulos, H. Growth and fermentation characteristics of a strain of the wine yeast Kluyveromyces thermotolerans isolated in Greece. World J. Microbiol. Biotechnol. 2005, 21, 1599–1602. [Google Scholar] [CrossRef]
  11. Nurgel, C.; Erten, H.; Canbas, A.; Cabaroglu, T.; Selli, S. Yeast flor during the fermentation of wines made from Vitis vinifera L. cv. Emir and Kalecik Karasi grown in Anatolia. World J. Microbiol. Biotechnol. 2005, 21, 1187–1194, Erratum in World J. Microbiol. Biotechnol. 2006, 22, 95–96. [Google Scholar] [CrossRef]
  12. Morata, A.; Bañuelos, M.A.; Vaquero, C.; Loira, I.; Cuerda, R.; Palomero, F.; González, C.; Suárez-Lepe, J.A.; Wang, J.; Han, S.; et al. Lachancea thermotolerans as a tool to improve pH in red wines from warm regions. Eur. Food Res. Technol. 2019, 245, 885–894. [Google Scholar] [CrossRef]
  13. Comitini, F.; Gobbi, M.; Domizio, P.; Romani, C.; Lencioni, L.; Mannazzu, I.; Ciani, M. Selected non-Saccharomyces wine yeasts in controlled multistarter fermentations with Saccharomyces cerevisiae. Food Microbiol. 2011, 28, 873–882. [Google Scholar] [CrossRef] [PubMed]
  14. Gobbi, M.; Comitini, F.; Domizio, C.; Lecioni, L.; Mannazzu, I.; Ciani, M. Lachancea thermotolerans and Saccharomyces cerevisiae in simultaneous and sequential co-fermentation: A strategy to enhance acidity and improve the overall quality of wine. Food Microbiol. 2013, 3, 271–281. [Google Scholar] [CrossRef] [PubMed]
  15. Kapsopoulou, K.; Mourtzini, A.; Anthoulas, M.; Nerantzis, E. Biological acidifcation during grape must fermentation using mixed cultures of Kluyveromyces thermotolerans and Saccharomyces cerevisiae. World J. Microbiol. Biotechnol. 2007, 23, 735–739. [Google Scholar] [CrossRef]
  16. Benito, N.; Calderón, F.; Palomero, F.; Benito, S. Quality and Composition of Airén Wines Fermented by Sequential Inoculation of Lachancea thermotolerans and Saccharomyces cerevisiae. Food Technol. Biotechnol. 2016, 54, 135. [Google Scholar] [CrossRef]
  17. Benito, Á.; Calderón, F.; Palomero, F.; Benito, S. Combine use of selected Schizosaccharomyces pombe and Lachancea thermotolerans yeast strains as an alternative to the traditional malolactic fermentation in red wine production. Molecules 2015, 20, 9510–9523. [Google Scholar] [CrossRef] [Green Version]
  18. Sgouros, G.; Mallouchos, A.; Filippousi, M.E.; Banilas, G.; Nisiotou, A. Molecular characterization and enological potential of a high lactic acid-producing Lachancea thermotolerans vineyard strain. Foods 2020, 9, 595. [Google Scholar] [CrossRef]
  19. International Organization of Vine and Wine (OIV). Recueil des Methodes Internationales d’Analyse des Vins et des Moûts; Organisation Internationale de la Vigne et du Vin: Paris, France, 1990. [Google Scholar]
  20. Zoecklein, B.W.; Fugelsang, K.C.; Gump, B.H.; Nury, F.S. Wine Analysis and Production, 1st ed.; Van Nostrand and Reinhold: New York, NY, USA, 1990. [Google Scholar]
  21. International Organization of Vine and Wine (OIV). Compendium of International Methods of Wine and Must Analysis Vol. 1 & 2; OIV: Paris, France, 2010. [Google Scholar]
  22. International Organization of Vine and Wine (OIV). Compendium of International Methods of Wine and Must Analysis Vol. 1 & 2; OIV: Paris, France, 2016. [Google Scholar]
  23. Singleton, V.L.; Rossi, J.A., Jr. Colorimetry of total phenolics with phosphomolybdicphosphotungstic acid reagents. Am. J. Enol. Vitic. 1965, 30, 144–158. [Google Scholar]
  24. Lee, J.; Durst, R.W.; Wrolstad, R.E.; Eisele, T.; Giusti, M.M.; Hach, J.; Hofsommer, H.; Koswig, S.; Krueger, D.A.; Kupina, S.; et al. Determination of Total Monomeric Anthocyanin Pigment Content of Fruit Juices, Beverages, Natural Colorants, and Wines by the pH Differential Method: Collaborative Study. J. AOAC Int. 2005, 88, 1269–1278. [Google Scholar] [CrossRef] [Green Version]
  25. Glories, Y. La maturitá fenólica delle uve: Primo parámetro da controllare peruna corretta vinificazione in rosso. Vignevini 1999, 3, 46–50. [Google Scholar]
  26. Ayala, F.; Echávarri, J.F.; Negueruela, A.I. A new simplified method for measuring the color of wines. I. Red and rose wines. Am. J. Enol. Vitic. 1997, 48, 357–363. [Google Scholar] [CrossRef]
  27. Andrés-Lacueva, C.; Lamuela-Raventós, R.M.; Buxaderas, S.; de la Torre-Boronat, M.D.C. Influence of variety and aging on foaming properties of cava (sparkling wine). 2. J. Agric. Food Chem. 1997, 45, 2520–2525. [Google Scholar] [CrossRef]
  28. Brand-Williams, W.; Cuvelier, M.E.; Berset, C. Use of free radical method to evaluate antioxidant activity. LWT-Food Sci. Technol. 1995, 28, 25–30. [Google Scholar] [CrossRef]
  29. Re, R.; Pellegrini, N.; Proteggente, A.; Pannala, A.; Yang, M.; Rice-Evans, C. Antioxidant activity applying an improved ABTS radical cation decolorization assay. Free Radic. Biol. Med. 1999, 26, 1231–1237. [Google Scholar] [CrossRef]
  30. Valdés, E.; Vilanova, M.; Sabio, E.; Benalte, M.J. Clarifying agents effect on the nitrogen composition in must and wine during fermentation. Food chem. 2011, 125, 430–437. [Google Scholar] [CrossRef]
  31. Valdés, M.E.; Talaverano, M.I.; Moreno, D.; Prieto, M.H.; Mancha, L.A.; Uriarte, D.; Vilanova, M. Effect of the timing of water deficit on the must amino acid profile of Tempranillo grapes grown under the semiarid conditions of SW Spain. Food Chem. 2019, 292, 24–31. [Google Scholar] [CrossRef]
  32. Rodrigues, C.; Portugal, F.C.M.; Nogueira, J.M.F. Static headspace analysis using polyurethane phases-Application to roasted coffee volatiles characterization. Talanta 2012, 89, 521–525. [Google Scholar] [CrossRef]
  33. UNE-EN ISO 8589:2010; Análisis sensorial. Guía general para el diseño de una sala de cata. ISO: Geneva, Switzerland, 2007.
  34. Porter, T.J.; Divol, B.; Setati, M.E. Investigating the biochemical and fermentation attributes of Lachancea species and strains: Deciphering the potential contribution to wine chemical composition. Int. J. Food Microbiol. 2019, 290, 273–287. [Google Scholar] [CrossRef]
  35. Balikci, E.K.; Tanguler, H.; Jolly, N.P.; Erten, H. Influence of Lachancea thermotolerans on cv. Emir wine fermentation. Yeast 2016, 33, 313–321. [Google Scholar] [CrossRef] [Green Version]
  36. Alexandre, H. Autolysis of Yeasts. Compr. Biotechnol. 2011, 2, 641–649. [Google Scholar] [CrossRef]
  37. Villacreces, S.; Blanco, C.A.; Caballero, I. Developments and characteristics of craft beer production processes. Food Biosci. 2022, 45, 101495. [Google Scholar] [CrossRef]
  38. Zdaniewicz, M.; Satora, P.; Pater, A.; Bogacz, S. Low lactic acid-producing strain of Lachancea thermotolerans as a new starter for beer production. Biomolecules 2020, 10, 256. [Google Scholar] [CrossRef] [PubMed]
  39. Flores, M.G.; Rodríguez, M.E.; Oteiza, J.M.; Barbagelata, R.J.; Lopes, C.A. Physiological characterization of Saccharomyces uvarum and Saccharomyces eubayanus from Patagonia and their potential for cidermaking. Int. J. Food Microbiol. 2017, 249, 9–17. [Google Scholar] [CrossRef] [PubMed]
  40. Caldeira, I.; Lopes, D.; Delgado, T.; Canas, S.; Anjos, O. Development of blueberry liquor: Influence of distillate, sweetener and fruit quantity. J. Sci. Food Agric. 2018, 98, 1088–1094. [Google Scholar] [CrossRef]
  41. Kutyna, D.R.; Varela, C.; Henschke, P.A.; Chambers, P.J.; Stanley, G.A. Microbiological approaches to lowering ethanol concentration in wine. Trends Food Sci. Technol. 2010, 21, 293–302. [Google Scholar] [CrossRef]
  42. Varela, C.; Dry, P.R.; Kutyna, D.R.; Francis, I.L.; Henschke, P.A.; Curtin, C.D.; Chambers, P.J. Strategies for reducing alcohol concentration in wine. Aust. J. Grape Wine Res. 2015, 21, 670–679. [Google Scholar] [CrossRef]
  43. Mora, J.; Barbas, J.I.; Mulet, A. Growth of yeast species during the fermentation of musts inoculated with Kluyveromyces thermotolerans and Saccharomyces cerevisiae. Am. J. Enol. Vitic. 1990, 41, 156–159. [Google Scholar]
  44. Vaquero, C.; Izquierdo-Cañas, P.M.; Mena-Morales, A.; Marchante-Cuevas, L.; Heras, J.M.; Morata, A. Use of lachancea thermotolerans for biological vs. Chemical acidification at pilot-scale in white wines from warm areas. Fermentation 2021, 7, 193. [Google Scholar] [CrossRef]
  45. Benito, A.; Calderon, F.; Benito, S. The combined use of Schizosaccharomyces pombe and Lachancea thermotolerans-effect on the anthocyanin wine composition. Molecules 2017, 22, 739. [Google Scholar] [CrossRef] [Green Version]
  46. Chen, K.; Escott, C.; Loira, I.; del Fresno, J.M.; Morata, A.; Tesfaye, W.; Calderon, F.; Suárez-Lepe, J.A.; Han, S.; Benito, S. Use of non-Saccharomyces yeasts and oenological tannin in red winemaking: Influence on colour, aroma and sensorial properties of young wines. Food Microbiol. 2018, 69, 51–63. [Google Scholar] [CrossRef] [PubMed]
  47. Hranilovic, A.; Li, S.; Boss, P.K.; Bindon, K.; Ristic, R.; Grbin, P.R.; Van der Westhuizen, T.; Jiranek, V. Chemical and sensory profiling of Shiraz wines co-fermented with commercial non-Saccharomyces inocula. Aust. J. Grape Wine Res. 2017, 24, 166–180. [Google Scholar] [CrossRef]
  48. Blouin, J.; Peynaud, E. Enología práctica. In Conocimiento y Elaboración del Vino, 4th ed.; Ed.Mundi-Prensa: Barcelona, Spain, 2004. [Google Scholar]
  49. Suárez, C.; Palacios, A.; Santiago, L.; Santamaría, P.; López, R.; Gutiérrez, A.R. Efecto del uso de levaduras inactivas en las paradas de fermentación. Influencia de los ácidos grasos en el desarrollo de la fermentación alcohólica. SEVI 2003, 2990, 4134–4140. [Google Scholar]
  50. Roca-mesa, H.; Sendra, S.; Mas, A.; Beltran, G.; Torija, M.J. Nitrogen preferences during alcoholic fermentation of different non-saccharomyces yeasts of oenological interest. Microorganisms 2020, 8, 157. [Google Scholar] [CrossRef] [Green Version]
  51. Holt, S.; Miks, M.H.; De Carvalho, B.T.; Foulquié-Moreno, M.R.; Thevelein, J.M. The molecular biology of fruity and floral aromas in beer and other alcoholic beverages. FEMS Microbiol. Rev. 2019, 43, 193–222. [Google Scholar] [CrossRef]
  52. Arcari, S.G.; Caliari, V.; Sganzerla, M.; Godoy, H.T. Volatile composition of Merlot red wine and its contribution to the aroma: Optimization and validation of analytical method. Talanta 2017, 174, 752–766. [Google Scholar] [CrossRef]
  53. Synos, K.; Reynolds, A.G.; Bowen, A.J. Effect of yeast strain on aroma compounds in Cabernet franc ice wines. LWT-Food Sci. Technol. 2015, 64, 227–235. [Google Scholar] [CrossRef]
  54. Hranilovic, A.; Albertin, W.; Capone, D.L.; Gallo, A.; Grbin, P.R.; Danner, L.; Bastian, S.E.P.; Masneuf-Pomarede, I.; Coulon, J.; Bely, M.; et al. Impact of Lachancea thermotolerans on chemical composition and sensory profiles of Merlot wines. Food Chem. 2021, 349, 129015. [Google Scholar] [CrossRef]
  55. Peinado, R.A.; Moreno, J.; Bueno, J.E.; Moreno, J.A.; Mauricio, J.C. Comparative study of aromatic compounds in two young white wines subjected to pre-fermentative cryomaceration. Food Chem. 2004, 84, 585–590. [Google Scholar] [CrossRef]
  56. Escribano, R.; González-Arenzana, L.; Portu, J.; Garijo, P.; López-Alfaro, I.; López, R.; Santamaría, P.; Gutiérrez, A.R. Aromatic compound production and fermentative behavior within different non- Saccharomyces species and clones. J. Appl. Microbiol. 2018, 124, 1521–1531. [Google Scholar] [CrossRef]
  57. Wang, X.J.; Tao, Y.S.; Wu, Y.; An, R.Y.; Yue, Z.Y. Aroma compounds and characteristics of noble-rot wines of Chardonnay grapes artificially botrytized in the vineyard. Food Chem. 2017, 226, 41–50. [Google Scholar] [CrossRef] [PubMed]
  58. Vilanova, M.; Genisheva, Z.; Masa, A.; Oliveira, J.M. Correlation between volatile composition and sensory properties in Spanish Albariño wines. Microchem. J. 2010, 95, 240–246. [Google Scholar] [CrossRef]
  59. Sun, S.Y.; Gong, H.S.; Jiang, X.M.; Zhao, Y.P. Selected non-Saccharomyces wine yeasts in controlled multistarter fermentations with Saccharomyces cerevisiae on alcoholic fermentation behaviour and wine aroma of cherry wines. Food Microbiol. 2014, 44, 15–23. [Google Scholar] [CrossRef] [PubMed]
  60. Sun, S.Y.; Gong, H.S.; Zhao, Y.P.; Liu, W.L.; Jin, C. Sequential culture with Torulaspora delbrueckii and Saccharomyces cerevisiae and management of fermentation temperature to improve cherry wine quality. J. Sci. Food Agric. 2016, 96, 1880–1887. [Google Scholar] [CrossRef]
Figure 1. Experimental design of the process followed to obtain a low–alcohol fermented beverage from fruit must.
Fermentation 09 00029 g001
Figure 2. Primary fermentation (F1) kinetics of plum and grape base musts (n = 3) inoculated with pure yeast starters of Saccharomyces cerevisiae (SC) and Lachancea thermotolerans (LT); sequential fermentations with L. thermotolerans followed by S. cerevisiae (MIX). The three replicate fermentations per each yeast starter are plotted independently.
Fermentation 09 00029 g002
Figure 3. Yeast population dynamics (a) during primary fermentation (F1) and (b) during secondary fermentation (F2) with Saccharomyces cerevisiae (SC) and Lachancea thermotolerans (LT) alone and sequential fermentation with L. thermotolerans followed by S. cerevisiae (MIX). For the same sample day, different letters indicate significant differences between experimental treatments (p < 0.05).
Fermentation 09 00029 g003
Figure 4. Percentage of volatile compound families of the beverages obtained in the primary (F1) and secondary fermentation (F2) from different yeast starters (S. Saccharomyces cerevisiae-SC, Lachancea thermotolerants-LT and co-inoculate of Lachancea thermotolerants and Saccharomyces cerevisiae-MIX). For the same parameter and sampling time, different letters indicate significant differences between experimental treatments (p < 0.05).
Fermentation 09 00029 g004
Figure 5. Sensory evaluation of the fermented beverages produced from different yeast starters (S. cerevisiae-SC, L. thermotolerants-LT and co-inoculate of L. thermotolerants and S. cerevisiae-MIX) after secondary bottle fermentation (F2). (1): visual descriptors; (2): aroma descriptors; (3): flavor-by-mouth descriptors.
Fermentation 09 00029 g005
Figure 6. Analysis of principal components of the beverages obtained after bottle secondary fermentation (F2) from different yeast starters (S. cerevisiae−SC, L. thermotolerants−LT and co-inoculate of L. thermotolerants and S. cerevisiae−MIX). In capital letters variables referring to the physicochemical composition of the beverages and in small letters sensory attributes. The three replicate beverages per each yeast starter are plotted independently.
Fermentation 09 00029 g006
Table 1. Must composition before fermentation.
General Oenological Parameters
Density (g mL−1)Total soluble solids (°Brix)pHTitratable acidity (g malic acid L−1)Malic acid (g L−1)Tartaric acid (g L−1)
1.04210.763.535.185.030.29
Nitrogen parameters
Total amino content (TAC, mg L−1)Free amino nitrogen
(FAN, mgN L−1)
Yeast assimilable nitrogen
(YAN, mgN L−1)
Ammonium (mgN L−1)Aromatic precursor nitrogen (APN, mgN L−1)
616.04111.77110.1315.747.83
Phenolic parameters
Total phenols
(mg L−1)
Total anthocyanins (mg L−1)TAADPPH
(mmol TE L−1)
TAAABTS (mmol TE L−1)
507.4717.644.542.78
Chromatic parameters
Red−
greenness (a*)
Yellow−
blueness
(b*)
Lightness (L*)Chroma (C*ab)Hue angle
(hab)
Color intensity (CI, u.a)Color hue (CT)
1.165.1997.65.3378.310.132.15
Table 2. Analytical results for the beverages produced after the primary (F1) and secondary (F2) fermentation process from different yeast starters (S. cerevisiae-SC, L. thermotolerants-LT and co-inoculate of L. thermotolerants and S. cerevisiae-MIX).
VariablePrimary Fermentation
(F1)
Secondary Fermentation
(F2)
TreatmentTreatment
General oenological parametersSCF1LTF1MIXF1SCF2LTF2MIXF2
Ethanol (% v/v)5.32 a5.27 a5.34 a5.71 a5.70 a5.71 a
pH3.57 a3.52 b3.54 ab3.57 a3.55 a3.55 a
Titratable acidity (g malic acid L−1)5.43 b5.64 ab5.76 a6.42 a6.20 b6.15 b
Volatile acidity (g acetic acid L−1)0.20 a0.21 a0.14 a0.21 a0.30 a0.29 a
Tartaric acid (g L−1)0.36 a0.24 a0.29 a0.38 a0.30 ab0.17 b
Malic acid (g L−1)4.31 b4.50 a4.34 ab5.08 a5.06 a5.20 a
Lactic acid (g L−1)0.04 a0.06 a0.04 a0.02 a0.04 a0.03 a
Phenolic parametersSCF1LTF1MIXF1SCF2LTF2MIXF2
Total phenols (mg L−1)306.20 b340.79 ab375.37 a313.90 a331.60 a306.22 a
Total anthocyanins (mg L−1)6.97 a9.57 a6.17 a8.72 a11.56 a8.55 a
Total hydroxycinnamic acid index (u.a)4.92 a5.18 a5.05 a4.80 a4.84 a4.77 a
Total flavonoid compounds index (u.a)5.38 a4.77 a5.12 a5.31 a4.19 a4.56 a
Chromatic parametersSCF1LTF1MIXF1SCF2LTF2MIXF2
Red−greenness (a*)8.40 a9.43 a9.34 a5.45 a5.80 a6.92 a
Yellow−blueness (b*)25.73 a28.55 a27.18 a20.57 a22.02 a21.92 a
Lightness (L*)84.63 a83.40 a83.60 a89.37 a88.67 a88.00 a
Chroma (C*ab)27.07 a30.07 a28.74 a21.29 a22.77 a22.99 a
Hue angle (hab)71.95 a71.72 a71.04 a75.20 a75.36 a72.49 b
Color intensity (CI, u.a)0.83 a0.92 a0.90 a0.59 a0.63 a0.65 a
Color hue (CT)1.92 b1.98 a1.93 b2.09 ab2.13 a1.99 b
Total antioxidant activity (TAA)SCF1LTF1MIXF1SCF2LTF2MIXF2
TAADPPH (mmol TE L−1)3.34 a3.69 a3.48 a3.05 a3.31 a3.31 a
TAAABTS (mmol TE L−1)2.63 a2.65 a2.79 a2.48 a2.63 a2.37 a
For the same parameter, different letters indicate significant differences between experimental treatments (p < 0.05) at same sampling time (F1 or F2).
Table 3. Amino acid content of the three types of beverages in the primary (F1) and secondary fermentation from different yeast starters (S. cerevisiae-SC, L.thermotolerants-LT, and co-inoculate of L.thermotolerants and S.cerevisiae-MIX).
VariablePrimary Fermentation
(F1)
Secondary Fermentation (F2)
TreatmentTreatment
SCF1LTF1MIXF1SCF2LTF2MIXF2
Total amino content (TAC, mg L−1)431.47 a624.82 a382.59 a450.34 a463.99 a357.80 a
Free amino nitrogen (FAN, mg N L−1)63.53 a105.52 a60.64 a65.43 a78.23 a56.02 a
Yeast assimilable nitrogen (YAN, mg N L−1)43.40 a88.64 a46.58 a51.20 a69.51 a44.98 a
Aromatic precursor nitrogen (APN, mg N L−1)4.97 a2.27 a2.82 a7.36 a2.64 b2.89 b
Sulfur amino nitrogen (SAN, mg N L−1)2.05 a0.80 b0.88 b1.94 a0.88 b1.03 b
Amines (AM, mg N L−1)1.47 a1.42 a1.30 a1.34 ab1.14 b1.52 a
Histidine (mg N L−1)0.57 a0.25 a0.45 a0.39 a 0.10 b0.03 b
Aspartic acid (mg N L−1)0.68 a0.42 a0.51 a0.90 a0.47 ab0.39 b
Alanine (mg N L−1)5.06 a4.38 a3.56 a5.48 a4.10 a3.10 a
Arginine (mg N L−1)4.59 a8.42 a11.48 a3.30 b8.31 ab11.80 a
Asparagine (mg N L−1)15.37 a45.03 a19.39 a17.38 a32.13 a11.68 a
Phenylalanine (mg N L−1)1.10 a0.35 a0.49 a1.50 a0.54 b0.70 b
Glycine (mg N L−1)2.81 a3.09 a2.77 a2.69 a2.48 a2.87 a
Isoleucine (mg N L−1)0.60 a0.15 a0.26 a0.90 a0.24 b0.24 b
Lysine (mg N L−1)1.45 a0.72 a1.12 a1.65 a0.34 b0.36 b
Leucine (mg N L−1)1.61 a0.60 a0.84 a2.29 a0.71 b0.81 b
Ornithine (mg N L−1)0.95 a0.89 a0.64 a0.88 a0.84 a0.87 a
Methionine (mg N L−1)0.52 a0.14 a0.21 a0.56 a0.13 b0.12 b
Serine (mg N L−1)0.73 a0.70 a0.57 a0.89 a0.42 ab0.26 b
Tyrosine (mg N L−1)0.48 a0.36 a0.34 a0.94 a0.37 b0.56 ab
Threonine (mg N L−1)0.64 a0.45 a0.39 a0.81 a0.30 b0.19 b
Valine (mg N L−1)0.96 a0.29 a0.48 a1.53 a0.56 b0.70 b
Taurine (mg N L−1)0.63 a0.49 a0.49 a0.7 a0.5 b0.6 ab
Cysteine (mg N L−1)0.91 a0.17 a0.18 a0.67 a0.52 b0.65 b
Proline (mg N L−1)21.67 a18.45 ab15.50 b14.96 a9.91 c12.65 a
Hydroxyproline (mg N L−1)0.24 a0.21 a0.26 a0.08 a0.00 a0.11 a
Ethanolamine (mg N L−1)1.47 a1.42 a1.30 a1.34 ab1.14 b1.52 a
Ammonium (mg N L−1)0.91 a1.10 a0.95 a0.99 a1.19 a1.21 a
For the same parameter, different letters indicate significant differences between experimental treatments (p < 0.05) at same sampling time (F1 or F2).
Table 4. Percentage of volatile compound of the beverages obtained in the primary (F1) and secondary fermentation (F2) from different yeast starters (S. cerevisiae-SC, L. thermotolerants-LT and co-inoculate of L. thermotolerants and S. cerevisiae-MIX).
Compound (%)Primary Fermentation (F1)Secondary Fermentation (F2)
TreatmentTreatment
Higher alcoholsSCF1LTF1MIXF1SCF2LTF2MIXF2
3-methyl-1-butanol3.68 b3.27 b5.14 a3.50 a5.08 a5.96 a
2-methyl-1-butanol1.12 b0.97 b1.82 a1.03 a1.75 a1.48 a
2-phenylethanol2.00 a2.17 a2.38 a1.64 a3.23 a3.16 a
Acetates of higher alcoholsSCF1LTF1MIXF1SCF2LTF2MIXF2
Isobutyl acetate0.07 a0.07 a0.07 a0.05 b0.08 a0.05 b
Isoamyl acetate1.06 b1.59 a1.74 a0.78 b2.01 a1.58 a
Volatile fatty acidsSCF1LTF1MIXF1SCF2LTF2MIXF2
Octanoic acid3.20 a9.58 a11.38 a13.29 a4.65 b8.43 ab
Butyl caprate0.28 a0.12 b0.12 b0.16 a0.08 b0.08 b
n-decanoic acid1.31 a0.00 a1.14 a2.73 a0.70 b1.36 b
9-decanoic acid3.41 a3.01 a3.38 a2.52 a1.69 a2.44 a
Acetic acid0.08 b0.21 ab0.23 a0.14 a0.15 a0.14 a
Ethyl esters of fatty acidsSCF1LTF1MIXF1SCF2LTF2MIXF2
Ethyl laurate35.96 a28.72 a29.23 a29.89 a30.89 a25.08 a
Ethyl palmitate1.02 a0.71 a0.93 a2.15 a1.44 a1.34 a
Ethyl 9-hexadecenoate0.50 a0.33 a0.37 a0.32 a0.10 b0.16 b
Isoamyl octanoate1.25 a1.30 a1.19 a0.84 a0.83 a0.90 a
Isopentyl decanoate4.36 a2.62 b3.39 ab2.92 a2.20 b2.33 ab
Isopentyl laurate0.85 a0.31 b0.47 ab0.69 a0.44 a0.31 a
Ethyl myristate3.91 a1.69 b1.94 b3.85 a2.87 b1.97 b
Ethyl octanoate6.73 b9.59 a9.76 a6.09 b9.41 a9.21 a
Ethyl hexanoate2.28 a2.65 a2.71 a1.72 a2.11 a1.64 a
Ethyl decanoate26.64 a30.67 a22.22 a25.55 a30.12 a32.28 a
TerpenesSCF1LTF1MIXF1SCF2LTF2MIXF2
Humulene0.30 a0.44 a0.36 a0.12 a0.16 a0.10 a
For the same parameter and sampling time, different letters indicate significant differences between experimental treatments (p < 0.05).
Disclaimer/Publisher’s Note: The statements, opinions and data contained in all publications are solely those of the individual author(s) and contributor(s) and not of MDPI and/or the editor(s). MDPI and/or the editor(s) disclaim responsibility for any injury to people or property resulting from any ideas, methods, instructions or products referred to in the content.

