Article

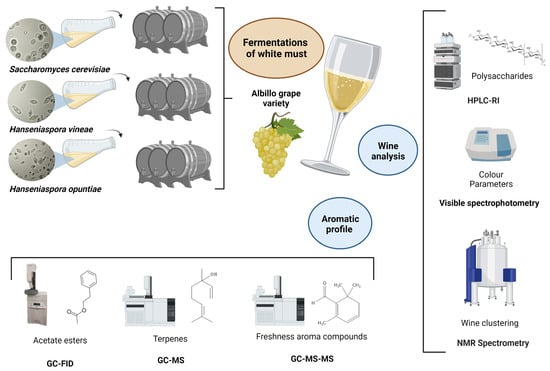
Improving Aroma Complexity with Hanseniaspora spp.: Terpenes, Acetate Esters, and Safranal

by
Juan Manuel del Fresno
1,
Carlos Escott
1,
Francisco Carrau
2,
José Enrique Herbert-Pucheta
3,
Cristian Vaquero
1,
Carmen González
1 and
Antonio Morata
1,*
1
enotecUPM, Chemistry and Food Technology Department, Escuela Técnica Superior de Ingeniería Agronómica, Alimentaria y de Biosistemas, Universidad Politécnica de Madrid, Avenida Complutense S/N, 28040 Madrid, Spain
2
Área Enología y Biotecnología de Fermentaciones, Facultad de Química, Universidad de la Republica, Gral. Flores 2124, Montevideo 11800, Uruguay
3
Departamento de Química Orgánica, Escuela Nacional de Ciencias Biológicas, Instituto Politécnico Nacional. Prolongación de Carpio y Plan de Ayala s/n, Colonia Santo Tomás, Ciudad de México 11340, Mexico
*
Author to whom correspondence should be addressed.
Fermentation 2022, 8(11), 654; https://doi.org/10.3390/fermentation8110654
Submission received: 6 October 2022 / Revised: 11 November 2022 / Accepted: 14 November 2022 / Published: 19 November 2022
(This article belongs to the Special Issue Enological Repercussions of Non-saccharomyces Species 4.0)

Abstract

:
Hanseniaspora vineae and Hanseniaspora opuntiae are apiculate yeasts normally found on the skins of ripe grapes and at the beginning of alcoholic fermentation. Several studies have reported that these species can provide interesting sensory characteristics to wine by contributing high levels of acetate esters and can increase the mouthfeel and body of wines. The present work aims to evaluate the use of these two species sequentially with Saccharomyces cerevisiae to improve the sensory profile of Albillo Mayor white wines. The fermentations were carried out in triplicate in 150 L stainless steel barrels. At the end of the alcoholic fermentation polysaccharides, colour, and an extensive study of the aromatic profiles were measured. Results showed up to 1.55 times higher content of 2-phenylethanol in H. opuntiae wines and up to three times higher concentration of fermentative esters in H. vineae wines than in the controls. Interestingly, it should be noted that the compound safranal was identified only in the H. vineae wines. These results indicated that the species studied are an interesting bio-tool to improve the aromatic profile of Albillo Mayor white wines. A novel non-targeted NMR-based metabolomics approach is proposed as a tool for optimising wine productions with standard and sequential fermentation schemes using apiculate yeast strains due to its discriminant capacity to differentiate fine features between wine samples from the identical geographical origin and grape variety but diverse fermentations or vintages.

Graphical Abstract

1. Introduction

Hanseniaspora spp. are apiculate yeasts normally present in grape skin microbiota at maturity and in the must at the beginning of fermentation [1,2,3]. They can often be found in must before the sixth day of fermentation [4]. Their characteristics and enological potential have recently been reviewed [2]. Normally, they have a low resistance to SO2 [2] and are used to exclude them at the beginning of fermentation to avoid undesired levels of volatile acidity and ethyl acetate. However, there are also some species, recently defined as the fermentation clade [5], that show increased fermentation capacity, floral aromas, and complexity by the formation of high levels of acetate esters and benzenoids [2,6]. They have been extensively used to enhance the production of esters, such as 2-phenylethyl acetate and isoamyl acetate, sensorially acknowledged as floral and fruity aroma descriptors [7]. Several species of Hanseniaspora can release extracellular glycolytic (β-xylosidase and β-glucosidase) activities, which can enhance the release of volatile terpenes during the fermentation of aromatic varieties [8]. Most of them have low fermentative power and can be found in must fermentation, especially in the initial stages. It appears that Hanseniaspora species do not have antagonistic interactions with Saccharomyces cerevisiae (Sc), although they have shown strong mortality in single or mixed fermentations with Sc [9].
Hanseniaspora vineae (Hv) has specific features inside this species that makes it a friendly yeast (due to its low formation of higher alcohols, acetic, and medium chain fatty acids) that significantly improves wine flavour and quality [10,11,12,13]. Among them are the medium-high fermentative power (8–10% v/v), the low volatile acidity producing wines (even lower than some single fermentations with Sc [14]), high levels of 2-phenyl ethyl acetate with floral sensory impact [10,15,16], and de novo production of terpenes [16,17,18]. Additionally, Hv decreases levels of higher alcohols [10] and improves wine fruitiness. Within Hanseniaspora species, the higher fermentative power of Hv could be related to its closer protein similarity with Saccharomyces strains of the key glycolytic enzymes, such as pyruvate kinase and phosphofructokinase [5] compared to the other species. Concerning the colour, H. vineae has also shown some protective effect on the colour of rosé wines [19]. When Hv has been used with Lachancea thermotolerans (Lt) in biological acidification processes, the production of lactic acid decreases compared to mixed cultures with other non-Saccharomyces species, so some unknown interaction can exist between them [20].
Hanseniaspora opuntiae (Ho) is also interesting because this strain produces low volatile acidity and the expression of floral and sweet aromas [21], mainly of phenylethanol, 3-methyl-butanol and phenylacetaldehyde, and enhances the production of acetate esters [22]. However, the fermentative power is usually lower than 6% v/v and, therefore, needs to be used in sequential inoculation with Sc. It has been isolated in must fermentations [23] and is frequent in the wild microbiome of grape skins, together with H. guillermondii and H. uvarum [1]. Ho has been described as a potential biocontrol agent [24,25] and, because of its weak fermentative power, it shows good biocompatibility with Sc and other non-Saccharomyces. The use of Ho has been proposed in mixed fermentations with Lt in warm areas with neutral varieties to enhance freshness and fruitiness [26].
Both species have shown the ability to increase the mouthfeel and the body of wines even when it is not clearly connected with specific molecules because the analysis of cell wall polysaccharides did not show higher contents in wines [14,19]. A higher absorbance has been observed at 260 nm and 280 nm compared with other Saccharomyces and non-Saccharomyces species [14]. Absorbance values at these wavelengths can be used to estimate nucleic acid and protein content in hydroalcoholic solutions. This might be related to the higher elution of intracellular components [27] compared to Sc. This sensory effect is clear and has been observed in evaluations by tasting panels.
The objective of this research was to use Hv and Ho in sequential fermentations with Sc to improve the sensory profile of high-quality white wines made with the Albillo Mayor variety.

2. Materials and Methods

2.1. Yeast Strains

The Hv strain T02/5A was selected by the team of Professor Francisco Carrau at the Universidad de la República (Montevideo, Uruguay), and, currently, it is being produced as an active dry yeast by Oenobrands SAS (Montpellier, France).
The Ho strain A56 was selected in La Mancha and tested in lab microfermentation (8 mL and 1 L), pilot (30 L), and industrial scales (12,000 L) [7]. It has shown the ability to enhance aroma complexity, increasing fruitiness and floral aroma. It also improves the body and palatability.
Sc Fermivin 3C (Oenobrands SAS) was used as a control and to finish the sequential fermentations. This strain has been used for good compatibility with Hv.

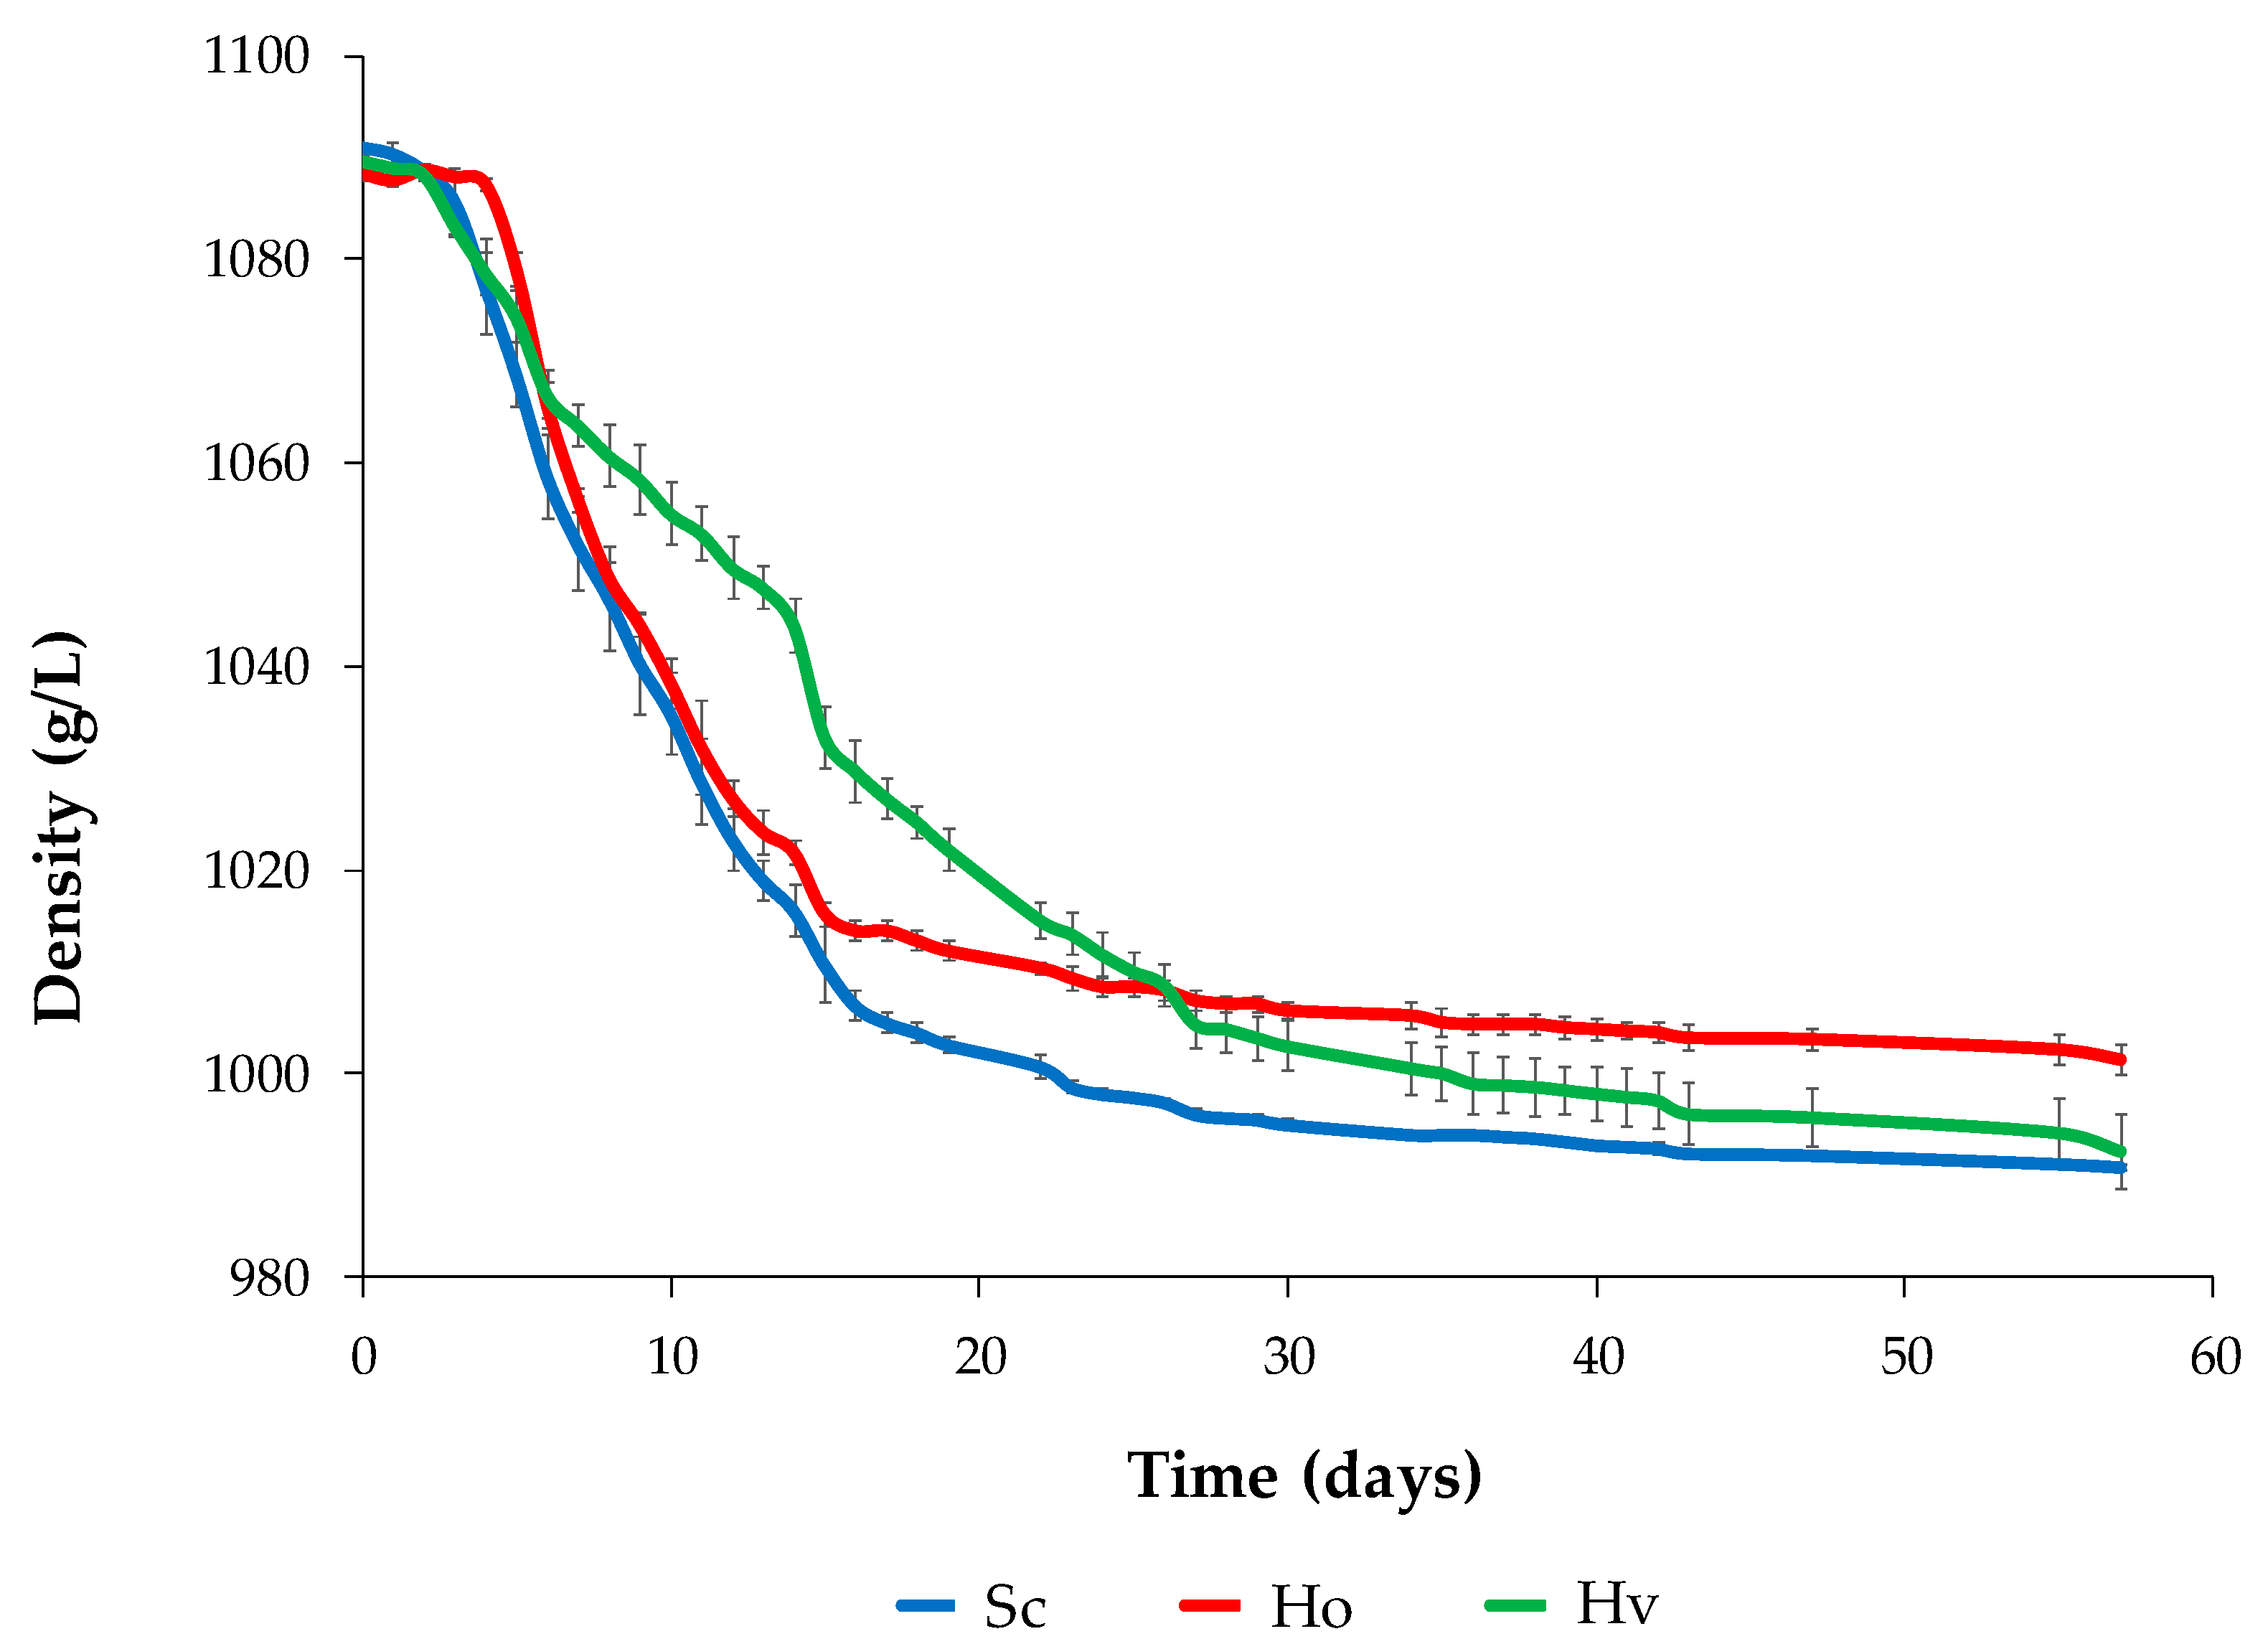
2.2. Must and Fermentation

The white must used in this study was made from Vitis vinifera variety Albillo Mayor grapes. This grape was cultivated in the Bodegas Comenge vineyards located in the D.O. Ribera del Duero in the area of Curiel de Duero, Valladolid, Spain. All fermentations were made with grapes from the 2021 vintage.
Must from the Albillo Mayor white variety was obtained under pneumatic pressing (p < 1.2 bar) and later settled at low temperature with pectolytic enzymes. Later, it was racked in the fermentation barrels. This must showed a density of 1091 g/L, a pH of 3.21, and a total acidity of 5.43 g/L, expressed as tartaric acid.
Fermentations were performed in triplicate in 150 L stainless steel barrels inoculated with 5 L (≈3%) of liquid inoculum prepared in YPD media. The musts were fortified with 100 mg/L of Nutrient Vit Green (Lallemand Inc., Montreal, QC, Canada). Fermentation kinetics are available in Appendix A (Figure A1). Sc fermentations were inoculated at time zero and used as controls in this study. These controls were also inoculated with Sc on day six to add the same volume in all triplicates. The presence of indigenous yeasts was not verified, but periodic optical microscopic observations indicated the correct implantation of yeasts of the Hanseniaspora species. Fermentations proceeded until dryness, and the evolution was monitored daily by measuring density and temperature button sensors. Fermentations proceeded until the residual sugars were lower than 2 g/L.

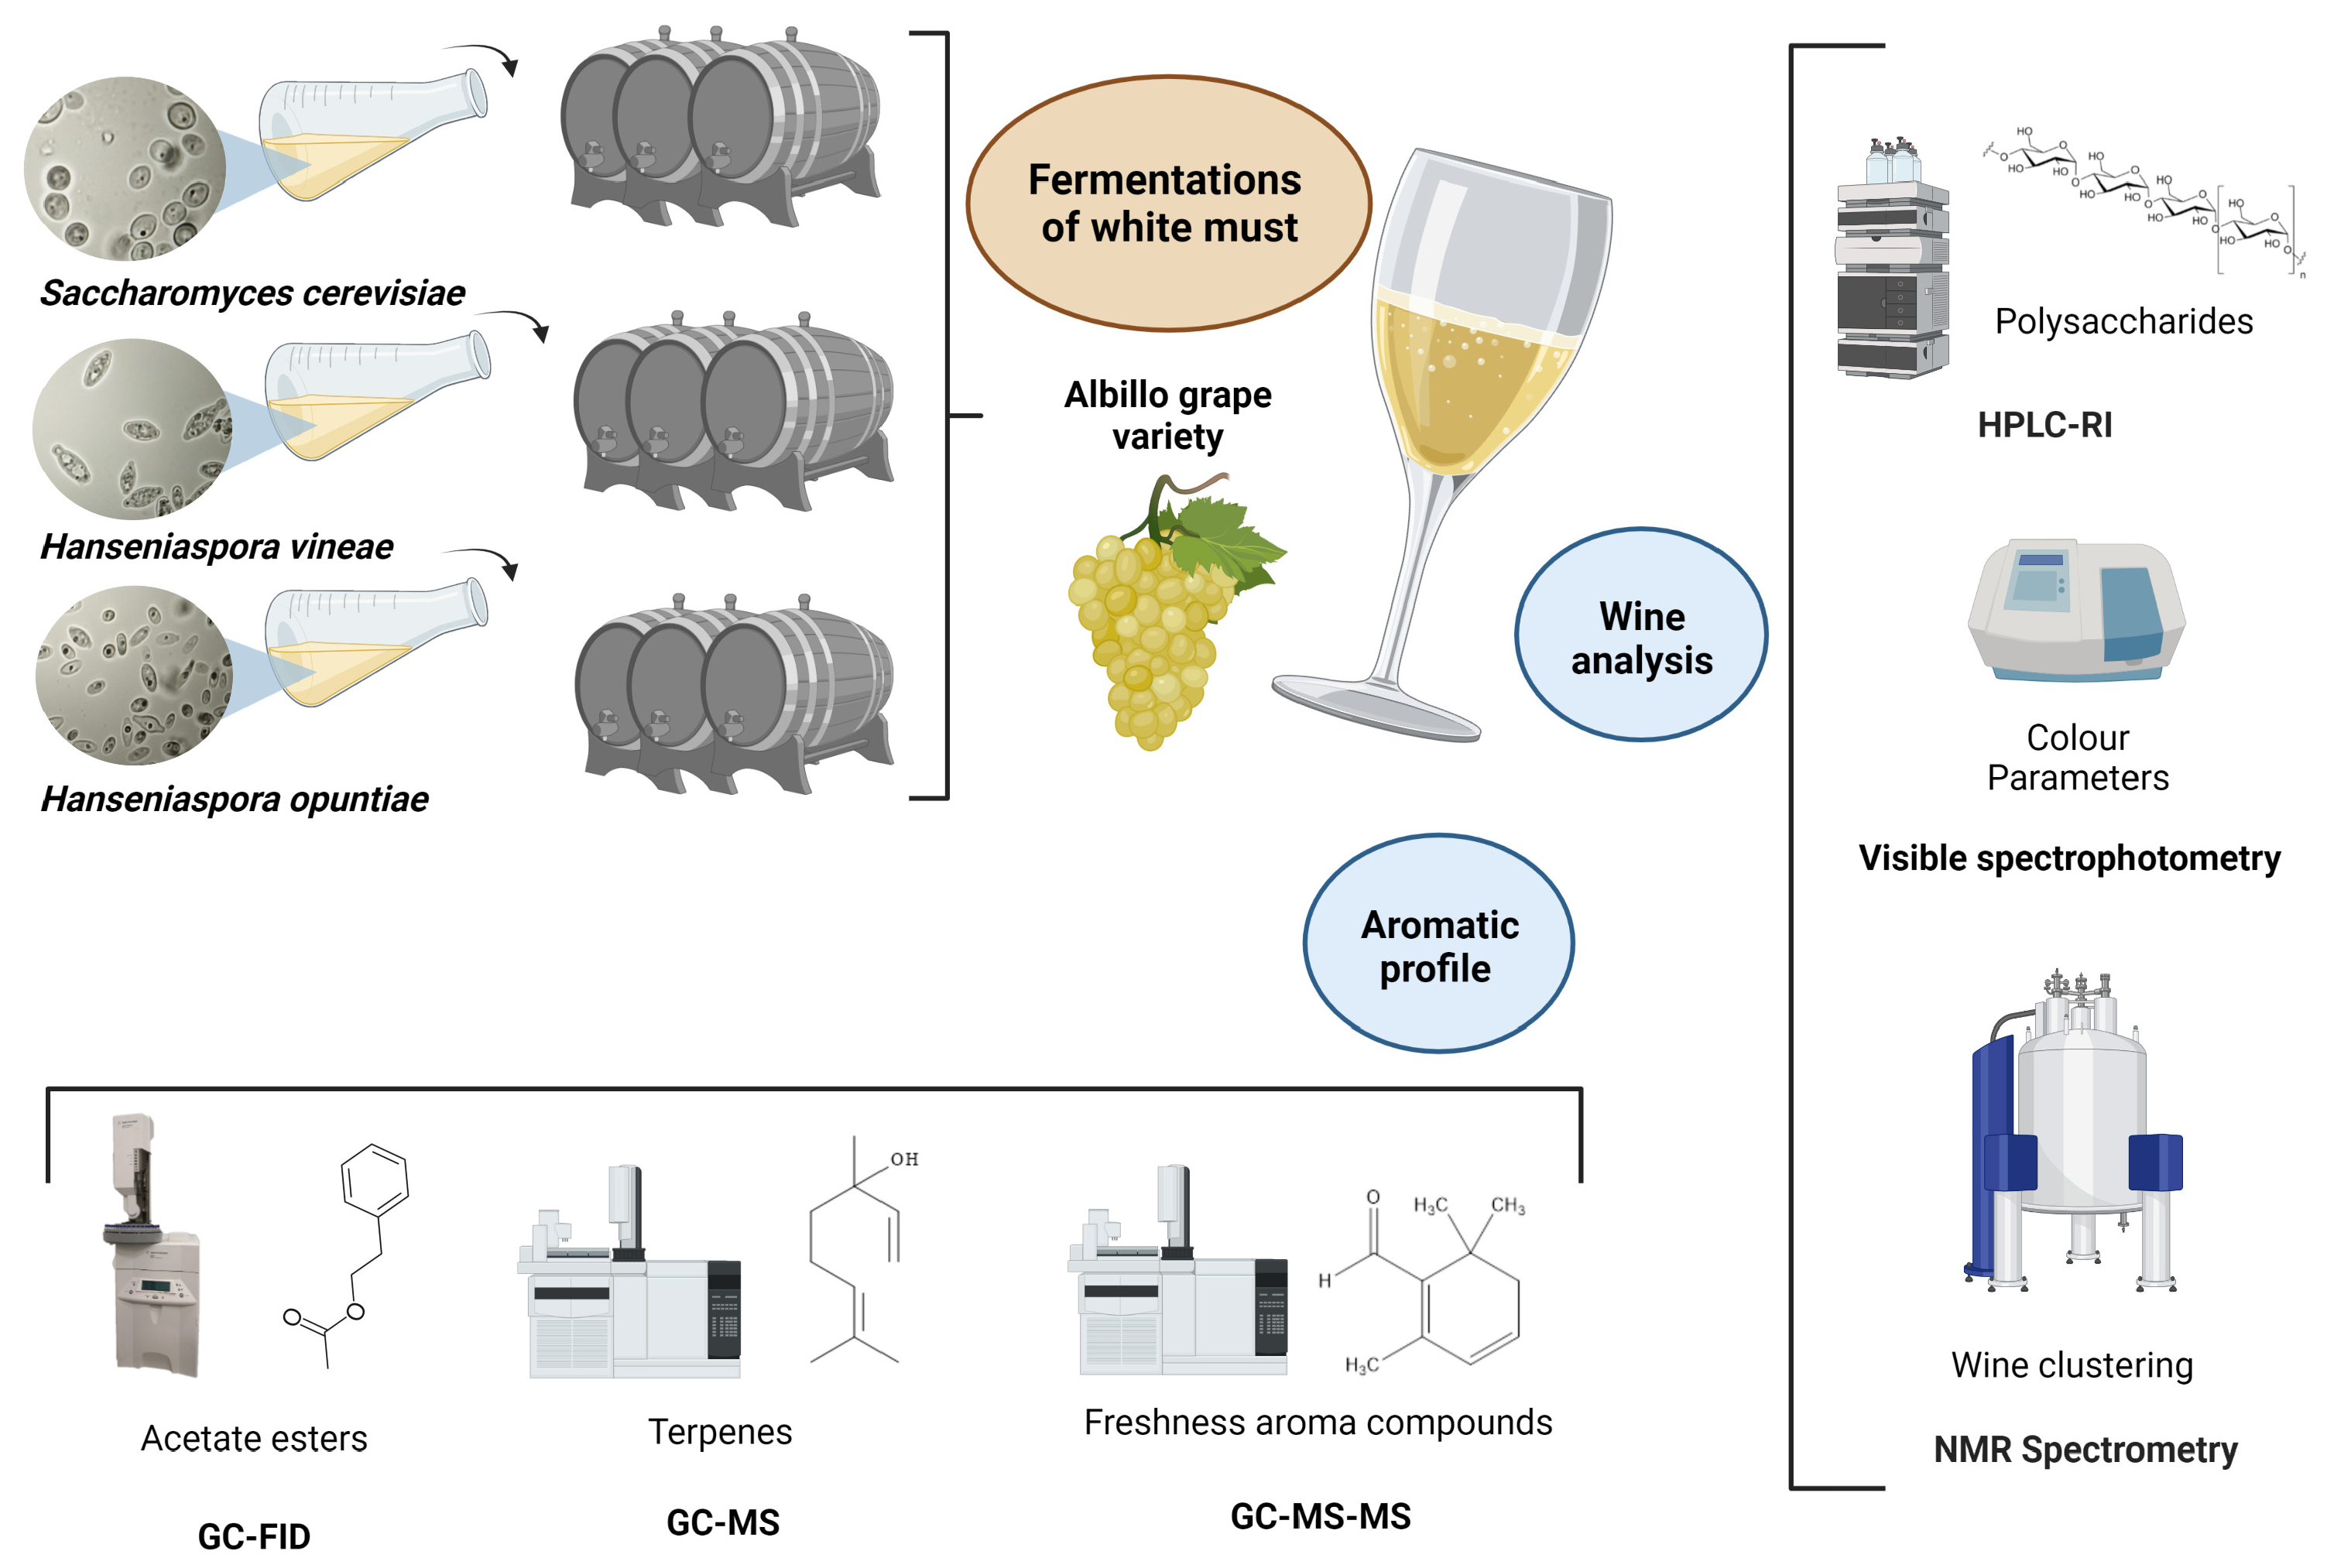
2.3. Analysis of Polysaccharides Content

The polysaccharides content was measured by the HPLC-refractive index (RI) technique, according to the method described by [28]. This method uses 0.1 M NaNO3 in deionised water (MilliQ) as an eluent. The calibration curve was constructed from the following pullulan standards: polymaltotriose (Shodex, Showa Denko K.K, Japan) was used to determine the concentration of polysaccharides in the samples—P-800 (788 kDa), P-400 (404 kDa), P-200 (212 kDa), P-100 (112 kDa), P-50 (47.3 kDa), P-20 (22.8 kDa), P-10 (11.8 kDa), and P-5 (5.9 kDa).
The equipment used was a 1100 HPLC chromatograph (Agilent Technologies, Palo Alto, CA, USA) equipped with a refractive index detector with an Ultrahydrogel 250 molecular exclusion column (Waters).

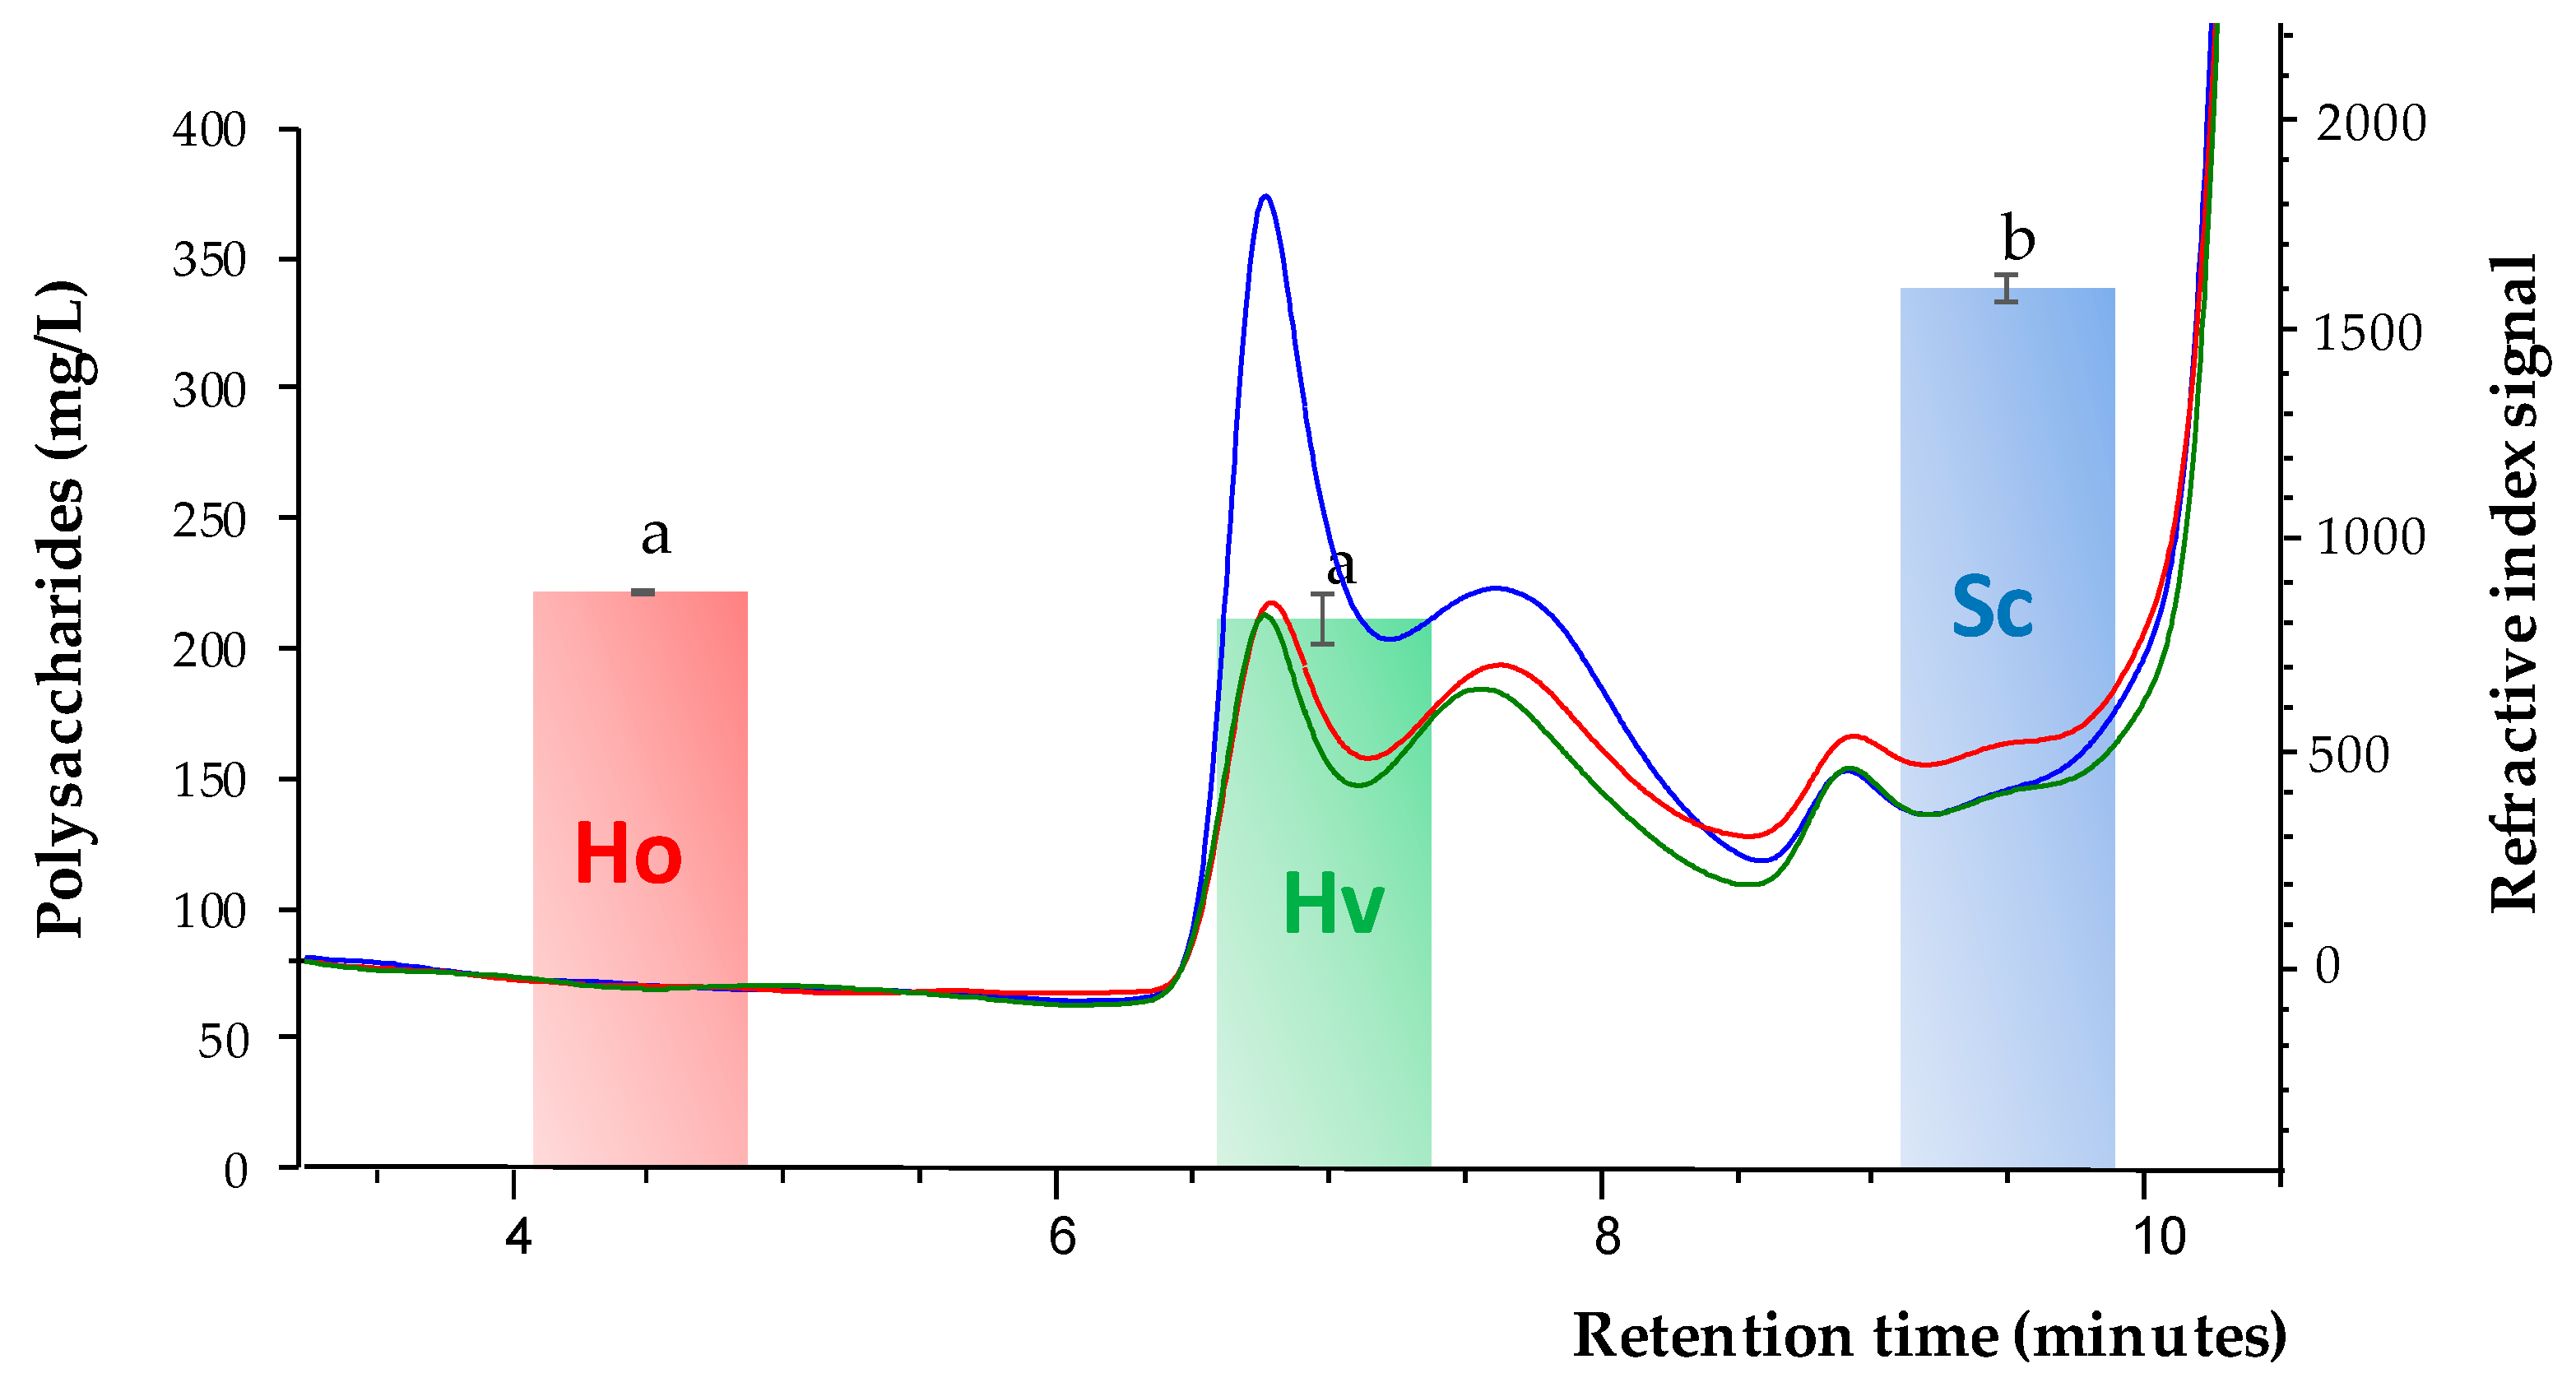
2.4. Measurement of Colour Parameters

Colour parameters were measured by visible spectrophotometry using a 1 mm plastic cuvette. The instrument used was a Smart Analysis (DNA Phone s.r.l., Parma, Italy) spectrophotometer. This instrument allows the direct measurement of absorbance at 420, 520, and 620 nm—the parameters of colour intensity, tonality, and CIELab coordinates.

2.5. Analysis of Volatile Compounds Produced by Fermentation

Fermentative volatiles were analysed by gas chromatography flame ionisation detection (GC-FID). Samples were filtered using 0.45 µm cellulose methyl ester membrane filters (Phenomenex, Madrid, Spain). One mL of filtrate was added to 100 µL of Internal Standard (4-Methyl-2-pentanol, 500 mg/L) (Fluka Chemie GmbH, Buchs, Switzerland) in a 2 mL GC vial. Analyses were performed using an Agilent Technologies 6850 GC (Palo Alto, CA, USA). The injection inlet was set at 250 °C, and the detector was set at 300 °C. A DB-624 column (60 m × 250 µm × 1.40 µm) was used with a temperature programme of 40 °C for the first 5 min, followed by a linear slope of 10 °C min−1 until 250 °C, which was held for 5 min. The runtime was 40 min per injection. Hydrogen was the carrier gas, with a flow of 22.1 mL min−1 and a split flow 1:10. The peaks were identified according to their retention time compared with the external standards; quantification was performed using a calibration curve in accordance with the method (OIV-MA-AS315-27) (OIV, 2016). The volatile compounds identified were: acetaldehyde, methanol, 1-propanol, diacetyl, ethyl acetate, 2-butanol, isobutanol, 1-butanol, acetoin, 2-methyl-1-butanol, 3-methyl-1-butanol, ethyl lactate, isobutyl acetate, 2,3-butanediol, isoamyl acetate, 2-phenylethyl acetate, and 2-phenylethyl alcohol. The limit of detection was 0.1 mg L−1. The concentration of the volatiles was expressed as mg L−1.

2.6. Analysis of Terpenes and Polyoxygenated Terpenes

Varietal aroma compounds were analysed by GC-MS. One hundred mL of centrifuged (15 min at 6.000 rpm) wine was added to 100 µL of 2-octanol (IS) and processed by solid phase extraction using a Bond Elut ENV of 500 mg and a 6 mL cartridge (Agilent Technologies, Santa Clara, CA, USA). Cartridges were conditioned (by flushing 5 mL of methanol, 5 mL of hydroalcoholic solution (12% v/v), and 5 mL of MQ water). Volatiles were eluted with pentane-dichloromethane (50%), dried, and dissolved in pentane-dichloromethane (50%) up to 200 μL. A GC 7890A (Agilent Technologies), and a Mass Spectrometer 5975C inert detector was used. Helium was used as a carrier at 2.1 mL min−1. Five μL were injected in splitless mode. A DB-WAX IU column (60 m × 0.25 mm × 0.25 μm) was used. The injector was set at 180 °C for 1 min and then increased up to 260 °C at 250 °C min−1. The column was kept at 60 °C-15 min and then at 3 °C/min. until 220 °C for 25 min. The MS fragmentor voltage was 70 eV. The analysis was performed in scan mode (m/z 10−1000). Aroma compounds were identified by their retention times and main mass fragments. The quantification was performed using internal standard patterns.

2.7. Analysis of Freshness Aroma Compounds

In white wines, the perception of freshness is related to the aromas of peppermint and fresh hay. In this respect, the freshness aroma compounds were analysed by gas chromatography with thermal desorption coupled to tandem mass spectrometry GC-MS/MS. The analyses were performed using an Agilent Technologies 7990C GC (Palo Alto, CA, USA) equipped with a thermal desorption unit, cryo-injection system (CIS-4) (Gerstel), and MPS automatic sampler (Gerstel, Mülheim a/d Ruhr, Germany). The MS/MS detector was an Agilent 7000B model.
The sample preparation was carried out with the stir bar solid extraction technique (SBSE) using a Gerstel twister. The GC was equipped with a DB-Wax UI column (60 m × 0.25 µm × 0.25 mm) using helium as the carrier gas at a flow rate of 1.5 mL/min. The mass acquisition mode was the MRM.
The compounds related to freshness aroma analysed were: limonene, menthone, menthol, pulegone, carvone, mintlactone, piperitone, eucalyptol, 4-heptenol, methyl salicylate, ethyl salicylate, ethyl benzoate, safranal, cis-hexenol, trans-hexenol, and n-hexenol.

2.8. Nuclear Magnetic Resonance Spectroscopy

All Albillo Mayor white wine samples fermented with Sc, Hv, and Ho were prepared for NMR acquisitions with the following conditions: 540 μL were dissolved in 60 μL of deuterium oxide solution with 99.9% prepared deuteration; in turn, they were mixed with 0.05% weight of sodium 3-(trimethylsilyl) propionic-2, 2, 3, 3, d4 acetate salt as an internal reference (CAS No. 7789-20-0) and 0.1% of phosphonate KH2PO4 buffer (CAS No. 7778-70-0); that was, in turn, prepared for a pH adjustment of each wine solution for a value of 3.1.
All wine NMR spectra were recorded at 14.1 Tesla of static magnetic field on a Bruker 600 AVANCE III HD spectrometer equipped with a 5 mm 1H/D BBO probe head with z-gradient.
A selective double pulsed field gradient echo (DPFGE) 1H NMR scheme for non-targeted metabolomics analysis of Albillo Mayor wines, comprising two years of vintages (2019 [14] and 2021) and three types of fermentation processes (Sc, Hv, and Ho), is noted. We do not have any data on fermentations with Ho in the 2019 vintage because this yeast was not used. A total data matrix size of 45 spectra (9 spectra per five discriminant variables) was applied for maximal discriminant capacities at the following conditions: a selective excitation of uniquely aromatic 1H spin systems (5.5–11 ppm, 3360 Hz spectral width) was conducted, as published elsewhere [29], enlisting solely the key parameters; A REBURP selective π refocusing band-selective uniform response pure phase pulse, that is flanked by two gradient pulses during an echo period that allows one to exclusively refocus the selected aromatic chemical shift range and simultaneously defocus the intense water to ethanol hydroalcoholic chemical shift range, was calibrated with the AU programmes Shapetool and NMRSIM from Bruker TopSpin 4.0.8 platform. The REBURP calibration allowed the selective excitation of a frequency range of 3360 Hz from a frequency offset of the REBURP pulse, defined at 2300 Hz in a positive sense, with respect to the carrier frequency at 4.5 ppm. These parameters permit the selective excitation of a chemical shift range between 5.5 and 11 ppm. The pulse length of the REBURP π pulse was optimised at 1900 milliseconds with a low power level pulse amplitude of 223 milliwatts. The rest of the acquisition parameters are: 64 transients collected into 262,144 complex data points, with acquisition times of 3 s and recovery delays of 2 s, which produced experimental times per wine batch of five and a half minutes.
NMR postprocessing for producing the MSA input variables was carried out as follows: ppm calibration and manual phase corrections were conducted with Bruker TopSpin 4.0.8 software; global and intermediate baseline corrections, least-square or parametric time warping NMR alignments, variable size bucketing for untargeted profiling, and data matrix normalisation were carried out with the NMRProcFlow software.

2.9. Statistical Analysis

Statgraphics v.5 software (Graphics Software Systems, Rockville, MD, USA) was used to calculate means, standard deviations, analysis of variance (ANOVA), least-significant difference (LSD) test, and principal component analysis (PCA). The LSD test was used to detect significant differences between the means. Significance was set at p < 0.05.
Multivariate statistical analysis (MSA) for NMR data pre-processing, which includes data matrix normalisation by sum (to adjust for differences amongst samples), log transformation, and autoscaling (mean centring divided by the standard deviation of each variable), was applied to remove any possible variation during the experimental phase in order to make features as comparable between them as possible. The statistical analysis workflow for obtaining the unsupervised principal component (PCA) and the supervised partial-least square discriminant analysis (PLS-DA) from the constant sum normalized DPFGE NMR data matrix were developed with Metaboanalyst 5.0 software. In all cases, T2 Hotelling’s regions depicted by ellipses in score plots of each model define a 95% confidence interval. The reliability of each classification in the supervised PLS-DA model was evaluated in terms of the goodness of fit (R2) and the goodness of prediction (Q2).

3. Results

3.1. Polysaccharides Content after the Fermentation Process

The polysaccharides present in wine are the sum of the grape polysaccharides and the yeast wall polysaccharides. From the grapes are the pectic polysaccharides: polysaccharides rich in arabinose and galactose, and rhamnogalactouronan [29] from the yeast wall the mannoproteins are the principal polysaccharides [30]. Since, in this study, the vinifications were made from the same white must, we assume that the variations in polysaccharide content were due to the transfer of cell wall polysaccharides by the yeasts studied or their interaction with the grape polysaccharides.
Figure 1 shows the chromatograms, as well as the polysaccharide content identified by liquid chromatography refractive index detection (LC-RID) for the fermentations studied. The largest peaks corresponded to Sc fermentations with polysaccharide concentrations around 300 mg/L. These values were statistically higher than those identified in wines fermented by the Hanseniaspora genus yeasts. It is interesting to note that, in previous studies, we obtained similar results after the fermentation of rosé musts [19]. These results seem to indicate that Hanseniaspora yeasts have lower polysaccharide release kinetics than Saccharomyces yeasts, with no significant differences between Hv and Ho species. Since, on the sixth day, S. cerevisiae was inoculated into the Hv and Ho barrels, it appears that the interaction of yeasts of the genus Hanseniaspora and Saccharomyces results in a lower release of polysaccharides from the latter. More studies will be necessary to understand the cell wall polysaccharide composition of these species and their sensory impact on the wines obtained.

3.2. Colour Parameters

Figure 2a shows the colour parameters measured by spectrophotometry. From absorbances at 420, 520, and 620 nm, colour intensity and the tonality parameters can be defined. The sum of these three absorbances represents the colour intensity. Lower colour intensity values were identified in the Ho fermentations, with values around 0.21 absorbance units, with no significant differences between Hv and Sc wines. In relation to tonality (A420/A520), no significant differences were identified between the fermentations studied. However, in previous research, we did find a lower tonality in rosé wines fermented with Hv compared to Sc fermentations [19]. These variations in tonality may have been due to the formation of acylated anthocyanins, which were not present in this case, as the fermentations were from white must.
Figure 2 also includes the CIELab coordinates. The uniform three-dimensional space is defined by the colourimetric coordinates L*, a*, and b*. Figure 2b graphically illustrates the L* coordinate for all the wines studied. L* is the measure of lightness and can vary from 0 (completely opaque) to 100 (completely transparent). The results obtained for this coordinate allowed the wines to be separated into three clusters. Wines fermented by Ho show L* values around 96, which is statistically higher than the values obtained for Hv and Sc wines. Hv wines show higher mean values of L* than Sc wines, but no significant differences between them, graphically shown by the overlapping of the corresponding clusters. These results are inversely proportional to the colour intensity obtained, indicating that the higher transparency of Ho wines results in lower absorbance at 520, 620, and 420 nm wavelengths.
In relation to the rest of the coordinates obtained, no significant differences in the values of a* and b* were observed; a* is a measure of redness (or −a* of greenness) and b* of yellowness (or -b* of blueness). Hue angle (H*) and chroma (C*) values are obtained from L*, a*, and b* coordinates [31]. No significant differences were found for these parameters, so the yeast used for fermentation did not seem to influence these colourimetric variables.

3.3. Volatile Compounds Produced by Fermentation

Table 1 shows the aroma compounds produced during fermentation, measured by GC-FID. In relation to the total content of these compounds, the Hv fermentations showed values of around 920 mg/L, which is significantly higher than the concentrations identified in the other fermentations (average values of 922.3 mg/L for Hv versus 771.6 mg/L and 804.1 mg/L for Ho and Sc, respectively), mostly due to the important presence of ethyl acetate in white wines treated with Hv fermentations (178.77 ± 18.07 mg/L). However, no significant differences were identified for quantitatively important compounds in wines, such as acetaldehyde, acetoin, or 2,3-butanediol.
Higher alcohols are produced by the catabolism of grape amino acids via the Ehrlich pathway or by the production of α-keto acids during amino acid biosynthesis from sugars [32]. Regarding the content of these compounds, wines fermented by yeasts of the Hanseniaspora genus showed statistically higher concentrations than Sc wines (around 180 mg/L). These concentrations are below 400 mg/L, at which point some authors consider that higher alcohols give negative organoleptic perceptions [33]. Similarly, apiculate yeasts yielded higher 3-methyl-1-butanol and 2-methyl-1-butanol contents than Sc, but this increase was only statistically significant in Ho (95 mg/L). It is interesting to note that these levels are low, as the average content of 3-methyl-1-butanol in wines varies between 90 and 300 mg/L [34]. 2-phenylethanol has a positive sensory impact in wines, which is described as ‘rose-like’ and ‘floral’ [35]. The content of this compound was found to be around 28 mg/L in wines fermented by Ho. These values are statistically higher than those identified for the other fermentations; in all cases, the concentrations were higher than their perception threshold, 10 mg/L, according to [36]. It should be noted that, in previous research, we also found no significant differences in 2-phenylethanol when comparing Sc with Hv fermentations [14].
Volatile esters are an important group of aromatic compounds and are regarded as the main source of fruity aroma in wines [37]. In relation to the total content of these compounds, concentrations up to two times higher were identified in Hv wines compared to Ho and three times higher than in Sc wines, suggesting that fermentations with Hv could result in wines with more pronounced fruity aromas. Similarly, the contents of the majority ester ethyl acetate were much higher in the Hv wines than in the other wines. It was also identified that apiculate yeasts produced higher concentrations of other esters, with a positive sensory impact in wines compared to Sc. This is the case of isoamyl acetate and its characteristic banana aroma. This also happened with 2-phenylethyl acetate content, which is a particularly important ester because of its characteristic floral aroma [38] and its low threshold of perception, 0.25 mg/L, according to [39]. The apiculate yeasts produced wines with up to 2.8 times higher 2-phenylethyl acetate content than Sc.

3.4. Terpenes and Polyoxygenated Terpenes

The varietal aromas identified in this study are shown in Table 2. Different grape varieties can be classified according to their free monoterpene content [40]. In this respect, we can classify the Albillo Mayor grape variety as neutral, as it presents values in free monoterpenes lower than 1 mg/L. In the wines studied, the total monoterpene content was higher in the Ho fermentations (≃124 mg/L), but only statistically significant compared to Hv.
Linalool is one of the most important monoterpene alcohols in wines and is characterised by its floral and lemon odour. The contents of this compound were more than two times higher in the Ho and Sc fermentations than in the Hv fermentations, only below their perception threshold (25 µg/L according to [41]) in Hv wines. The same trend was observed for the compound terpinen-4-ol, although, in all fermentations, the identified concentrations remained below the threshold of perception (250 µg/L according to [42]). However, for other terpenes, it was the apiculate yeasts (Ho and Hv) that resulted in wines with statistically higher contents than Sc. This is the case for β-citronellol and α-terpineol, with concentrations two times higher in Hanseniaspora yeast wines than in Saccharomyces wines. It should be noted that neither of these two terpenes might have a significant impact on the final aromatic profile of the wines, as the concentrations identified are below their perception thresholds, 18 and 250 µg/L, respectively [42,43].
The content of polyoxygenated terpenes was statistically higher in the Ho wines than in the rest. The largest differences were identified in the 8-hidroxylinalool compound, with up to ten times higher concentrations in Ho fermentations (Table 2). The content of polyoxygenated terpenes did not play a major role in the aromatic profile of the wines obtained, as all the concentrations identified were below the perception threshold of these compounds, which are much less aromatic than terpenes (3–5 mg/L according to [44]).

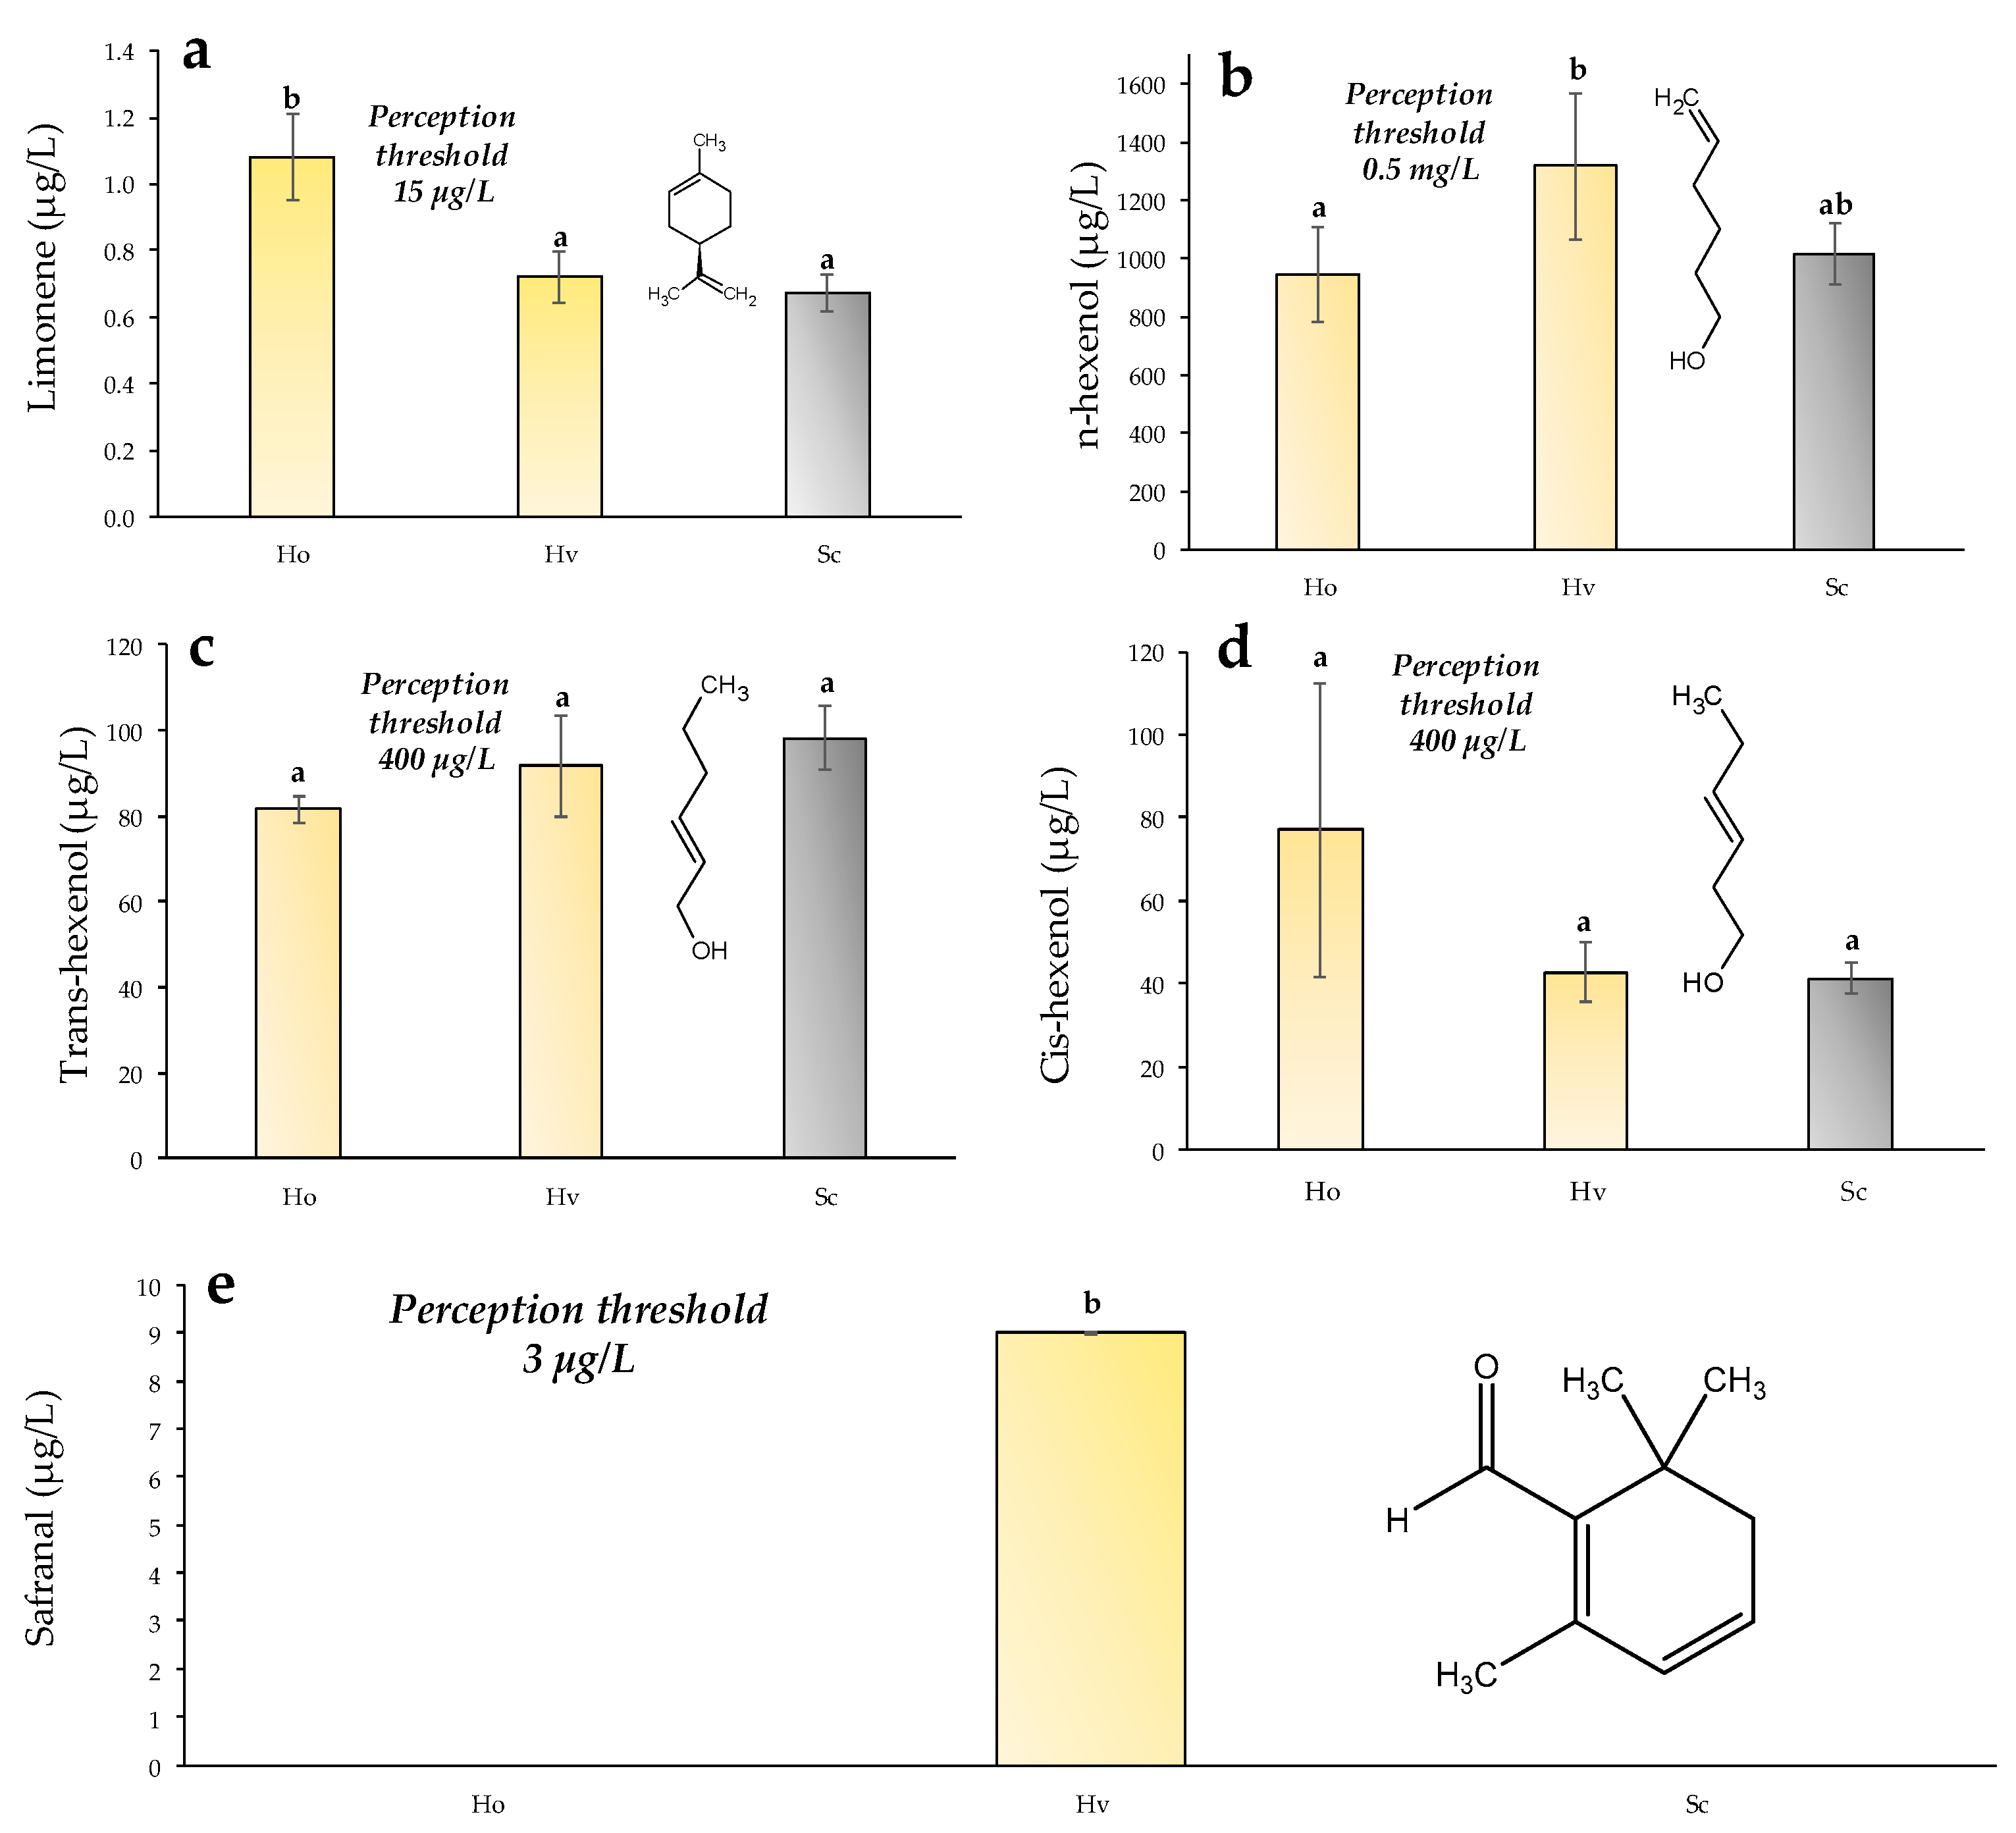
3.5. Freshness Aroma Compounds Measured with GC-MS-MS

Seventeen volatile compounds from different groups were analysed by GC-MS-MS; this analysis looks for volatile compounds associated with wine freshness, of which only five have been identified and are shown in Figure 3.
Figure 3a shows the limonene content, which is a monoterpene with a perception threshold of 15 µg/L, according to [45]. This compound is associated with orange and lemon aromas [46]. Wines fermented with Ho showed limonene concentrations of around 1.08 µg/L; these values are statistically higher than the other fermentations. However, all the wines produced showed values below the threshold of perception of the compound. Interestingly, no other monoterpenes derived from limonene, which are associated with mint, peppermint, or liquorice aroma (carvone, menthol, or pulegone), were identified.
Different C6 compounds were identified by GC-MS-MS (Figure 3b–d); these compounds are formed by enzymatic oxidation of polyunsaturated fatty acids and are often related to herbaceous aromas in wines. The highest n-hexenol concentrations were identified in Hv wines, but without significant differences from Sc wines. Regarding the trans-hexenol compound, all wines showed concentrations between 82 and 98 µg/L, with no significant differences among them. This compound has a perception threshold in water of 400 µg/L, according to [47]. No significant differences in cis-hexenol concentrations were identified. All wines showed cis-hexenol contents below the threshold of perception (400 µg/L according to [48]).
The last aroma identified by GC-MS-MS was safranal. This compound has only been detected in wines fermented with Hv (Figure 3e). The presence of safranal in wines has been little studied, although it has been identified in northern Italian sparkling wines [49]. Safranal is a C10 norisoprenoid (C10H14O) [50] that has a monoterpene aldehyde chemical structure, and it is the most powerful aroma in saffron [51,52]. This compound is formed in saffron during drying and storage by hydrolysis from picrocrocin [53]. All Hv fermented wines showed safranal concentrations around 9 µg/L, while this compound was not detected in any of the other wines studied. Additional research is needed to understand how Hv metabolism influences the formation of this potent volatile compound.

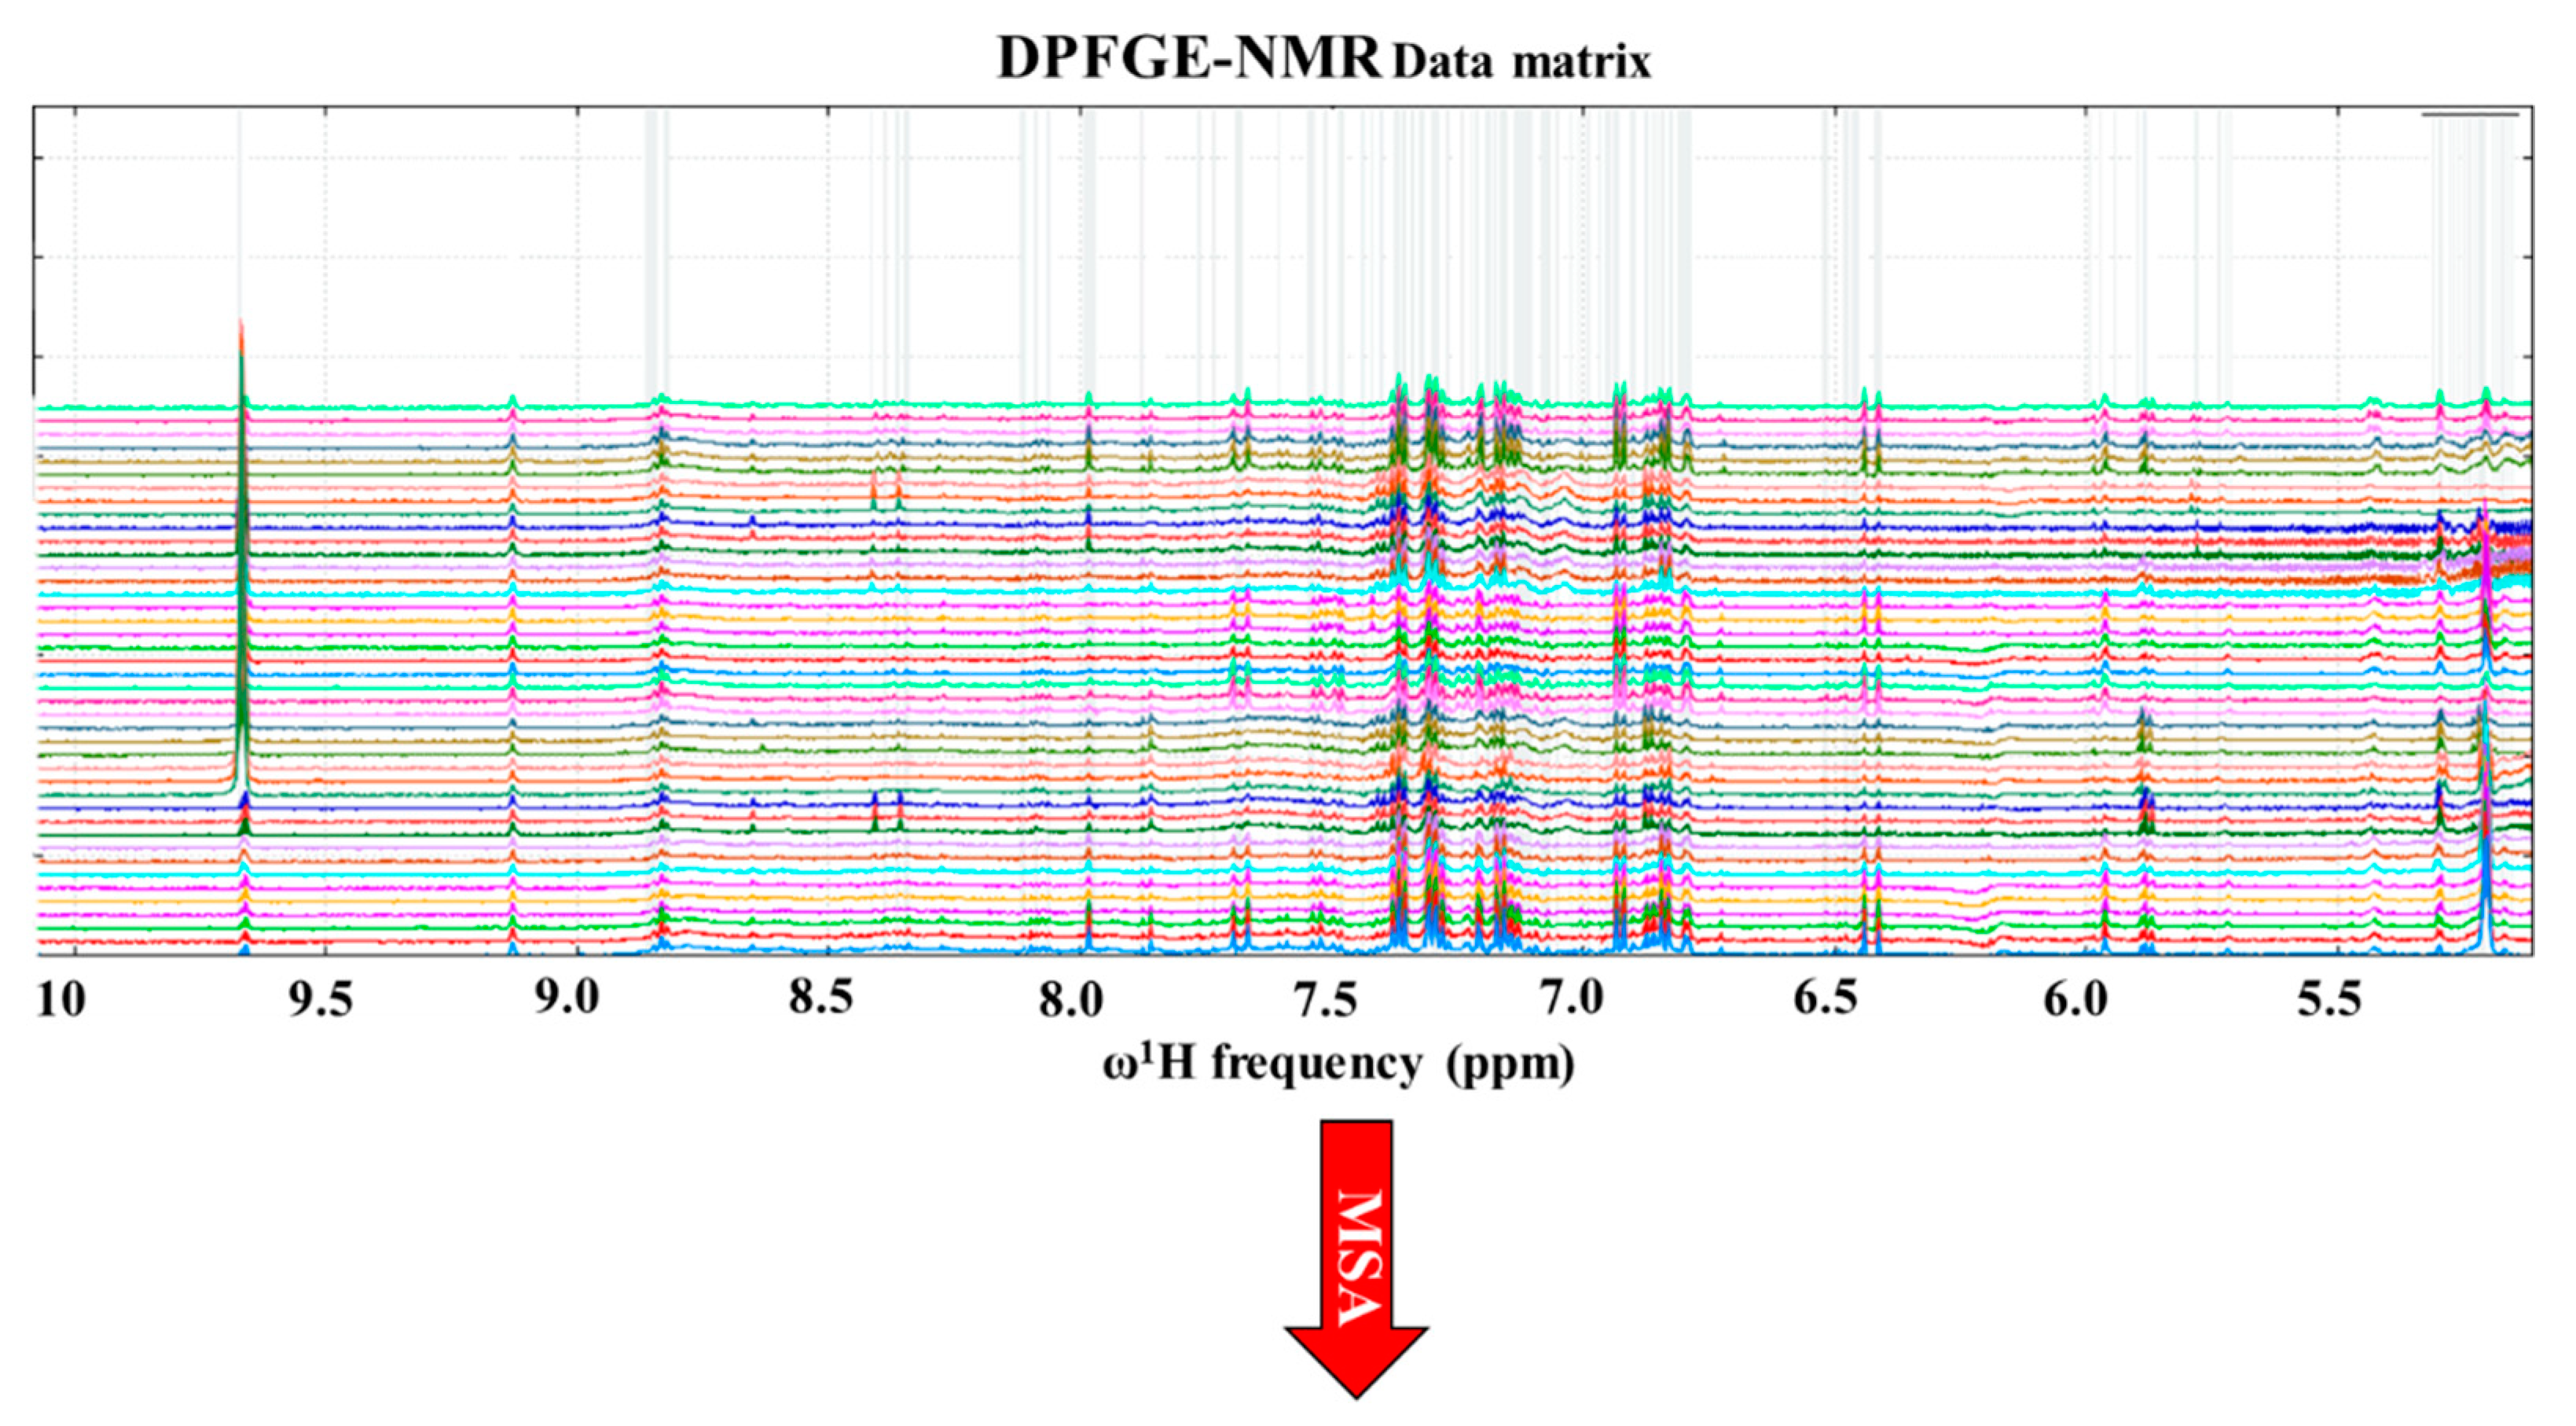
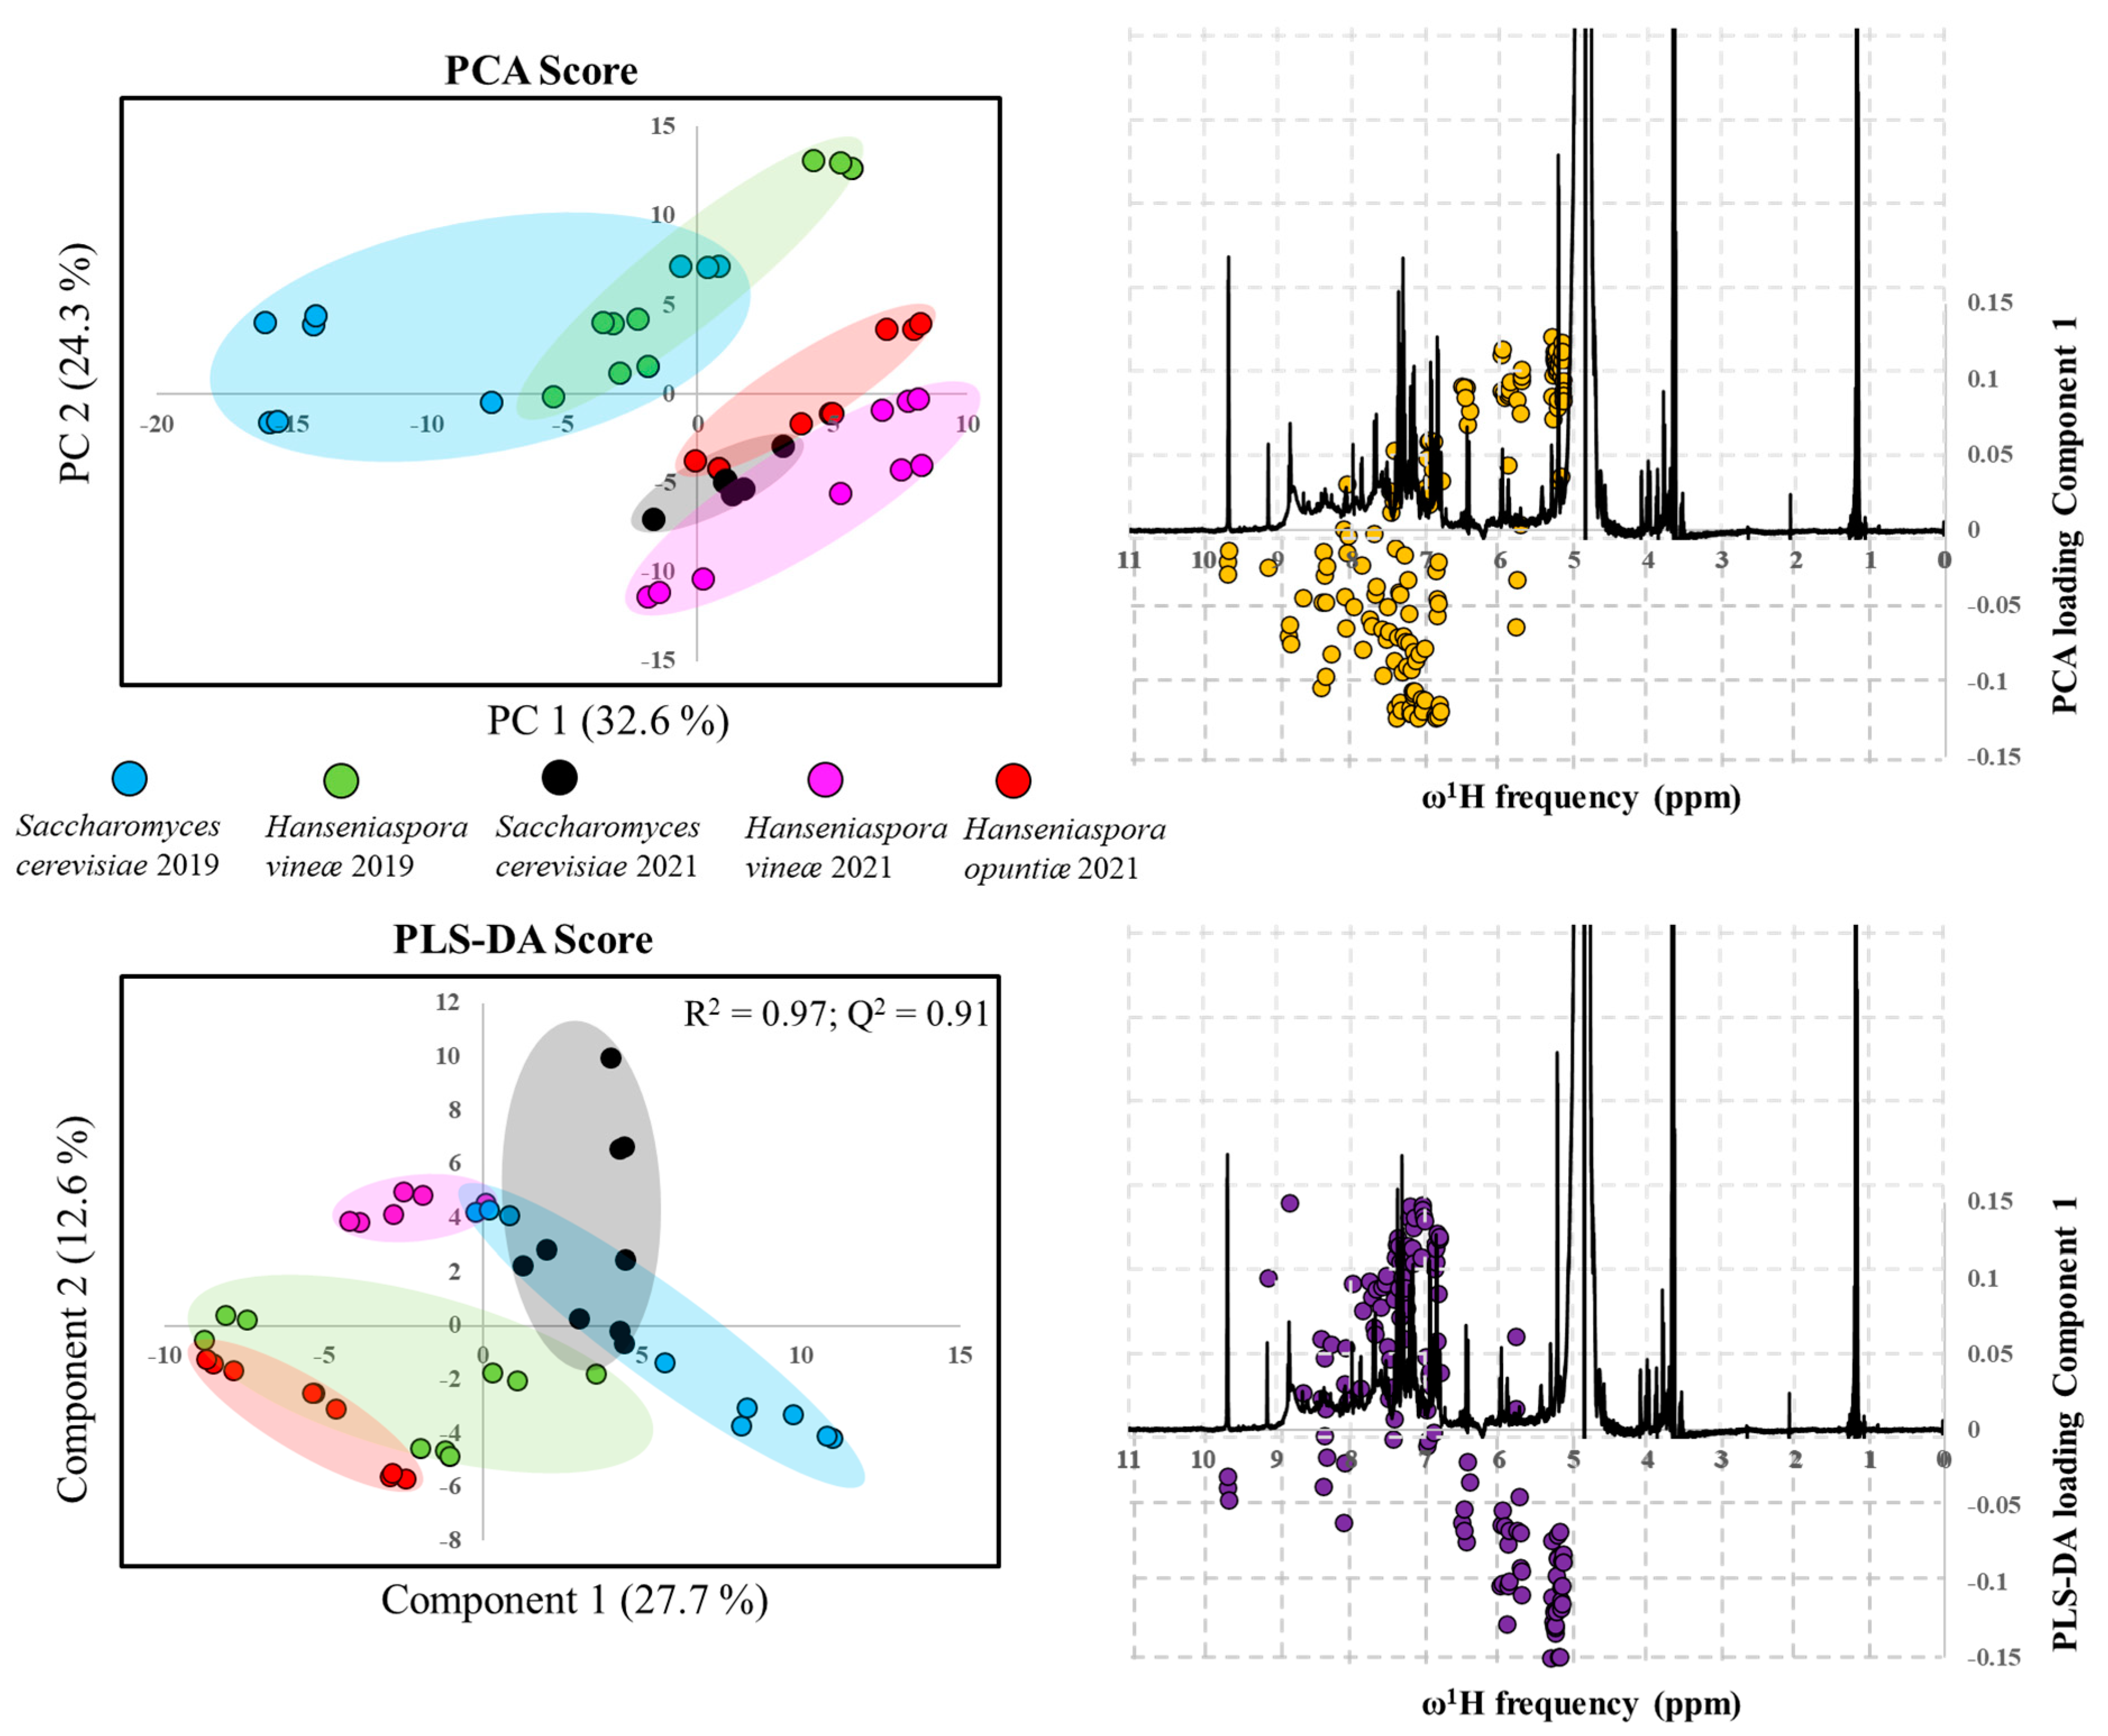
3.6. Non-targeted NMR Metabolomics of Albillo Mayor White Wines Fermented with Sc, Hv, and Ho

The novel DPFGE NMR data matrix was recently conceived to discriminate wine samples from the same grape variety (Cabernet Sauvignon), as well as the same geographical origin (Parras, Coahuila, Mexico), but which were produced with different fermentation schemes for achieving alcohol reduction in a large-scale regime for three consecutive iterations [54]. Said work concluded that wines fermented with co-inoculations using Saccharomyces cerevisiae and another strain (Starmerella bacillaris or S. bayanus) for achieving alcohol reduction can be discriminated from standard fermentations only with supervised deep learning algorithms (PLS-DA, sPLS-DA and OPLS-DA). In particular, the supervised PLS-DA approach can only discriminate between wines from the same variety and geographical origin produced with standard (Saccharomyces cerevisiae) and co-inoculated (Starmerella bacillaris or S. bayanus) fermentations, but it is incapable of producing a holistic fingerprint to afford discrimination between wines treated with Starmerella bacillaris and S. bayanus. The methodology to differentiate between standard fermentations with Saccharomyces cerevisiae and those involving a co-inoculation with Starmerella bacillaris and S. bayanus was only possible with orthogonal projections to latent structures-DA approaches.
Figure 4 shows the DPFGE NMR data matrix constructed from wine samples from the same grape variety (Albillo Mayor) and the same geographical origin (Ribera del Duero, Spain). These are fermented with three fermentation schemes (Sc, Hv, and Ho) during two different vintages (2019 and 2021), and they use the respective multivariate statistical analysis (MSA) to obtain PCA and PLS-DA discriminant scores and chemical shift discriminant loading values. It is highlighted that Ho yeast was not used in the 2019 vintage and, therefore, no data are presented. First, the principal component analysis (PCA) approach explains, in an unsupervised way, the variance of each dataset when increasing the number of principal components without referring to any class label, generally used for organising the NMR data matrix and for determining correlations between discriminant factors (fermentation schemes and year of vintages for the present study) and outliers (DPFGE-NMR data matrix), whereas an important number of metabolomic works claim the need to test the discriminant capacity of PCA models as a prerequisite to evaluate the quality of the MSA data inputs. PCA score plots of analysed Albillo Mayor white wines can straightforwardly discriminate between different years of vintage. Additionally, the 2019 samples present a positive PC2 dimensionality, while samples from the 2021 vintage show a negative PC2 coordinate. This occurs in both cases, regardless of the yeast strain. In contrast, there is no evident way to distinguish between Sc controls and Ho or Hv strains with a simple PCA approach.
To maximise separation amongst samples, the supervised PLS-DA deep learning algorithm performs variable selection and classification of key features amongst cohorts with an accurate predictive fit (R2 = 0.97) and performance (Q2 = 0.91) at competitive computational costs to obtain highly discriminant holistic fingerprints that allow distinctions between wine samples from the same variety but different fermentation schemes (e.g., Sc, Hv, and Ho in the 2021 vintage, as well as Sc and Hv in the 2019 vintage). Interestingly, Albillo Mayor wine samples fermented with Hanseniaspora strains present roughly a negative PC1 coordinate in PLS-DA score plots, regardless of their year of vintage. In contrast, samples fermented with Saccharomyces strains in the 2019 and 2021 vintages are discriminated against by means of positive PC1 scores in PLS−discriminant analysis.
Both PCA and PLS-DA loading plots (middle and bottom right in Figure 4), as a function of proton DPFGE chemical shifts, indicate component 1 thresholds associated with 1H frequencies. In turn, these are related to a set of discriminant metabolites. Although a DPFGE NMR targeted analysis is out of the scope of the present work and merits reporting in greater detail elsewhere, some important observations are mentioned here. If a PCA or PLS-DA component 1 threshold of ±0.1 is selected, a set of at least 85 discriminant NMR signals is observed. Even with a component 1 threshold of ±0.15, at least 35 proton DPFGE-NMR shifts are discriminant to either the fermentation scheme or the vintage, indicating the robustness of the DPFGE NMR data matrix and the discriminant capacity of aromatic spin systems in wine metabolomics.

4. Conclusions

The cell wall polysaccharide release capacity was lower in Hanseniaspora genus yeast than in Sc. In addition, it appears that these species interact with the polysaccharide transfer capacity of S. cerevisiae yeast. Some differences were identified in the colour of the white wines obtained; the wines fermented by Ho were more transparent and had low colour intensity.
The wines studied showed clear differences in their volatile compound profiles. Fermentations with apiculate yeasts produced wines with higher alcohols content, indicating a higher presence of 2-phenyl ethanol in Ho wines. However, Hv produced more fruit esters, but similar amounts of 2-phenylethyl acetate compared to Ho. Regarding varietal aromas, Ho yeast resulted in wines with higher monoterpene content, including limonene.
Alcoholic fermentation by Hv produced wines with safranal. The presence of this powerful aromatic compound could significantly increase the complexity of the wines. Selection of some Hanseniaspora genus yeasts is a powerful tool to provide interesting aromatic compounds to wines from neutral grape varieties, such as Albillo Mayor.
For the first time, an unsupervised PCA analysis of a DPFGE NMR data matrix produced score plots to differentiate wine samples with different vintages that have the same geographical origin and variety. However, the non-targeted metabolomic approach is limited to differentiating between fermentation schemes. In contrast, an extended supervised PLS-DA deep learning algorithm can uniquely discriminate between Sc, Hv, and Ho fermentation schemes of Albillo Mayor white wine samples from the same variety and geographical origin. The present metabolomic approach might serve to optimise diverse variables within the fermentation schemes for obtaining a multivariable space associated with the observed sensory characteristics that provide the Hanseniaspora strains with their qualities with respect to the standard fermentation schemes.

Author Contributions

J.M.d.F. performed the analysis of polysaccharides and colour and drafted the manuscript; C.E. revised and corrected the manuscript; F.C. revised and corrected the manuscript; J.E.H.-P. performed the NMR-based metabolomics workflow, including NMR acquisition, pre and postprocessing, and multivariable statistical analysis; C.V. performed the analysis of volatile compounds produced by fermentation and revised and corrected the manuscript; C.G. revised and corrected the manuscript; and A.M. designed the experiment and drafted and corrected the manuscript. All authors have read and agreed to the published version of the manuscript.

Funding

This research was funded by Project PID2021-124250OB-I00, entitled APLICACIONES INNOVADORAS DE LAS ALTAS PRESIONES PARA MEJORAR LA BIOTECNOLOGIA ENOLOGICA—ENOINNOVAPRESS. J.E.H.-P. is grateful for financial support from the Instituto Politécnico Nacional (IPN), programme “Programa Institucional de Contratación de Personal Académico de Excelencia (PICPAE)”, and programme “Estímulos al Desempeño de los Investigadores (EDI)” (EDI-IPN financial support grant No. F-00318). All the authors thank CONACyT programme (No. LN295321), “Laboratorios Nacionales”, and the CONACyT-México infrastructure grant (No. INFRA-2016 (269012)) for funding nuclear magnetic resonance experimental time.

Informed Consent Statement

Not applicable.

Data Availability Statement

All data presented in this study are available upon request by the corresponding authors. All NMR acquisition, pre-processing, and statistical outliers will be privately available in OIV NMR repositories, which are currently under progress.

Acknowledgments

EnotecUPM thanks the winemaker Rafael Cuerda and the Bodegas Comenge winery for the production of the grapes, the wine fermentations, and their control in the winery. J.E.H.P. acknowledges the Consejo Mexicano Vitivinícola and the Mexican Ministry of Agriculture (SADER) for all financial support, comprising the attention of duties related to the International Organization of Vine and Wine (OIV) (expert meetings, congresses, etc.).

Conflicts of Interest

The authors declare no conflict of interest.

Appendix A

Figure A1 shows the average fermentation kinetics of the yeasts studied in alcoholic fermentation. All the barrels showed temperatures between 12 and 16 °C throughout the fermentation process. The fermentations were very slow in all cases, with more than 50 days needed for the yeast to consume the sugars in the must. The largest decreases in density occurred during the first 14 days after inoculation. In this first stage, Ho and Sc wines showed similar kinetics. However, after the first 14 days, the Ho wines fermented more slowly than the other samples. Sc and Hv wines finished the fermentation process with similar densities (around 990 g/L at devatting). Ho wines showed a density of around 1001 g/L.
Figure A1. Fermentation kinetics of studied yeast strains in steel barrels: Ho (fermentations with H. opuntiae), Hv (fermentations with H. vineae), and Sc (fermentations with S. cerevisiae). Means ± standard deviation of three replicates.
Fermentation 08 00654 g0a1

References

  1. Garofalo, C.; Tristezza, M.; Grieco, F.; Spano, G.; Capozzi, V. From grape berries to wine: Population dynamics of cultivable yeasts associated to “Nero di Troia” autochthonous grape cultivar. World J. Microbiol. Biotechnol. 2016, 32, 59. [Google Scholar] [CrossRef] [PubMed]
  2. Martin, V.; Jose Valera, M.; Medina, K.; Boido, E.; Carrau, F. Oenological Impact of the Hanseniaspora/Kloeckera Yeast Genus on Wines—A Review. Fermentation 2018, 4, 76. [Google Scholar] [CrossRef] [Green Version]
  3. Zhang, J.; Shang, Y.; Chen, J.; Brunel, B.; Peng, S.; Li, S.; Wang, E. Diversity of non-Saccharomyces yeasts of grape berry surfaces from representative Cabernet Sauvignon vineyards in Henan Province, China. FEMS Microbiol. Lett. 2021, 368, 142. [Google Scholar] [CrossRef]
  4. Pateraki, C.; Paramithiotis, S.; Doulgeraki, A.I.; Kallithraka, S.; Kotseridis, Y.; Drosinos, E.H. Effect of sulfur dioxide addition in wild yeast population dynamics and polyphenolic composition during spontaneous red wine fermentation from Vitis vinifera cultivar Agiorgitiko. Eur. Food Res. Technol. 2014, 239, 1067–1075. [Google Scholar] [CrossRef]
  5. Valera, M.J.; Boido, E.; Dellacassa, E.; Carrau, F. Comparison of the glycolytic and alcoholic fermentation pathways of Hanseniaspora vineae with Saccharomyces cerevisiae wine yeasts. Fermentation 2020, 6, 78. [Google Scholar] [CrossRef]
  6. Viana, F.; Gil, J.V.; Vallés, S.; Manzanares, P. Increasing the levels of 2-phenylethyl acetate in wine through the use of a mixed culture of Hanseniaspora osmophila and Saccharomyces cerevisiae. Int. J. Food Microbiol. 2009, 135, 68–74. [Google Scholar] [CrossRef]
  7. Morata, A.; Arroyo, T.; Bañuelos, M.A.; Blanco, P.; Briones, A.; Cantoral, J.M.; Castrillo, D.; Cordero-Bueso, G.; Del Fresno, J.M.; Escott, C.; et al. Wine yeast selection in the Iberian Peninsula: Saccharomyces and non-Saccharomyces as drivers of innovation in Spanish and Portuguese wine industries. Crit. Rev. Food Sci. Nutr. 2022, 1–29. [Google Scholar] [CrossRef]
  8. López, S.; Mateo, J.J.; Maicas, S. Characterisation of Hanseniaspora isolates with potential aromaenhancing properties in muscat wines. South African J. Enol. Vitic. 2014, 35, 292–303. [Google Scholar] [CrossRef] [Green Version]
  9. Harlé, O.; Legrand, J.; Tesnière, C.; Pradal, M.; Mouret, J.R.; Nidelet, T. Investigations of the mechanisms of interactions between four non-conventional species with Saccharomyces cerevisiae in oenological conditions. PLoS ONE 2020, 15, 1–15. [Google Scholar] [CrossRef]
  10. Medina, K.; Boido, E.; Fariña, L.; Gioia, O.; Gomez, M.E.; Barquet, M.; Gaggero, C.; Dellacassa, E.; Carrau, F. Increased flavour diversity of Chardonnay wines by spontaneous fermentation and co-fermentation with Hanseniaspora vineae. Food Chem. 2013, 141, 2513–2521. [Google Scholar] [CrossRef]
  11. Giorello, F.; Valera, M.J.; Martin, V.; Parada, A.; Salzman, V.; Camesasca, L.; Fariña, L.; Boido, E.; Medina, K.; Dellacassa, E.; et al. Genomic and transcriptomic basis of Hanseniaspora vineae’s impact on flavor diversity and wine quality. Appl. Environ. Microbiol. 2019, 85, 1–18. [Google Scholar] [CrossRef] [PubMed] [Green Version]
  12. Carrau, F.; Henschke, P.A. Hanseniaspora vineae and the Concept of Friendly Yeasts to Increase Autochthonous Wine Flavor Diversity. Front. Microbiol. 2021, 12, 1–8. [Google Scholar] [CrossRef] [PubMed]
  13. Martin, V.; Valera, M.J.; Medina, K.; Dellacassa, E.; Schneider, R.; Boido, E.; Carrau, F. Application of Hanseniaspora vineae to improve white wine quality. In White Wine Technology, 1st ed.; Morata, A., Ed.; Academic Press: Cambridge, MA, USA, 2021; pp. 99–115. ISBN 9780128236550. [Google Scholar]
  14. Del Fresno, J.M.; Escott, C.; Loira, I.; Herbert-Pucheta, J.E.; Schneider, R.; Carrau, F.; Cuerda, R.; Morata, A. Impact of Hanseniaspora vineae in alcoholic fermentation and ageing on lees of high-quality whitewine. Fermentation 2020, 6, 66. [Google Scholar] [CrossRef]
  15. Viana, F.; Belloch, C.; Vallés, S.; Manzanares, P. Monitoring a mixed starter of Hanseniaspora vineae-Saccharomyces cerevisiae in natural must: Impact on 2-phenylethyl acetate production. Int. J. Food Microbiol. 2011, 151, 235–240. [Google Scholar] [CrossRef]
  16. Morata, A.; Escott, C.; Bañuelos, M.A.; Loira, I.; del Fresno, J.M.; González, C.; Suárez-Lepe, J.A. Contribution of Non-Saccharomyces Yeasts to Wine Freshness. A Review. Biomolecules 2019, 10, 34. [Google Scholar] [CrossRef] [PubMed] [Green Version]
  17. Martin, V.; Giorello, F.; Fariña, L.; Minteguiaga, M.; Salzman, V.; Boido, E.; Aguilar, P.; Gaggero, C.; Dellacassa, E.S.; Mas, A.; et al. De novo Synthesis of Benzenoid Compounds by the yeast Hanseniaspora vineae Increases Flavor Diversity of Wines. J. Agric. Food Chem. 2016, 64, 4574–4583. [Google Scholar] [CrossRef] [Green Version]
  18. Fresno, J.M.D.; Escott, C.; Loira, I.; Carrau, F.; Cuerda, R.; Schneider, R.; Bañuelos, M.A.; González, C.; Suárez-Lepe, J.A.; Morata, A. The impact of Hanseniaspora vineae fermentation and ageing on lees on the terpenic aromatic profile of white wines of the Albillo variety. Int. J. Mol. Sci. 2021, 22, 2195. [Google Scholar] [CrossRef] [PubMed]
  19. Del Fresno, J.M.; Loira, I.; Escott, C.; Carrau, F.; González, C.; Cuerda, R.; Morata, A. Application of Hanseniaspora vineae yeast in the production of rosé wines from a blend of tempranillo and Albillo grapes. Fermentation 2021, 7, 141. [Google Scholar] [CrossRef]
  20. Morata, A.; Loira, I.; González, C.; Escott, C. Non-saccharomyces as biotools to control the production of off-flavors in wines. Molecules 2021, 26, 4571. [Google Scholar] [CrossRef]
  21. Luan, Y.; Zhang, B.Q.; Duan, C.Q.; Yan, G.L. Effects of different pre-fermentation cold maceration time on aroma compounds of Saccharomyces cerevisiae co-fermentation with Hanseniaspora opuntiae or Pichia kudriavzevii. LWT Food Sci. Technol. 2018, 92, 177–186. [Google Scholar] [CrossRef]
  22. Bourbon-Melo, N.; Palma, M.; Rocha, M.P.; Ferreira, A.; Bronze, M.R.; Elias, H.; Sá-Correia, I. Use of Hanseniaspora guilliermondii and Hanseniaspora opuntiae to enhance the aromatic profile of beer in mixed-culture fermentation with Saccharomyces cerevisiae. Food Microbiol. 2021, 95, 103678. [Google Scholar] [CrossRef]
  23. Sternes, P.R.; Lee, D.; Kutyna, D.R.; Borneman, A.R. Genome sequences of three species of Hanseniaspora isolated from spontaneous wine fermentations. Genome Announc. 2016, 4, 6. [Google Scholar] [CrossRef] [PubMed] [Green Version]
  24. Ruiz-Moyano, S.; Martín, A.; Villalobos, M.C.; Calle, A.; Serradilla, M.J.; Córdoba, M.G.; Hernández, A. Yeasts isolated from figs (Ficus carica L.) as biocontrol agents of postharvest fruit diseases. Food Microbiol. 2016, 57, 45–53. [Google Scholar] [CrossRef]
  25. Varela, C.; Borneman, A.R. Yeasts found in vineyards and wineries. Yeast 2017, 34, 111–128. [Google Scholar] [CrossRef]
  26. Morata, A.; Escott, C.; Loira, I.; Manuel Del Fresno, J.M.; Vaquero, C.; Antonia Bañuelos, M.; Palomero, F.; López, C.; González, C. pH Control and Aroma Improvement Using the Non- Saccharomyces Lachancea thermotolerans and Hanseniaspora spp. Yeasts to Improve Wine Freshness in Warm Areas. In Grapes and Wine; Intechopen: London, UK, 2022. [Google Scholar] [CrossRef]
  27. Bunduki, M.M.C.; Flanders, K.J.; Donnelly, C.W. Metabolic and structural sites of damage in heat- and sanitizer-lnjured populations of listeria monocytogenes. J. Food Prot. 1995, 58, 410–415. [Google Scholar] [CrossRef] [PubMed]
  28. Loira, I.; Vejarano, R.; Morata, A.; Ricardo-Da-Silva, J.M.; Laureano, O.; González, M.C.; Suárez-Lepe, J.A. Effect of Saccharomyces strains on the quality of red wines aged on lees. Food Chem. 2013, 139, 1044–1051. [Google Scholar] [CrossRef] [PubMed]
  29. Jones-Moore, H.R.; Jelley, R.E.; Marangon, M.; Fedrizzi, B. The polysaccharides of winemaking: From grape to wine. Trends Food Sci. Technol. 2021, 111, 731–740. [Google Scholar] [CrossRef]
  30. Fornairon-Bonnefond, C.; Camarasa, C.; Moutounet, M.; Salmon, J.M. New trends on yeast autolysis and wine ageing on lees: A bibliographic review. J. Int. Sci. Vigne Vin 2002, 36, 49–69. [Google Scholar] [CrossRef] [Green Version]
  31. Prez-Magario, S.; Gonzalez-SanJose, M.L. Prediction of red and rosé wine CIELab parameters from simple absorbance measurements. J. Sci. Food Agric. 2002, 82, 1319–1324. [Google Scholar] [CrossRef]
  32. Hazelwood, L.A.; Daran, J.M.; Van Maris, A.J.A.; Pronk, J.T.; Dickinson, J.R. The Ehrlich pathway for fusel alcohol production: A century of research on Saccharomyces cerevisiae metabolism. Appl. Environ. Microbiol. 2008, 74, 2259–2266. [Google Scholar] [CrossRef] [Green Version]
  33. Rapp, A.; Versini, G. Influence of nitrogen compounds in grapes on aroma compounds of wines. Dev. Food Sci. 1995, 37, 1659–1694. [Google Scholar] [CrossRef]
  34. Suárez Lepe, J.A.; Morata Barrado, A. Levaduras Para Vinificación En Tinto, 1st ed.; AMV Ediciones: Madrid, Spain, 2015; pp. 94–98. ISBN 9788494345197. [Google Scholar]
  35. Swiegers, J.H.; Bartowsky, E.J.; Henschke, P.A.; Pretorius, I.S. Yeast and bacterial modulation of wine aroma and flavour. Aust. J. Grape Wine Res. 2005, 11, 139–173. [Google Scholar] [CrossRef]
  36. Martínez-García, R.; García-Martínez, T.; Puig-Pujol, A.; Mauricio, J.C.; Moreno, J. Changes in sparkling wine aroma during the second fermentation under CO2 pressure in sealed bottle. Food Chem. 2017, 237, 1030–1040. [Google Scholar] [CrossRef]
  37. Sumby, K.M.; Grbin, P.R.; Jiranek, V. Microbial modulation of aromatic esters in wine: Current knowledge and future prospects. Food Chem. 2010, 121, 1–16. [Google Scholar] [CrossRef]
  38. Lleixà, J.; Martín, V.; Portillo, M.D.C.; Carrau, F.; Beltran, G.; Mas, A. Comparison of fermentation and wines produced by inoculation of Hanseniaspora vineae and Saccharomyces cerevisiae. Front. Microbiol. 2016, 7, 138. [Google Scholar] [CrossRef] [PubMed] [Green Version]
  39. Carrau, F.M.; Medina, K.; Farina, L.; Boido, E.; Henschke, P.A.; Dellacassa, E. Production of fermentation aroma compounds by Saccharomyces cerevisiae wine yeasts: Effects of yeast assimilable nitrogen on two model strains. FEMS Yeast Res. 2008, 8, 1196–1207. [Google Scholar] [CrossRef] [PubMed] [Green Version]
  40. Mateo, J.J.; Jiménez, M. Monoterpenes in grape juice and wines. J. Chromatogr. A. 2000, 881, 557–567. [Google Scholar] [CrossRef]
  41. Culleré, L.; López, R.; Ferreira, V. The Instrumental Analysis of Aroma-Active Compounds for Explaining the Flavor of Red Wines. In Red Wine Technology, 1st ed; Morata, A., Ed.; Academic Press: Cambridge, MA, USA, 2021; pp. 283–307. ISBN 9780128144008. [Google Scholar]
  42. Ferreira, V.; López, R.; Cacho, J.F. Quantitative determination of the odorants of young red wines from different grape varieties. J. Sci. Food Agric. 2000, 80, 1659–1667. [Google Scholar] [CrossRef]
  43. Jenko, M.; Čuš, F. The Influence of Yeast Strains on the Composition and Sensory Quality of Gewürztraminer Wine. Food Technol. Biotechnol. 2013, 51, 547–553. [Google Scholar]
  44. Marais, J. Terpenes in the Aroma of Grapes and Wines: A Review. South African J. Enol. Vitic. 2017, 4, 49–58. [Google Scholar] [CrossRef]
  45. Zalacain, A.; Marín, J.; Alonso, G.L.; Salinas, M.R. Analysis of wine primary aroma compounds by stir bar sorptive extraction. Talanta 2007, 71, 1610–1615. [Google Scholar] [CrossRef] [PubMed]
  46. Wang, J.; Capone, D.L.; Wilkinson, K.L.; Jeffery, D.W. Chemical and sensory profiles of rosé wines from Australia. Food Chem. 2016, 196, 682–693. [Google Scholar] [CrossRef]
  47. Guth, H. Quantitation and Sensory Studies of Character Impact Odorants of Different White Wine Varieties. J. Agric. Food Chem. 1997, 45, 3027–3032. [Google Scholar] [CrossRef]
  48. Ruiz, J.; Kiene, F.; Belda, I.; Fracassetti, D.; Marquina, D.; Navascués, E.; Calderón, F.; Benito, A.; Rauhut, D.; Santos, A.; et al. Effects on varietal aromas during wine making: A review of the impact of varietal aromas on the flavor of wine. Appl. Microbiol. Biotechnol. 2019, 103, 7425–7450. [Google Scholar] [CrossRef]
  49. Carlin, S.; Vrhovsek, U.; Franceschi, P.; Lotti, C.; Bontempo, L.; Camin, F.; Toubiana, D.; Zottele, F.; Toller, G.; Fait, A.; et al. Regional features of northern Italian sparkling wines, identified using solid-phase micro extraction and comprehensive two-dimensional gas chromatography coupled with time-of-flight mass spectrometry. Food Chem. 2016, 208, 68–80. [Google Scholar] [CrossRef] [PubMed]
  50. Heidarbeigi, K.; Mohtasebi, S.S.; Foroughirad, A.; Ghasemi-Varnamkhasti, M.; Rafiee, S.; Rezaei, K. Detection of adulteration in saffron samples using electronic nose. Int. J. Food Prop. 2015, 18, 1391–1401. [Google Scholar] [CrossRef]
  51. Amanpour, A.; Sonmezdag, A.S.; Kelebek, H.; Selli, S. GC–MS–olfactometric characterization of the most aroma-active components in a representative aromatic extract from Iranian saffron (Crocus sativus L.). Food Chem. 2015, 182, 251–256. [Google Scholar] [CrossRef]
  52. Save, S.S.; Rachineni, K.; Hosur, R.V.; Choudhary, S. Natural compound safranal driven inhibition and dis-aggregation of α-synuclein fibrils. Int. J. Biol. Macromol. 2019, 141, 585–595. [Google Scholar] [CrossRef]
  53. Castellar, M.R.; Montijano, H.; Manjón, A.; Iborra, J.L. Preparative high-performance liquid chromatographic purification of saffron secondary metabolites. J. Chromatogr. A 1993, 648, 187–190. [Google Scholar] [CrossRef]
  54. Herbert-Pucheta, J.E.; Lozada-Ramírez, J.D.; Ortega-Regules, A.E.; Hernández, L.R.; de Parrodi, C.A. Nuclear magnetic resonance metabolomics with double pulsed-field-gradient echo and automatized solvent suppression spectroscopy for multivariate data matrix applied in novel wine and juice discriminant analysis. Molecules 2021, 26, 4146. [Google Scholar] [CrossRef]
Figure 1. Polysaccharides (mg/L) and chromatograms measured by molecular exclusion liquid chromatography refractive index detection (LC-RID). Ho (red histogram: fermentations with H. opuntiae); Hv (green histogram: fermentations with H. vineae); and Sc (blue histogram: fermentations with S. cerevisiae). Bars with the same letter are not significantly different (p < 0.05) for average and standard deviation (ANOVA analysis, n = 3).
Fermentation 08 00654 g001
Figure 2. Colour parameter values and CIELAB coordinates (a) and lightness representation (b) measured by UV-visible Spectrophotometry. Ho (H. opuntiae); Hv (fermentations with H. vineae); and Sc (fermentations with S. cerevisiae). Values in the same column with the same letter are not significantly different (p < 0.05) for average and standard deviation (ANOVA analysis, n = 3).
Fermentation 08 00654 g002
Figure 3. Volatile compounds measured by GC-MS-MS (µg/L): Limonene content (a); n-hexenol (b); trans-hexenol (c); cis-hexenol (d); and safranal (e). Ho (fermentations with H. opuntiae); Hv (fermentations with H. vineae); and Sc (fermentations with S. cerevisiae). Different letters above columns indicate values with statistical differences (p < 0.05) for average and standard deviation (ANOVA analysis, n = 3).
Fermentation 08 00654 g003
Figure 4. Top: The double pulsed field gradient echo NMR data matrix [54] of Albillo Mayor wine samples fermented with Sc, Hv, and Ho during two years of vintage (2019 and 2021), showing the NMR binning strategy for further analysis with multivariate statistical analysis (MSA) to obtain a non-targeted metabolomic model to discriminate wines from the same variety with subtle discriminant variables, such as the fermentation process and the year of vintage. Middle: unsupervised principal component analysis (PCA). Bottom: supervised partial least square discriminant analysis (PLS−DA) score (left) and loading (right) plots. The PLS−DA score plot highlights the goodness of both the fit (R2) and the prediction (Q2) and, for each model, their variances at each component are expressed in parentheses. Both unsupervised PCA and supervised PLS−DA loading plots, as a function of 1H NMR frequency shifts, indicate the importance of relevant metabolites that discriminate fermentation processes and year of vintage and are, respectively, highlighted with yellow and purple dots.
Fermentation 08 00654 g004aFermentation 08 00654 g004b
Table 1. Fermentation volatile compounds (mg/L), measured by GC-FID. Means ± standard deviation of three replicates. Different letters in the same row indicate values with statistical differences (p < 0.05) for average and standard deviation (ANOVA analysis, n = 3).
Compound HoHvSc
Carbonyl compoundsAcetaldehyde31.29 ± 2.91 a35.50 ± 4.28 a37.23 ± 4.48 a
Diacetyl (butane-2,3-dione)1.66 ± 0.05 a2.12 ± 0.49 a4.73 ± 1.06 b
Acetoin (3-hydroxybutan-2-one)6.95 ± 0.16 a7.10 ± 0.34 a7.56 ± 0.57 a
2,3-Butanediol (butane-2,3-diol)408.33 ± 75.31 a426.62 ± 17.24 a491.23 ± 28.55 a
Higher alcohols1-Propanol (propan-1-ol)10.74 ± 0.16 a22.46 ± 3.11 b9.97 ± 0.66 a
Isobutanol (2-methylpropan-1-ol)20.64 ± 1.61 a22.06 ± 0.63 a19.37 ± 1.73 a
3-Methyl-1-butanol (2-methylbutan-1-ol)94.95 ± 5.04 b93.82 ± 3.32 ab84.20 ± 6.43 a
2-Methyl-1-butanol (3-methylbutan-1-ol)27.78 ± 3.58 b25.43 ± 1.29 ab21.52 ± 0.71 a
2 phenyl ethanol (2-phenylethanol)28.30 ± 0.93 b17.00 ± 0.51 a18.28 ± 4.88 a
Total higher alcohols182.41 ± 6.40 b180.78 ± 4.45 b153.35 ± 8.00 a
EstersEthyl acetate48.35 ± 2.04 a178.77 ± 18.07 b44.37 ± 5.67 a
Isobutyl acetate2.56 ± 2.22 a1.75 ± 1.58 a1.24 ± 1.07 a
ethyl butyrate1.40 ± 0.04 b1.31 ± 0.06 a1.41 ± 0.01 b
Ethyl lactate (2-hydroxypropanoate)6.51 ± 0.90 a8.71 ± 1.94 ab13.15 ± 4.25 b
Isoamyl acetate5.37 ± 0.70 b4.55 ± 0.34 b2.92 ± 0.12 a
2-Phenylethyl acetate41.85 ± 1.59 b39.87 ± 7.51 b14.72 ± 4.06 a
Total esters106.03 ± 1.11 b234.96 ± 13.66 c77.80 ± 8.11 a
Other alcoholsMethanol31.04 ± 2.82 a31.52 ± 9.63 a27.93 ± 4.66 a
Hexanol (hexan-1-ol)3.87 ± 0.19 a4.39 ± 0.27 b4.30 ± 0.19 ab
Total volatiles 771.59 ± 70.50 a923.00 ± 40.06 b804.14 ± 22.40 a
Table 2. Terpenes and polyoxygenated terpenes (µg/L) by GC-MS. Ho (fermentations with H. opuntiae); Hv (fermentations with H. vineae); and Sc (fermentations with S. cerevisiae). Mean ± standard deviation of three replicates. Different letters in the same row indicate values with statistical differences (p < 0.05) for average and standard deviation (ANOVA analysis, n = 3).
Compound (µg/L) HoHvSc
TERPENESlinalool39.07 ± 0.16 b14.55 ± 2.49 a31.53 ± 9.65 b
terpinen-4-ol29.00 ± 6.25 b14.69 ± 7.61 a24.91 ± 5.55 ab
Epoxylinalool10.04 ± 1.74 a12.76 ± 3.41 ab17.39 ± 3.53 b
β-citronellol10.93 ± 1.83 b10.56 ± 1.66 b5.55 ± 1.94 a
geraniol13.14 ± 1.35 a15.06 ± 1.50 a15.93 ± 5.67 a
α-terpineol21.92 ± 2.70 b23.71 ± 3.68 b7.80 ± 1.64 a
Total terpenes124.10 ± 5.96 b91.32 ± 12.23 a103.11 ± 20.47 ab
POLYOXYGENATED TERPENEScis-linalool oxide2.57 ± 0.16 b3.52 ± 0.14 c0.73 ± 0.15 a
trans-linalool oxide0.49 ± 0.20 a0.56 ± 0.17 a0.38 ± 0.07 a
cis-pyran linalool oxide29.15 ± 3.25 b20.06 ± 2.81 a20.92 ± 2.48 a
trans-pyran linalool oxide24.53 ± 4.92 a19.66 ± 5.82 a26.09 ± 2.69 a
2,6-dimethyl-3,7-octadiene-2,6-diol6.68 ± 0.35 b3.59 ± 0.21 a3.20 ± 0.13 a
2,6-dimethyl-1,7-octadiene-3,6-diol6.40 ± 1.31 b1.39 ± 0.64 a0.92 ± 0.08 a
3,7-dimethyl-1,7-octanediol1.59 ± 0.90 a1.57 ± 0.94 a1.05 ± 0.11 a
8-hidroxylinalool 62.40 ± 3.61 b8.90 ± 1.88 a6.17 ± 0.85 a
Total polyoxygenated terpenes 133.82 ± 7.11 b59.24 ± 8.60 a59.46 ± 3.47 a
Publisher’s Note: MDPI stays neutral with regard to jurisdictional claims in published maps and institutional affiliations.

