
Effect of Hydraulic Retention Time and Organic-Loading Rate on Two-Staged, Semi-Continuous Mesophilic Anaerobic Digestion of Food Waste during Start-Up


Abstract
:1. Introduction
2. Materials and Methods
2.1. Substrate and Inoculum
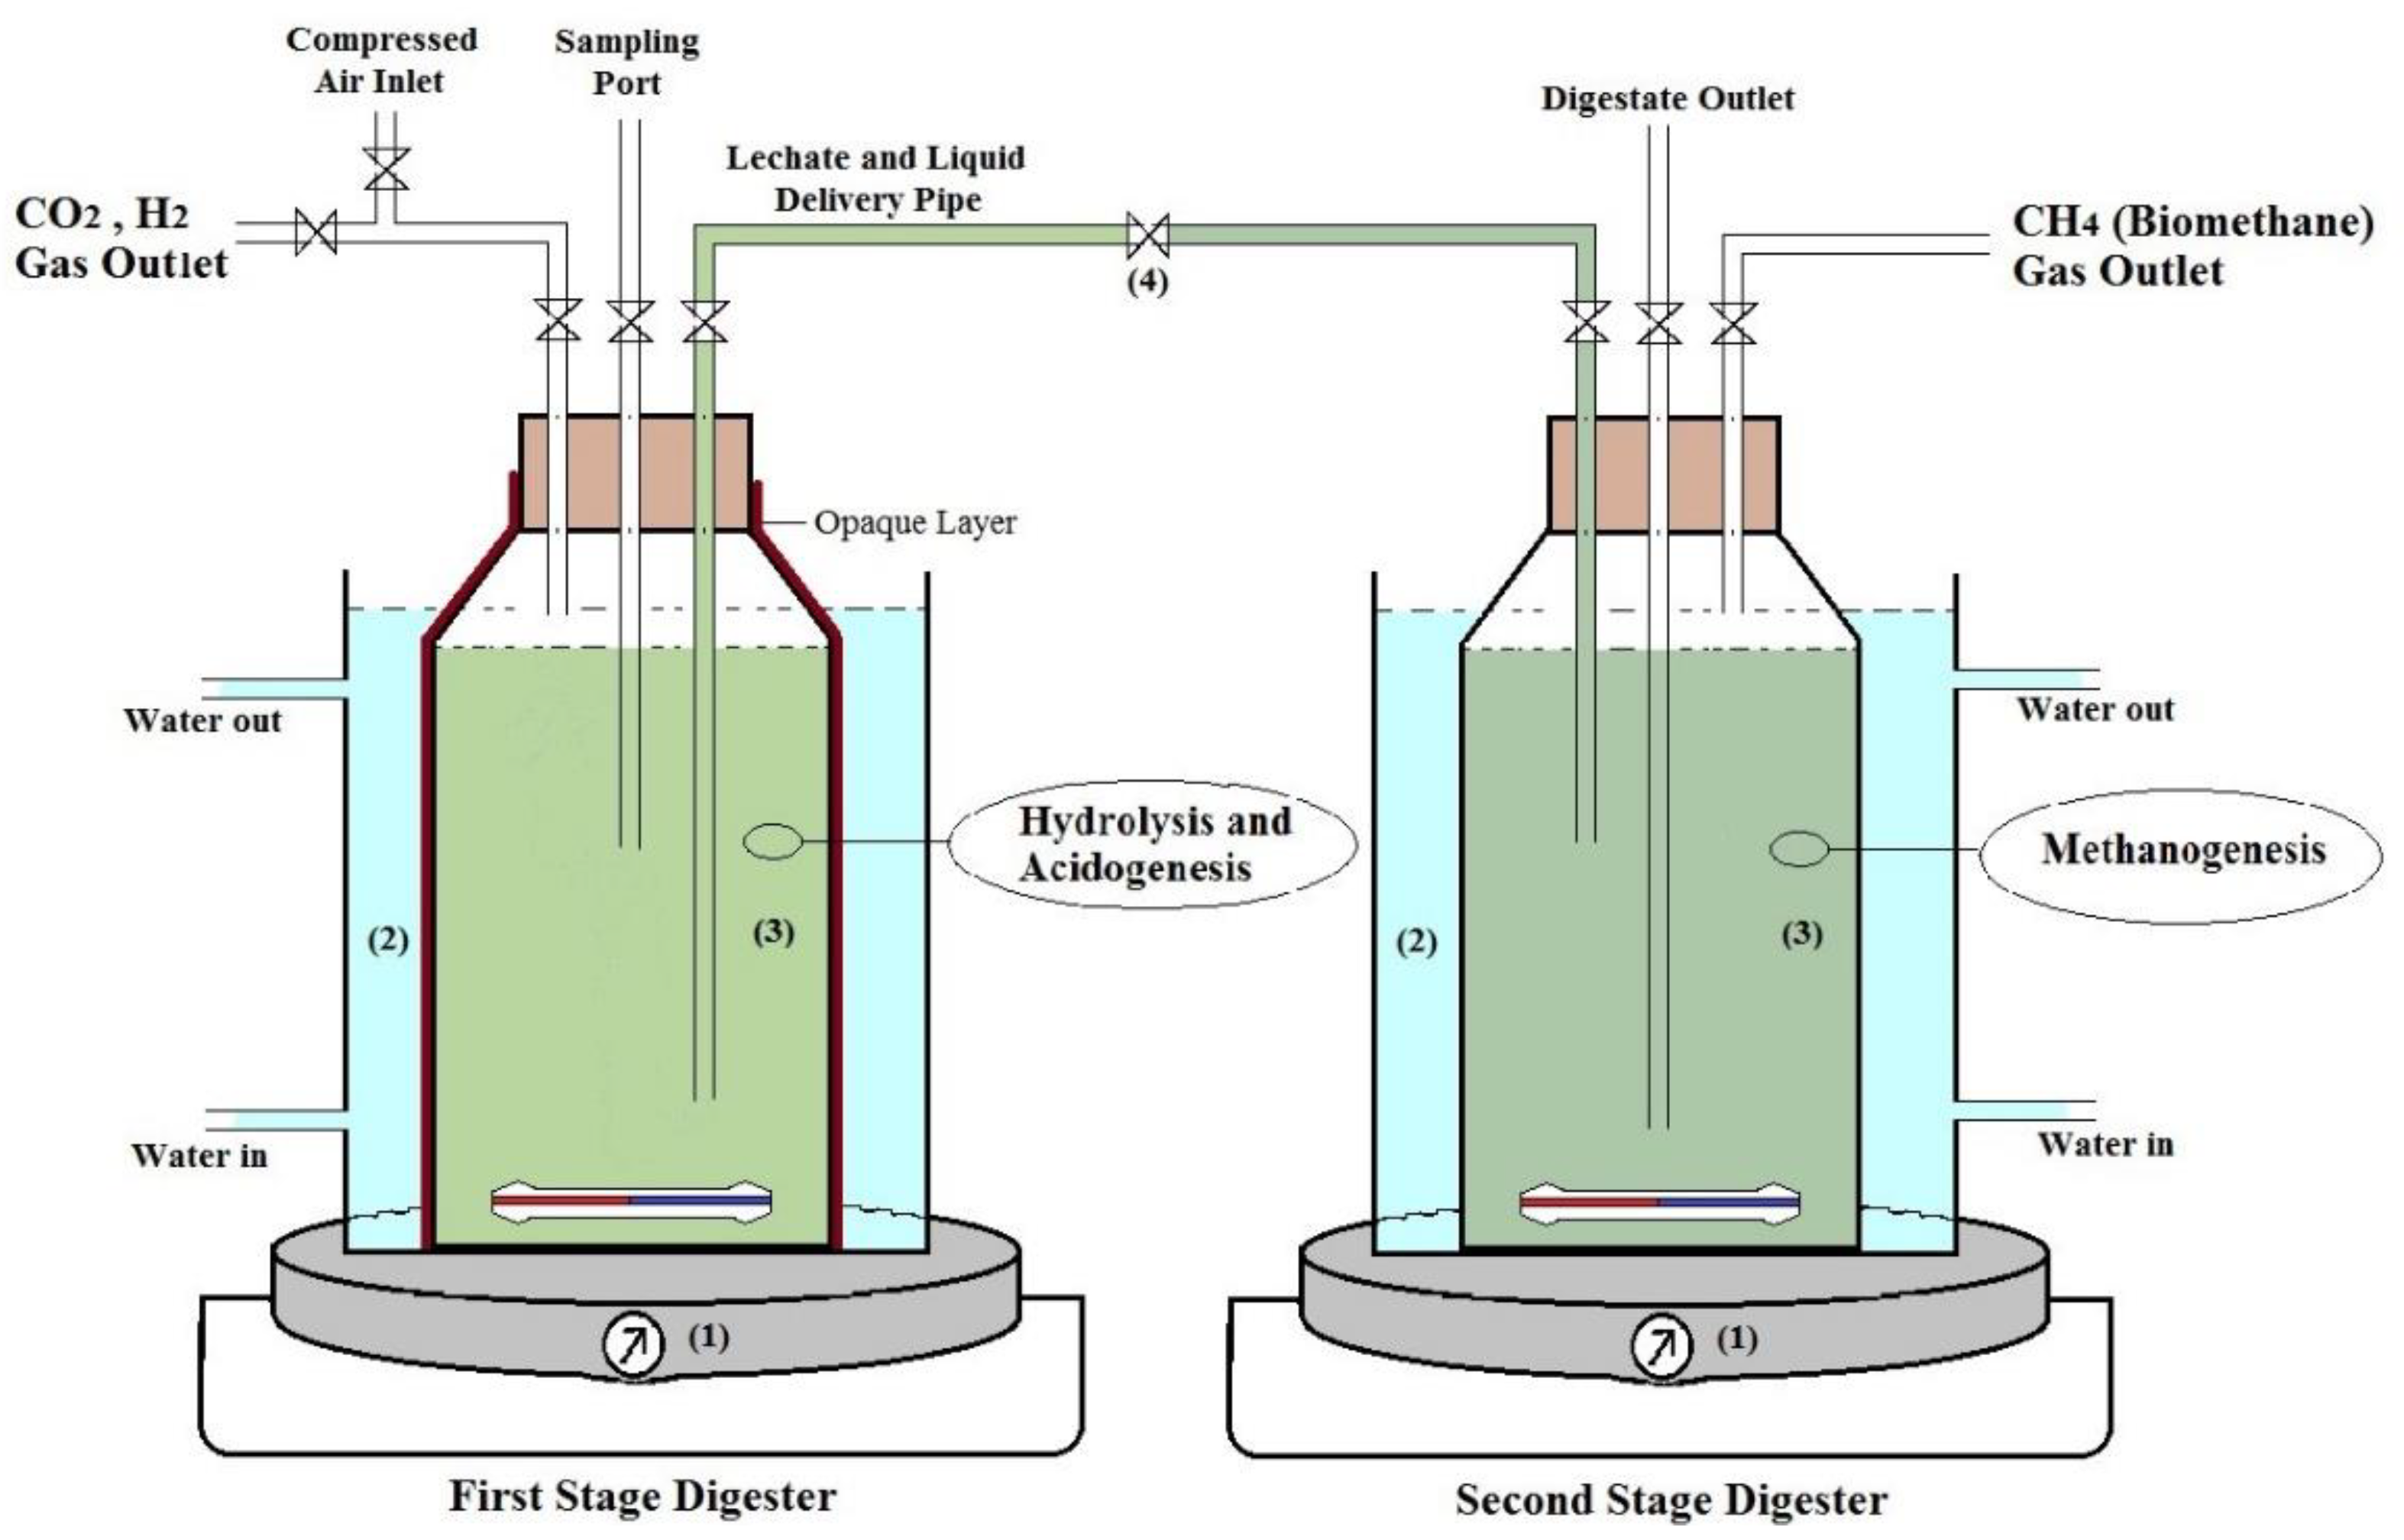
2.2. Experimental Setup
2.3. Analytical Methods
3. Results and discussions
3.1. Performance Evaluation of the First Stage after 18 Days of Installation
3.2. Performance Evaluation of the Second Stage after 18 Days of Installation
3.3. Performance Evaluation after System Restart
3.4. Considerations of this Study on FW-Based, two-Staged AD System Startup in the Context of a Circular Economy
4. Conclusions
Author Contributions
Funding
Institutional Review Board Statement
Informed Consent Statement
Data Availability Statement
Acknowledgments
Conflicts of Interest
References
- Hidalgo, D.; Sastre, E.; GÓmez, M.; Nieto, P. Evaluation of pre-treatment processes for increasing biodegradability of agro-food wastes. Environ. Technol. 2012, 33, 1497–1503. [Google Scholar] [CrossRef] [PubMed]
- Esteban-Gutiérrez, M.; Garcia-Aguirre, J.; Irizar, I.; Aymerich, E. From sewage sludge and agri-food waste to VFA: Individual acid production potential and up-scaling. Waste Manag. 2018, 77, 203–212. [Google Scholar] [CrossRef] [PubMed]
- Arafat, H.A.; Jijakli, K.; Ahsan, A. Environmental performance and energy recovery potential of five processes for municipal solid waste treatment. J. Clean. Prod. 2015, 105, 233–240. [Google Scholar] [CrossRef]
- García-Depraect, O.; Gómez-Romero, J.; León-Becerril, E.; López-López, A. A novel biohydrogen production process: Co-digestion of vinasse and Nejayote as complex raw substrates using a robust inoculum. Int. J. Hydrog. Energy 2017, 42, 5820–5831. [Google Scholar] [CrossRef]
- Dhamodharan, K.; Kumar, V.; Kalamdhad, A.S. Effect of different livestock dungs as inoculum on food waste anaerobic digestion and its kinetics. Bioresour. Technol. 2015, 180, 237–241. [Google Scholar] [CrossRef]
- Rivière, D.; Desvignes, V.; Pelletier, E.; Chaussonnerie, S.; Guermazi, S.; Weissenbach, J.; Li, T.; Camacho, P.; Sghir, A. Towards the definition of a core of microorganisms involved in anaerobic digestion of sludge. ISME J. 2009, 3, 700–714. [Google Scholar] [CrossRef] [Green Version]
- Schober, G.; Schäfer, J.; Schmid-Staiger, U.; Trösch, W. One and two-stage digestion of solid organic waste. Water Res. 1999, 33, 854–860. [Google Scholar] [CrossRef]
- Hans, M.; Kumar, S. Biohythane production in two-stage anaerobic digestion system. Int. J. Hydrog. Energy 2019, 44, 17363–17380. [Google Scholar] [CrossRef]
- Srisowmeya, G.; Chakravarthy, M.; Nandhini Devi, G. Critical considerations in two-stage anaerobic digestion of food waste—A review. Renew. Sustain. Energy Rev. 2020, 119, 109587. [Google Scholar] [CrossRef]
- Silva, F.M.S.; Mahler, C.F.; Oliveira, L.B.; Bassin, J.P. Hydrogen and methane production in a two-stage anaerobic digestion system by co-digestion of food waste, sewage sludge and glycerol. Waste Manag. 2018, 76, 339–349. [Google Scholar] [CrossRef]
- Begum, S.; Anupoju, G.R.; Sridhar, S.; Bhargava, S.K.; Jegatheesan, V.; Eshtiaghi, N. Evaluation of single and two stage anaerobic digestion of landfill leachate: Effect of pH and initial organic loading rate on volatile fatty acid (VFA) and biogas production. Bioresour. Technol. 2018, 251, 364–373. [Google Scholar] [CrossRef] [PubMed]
- Massanet-Nicolau, J.; Dinsdale, R.; Guwy, A.; Shipley, G. Utilising biohydrogen to increase methane production, energy yields and process efficiency via two stage anaerobic digestion of grass. Bioresour. Technol. 2015, 189, 379–383. [Google Scholar] [CrossRef] [PubMed]
- Kim, I.; Jung, J.; Jeong, Y.; Lee, Y.; Ahn, K. Increasing Anaerobic Digestion Efficiency Using Food-Waste-Based Biochar. Fermentation 2022, 8, 282. [Google Scholar]
- Magdalena, J.A.; Angenent, L.T.; Usack, J.G. The Measurement, Application, and Effect of Oxygen in Microbial Fermentations: Focusing on Methane and Carboxylate Production. Fermentation 2022, 8, 138. [Google Scholar] [CrossRef]
- Policastro, G.; Luongo, V.; Fabbricino, M. Biohydrogen and poly-β-hydroxybutyrate production by winery wastewater photofermentation: Effect of substrate concentration and nitrogen source. J. Environ. Manage. 2020, 271, 111006. [Google Scholar] [CrossRef]
- Policastro, G.; Giugliano, M.; Luongo, V.; Napolitano, R.; Fabbricino, M. Carbon catabolite repression occurrence in photo fermentation of ethanol-rich substrates. J. Environ. Manage. 2021, 297, 113371. [Google Scholar] [CrossRef]
- Zeb, I.; Ma, J.; Mehboob, F.; Kafle, G.K.; Amin, B.A.Z.; Nazir, R.; Ndegwa, P.; Frear, C. Kinetic and microbial analysis of methane production from dairy wastewater anaerobic digester under ammonia and salinity stresses. J. Clean. Prod. 2019, 219, 797–808. [Google Scholar] [CrossRef]
- Deepanraj, B.; Sivasubramanian, V.; Jayaraj, S. Kinetic study on the effect of temperature on biogas production using a lab scale batch reactor. Ecotoxicol. Environ. Saf. 2015, 121, 100–104. [Google Scholar] [CrossRef]
- Zhang, J.; Luo, W.; Wang, Y.; Li, G.; Liu, Y.; Gong, X. Anaerobic cultivation of waste activated sludge to inoculate solid state anaerobic co-digestion of agricultural wastes: Effects of different cultivated periods. Bioresour. Technol. 2019, 294, 122078. [Google Scholar] [CrossRef]
- Demichelis, F.; Tommasi, T.; Deorsola, F.A.; Marchisio, D.; Fino, D. Effect of inoculum origin and substrate-inoculum ratio to enhance the anaerobic digestion of organic fraction municipal solid waste (OFMSW). J. Clean. Prod. 2022, 351, 131539. [Google Scholar] [CrossRef]
- Li, W.; Loh, K.C.; Zhang, J.; Tong, Y.W.; Dai, Y. Two-stage anaerobic digestion of food waste and horticultural waste in high-solid system. Appl. Energy 2018, 209, 400–408. [Google Scholar] [CrossRef]
- Hung, Y.-T.; Salman, H.; Lo, H.H.; Awad, A. Potato Wastewater Treatment. In Handbook of Industrial and Hazardous Waste Treatment; Wang, L.K., Hung, Y.-T., Howard, H., Lo, H.H., Yapijakis, C., Eds.; CRC Press Taylor and Francis Group: Boca Raton, FL, USA, 2004; pp. 193–254. ISBN 978-0-203-02651-9. [Google Scholar]
- Al-Sulaimi, I.N.; Nayak, J.K.; Alhimali, H.; Sana, A.; Al-Mamun, A. Effect of volatile fatty acids accumulation on biogas production by sludge-feeding thermophilic anaerobic digester and predicting process parameters. Fermentation 2022, 8, 184. [Google Scholar] [CrossRef]
- Wang, L.; Zhou, Q.; Li, F.T. Avoiding propionic acid accumulation in the anaerobic process for biohydrogen production. Biomass Bioenergy 2006, 30, 177–182. [Google Scholar] [CrossRef]
- Costa, A.; Tangorra, F.M.; Zaninelli, M.; Oberti, R.; Cavalchini, A.G.; Savoini, G.; Lazzari, M. Evaluating an e-nose ability to detect biogas plant efficiency: A case study. Ital. J. Anim. Sci. 2016, 15, 116–123. [Google Scholar] [CrossRef] [Green Version]
- Ghimire, A.; Frunzo, L.; Pontoni, L.; D’Antonio, G.; Lens, P.N.L.; Esposito, G.; Pirozzi, F. Dark fermentation of complex waste biomass for biohydrogen production by pretreated thermophilic anaerobic digestate. J. Environ. Manage. 2015, 152, 43–48. [Google Scholar] [CrossRef]
- Khanh Nguyen, V.; Kumar Chaudhary, D.; Hari Dahal, R.; Hoang Trinh, N.; Kim, J.; Chang, S.W.; Hong, Y.; Duc La, D.; Nguyen, X.C.; Hao Ngo, H.; et al. Review on pretreatment techniques to improve anaerobic digestion of sewage sludge. Fuel 2021, 285, 119105. [Google Scholar] [CrossRef]
- Bastidas-Oyanedel; Juan-Rodrigo; Schmidt, J.E. Biorefinery: Integrated Sustainable Processes for Biomass Conversion to Biomaterials, Biofuels, and Fertilizers; Bastidas-Oyanedel, J.-R., Schmidt, J.E., Eds.; Springer International Publishing: Cham, Switzerland, 2019; ISBN 978-3-030-10960-8. [Google Scholar]
- Jaman, K.; Amir, N.; Musa, M.A.; Zainal, A.; Yahya, L.; Wahab, A.M.A.; Suhartini, S.; Marzuki, T.N.T.M.; Harun, R.; Idrus, S. Anaerobic digestion, codigestion of food waste, and chicken dung: Correlation of kinetic parameters with digester performance and on-farm electrical energy generation potential. Fermentation 2022, 8, 28. [Google Scholar] [CrossRef]
- Ghimire, A.; Sposito, F.; Frunzo, L.; Trably, E.; Escudié, R.; Pirozzi, F.; Lens, P.N.L.; Esposito, G. Effects of operational parameters on dark fermentative hydrogen production from biodegradable complex waste biomass. Waste Manag. 2016, 50, 55–64. [Google Scholar] [CrossRef]
- Park, Y.; Hong, F.; Cheon, J.; Hidaka, T.; Tsuno, H. Comparison of thermophilic anaerobic digestion characteristics between single-phase and two-phase systems for kitchen garbage treatment. J. Biosci. Bioeng. 2008, 105, 48–54. [Google Scholar] [CrossRef]
- Filbert, J.W. Procedures and Problems of Digester Startup. Water 2011, 39, 367–372. [Google Scholar]
- APHA. Standard Methods for the Examination of Water and Wastewater, 21st ed.; American Public Health Association Water Works Association (APHA), American Water Works Association (AWWA), Environment Federation (WEF): Washington DC, USA, 2017. [Google Scholar]
- Iglesias Jiménez, E.; Pérez García, V. Relationships between organic carbon and total organic matter in municipal solid wastes and city refuse composts. Bioresour. Technol. 1992, 41, 265–272. [Google Scholar] [CrossRef]
- Mota, V.T.; Santos, F.S.; Araújo, T.A.; Amaral, M.C.S. Evaluation of titration methods for volatile fatty acids measurement: Effect of the bicarbonate interference and feasibility for the monitoring of anaerobic reactors. Water Pract. Technol. 2015, 10, 486–495. [Google Scholar] [CrossRef]
- Esposito, G.; Frunzo, L.; Panico, A.; Pirozzi, F. Enhanced bio-methane production from co-digestion of different organic wastes. Environ. Technol. 2012, 33, 2733–2740. [Google Scholar] [CrossRef] [PubMed] [Green Version]
- Khadka, A.; Parajuli, A.; Dangol, S.; Thapa, B.; Sapkota, L.; Carmona-Martínez, A.A.; Ghimire, A. Effect of the Substrate to Inoculum Ratios on the Kinetics of Biogas Production during the Mesophilic Anaerobic Digestion of Food Waste. Energies 2022, 15, 834. [Google Scholar] [CrossRef]
- Goux, X.; Calusinska, M.; Fossépré, M.; Benizri, E.; Delfosse, P. Start-up phase of an anaerobic full-scale farm reactor—Appearance of mesophilic anaerobic conditions and establishment of the methanogenic microbial community. Bioresour. Technol. 2016, 212, 217–226. [Google Scholar] [CrossRef]
- Bolzonella, D.; Mıcoluccı, F.; Battısta, F.; Cavınato, C.; Gottardo, M.; Pıovesan, S.; Pavan, P. Producing Biohythane from Urban Organic Wastes. Waste Biomass Valorization 2019, 11, 2367–2374. [Google Scholar] [CrossRef]
- Lin, C.Y.; Nguyen, T.M.L.; Chu, C.Y.; Leu, H.J.; Lay, C.H. Fermentative biohydrogen production and its byproducts: A mini review of current technology developments. Renew. Sustain. Energy Rev. 2018, 82, 4215–4220. [Google Scholar] [CrossRef]
- Hu, W.C.; Thayanithy, K.; Forster, C.F. A kinetic study of the anaerobic digestion of ice-cream wastewater. Process Biochem. 2002, 37, 965–971. [Google Scholar] [CrossRef]
- Wang, Q.; Kuninobu, M.; Ogawa, H.I.; Kato, Y. Degradation of volatile fatty acids in highly efficient anaerobic digestion. Biomass Bioenergy 1999, 16, 407–416. [Google Scholar] [CrossRef]
- Hawkes, F.R.; Hussy, I.; Kyazze, G.; Dinsdale, R.; Hawkes, D.L. Continuous dark fermentative hydrogen production by mesophilic microflora: Principles and progress. Int. J. Hydrog. Energy 2007, 32, 172–184. [Google Scholar] [CrossRef]
- Yeshanew, M.M.; Frunzo, L.; Pirozzi, F.; Lens, P.N.L.; Esposito, G. Production of biohythane from food waste via an integrated system of continuously stirred tank and anaerobic fixed bed reactors. Bioresour. Technol. 2016, 220, 312–322. [Google Scholar] [CrossRef] [PubMed] [Green Version]
- Lay, C.H.; Kumar, G.; Mudhoo, A.; Lin, C.Y.; Leu, H.J.; Shobana, S.; Thi Nguyen, M.L. Recent trends and prospects in biohythane research: An overview. Int. J. Hydrog. Energy 2020, 45, 5864–5873. [Google Scholar] [CrossRef]
- Sagir, E.; Alipour, S.; Elkahlout, K.; Koku, H.; Gunduz, U.; Eroglu, I.; Yucel, M. Scale-up studies for stable, long-term indoor and outdoor production of hydrogen by immobilized Rhodobacter capsulatus. Int. J. Hydrog. Energy 2017, 42, 22743–22755. [Google Scholar] [CrossRef]
- Zhu, D.; Gao, G.; Wang, G.; Pan, G. Photosynthetic bacteria Marichromatium purpuratum LC83 enhances hydrogen production by Pantoea agglomerans during coupled dark and photofermentation in marine culture. Int. J. Hydrog. Energy 2016, 41, 5629–5639. [Google Scholar] [CrossRef]
- Ghimire, A.; Frunzo, L.; Pirozzi, F.; Trably, E.; Escudie, R.; Lens, P.N.L.; Esposito, G. A review on dark fermentative biohydrogen production from organic biomass: Process parameters and use of by-products. Appl. Energy 2015, 144, 73–95. [Google Scholar] [CrossRef]
- Náthia-Neves, G.; de Alencar Neves, T.; Berni, M.; Dragone, G.; Mussatto, S.I.; Forster-Carneiro, T. Start-up phase of a two-stage anaerobic co-digestion process: Hydrogen and methane production from food waste and vinasse from ethanol industry. Biofuel Res. J. 2018, 5, 813–820. [Google Scholar] [CrossRef] [Green Version]
- Aslanzadeh, S.; Rajendran, K.; Jeihanipour, A.; Taherzadeh, M.J. The effect of effluent recirculation in a semi-continuous two-stage anaerobic digestion system. Energies 2013, 6, 2966–2981. [Google Scholar] [CrossRef] [Green Version]
- Luo, L.; Wong, J.W.C. Enhanced food waste degradation in integrated two-phase anaerobic digestion: Effect of leachate recirculation ratio. Bioresour. Technol. 2019, 291, 121813. [Google Scholar] [CrossRef]
- Ezeji, T.C. Production of bio-derived fuels and chemicals. Fermentation 2017, 3, 42. [Google Scholar] [CrossRef] [Green Version]
- Dareioti, M.A.; Tsigkou, K.; Vavouraki, A.I.; Kornaros, M. Hydrogen and Methane Production from Anaerobic Co-Digestion of Sorghum and Cow Manure: Effect of pH and Hydraulic Retention Time. Fermentation 2022, 8, 304. [Google Scholar] [CrossRef]
- Madsen, M.; Holm-Nielsen, J.B.; Esbensen, K.H. Monitoring of anaerobic digestion processes: A review perspective. Renew. Sustain. Energy Rev. 2011, 15, 3141–3155. [Google Scholar] [CrossRef] [Green Version]
- Kim, J.R.; Karthikeyan, K.G. Effects of severe pretreatment conditions and lignocellulose-derived furan byproducts on anaerobic digestion of dairy manure. Bioresour. Technol. 2021, 340, 125632. [Google Scholar] [CrossRef] [PubMed]
- Porpatham, E.; Ramesh, A.; Nagalingam, B. Effect of hydrogen addition on the performance of a biogas fuelled spark ignition engine. Int. J. Hydrog. Energy 2007, 32, 2057–2065. [Google Scholar] [CrossRef]
- Miftah, A.K.; Sittijunda, S.; Imai, T.; Salakkam, A. Biohydrogen and methane production from sugarcane leaves pretreated by deep eutectic solvents and enzymatic hydrolysis by cellulolytic consortia. Fermentation 2022, 8, 396. [Google Scholar] [CrossRef]


| Parameters | Units | FW | Inoculum |
|---|---|---|---|
| Total solids (TS) | % | 15.94 ± 0.04 | 0.22 ± 0.01 |
| Volatile solids (VS) | % | 14.50 ± 0.16 | 0.09 ± 0.01 |
| VS/TS | % | 90.84 ± 1.20 | 43.05 ± 0.96 |
| pH | 4.36 ± 0.01 | 8.08 ± 0.01 | |
| Total chemical oxygen demand (TCOD) | mg/g | 240.4 ± 10.80 | NA |
| Total organic carbon (TOC) | % | 8.05 ± 0.09 | NA |
| Total volatile fatty acids (TVFA) | mg/L | NA | 364.00 ± 7.00 |
| Total alkalinity (TA) | mg/L | NA | 2000.00 ± 16.00 |
| TVFA/TA ratio | NA | 0.18 ± 0.01 | |
| Density | g/cm3 | 1.06 ± 0.02 | 0.99 ± 0.01 |
| Parametric Changes | Cause (C) and Response (R) of Change |
|---|---|
| First-stage reactor | |
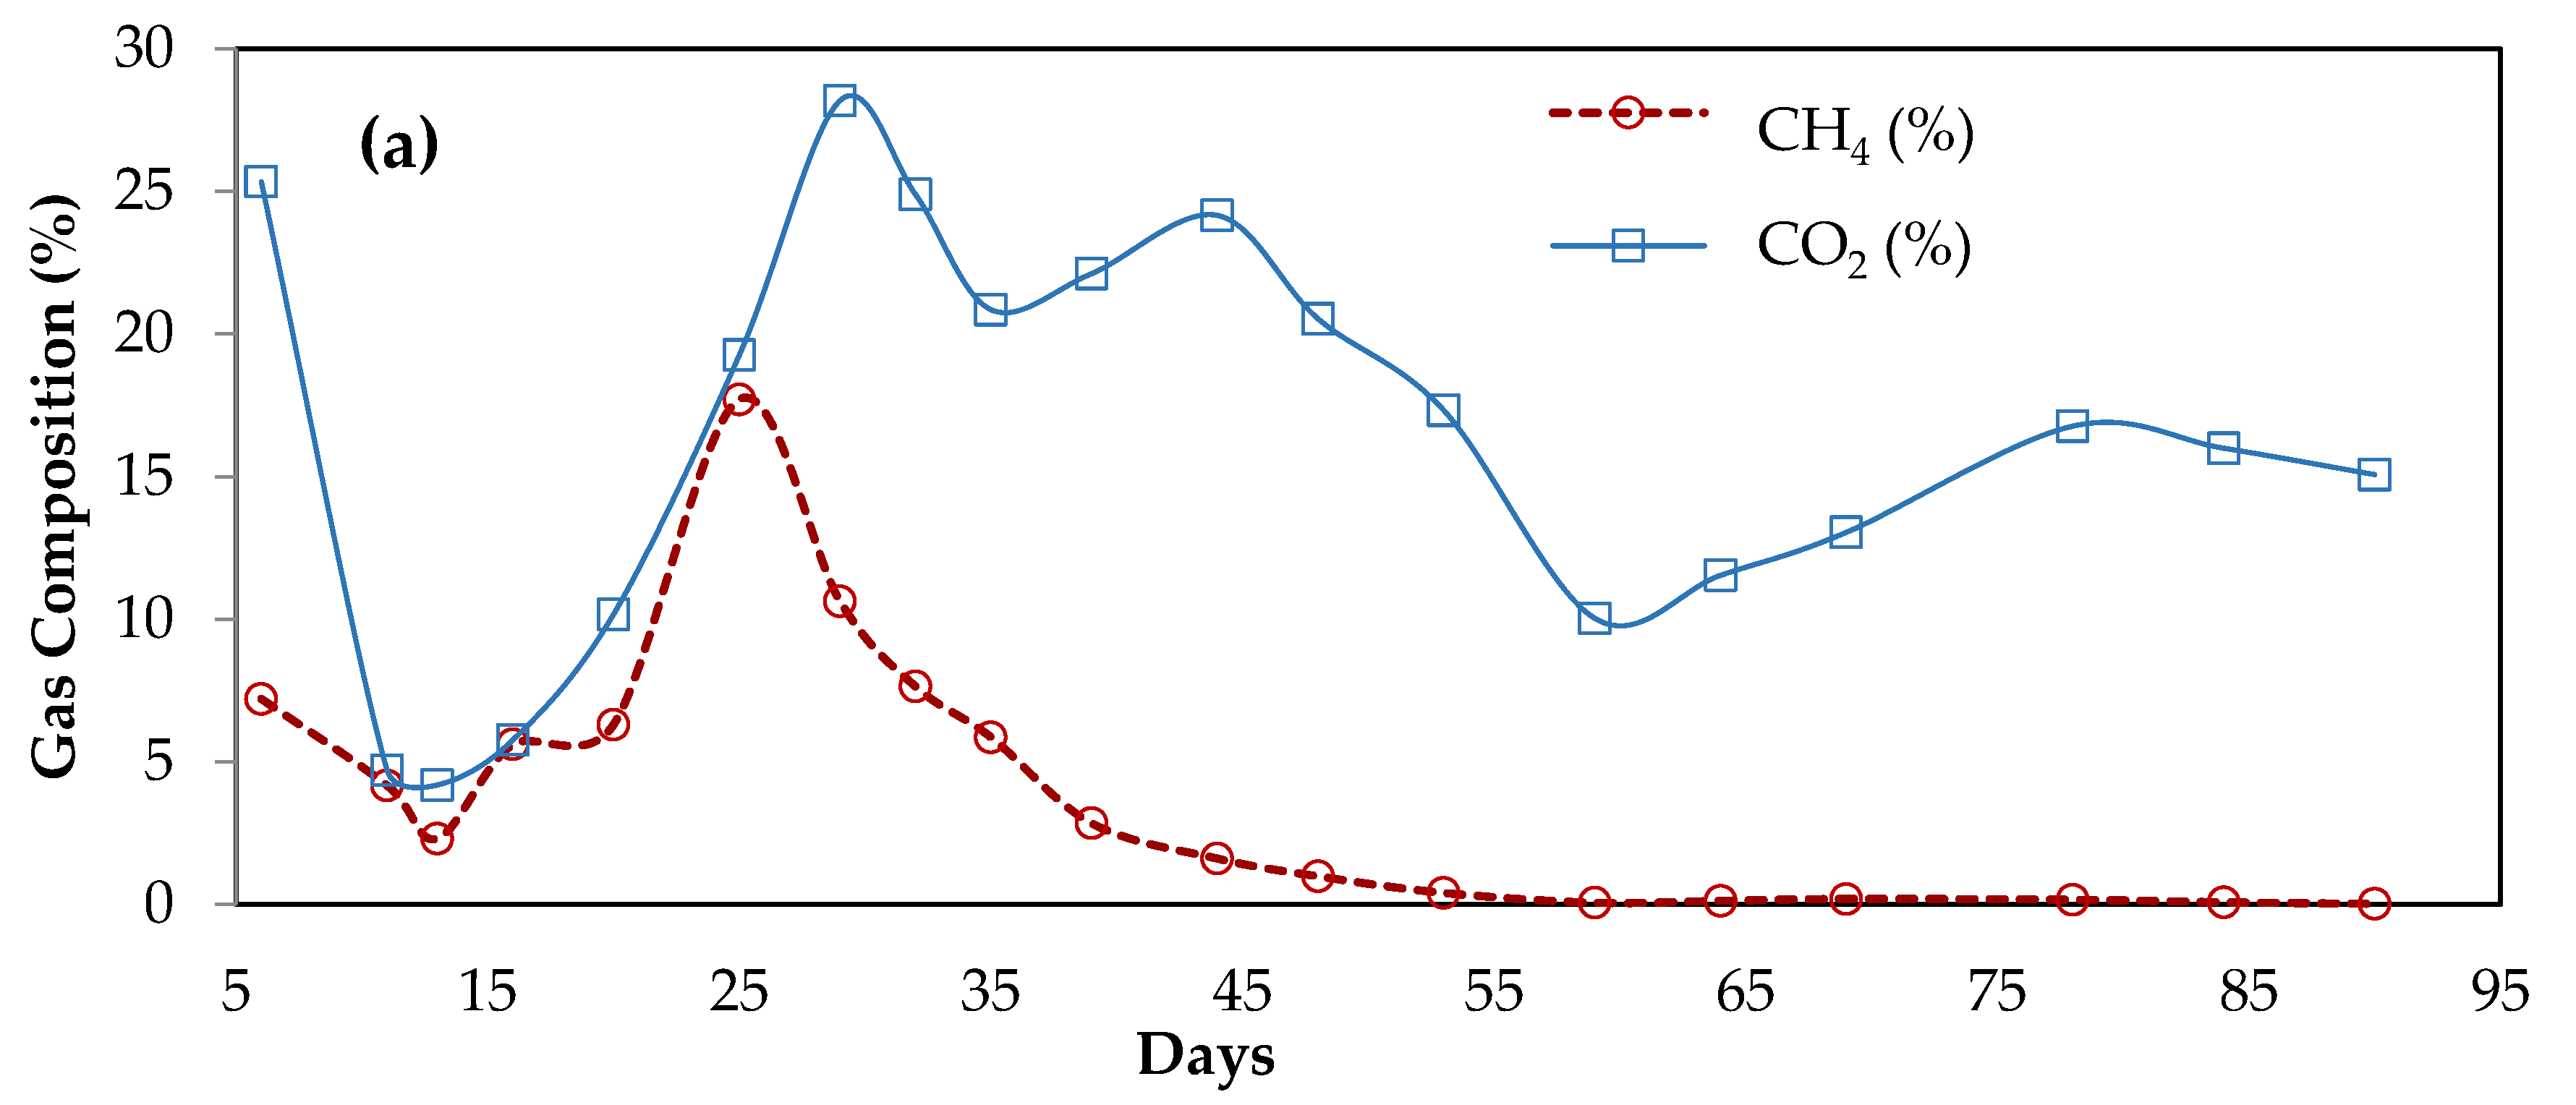
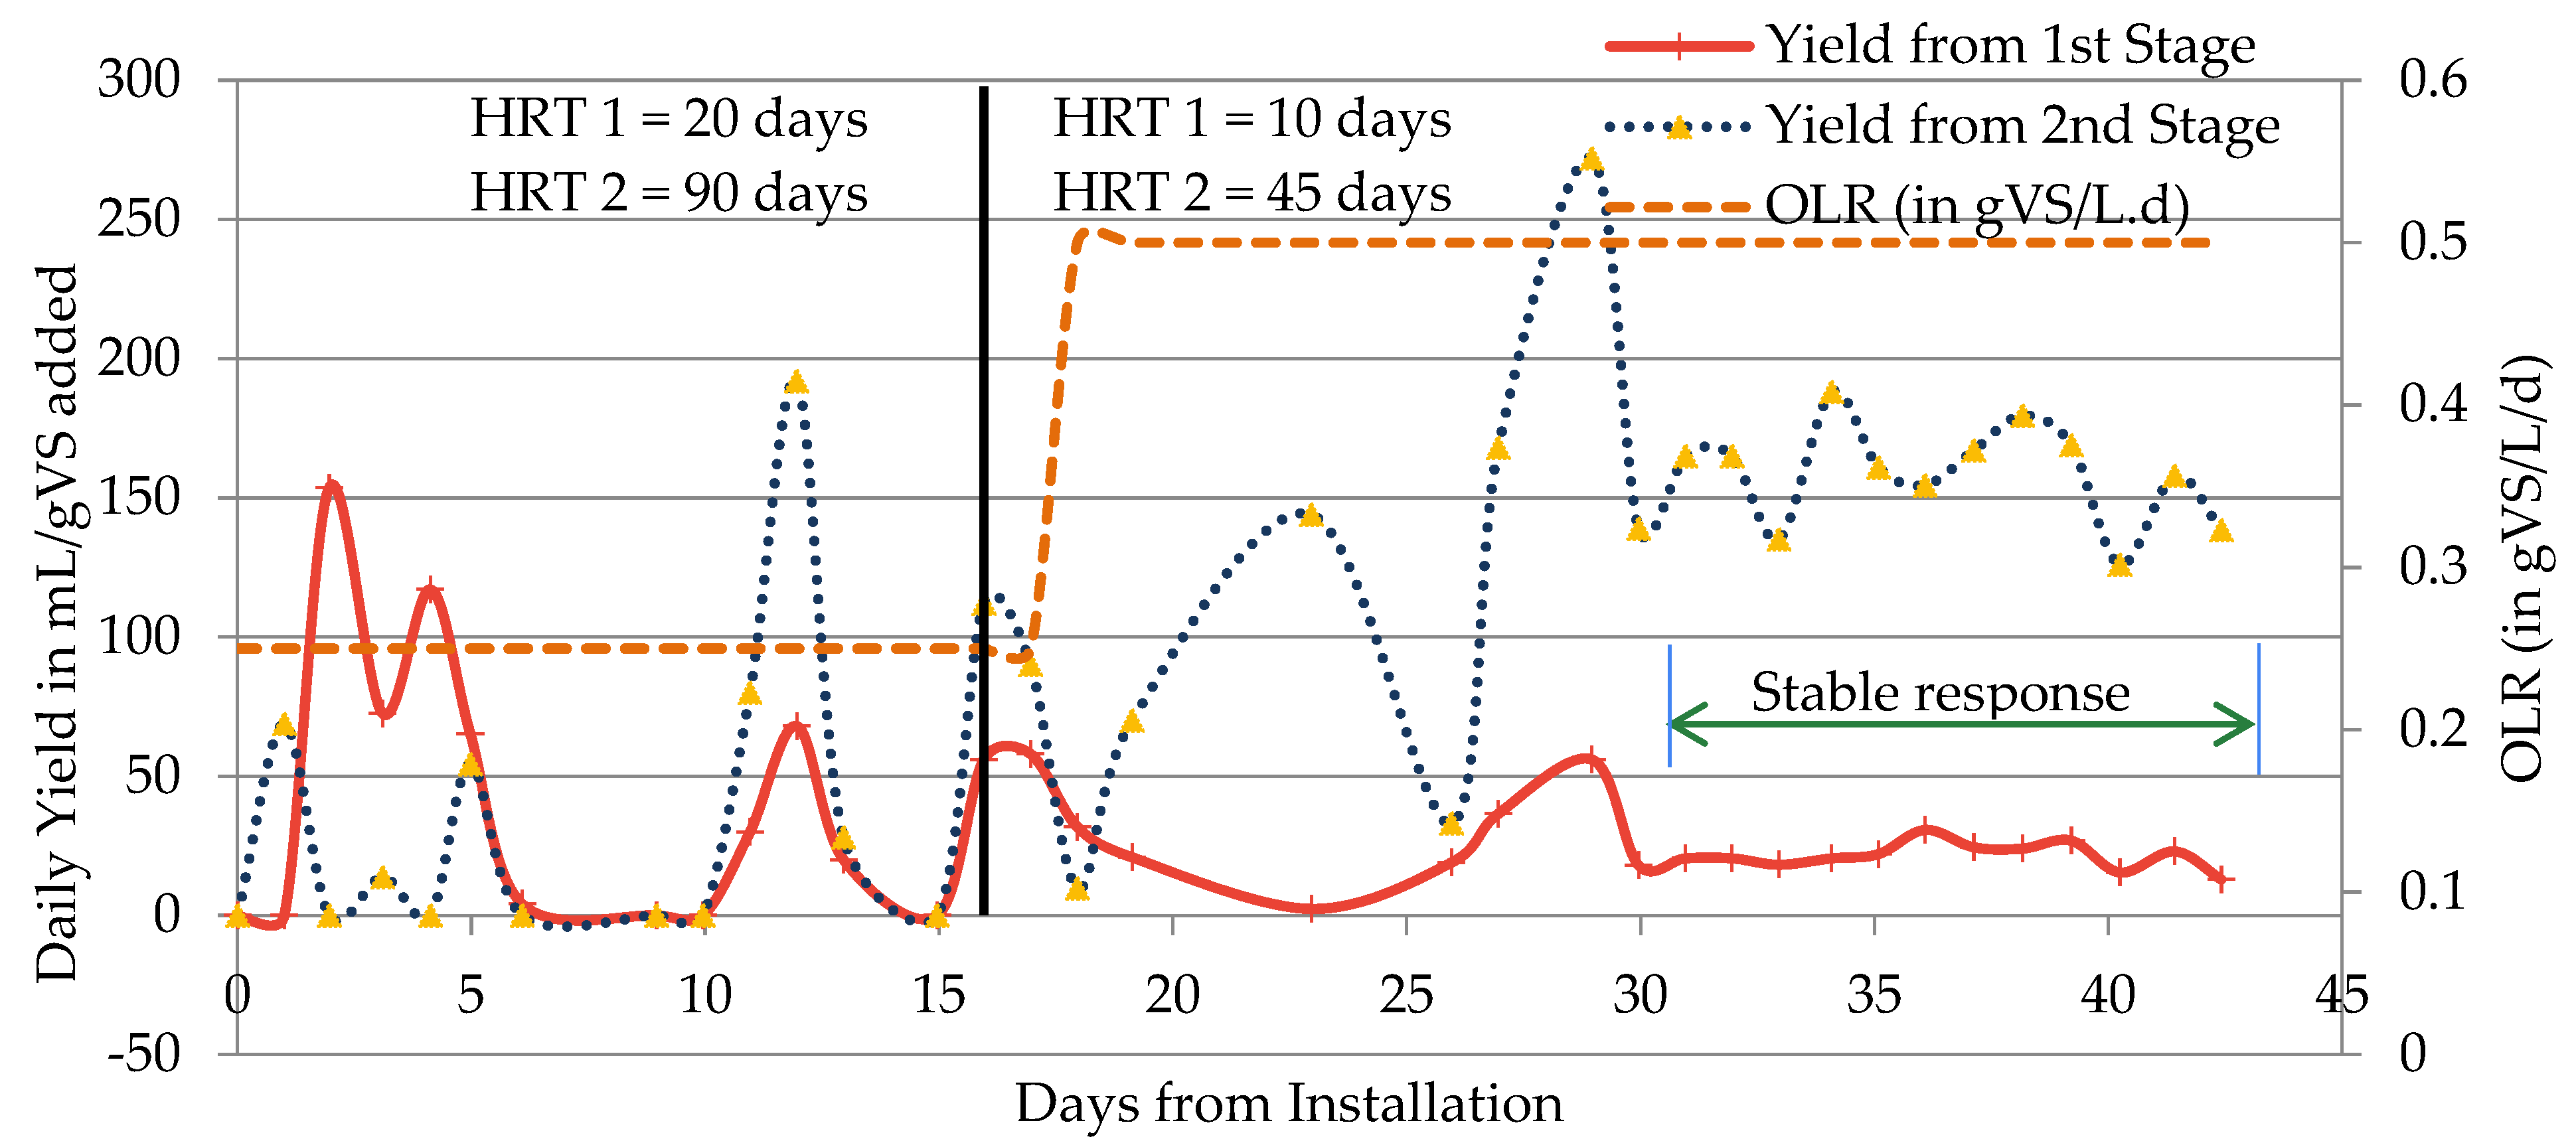
| OLR increase to 0.50 gVS/L/d | R: Methane % increased (18%, 26th day) |
| HRT reduced to 10 days | C: To wash away methanogens R: Methane % decreased (0.90%, 48th day) |
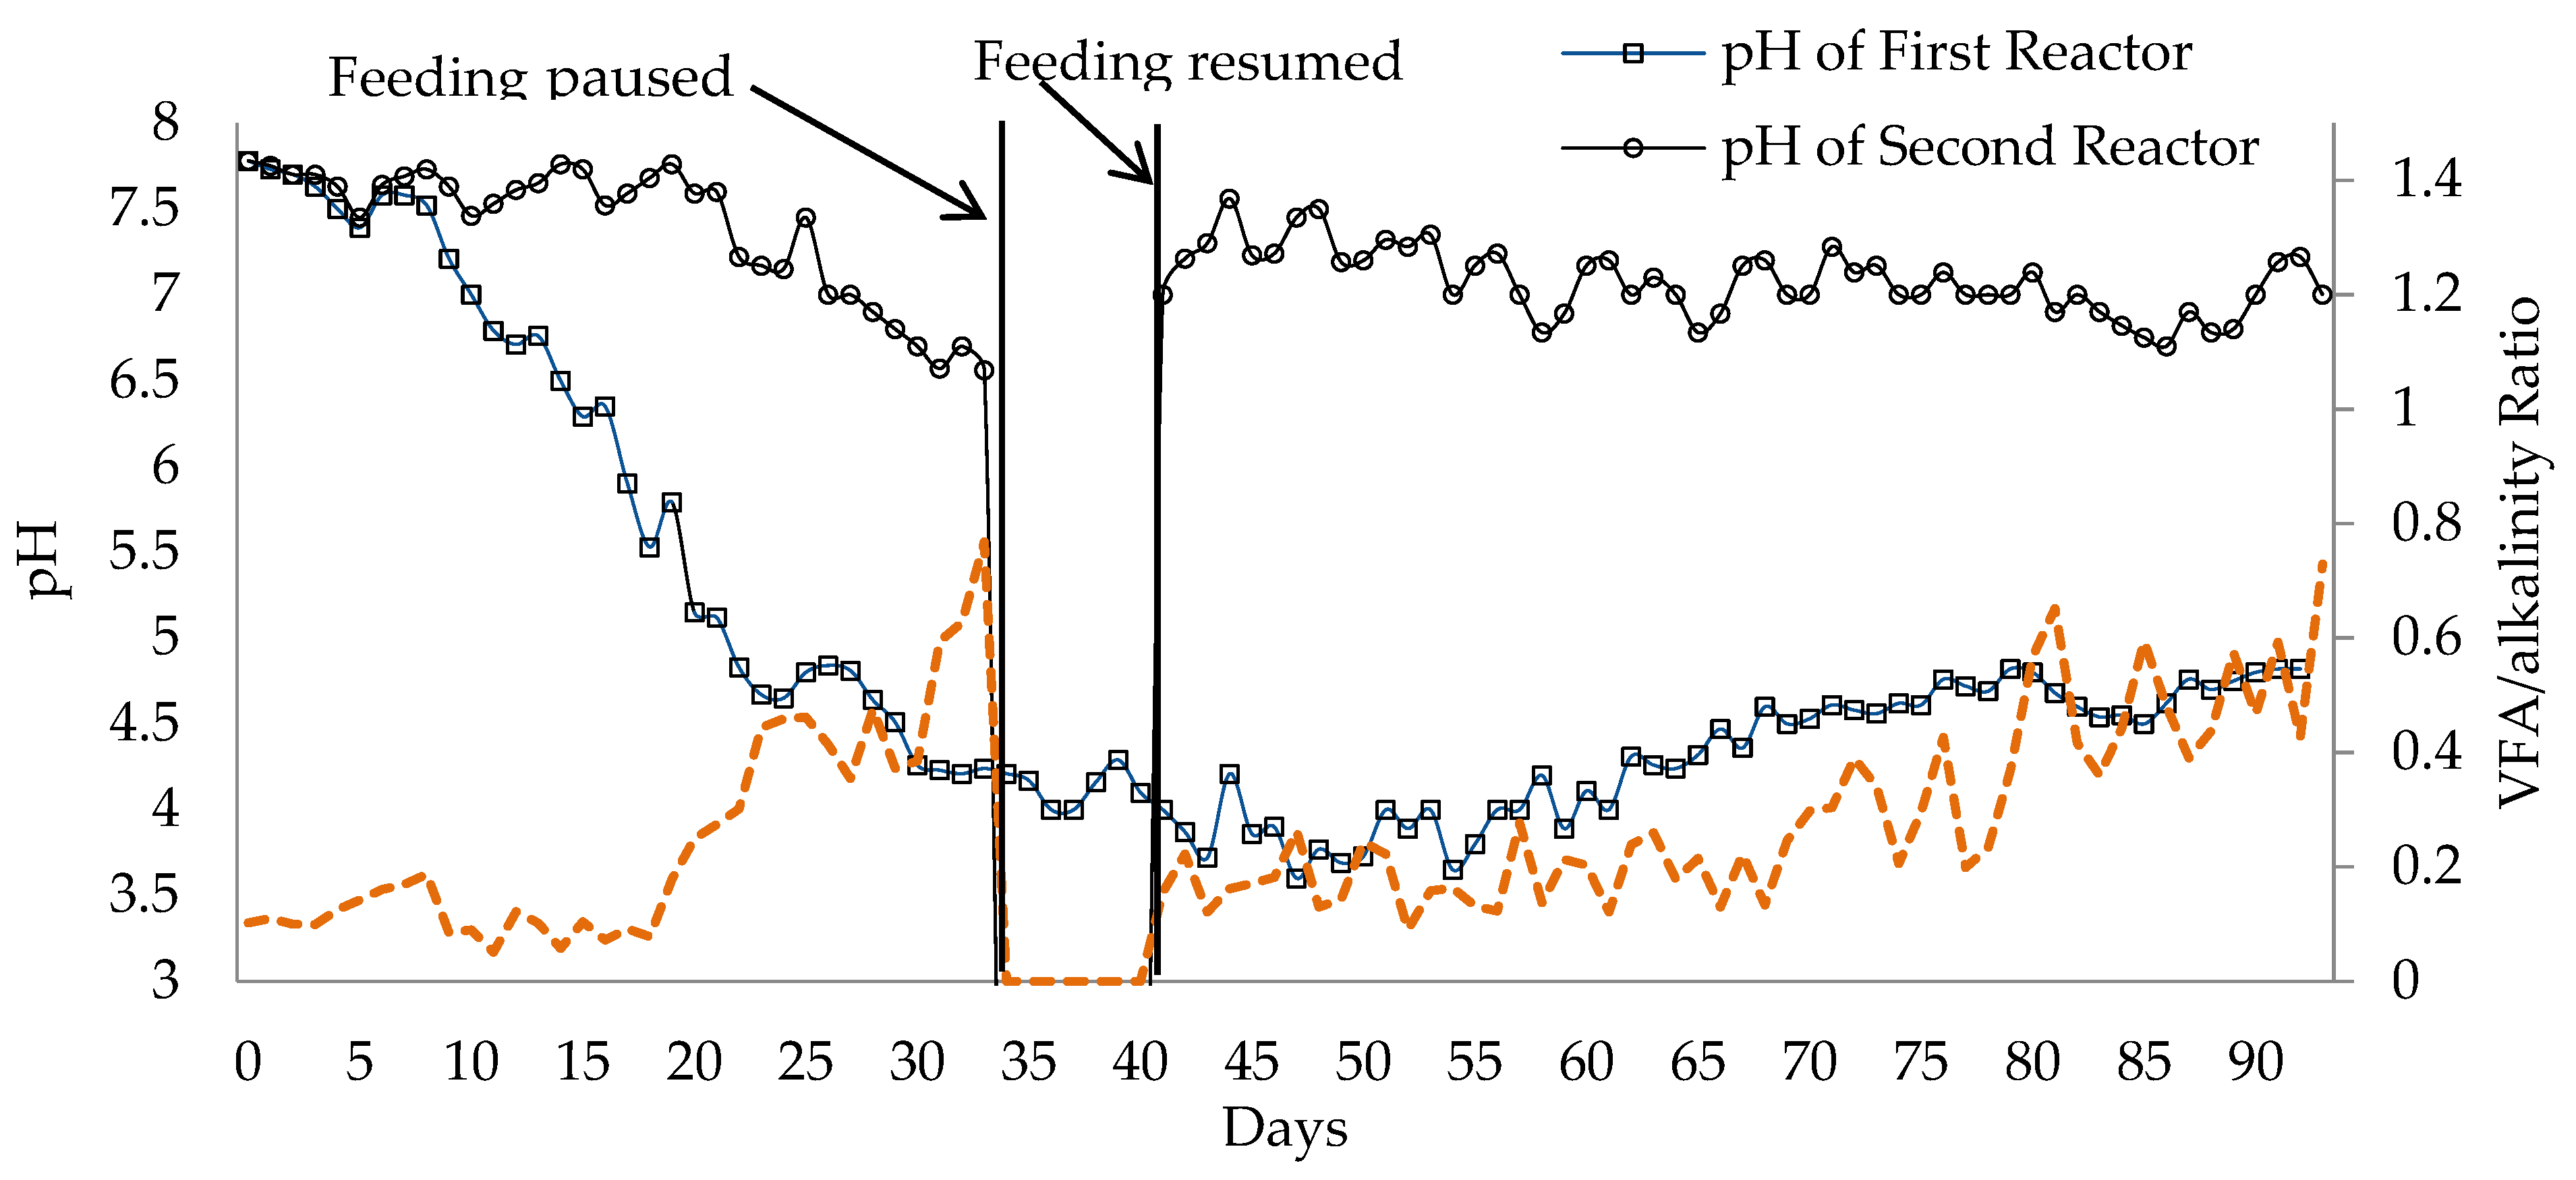
| Reposition the reactor to an adequately lit space | R: Inhibition of photo-fermentative bacteria R: pH decreased (3.70, 49th day) |
| Addition of an opaque layer of wrap | C: To halt the growth of photo-fermentative bacteria R: pH increased (4.80, 94th day) R: Unstable yield in this period |
| Second-stage reactor | |
| OLR increase to 0.50 gVS/L/d | R: Low increase in methane % (18.00%, 26th day) R: pH decreased (6.90, on the 28th day from 7.70, on the 18th day) |
| OLR decreased to 0.25 gVS/L/d (28th day); HRT unaltered. | C: HRT of the first reactor decreased to 10 days The coupling ratio increased to 4 R: pH decreased (6.50, day 33) |
| Feeding paused (34th–40th days) | C: Alarming VFA:TA ratio (0.77, 33 days) R: pH restored to 7.20, reactor stabilized |
| Reposition the reactor to an adequately lit space | R: Invasion of pink photo-fermentative bacteria |
| Addition of an opaque layer of wrap | C: To limit the growth of photo-fermentative bacteria R: Microbial counteraction for dominance R: Unstable yield data |
| A restart of the TSAD system | |
| Inoculum pre-treatment in the first-stage reactor (90 °C, 45 min) | C: To deactivate methanogens R: Absence of methane% in starting phase |
| The second reactor volume upgraded to 1.80 L | C: To permit maximum ER R: Second reactor stable with entire effluent from 0.4 L first reactor |
| Recirculation started (on the 13th day) Recirculation lowered (50.00%, 25th day) | C: Alarming pH in the first reactor (3.20, 12th day) R: Attained stability (30th–40th day) |
Publisher’s Note: MDPI stays neutral with regard to jurisdictional claims in published maps and institutional affiliations. |
© 2022 by the authors. Licensee MDPI, Basel, Switzerland. This article is an open access article distributed under the terms and conditions of the Creative Commons Attribution (CC BY) license (https://creativecommons.org/licenses/by/4.0/).
Share and Cite
Parajuli, A.; Khadka, A.; Sapkota, L.; Ghimire, A. Effect of Hydraulic Retention Time and Organic-Loading Rate on Two-Staged, Semi-Continuous Mesophilic Anaerobic Digestion of Food Waste during Start-Up. Fermentation 2022, 8, 620. https://doi.org/10.3390/fermentation8110620
Parajuli A, Khadka A, Sapkota L, Ghimire A. Effect of Hydraulic Retention Time and Organic-Loading Rate on Two-Staged, Semi-Continuous Mesophilic Anaerobic Digestion of Food Waste during Start-Up. Fermentation. 2022; 8(11):620. https://doi.org/10.3390/fermentation8110620
Chicago/Turabian StyleParajuli, Anmol, Aakash Khadka, Lokesh Sapkota, and Anish Ghimire. 2022. "Effect of Hydraulic Retention Time and Organic-Loading Rate on Two-Staged, Semi-Continuous Mesophilic Anaerobic Digestion of Food Waste during Start-Up" Fermentation 8, no. 11: 620. https://doi.org/10.3390/fermentation8110620