Article

Food Waste Treatments and the Impact of Composting on Carbon Footprint in Canada

1
Department of Civil Engineering, University of Manitoba, Winnipeg, MB R3T 5V6, Canada
2
Department of Biosystem Engineering, University of Manitoba, Winnipeg, MB R3T 5V6, Canada
*
Author to whom correspondence should be addressed.
Fermentation 2022, 8(10), 566; https://doi.org/10.3390/fermentation8100566
Submission received: 21 September 2022 / Revised: 18 October 2022 / Accepted: 19 October 2022 / Published: 21 October 2022

Abstract

:
Forty percent of the food generated in Canada is wasted, making it the most significant component of municipal solid waste. Food waste characteristics, such as high moisture and oil content, and variable composition, make it difficult to manage with conventional waste treatment methods. Part of food waste is disposed of in landfills, generating greenhouse gases and significantly increasing the carbon footprint. Various treatment methods such as composting and anaerobic digestion have been employed to treat and manage the remaining waste efficiently. This study provides an overview of the impact of composting as a food waste treatment method in Canada and paves way for the research of the usefulness of composting in addition to other food waste treatment methods such as anaerobic digestion. Average composting data for Canada was used to determine the change in the carbon footprint by the diversion of food waste using CCaLC2 software. It was determined that the overall carbon footprint of 1.38 and 1.33 mega-tons of CO2 was reduced from the composting of food waste in the years 2014 and 2016, which were approximately 18% and 20% of the total footprint of Canada municipal solid waste, respectively. The carbon footprint data collected herein were compared to the data from England, Sweden, and the USA to reveal the high effectiveness of composting in Canada.

1. Introduction

The life cycle of food includes handling, storage, processing, distribution, and consumption. Food as a whole or even partially can become inedible during these processes. These inedible parts of food are termed food waste, which should be disposed of appropriately. Food waste accounts for the majority of municipal solid waste, up to 50–60% [1], and approximately 1.6 billion tonnes/year of food waste was reported by the Food and Agricultural Organization (FAO) to be generated globally [2]. The rise in the global population parallels such a dramatic increasing loss of food over the years. Food loss is broadly classified into pre-consumption waste (occurring on farmland, during manufacturing/processing, storage, and the supply chain), and post-production waste (the result of food leftovers in restaurants and households) [3]. Canadians generate an average of 193 Kg/year of food waste per capita, over 26 times higher than generated during food production (pre-consumption waste) [4]. The quantifiable (on a farm, processing, consumers, transport and distribution, restaurants and hotels, retail, international catering waste) value of food wasted annually in Canada is over $31 billion, with 47% of the total food wasted reported to be generated at home [5]. Canada wastes about 40% of the food produced annually [5,6]. Food waste contributes to climate change and when it decomposes, it releases methane, which is 28 times more potent than CO2 [7]. According to Project Drawdown, reducing food waste is the top individual solution to reduce global warming and has hypothesized that global reduction of food waste could lead to a reduction of 87.4 gigatons of CO2 e by 2050 [8]. This financial burden cannot be contained by diverting food waste to treatment and recovery facilities unless the food waste is prevented at the source [5]. Organic wastes constitute the highest proportions of un-diverted wastes. However, the carbon footprint of wastes produced in different parts of the world varies substantially. This is primarily because of the difference in food production and consumption patterns over the world. Biodegradation of these wastes has an adverse impact on the environment in the form of greenhouse gas (GHG) emissions (methane, carbon dioxide, nitrous oxide, etc.), improper sanitation, abrupt climate change, etc. [6,9].
Landfilling is a major municipal solid waste management technique used worldwide [10]. This process is detrimental to the environment mainly by land depletion and is responsible for (GHG) emissions and water sources pollution through landfill leachate [10,11]. When the food waste is placed in a landfill, it undergoes anaerobic decomposition and generates methane (CH4). When methane is released into the atmosphere, it is 20 times more potent as a GHG than carbon dioxide (CO2). The emission of GHGs has been a major contributor to the carbon footprint. North American countries produce 860 kg of CO2 per capita of food waste per year in terms of food wastage footprint, the highest in the world [12]. Canada’s initiative of reducing the GHGs emitted in 2005 by 30% in 2030 is anticipated to lower its impact on climate change [13]. These gases are typically (about 38%) generated from landfills due to the rotting of organic waste [6]. Organic waste includes food waste that is uneaten and discarded as well as inedible wastes such as scraps, agricultural waste (e.g., manure), biosolids, leaf and yard waste (i.e., green waste), including grass clippings, yard and garden debris [14]. According to the Environmental Research and Education Foundation of Canada (EREF), the total amount of organic waste treated in Canada in 2019 was 4.83 million tonnes with a capacity of 5.74 million tonnes (excluding Quebec) [14]. The food waste prevention strategy has been considered one of the best approaches to reducing food loss and its adverse effect on the environment [15]. Food waste flow hierarchy provides an efficient and chronological way of waste prevention, reduction, and optimal disposal, achieving the most environmental-friendly outcome [16]. Waste prevention is the most desired, because it prevents the loss of resources (energy, nutrients, water, labor, etc.) associated with food processing, and is highlighted by the sustainable development goals (SDG 12), which advocate reducing the global food waste at retail and consumer levels in half by 2030 [9]. In recent research, they encourage the development of education programs focusing on consumers’ behavior on healthy lifestyles and sustainable consumption to promote food waste prevention [17]. Food waste tends to increase with wealth and accessibility, therefore, it is believed that abolishing food subsidies might have a positive effect on waste prevention [18], however, this could be dramatic for the poorest of the population. Prevention is followed by the “reduction” and “disposal”, which is the least desired option. Food waste reduction is an important lever to ensure food security and reduce environmental burdens. Even though more rigorous approaches like the suppression of food subsidies are being considered, most food waste prevention methods are based on information and communication to induce changes in behavior, which includes awareness measures campaigns, round tables, information platforms, which are cheap, easy, and fast to implement [18].
Landfilling, incineration, anaerobic digestion (AD), composting, and heat moisture reaction are among the food waste management processes used worldwide. Landfilling was discussed in the above paragraph. Incineration is also referred to as waste-to-energy (WTE) conversion (produces heat and energy, which can be utilized to generate electricity) and is very effective in reducing the volume (80% to 85%) of waste [19]. Despite these advantages, less than 50% of waste in European countries is incinerated [20], and only 5% in Canada [21], because the high moisture content of food waste makes it less desirable for incineration, the high initial installation cost of the process, and the emission of harmful gases containing dioxins and heavy metals [22,23]. The diversion of food waste from landfills remains a major area for energy and nutrient recovery [9]. Different waste diversion and treatment approaches, such as 3R (reduce, reuse, and recycle), WTE, composting, and AD, have been investigated for the treatment of food waste [24,25]. Anaerobic digestion is a biological waste treatment method that produces digestate and methane gas. Since food waste comprises organic and readily biodegradable components, AD is a better alternative for food waste treatment and energy production with negligible GHG emissions [22]. It has been reported that 367 m3 of biogas can be generated by AD per dry tonne of food waste, which can produce 6.25 kWh/m3 of biogas and 894 terra-watt hour (TWh) of electricity [24]. These advantages have led to a 20–30% increase in biogas plants in countries like Germany, Denmark, and Austria. However, two factors that limit its wide-scale implementation include high initial investment and a longer time-consuming digestion process [19,26]. Composting is another simple yet effective method of food waste treatment. Windrow and Tunnel composting techniques are widely used in various regions of the world [27]. Additionally, nutrients extracted from the composting of food waste can be further utilized as fertilizer in agricultural fields [9]. Composting is a waste management choice where microorganisms decompose organic waste (food waste) and convert it into valuable organic fertilizer [28]. The interest in food waste composting in Canada is growing, in 2011 for example, over 60% of Canadian households participated in some form of composting [29]. Composting prevents and reduces GHG emissions, and its low capital expenditure per tonne of waste compared to AD and WTE makes it more attractive [30].
Composting is a method of choice to reduce the environmental impact of food waste landfilling. The life of a landfill site can also be extended by at least 12 to 16 years by diverting excess organic waste [31]. Considered to be an effective food waste management process besides prevention methods, composting impact on food waste treatment and management of the carbon footprint in Canada will be analyzed in this paper. To the best of our knowledge, no studies have been done in Canada to measure the carbon footprint resulting from food waste and composting. The average composting data for Canada will be used to determine the change in the carbon footprint by the diversion of food waste using CCaLC2 software, and the results will be compared with other high food waste generating countries. The results will help the decision-maker in developing new policies for effective waste management in Canada, which will minimize the effects of climate change in Canada.

2. Materials and Methods

2.1. Carbon Footprint and Composting

A carbon footprint is defined as “the total amount of greenhouse gases produced to, directly and indirectly, support human activities, usually expressed in equivalent tons of carbon dioxide” [32]. Food waste treatment methods such as composting can contribute to reducing carbon footprint [33]. “Composting is an aerobic, biological process that involves the breakdown of organic materials by microorganisms into a biologically stabilized material. In addition to the oxygen required, the appropriate proportions of carbon, nitrogen and water are necessary to support the biological activity needed to degrade the organic material. In ideal conditions, the complete process occurs over several months and goes through three sequential phases. The phases are distinguished based on temperature of the compost and the dominate microorganisms present. While compost is a complex environment that includes many biological organisms, the most common microorganisms include bacteria, fungi, and actinobacteria, also referred to as actinomycetes ” [34]. GHGs emitted from food waste treatment are an essential parameter to assess the impact on the total carbon footprint. Lowering the carbon footprint is correlated with reducing GHG emissions [9]. The determined the carbon footprint indicates the impact of these treatment processes on the environment. Biogas recovery and energy production potential (AD and landfill) [35] and bio-fertilizers (composting and AD) further reduce the carbon footprint by reducing the need for fossil fuel and chemical fertilizers [9].

2.2. Baseline Data

More than half of Canadians (61%) have been involved in some form of composting since 2011. Lawn and kitchen waste composting are the two common forms of composting practiced in Canada. Nevertheless, only kitchen waste comprising mostly food waste is considered herein. The baseline data for Canada was compiled from the yearly data published by Statistics Canada for food waste. According to Statistics Canada, between 2002 and 2018, the annual total waste disposal fluctuated between 30.7 and 35.0 million tonnes. During that time, the quantity of waste diverted from landfills increased from 22 to 26% [14,36]. All the organics that are diverted from the landfill are considered to be composted because less amount of organic waste goes to food waste treatment methods other than a landfill. Furthermore, average Canadian composting percentages collected during the Households and the Environment survey were used to determine the total amount of food waste that was diverted from landfills.

2.3. Calculation of Carbon Footprint

Different types of software have been used for the calculation of the carbon footprint throughout the lifecycle of waste. The carbon footprint is also determined using different carbon calculation techniques that use different parameters such as consumption choices, energy-related activities, etc. [33]. This study used a specific software called Carbon Calculations over the Life Cycle (CCaLC2) to calculate the carbon footprints generated by landfilled organic waste. The carbon footprint due to the total food waste in the years 2014 and 2015/16 for four countries (Table 1) was calculated in addition to the savings due to diversion of food waste via composting. The food waste considered herein is a to-be-landfilled biodegradable waste. However, the carbon emission by the burning of fossil fuel during waste transportation was not taken into consideration because this footprint already existed with landfilling, and waste diversion through composting does not increase or decrease CO2 emission due to waste transportation. The calculated carbon saving, which is essentially the savings due to composting, was also compared to other data (Table 2). The carbon footprint was determined by inserting the quantity of waste (in Kg) in the define waste section of the software and by selecting the to-be-landfilled biodegradable waste. The carbon footprint of total food waste and composted food waste in Canada was determined regardless of the waste composition following this procedure.

3. Results and Discussion

3.1. Impact of Composting on Carbon Footprint in Canada

In Canada, buried organics are responsible for 54 mega-tons of GHGs (methane) emissions [41]. In Ontario, 32% of the total waste generated is constituted of organic waste, which is the highest proportion among the Canadian provinces [42]. Similarly, Statistics Canada (2008) [4] estimated that the average total organic waste generated in Canada is approximately 29% of the total MSW in 2008. If these organics can be diverted from landfills, then a large volume of GHG emissions can be reduced and a consequent reduction in the carbon footprint can be achieved [9]. Canada’s dependency on composting is comparatively higher than other waste treatment methods. Impressively, composting is used to treat 45% of kitchen waste in Canada. The province of Prince Edward Island leads the amount of kitchen food waste composting with 95% and is closely followed by Nova Scotia at 94%. Ontario has the largest population among all the provinces, but only 62% of kitchen waste is treated via composting [43]. From Table 3, it was found that Ontario produces the highest amount of the carbon footprint, which is 0.588 mega-tons and Northwest Territories produces the minimum carbon footprint, around 0.002 in 2018 [36]. This is due to population and waste management facilities. Various comparisons between landfilling and composting have been carried out to accentuate the differences in operating costs. The simple form of composting such as backyard composting has a relatively lower operational cost than landfilling. Composting also has very low carbon emissions as compared to landfilling which produces potent GHGs. In addition, composting also produces useful compost during the process, which further makes the process cost-effective. Hence, composting is beneficial in both economical and environmental aspects as compared to landfilling [6,31]. However, the compost obtained at the end of the composting process is dependent on the waste (feed) used for composting. Additionally, the amount of carbon and nitrogen ratio (C/N) in the soil, temperature, aeration, and moisture are also responsible for the quality of compost and the time required for the completion of the composting process [44]. Similarly, different waste characteristics such as organic matter content, C/N ratio, pH, nutrients, etc., also determine the quality of the compost [45]. Furthermore, if a composting process is mechanical, other factors affect the composting process. For instance, process conditions (temperature difference) and processing time can influence a mechanical composting process [46].
Composting is practiced considerably more than AD in Canada. Forty-five percent of the average Canadian kitchen waste is treated via composting as compared to having only one anaerobic digester plant in Canada, which demonstrates the reliability of composting for food waste diversion and treatment [43,47]. Table 4 indicates that Canada has been generating a significant amount of MSW over the years and that rate has increased each year. Although the amount of food waste per capita has been reduced, it is still proportionate to the amount of waste composted. However, various initiatives such as imposing organics disposal bans, initiating incentives for food donations, and also imposing further control over the donation programs across Canada [15] are reducing overall food waste and promoting diversion towards composting.
Table 3 clearly illustrates the impact of composting on the reduction of the carbon footprint. The total average organic waste diverted to the composting facilities in Canada was reduced by 1.38 × 10⁶ and 1.33 × 10⁶ tonnes of CO2 equivalent of the carbon footprint in 2014 and 2016, which are almost 20% and 18% of the total residential solid waste that was landfilled in 2014 and 2016, respectively. Therefore, with the use of CCaLC2 software and without considering the amount of carbon emission during the transportation phase, composting reduced as much as 18–20% of the total carbon footprint in 2014 and 2016.

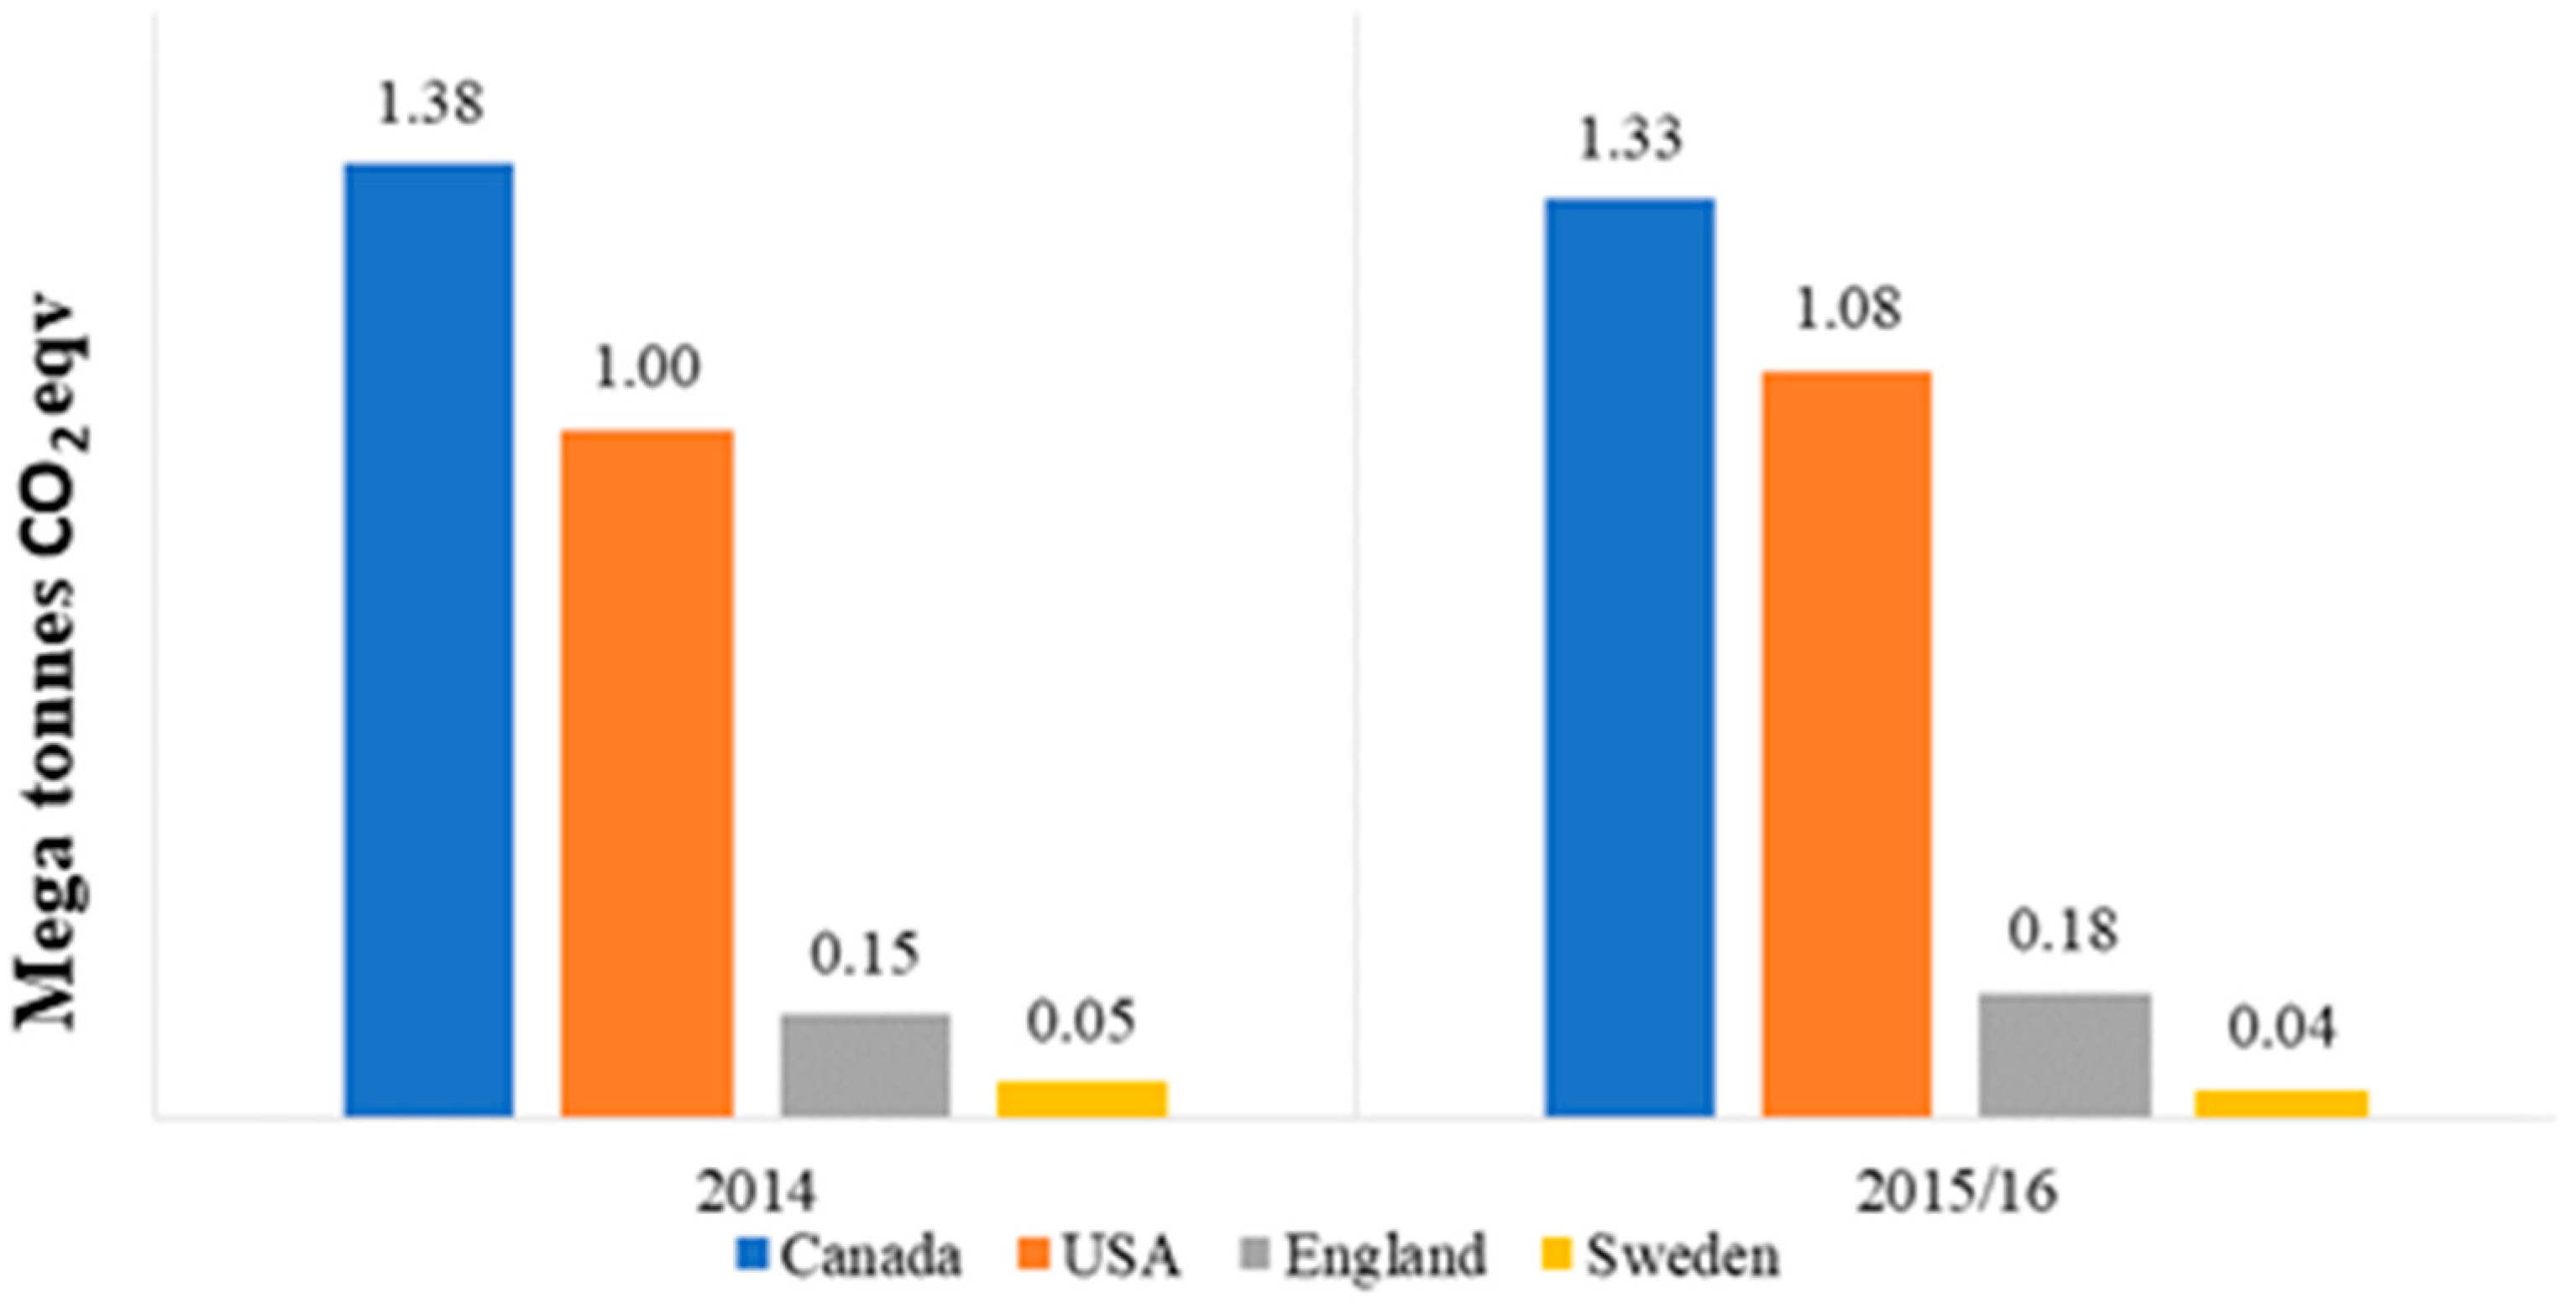
3.2. Effectiveness of Composting in Canada Compared to Other Nations

Composting is an effective method of waste treatment. Countries such as Canada and USA, where landfilling is the most prominent method of waste disposal, have been primarily using composting to treat organics [43]. European countries such as England and Sweden have also implemented composting (Table 1). The carbon footprint calculated for the data retrieved from four different nations (USA, Canada, England, and Sweden) is illustrated in Figure 1, which clearly indicates the impact of composting in the reduction of the carbon footprint in Canada. Composting has instituted a greater impact in the reduction of the carbon footprint in Canada as compared to the aforementioned nations. Although the USA’s rate of waste generation is considerably higher than that of Canada, most of the waste is landfilled rather than composted. Consequently, a lesser impact of composting was observed pertaining to the carbon footprint. In England and Sweden, carbon footprint reduction by composting is comparatively lower as compared to Canada. In England, 38% of the waste is incinerated and 16% of the waste is landfilled. For the remaining 42% of waste, the majority of waste is recycled, which infers very little waste is being composted. Similarly, in Sweden, AD and recycling are used to treat the majority of waste and only a small amount of waste goes to the composting facility. Therefore, the impact of composting in Canada was determined to be considerably higher than the other nations. This is primarily because of the lack of treatment processes such as anaerobic digestion and incineration in Canada, which is widely in use in European nations [21,47]. Additionally, composting has been encouraged and initiated by many municipalities in Canada. However, various studies have highlighted the potential of biogas collection in Canada through food waste treatment processes. For instance, Curry et al. (2012) reported that 6 mega-tonnes of food waste treated through AD is capable of generating 6.6 × 10⁸ m3 of biogas in Canada [24]. Similarly, the Canadian Biogas Association reported the production of 810 megawatts (MW) of electricity from the biogas collection sources in Canada. The major contributor to this electricity production is the agricultural sector, which produces about 68% of the total biogas. Landfill gas and residential source separated organics (SSO) (organic waste collected separately from other MSW) are other major contributors at 12% and 6%, respectively [48].

3.3. Formatting of Mathematical Components

This comparative study only uses the data from composting to calculate the carbon footprint. The data exclude the small number of anaerobic digestion and incineration plants that are currently used for food waste treatment in Canada. The amount of waste that has been composted, i.e., 45% as per [41], was used to determine the amount of total food waste generated. In addition, the carbon emitted via vehicles used for transportation of the waste from houses to the transfer station to the treatment facility were not considered for the calculation of carbon footprint reduction. Consequently, a slightly higher value of the carbon footprint savings was estimated. In addition, the impact of waste treatment methods such as incineration and anaerobic digestion were not considered in this study. The biogas potential is higher in Canada since food waste is comparatively higher and the stakes are high for the development of anaerobic digestion and landfill gas collection facilities. These developments should have a positive impact on overall carbon savings and reduction in GHGs.

4. Conclusions

Food waste, instead of being landfilled, can be diverted towards different food waste treatment plants, and consequently, can be converted into useful biomethane and compost. This study compares the impact of different food waste treatments on the carbon footprint, primarily focusing on composting and its impact on the carbon footprint. In addition, the reduction of waste results in less carbon footprint and consequently, lesser impact on the environment. The findings suggest that composting, being the most practiced waste treatment method in Canada, evidently leads the way in carbon footprint reduction, which is further emphasized by the comparison with the carbon footprint reduction potential of countries such as the USA, England, and Sweden. The investigation on the usefulness of compost as an alternative to chemical fertilizer indicated that the quality of compost or digestate significantly varies due to the composition of the waste source. Moreover, various studies have also demonstrated the high potential of biogas collection and energy production in Canada for biogas collection plants, which is encouraging for its further development and research. However, there are a lot of gaps in the literature about the impact of composting on GHG emissions, which requires further research. Besides, the practice of anaerobic digestion in various European countries and its numerous advantages can also encourage Canada to invest in anaerobic digestion plants. This can significantly reduce overall GHGs production and have a positive impact on the carbon footprint. However, a better understanding of the current situation of organic food waste in Canada is limited by the lack of national, provincial, and territorial statistics. Access to relevant data for food waste is necessary to measure the emission of CO2 accurately and to establish regulatory decision-making to reduce the carbon footprint in Canada.

Author Contributions

P.T. and Q.Y., methodology; P.T. and S.T., software, validation, formal analysis; M.T.H. and A.Z., investigation, resources; P.T., writing—original draft preparation; M.T.H. and A.Z., writing—review and editing, visualization; Q.Y., supervision. All authors have read and agreed to the published version of the manuscript.

Funding

This research received no external funding.

Informed Consent Statement

Not applicable.

Data Availability Statement

Not applicable.

Conflicts of Interest

The authors declare no conflict of interest.

References

  1. Giwa, A.S.; Xu, H.; Wu, J.; Li, Y.; Chang, F.; Zhang, X.; Jin, Z.; Huang, B.; Wang, K. Sustainable Recycling of Residues from the Food Waste (FW) Composting Plant via Pyrolysis: Thermal Characterization and Kinetic Studies. J. Clean. Prod. 2018, 180, 43–49. [Google Scholar] [CrossRef]
  2. FAO. Food Wastage Footprint: Impacts on Natural Resources—Summary Report; FAO: Rome, Italy, 2013. [Google Scholar]
  3. Pour, F.H.; Makkawi, Y.T. A Review of Post-Consumption Food Waste Management and Its Potentials for Biofuel Production. Energy Rep. 2021, 7, 7759–7784. [Google Scholar] [CrossRef]
  4. Abdulla, M.; Martin, R.; Gooch, M.; Jovel, E. The Importance of Quantifying Food Waste in Canada. J. Agric. Food Syst. Community Dev. 2013, 3, 137–151. [Google Scholar] [CrossRef]
  5. Gooch, M.V.; Felfel, A. The Cost Of Canada’s Annual Food Waste—$27 Billion Revisited; Value Chain Management Centre: Halton Region, ON, Canada, 2014. [Google Scholar]
  6. Paul, S.; Dubey, B.; Dutta, A. Evaluation of a Hybrid Approach of Food Waste Management. In Proceedings of the Amercian Society of Agricultural and Biological Engineers Annual International Meeting 2014, ASABE 2014, Montreal, QC, Canada, 13–16 July 2014. [Google Scholar] [CrossRef]
  7. Everitt, H.; van der Werf, P.; Seabrook, J.A.; Wray, A.; Gilliland, J.A. The Quantity and Composition of Household Food Waste during the COVID-19 Pandemic: A Direct Measurement Study in Canada. Socioecon. Plann. Sci. 2022, 82, 101110. [Google Scholar] [CrossRef] [PubMed]
  8. The Drawdown Review|Project Drawdown. Available online: https://drawdown.org/drawdown-review (accessed on 17 October 2022).
  9. World Biogas Association. Global Food Waste Management: An Implementation Guide for Cities; World Biogas Association: London, UK, 2018. [Google Scholar]
  10. Zoungrana, A.; Hasnine, M.T.; Yuan, Q. Landfill Mining: Significance, Operation and Global Perspectives. In Circular Economy in Municipal Solid Waste Landfilling: Biomining & Leachate Treatment. Radionuclides and Heavy Metals in the Environment; Springer: Cham, Switzerland, 2022; pp. 25–45. [Google Scholar]
  11. Hasnine, M.T.; Anand, N.; Zoungrana, A.; Palani, S.G.; Yuan, Q. An Overview of Physicochemical and Biological Treatment of Landfill Leachate. In Circular Economy in Municipal Solid Waste Landfilling: Biomining & Leachate Treatment. Radionuclides and Heavy Metals in the Environment; Springer: Cham, Switzerland, 2022; pp. 115–152. [Google Scholar]
  12. FAO. Food Wastage Footprint & Climate Change; FAO: Rome, Italy, 2015. [Google Scholar]
  13. Environment Canada Greenhouse Gas Sources Canada’s Submission to the United Nations Framework. Natl. Invent. Rep. 1990-2015 2017, 3, 14.
  14. The Environmental Research & Education Foundation of Canada. State of the Practice of Organic Waste Management and Collection in Canada. 2021. Available online: www.eref-canada.ca (accessed on 30 August 2022).
  15. Schipper, L.; Unander, F.; Murtishaw, S.; Ting, M. Indicators of Energy Use and Carbon Emissions: Explaining the Energy Economy Link. Annu. Rev. Environ. Resour. 2001, 26, 49. [Google Scholar] [CrossRef]
  16. Papargyropoulou, E.; Lozano, R.; Steinberger, J.K.; Wright, N.; Ujang, Z. Bin The Food Waste Hierarchy as a Framework for the Management of Food Surplus and Food Waste. J. Clean. Prod. 2014, 76, 106–115. [Google Scholar] [CrossRef]
  17. Al-Obadi, M.; Ayad, H.; Pokharel, S.; Ayari, M.A. Perspectives on Food Waste Management: Prevention and Social Innovations. Sustain. Prod. Consum. 2022, 31, 190–208. [Google Scholar] [CrossRef]
  18. Priefer, C.; Jörissen, J.; Bräutigam, K.R. Food Waste Prevention in Europe—A Cause-Driven Approach to Identify the Most Relevant Leverage Points for Action. Resour. Conserv. Recycl. 2016, 109, 155–165. [Google Scholar] [CrossRef]
  19. Gao, A.; Tian, Z.; Wang, Z.; Wennersten, R.; Sun, Q. Comparison between the Technologies for Food Waste Treatment. Energy Procedia 2017, 105, 3915–3921. [Google Scholar] [CrossRef]
  20. Wilts, H.; Galinski, L.; Marin, G.; Paleari, S.; Zoboli, R. Assessment of Waste Incineration Capacity and Waste Shipments in Europe; European Topic Centre on Waste and Materials in a Green Economy (ETC/WMGE), 2017. Available online: https://docslib.org/doc/2255734/assessment-of-waste-incineration-capacity-and-waste-shipments-in-europe (accessed on 30 August 2022).
  21. Statistics Canada, 2012, Human Activity and the Environment: Section 3: Solid Waste. Available online: https://www150.statcan.gc.ca/n1/pub/16-201-x/2012000/part-partie3-eng.htm (accessed on 30 August 2022).
  22. Phuong, T.; Pham, T.; Kaushik, R.; Parshetti, G.K.; Mahmood, R.; Balasubramanian, R. Food Waste-to-Energy Conversion Technologies: Current Status and Future Directions. Waste Manag. 2015, 38, 399–408. [Google Scholar] [CrossRef]
  23. Istrate, I.; García-gusano, D.; Iribarren, D.; Dufour, J. Long-Term Opportunities for Electricity Production through Municipal Solid Waste Incineration When Internalising External Costs. J. Clean. Prod. 2019, 215, 870–877. [Google Scholar] [CrossRef]
  24. Curry, N.; Pillay, P. Biogas Prediction and Design of a Food Waste to Energy System for the Urban Environment. Renew. Energy 2012, 41, 200–209. [Google Scholar] [CrossRef]
  25. Othman, K.I.; Lim, J.S.; Ho, W.S.; Hashim, H.; Hafizan, A.M. Carbon Emission and Landfill Footprint Constrained for Waste Management Using Cascade Analysis. Chem. Eng. Trans. 2018, 63, 145–150. [Google Scholar] [CrossRef]
  26. Van Fan, Y.; Klemeš, J.J.; Lee, C.T.; Perry, S. Anaerobic Digestion of Municipal Solid Waste: Energy and Carbon Emission Footprint. J. Environ. Manag. 2018, 223, 888–897. [Google Scholar] [CrossRef]
  27. Thyberg, K.L.; Tonjes, D.J. The Environmental Impacts of Alternative Food Waste Treatment Technologies in the U.S. J. Clean. Prod. 2017, 158, 101–108. [Google Scholar] [CrossRef]
  28. Singh, V.; Wyatt, J.; Zoungrana, A.; Yuan, Q. Evaluation of Vermicompost Produced by Using Post-Consumer Cotton Textile as Carbon Source. Recycling 2022, 7, 10. [Google Scholar] [CrossRef]
  29. Mustapha, I. Composting by Households in Canada. Available online: https://www150.statcan.gc.ca/n1/en/pub/16-002-x/2013001/article/11848-eng.pdf?st=fh0tjhAd (accessed on 30 August 2022).
  30. Aleluia, J.; Ferrão, P. Assessing the Costs of Municipal Solid Waste Treatment Technologies in Developing Asian Countries. Waste Manag. 2017, 69, 592–608. [Google Scholar] [CrossRef]
  31. Blair, A.; Hollands, G.; Mcintosh, K.; Macdonald, A.; Mehta, B.; Umali, H.; Pagsuyoin, S. Alternative Management of Organic Waste. In 2014 Systems and Information Engineering Design Symposium (SIEDS); IEEE: Piscataway, NJ, USA, 2014; pp. 74–77. [Google Scholar]
  32. Time for Change What Is a Carbon Footprint—Definition of Carbon Footprint. Available online: https://youmatter.world/en/definition/definitions-carbon-footprint/#:~:text=According%20to%20WHO%2C%20a%20carbon,CO2%20emissions%20produced%20in%20tonnes (accessed on 30 August 2022).
  33. Mulrow, J.; Machaj, K.; Deanes, J.; Derrible, S. The State of Carbon Footprint Calculators: An Evaluation of Calculator Design and User Interaction Features. Sustain. Prod. Consum. 2018, 18, 33–40. [Google Scholar] [CrossRef]
  34. David, A. Environment Canada Technical Document on Municipal Solid Waste Organics Processing. Available online: https://www.ec.gc.ca/gdd-mw/3E8CF6C7-F214-4BA2-A1A3-163978EE9D6E/ID458_Summary_03_e.pdf (accessed on 30 August 2022).
  35. Ayodele, T.R.; Ogunjuyigbe, A.S.O.; Alao, M.A. Economic and Environmental Assessment of Electricity Generation Using Biogas from Organic Fraction of Municipal Solid Waste for the City of Ibadan, Nigeria. J. Clean. Prod. 2018, 203, 718–735. [Google Scholar] [CrossRef]
  36. Statistics Canada. The Daily—Waste Management Industry: Business and Government Sectors; Statistics Canada: Ottawa, ON, Canada, 2014. [Google Scholar]
  37. Statistics Canada. Households and the Environment Survey, 2015; Statistics Canada: Ottawa, ON, Canada, 2016; Volume 2007. [Google Scholar]
  38. Department for Environment Food & Rural Affairs. Digest of Waste and Resource Statistics—2016 Edition (Revised); Department for Environment Food & Rural Affairs: London, UK, 2016.
  39. Bisaillion, M.; Sahlin, J.; Johansson, I.; Jones, F. Bränslekvalitet Sammansättning Och Egenskaper För Avfallsbränsle till Energiåtervinning; 2014. Available online: http://www.avfallsverige.se (accessed on 30 August 2022).
  40. US Environmental Protection. Municipal Solid Waste Generation, Recycling, and Disposal in the United States: Facts and Figures for 2010. AMBRA GmbH 2010, 1–12. [Google Scholar]
  41. Environment and Climate Change Canada. National Inventory Report 1990–2018: Greenhouse Gas Sources and Sinks in Canada: Executive Summary. In Canada’s Greenh. Gas Invent; Environment and Climate Change: Gatineau, QC, Canada, 2020. [Google Scholar]
  42. The Ministry of Environment and Climate Change. Ontario’s Food and Organic Waste Framework: Action Plan; The Ministry of Environment and Climate Change: Gatineau, QC, Canada, 2018. Available online: https://files.ontario.ca/food_and_organic_waste_framework.pdf (accessed on 30 August 2022).
  43. Statistics Canada. Composting by Households in Canada; Statistics Canada: Ottawa, ON, Canada, 2013. [Google Scholar]
  44. Kadir, A.A.; Azhari, N.W.; Jamaludin, S.N. An Overview of Organic Waste in Composting. MATEC Web Conf. 2016, 47, 05025. [Google Scholar] [CrossRef] [Green Version]
  45. Asses, N.; Farhat, W.; Hamdi, M.; Bouallagui, H. Large Scale Composting of Poultry Slaughterhouse Processing Waste: Microbial Removal and Agricultural Biofertilizer Application. Process Saf. Environ. Prot. 2019, 124, 128–136. [Google Scholar] [CrossRef]
  46. Rupani, P.; Maleki Delarestaghi, R.; Asadi, H.; Rezania, S.; Park, J.; Abbaspour, M.; Shao, W. Current Scenario of the Tehran Municipal Solid Waste Handling Rules towards Green Technology. Int. J. Environ. Res. Public Health 2019, 16, 979. [Google Scholar] [CrossRef] [PubMed] [Green Version]
  47. Levis, J.W.; Barlaz, M.A.; Themelis, N.J.; Ulloa, P. Assessment of the State of Food Waste Treatment in the United States and Canada. Waste Manag. 2010, 30, 1486–1494. [Google Scholar] [CrossRef] [PubMed]
  48. Canadian Biogas Association. Canadian Biogas Study, Canada. 2013. Available online: https://biogasassociation.ca/resources/canadian_biogas_study (accessed on 30 August 2022).
Figure 1. Reduction in carbon footprint via composting.
Fermentation 08 00566 g001
Table 1. Composting data with respect to the total food waste for four nations (Mega Tonnes).
CountriesTotal Food Waste (2014)Total Composting (2014)Total Food Waste (2015/16)Total Composting (2015/16)
Canada a5.972.695.772.60
England b4.220.294.170.35
Sweden c0.710.100.760.08
USA d38.671.9439.732.10
Data retrieved from [37] a, [38] b, [39] c, [40] d.
Table 2. Carbon footprint calculation using CCaLC2 (Mega Tonnes CO2 eqv.).
CountriesCarbon Footprint of Total Food Waste (2014)Carbon Footprint of Total Composting (2014)Carbon Footprint of Total Food Waste (2015/16)Carbon Footprint of Total Composting (2015/16)
Canada3.061.382.961.33
England2.160.152.140.18
Sweden0.370.050.390.04
USA19.801.0020.401.08
Table 3. Carbon footprint calculation from organic waste using CCaLC2 (Mega Tonnes CO2 eqv.) in Canada.
Province/TerritoryStatistics Canada (2018) [36]Carbon Footprint (Mega Tonnes CO2 eqv.)
Alberta322,2180.165
British Columbia615,6830.316
New Brunswick94,2610.048
Newfoundland and Labrador9050.00046
Nova Scotia148,3480.076
Manitoba56,2720.029
Prince Edward Island20,4450.01
Ontario1,145,1690.588
Quebec432,0000.222
Saskatchewan33,0580.017
Northwest Territories46010.002
Nunavut
Yukon
Total Canada2,872,9601.47
Table 4. Carbon footprint of different waste types.
Total Residential WasteTotal Food WasteTotal Composting
201420162014201620142016
Mega Tonnes (MT)9.8010.235.975.772.692.60
Carbon footprint
(MT CO2 eq.)
7.067.373.062.961.381.33
Publisher’s Note: MDPI stays neutral with regard to jurisdictional claims in published maps and institutional affiliations.

