Article

Micro-Aerobic Pre-Treatment vs. Thermal Pre-Treatment of Waste Activated Sludge for Its Subsequent Anaerobic Digestion in Semi-Continuous Digesters: A Comparative Study

by
Alejandra Castillo
1,
Eduardo Ortega-Martínez
2,
Jhosané Pagés-Díaz
1,
Silvio Montalvo
1 and
Cesar Huiliñir
1,*
1
Laboratorio de Biotecnología Ambiental, Departamento de Ingeniería Química y Bioprocesos, Universidad de Santiago de Chile, Av. Lib. Bdo. O‘Higgins 3363, Santiago de Chile 9170022, Chile
2
Escuela de Ingeniería Bioquímica, Pontificia Universidad Católica de Valparaíso, Avenida Brasil 2085, Valparaíso 2374631, Chile
*
Author to whom correspondence should be addressed.
Fermentation 2022, 8(10), 565; https://doi.org/10.3390/fermentation8100565
Submission received: 8 September 2022 / Revised: 17 October 2022 / Accepted: 19 October 2022 / Published: 21 October 2022

Abstract

:
This article investigates methane production, organic matter removal, and energy by comparing micro-aerobic pre-treatment and thermal pre-treatment of waste-activated sludge (WAS). For micro-aerobic pre-treatment, WAS was pre-treated at 0.35 vvm (volume of air per volume of medium per minute) for 48 h. The data showed over a 30% increase in soluble Chemical Oxygen Demand (COD) and soluble proteins when this pre-treatment was applied. Then, the micro-aerobically pre-treated sludge was mixed with primary sludge and anaerobically digested in semi-continuous digesters with Hydraulic Retention Times (HRT) of 20, 15, and 10 days at 35 °C. We used two digesters as a control: one fed with a mixture of primary sludge (PS) and raw WAS; another fed with a mixture of PS and thermally pre-treated WAS. The results showed a better performance for the digester fed with micro-aerobically pre-treated sludge than the other two at all the HRT tested. The better performance is because of the solubilization of particulate organic matter, as shown at the reactor outlet. Energy consumption analysis showed that micro-aerobic pre-treatment required 32% more energy in a year than thermal pre-treatment. However, if sludge is pre-thickened in a similar way as performed for thermal pre-treatment, then the energy demand required by micro-aerobic pre-treatment is reduced by 41% concerning the thermal pre-treatment; nevertheless, more studies should be performed to verify that methane production and solid reduction advantages are maintained.

1. Introduction

Waste-activated sludge (WAS) is the excess of microorganisms and extracellular polymeric substances removed from the activated sludge process [1]. This waste is traditionally stabilized by conventional anaerobic digestion processes, resulting in sludge reduction and biogas production [2]. However, due to the complex nature of WAS, the process is generally limited by its hydrolysis phase [1].
To overcome this limitation, researchers have proposed several processes as pre-treatment methods [3]. For WAS, thermal hydrolysis is one of the most convenient alternatives due to its proven efficiency not only at the lab scale [4,5] but also at a full-scale wastewater treatment plant (WWTP) [6]. In a typical thermal pre-treatment process, the sludge is submitted to temperatures between 140 and 180 °C, for 20 to 40 min [5,7], a situation that allows improving biodegradability and increases the biogas production [3,8]. However, this process also has some disadvantages that, even at this date, have not been fully resolved. For example, thermal pre-treatment produces recalcitrant colored compounds called melanoidins [8]. Depending on the concentration, these compounds could inhibit anaerobic digestion performance, as shown in molasses distillery wastewater [9], or not being degraded at all [10]. Moreover, these compounds could negatively affect downstream processes such as anammox [11] and UV disinfection [12], among others [13]. So, interest in pre-treatments that do not produce complex compounds and have the potential to compete with thermal pre-treatment has become more relevant.
Micro-aerobic pre-treatment has evidenced good potential due to hydrolysis products being available for further conversion, as opposed to thermochemical pre-treatments that may produce complex wastes [3]. Aerobic pretreatment takes place in the presence of oxygen with the help of aerobic cultures. These microorganisms use the polymeric substrates present in the biosolids and hydrolyze them into monomeric units, facilitating anaerobic digestion [14]. Indeed, it allows faster and higher methane production during the Anaerobic Digestion (AD) process compared to the system without pre-treatment [14,15]. There are several studies about the effectiveness of this pre-treatment on anaerobic digestion. However, most of those studies had been performed in batch systems [16,17,18], and few investigations are in continuous or semi-continuous systems. Only Ruan et al. [19], working in a semi-continuous digester, reported that micro-aeration as pre-treatment accelerates the utilization of organic matters, increases biogas production (by 16.4%), enhances methane content in biogas, and improves sludge dewaterability. In economic terms, Ruan et al. [19] indicated that the total cost saved by micro-aeration was 0.0075 €/kg vs. at a power cost of 0.13 €/kWh by comprehensively considering energy consumption of aeration, methane production enhancement and sludge reduction. Nevertheless, this study does not compare or analyze the energy consumption of the process in comparison to other pre-treatment processes. Energy consumption and efficiency in WWTP are critical issues when implementing new processes since WWTP are high electricity consumers [20]. Several studies have analyzed the thermal pre-treatment in terms of energy consumption [21,22]; however, there are no studies about micro-aeration’s energy consumption as pre-treatment nor in comparison to the more applied technology such as thermal pre-treatment.
Micro-aerobic pre-treatment seems like an interesting alternative. However, there is a lack of data regarding performing reactors operated continuously fed with the pre-treated substrate, energy requirements, and the comparison with an established pre-treatment such as thermal pre-treatment. In this sense, the research seeks to address two aspects not previously presented in literature: (a) the comparison at the lab scale of micro-aerobic and thermal pre-treatment in semi-continuous operation; (b) the comparison of energy consumption for both pre-treatments.

2. Material and Methods

2.1. Micro-Aerobic Pre-Treatment

The micro-aerobic pre-treatment was carried out using waste-activated sludge in a reactor of 1.8 L of working volume at 35 °C. Then, 0.35 vvm of air was continuously injected for 48 h [16]. The process maintained a Dissolved Oxygen content at 0 mg O2 L−1 (i.e., Oxidation Reduction Potential ORP < −50 mV was used according to the detection limit of the dissolved oxygen sensor). The system used these conditions to meet the requirement proposed by Nguyen and Khanal [23] of an ORP between 0 and −300 mV to be considered micro-aerobic conditions.

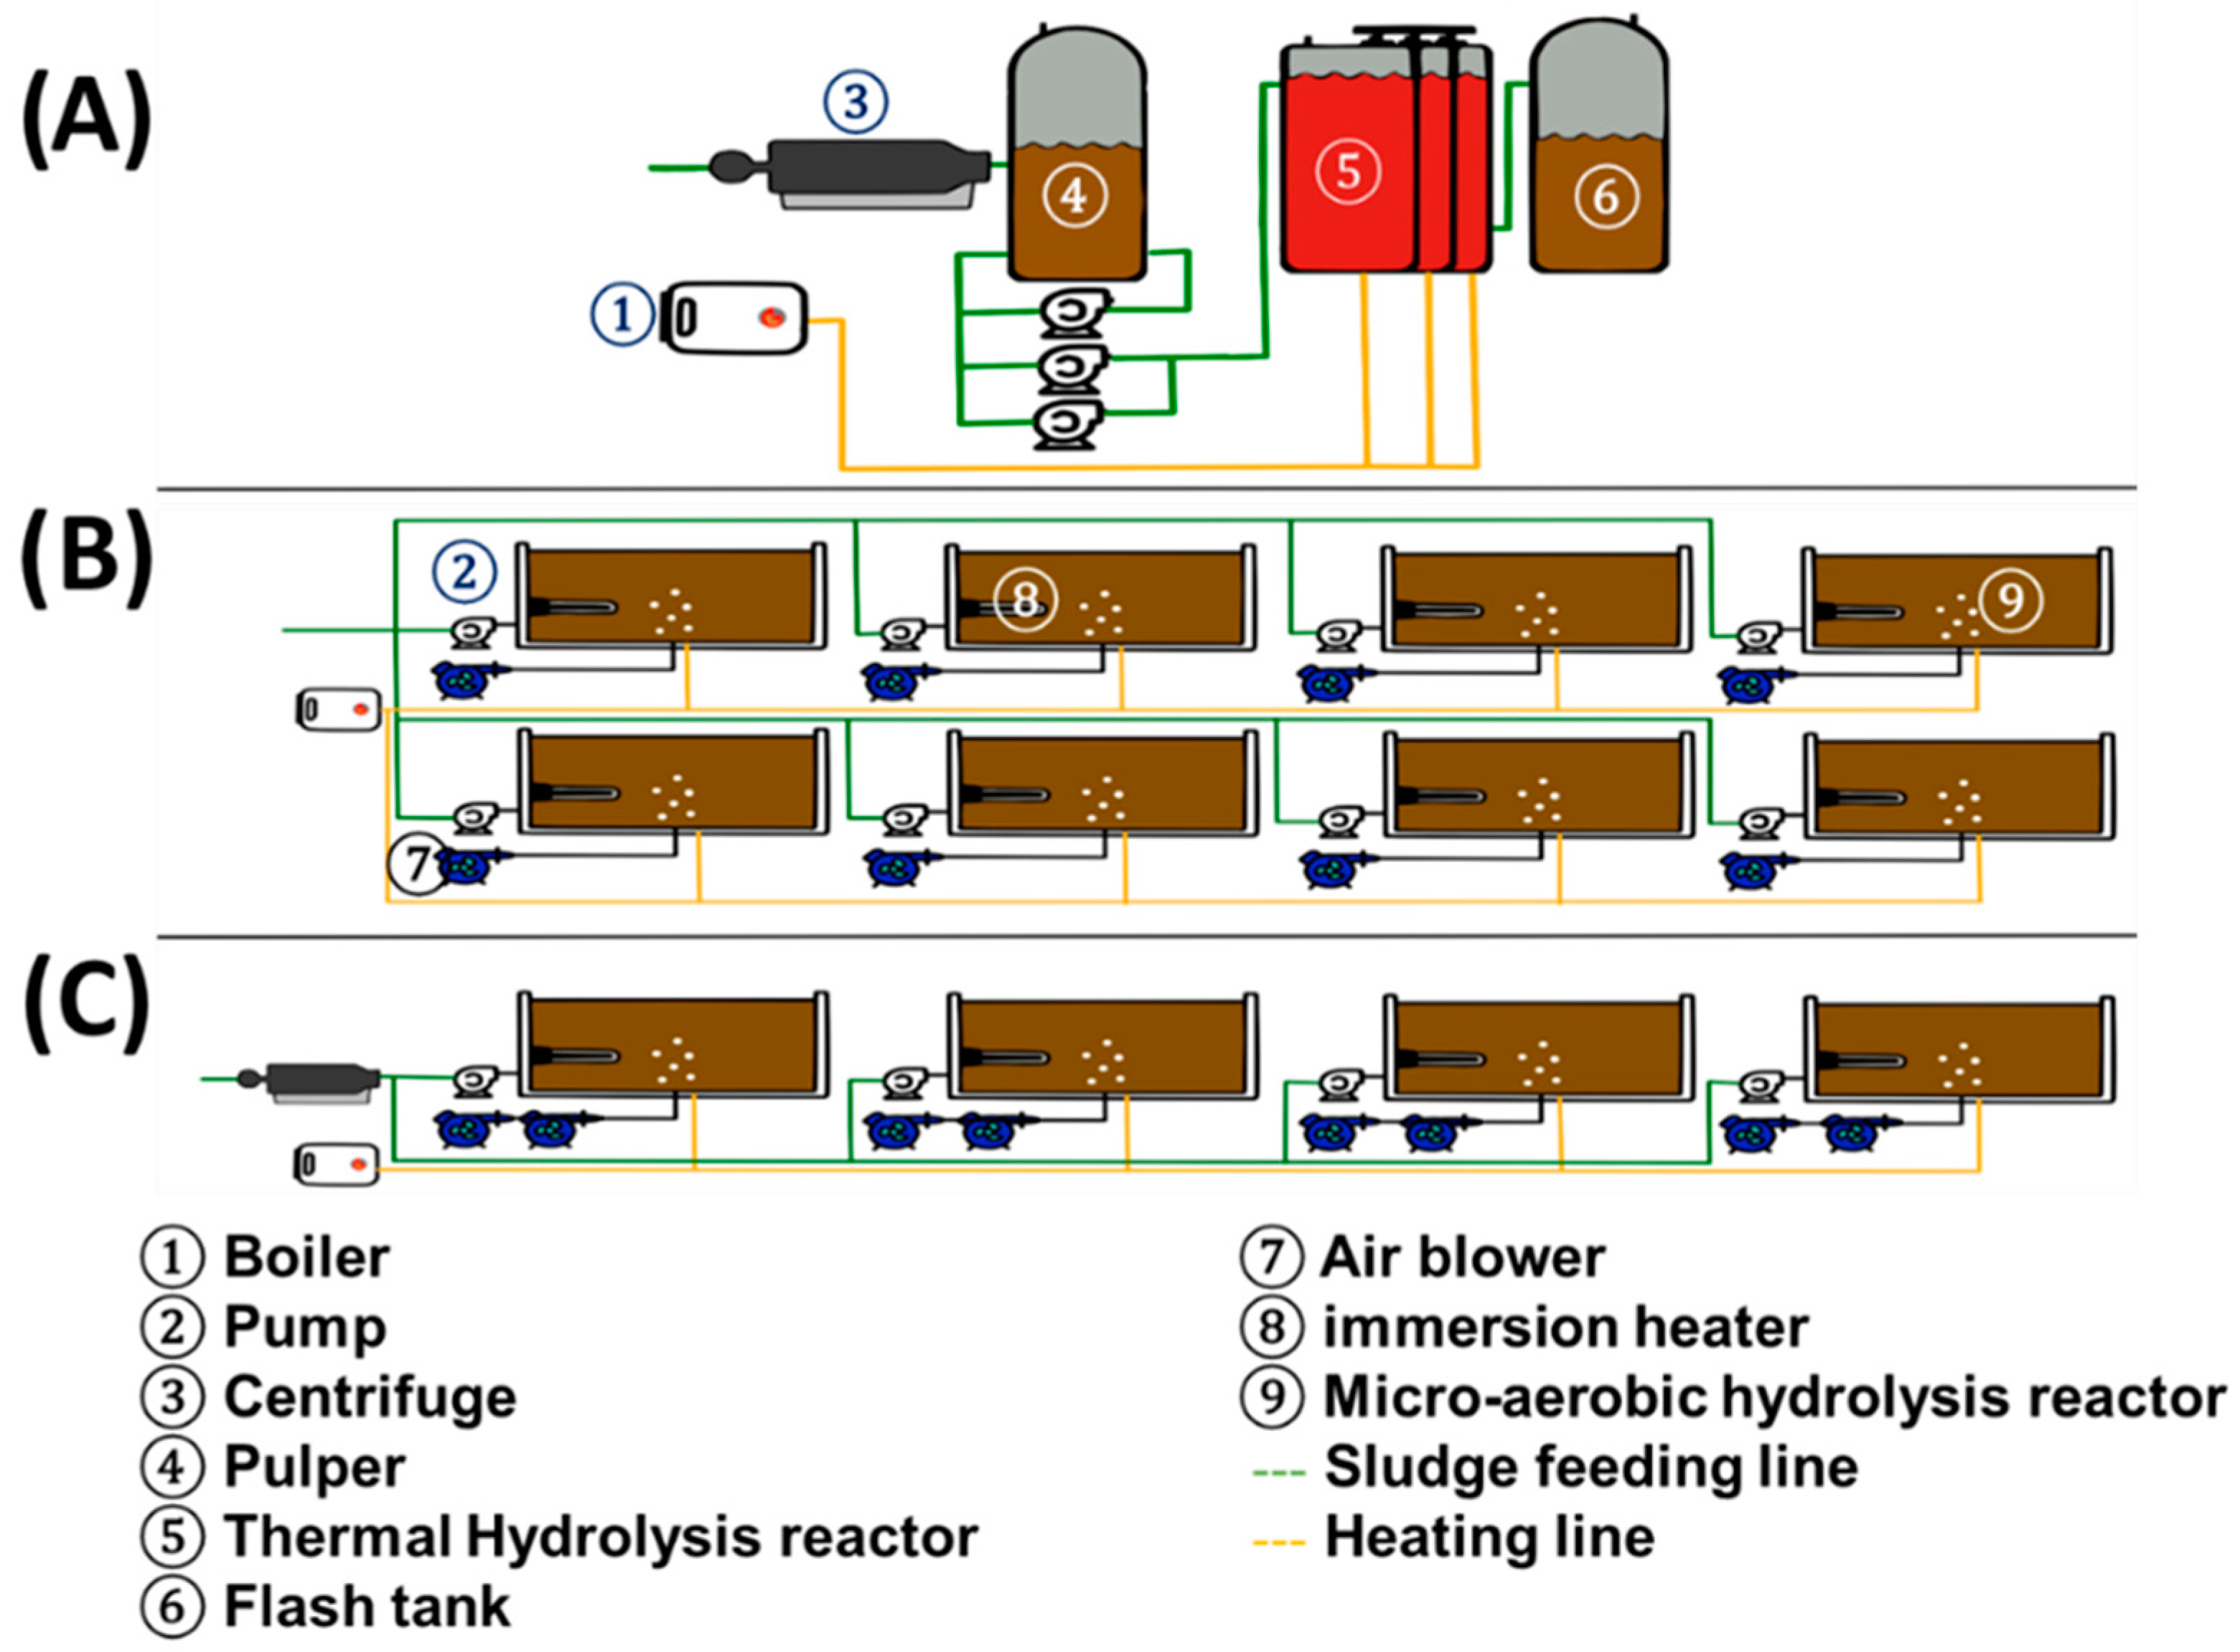
2.2. Experimental Set-Up, Substrate, and Inoculum

The experimental set-up considered three digesters of 1 L operated for 20, 15, and 10 days of HRT at 35 °C. A mixture proportion used in the industrial WWTP feeds all the reactors, i.e., a mixture of raw primary sludge (60% w/w) and pre-treated waste-activated sludge (40% w/w) [6]. A mixed liquor (LM1) fed the first reactor, R1. R1 was a control experiment that simulated the conventional anaerobic process. Further, a mixture of primary sludge and thermally pre-treated waste-activated sludge (LM2) fed the second reactor, R2. The study seeks to compare R2 with a pre-treatment alternative already in use. The last reactor, R3, was the proposed alternative. Thus, a mixture of the primary sludge and micro-aerobically pre-treated waste-activated sludge (LM3) fed R3. The digesters were inoculated with sludge adapted to each substrate. Therefore, a sludge from an anaerobic digester fed with waste-activated sludge (LA1) inoculated R1 and R3. In contrast, a sludge from an anaerobic digester fed with thermally pre-treated waste-activated sludge (LA2) inoculated R3. The sludge used as a substrate comes from the Mapocho/Trebal WWTP except for the micro-aerobically pre-treated one. Table 1 presents the characterization of the substrates and inoculums used.
The study considered daily manual feeding for all the digesters during the 90 days of operation. Average operational parameters were calculated after an adaptation time, one month for the HRT of 20 days, ten days for the HRT of 15, and 10 days for the HRT of 10 days. The calculation of VSS and sCOD degradation did as described by Koch [24]. Equation (1) presents the COD solubilization degree calculation method used, based on Zhang et al. [2]. In this equation, sCODS0 is the soluble COD before the micro-aerobic pre-treatment, sCODS1 is the soluble COD after the micro-aerobic pre-treatment and CODT0 is the total COD before the pre-treatment.
Solubilization   degree % = sCOD S 1 sCOD S 0 COD T 0 sCOD s 0 × 100

2.3. Analytical Methods and Statistical Analysis

Total solids (TS), volatile solids (VS), fixed solids (FS), total suspended solids (TSS), volatile suspended solids (VSS), total ammonia nitrogen (TAN), total and soluble COD were measured by the methods described in APHA [25]. Briefly, TS, FS and TSS were measured in a stove, while the measurement of vs. and VSS were in muffle at 550 °C. TAN was analyzed using flow injection analysis (Lachat’s QuikChem® 8500 Series 2 Flow Injection Analysis System, Loveland, CO, USA). Total and soluble COD were measured by a colorimetric method. Soluble proteins were measured by the method described by Lowry et al. [26]. The methane production measurement was by simple volume displacement. To do this, a serum bag containing a solution of NaOH 3% w/v connects to each digester’s gas outlet. The NaOH solution retains the CO2, and then all the measured gas volume corresponds to methane. The volume of NaOH displaced by the methane production was measured daily in a graduated test tube. Methane production was standardized at 0 °C and 1 bar.
Comparison between experimental conditions was performed through t-student analysis for two samples assuming unequal variances, performed in Excel 2010 (Redmond, WA, USA).

2.4. Energy Demand Analysis

The research uses, as a baseline, a thermal pre-treatment already implemented at the Mapocho/Trebal. This WWTP, located in Santiago de Chile, has a primary process for solids removal. Moreover, an activated sludge for organic matter and nutrient removal and disinfection process. The plant anaerobically digests solids from primary and secondary treatments. The secondary WAS is pre-treated thermally with the CAMBI process before the anaerobic treatment. In this pre-treatment, 300 m3 day−1 thickened waste-activated sludge (160 g TS L−1) is hydrolyzed at 165 °C for 30 min in a CAMBI THP process. A boiler feeds saturated steam at 12 bars to six reactors (7.5 m3 of effective volume) equally distributed over two process lines. For the energy demand analysis, two feeding pumps, a recirculation pump, and a centrifuge in each line were considered, following the equipment used in the Mapocho/Trebal WWTP. The WWTP provided the power of centrifuges, pumps, and use time. With the power and time of use informed, it is possible to estimate the energy requirements of the centrifuges, feeding, and recirculation pumps. The WWTP also provided steam output rate and the capacity of the pumps; thus, the energy requirement calculated in this pre-treatment is as close as possible to the one implemented in the Mapocho/Trebal WWTP. The sum of the energy required for each machinery helps estimate the total energy demand. Further, by calculating its rating (Equation (2)), it is possible to estimate the boiler energy requirement and its time of use by dividing the boiler’s steam-rated output and the steam required by the system obtained by simple heat balance (Equations (3) and (4)).
S . R . O .   h v × 3600   = B . R .
V sludge × ρ × Cp × Δ T h vaporization = m steam
m steam S . R . O .   = t
where S.R.O. is the steam-rated output by the boiler in kg h−1, B.R. is the boiler rating in kW, and hv is the saturated steam enthalpy at 12 bars in kJ kg−1. Furthermore, 3600 is the conversion factor between kW and kJ h−1, msteam is the mass of steam required in kg. Vsludge is the volume of sludge in each reactor in m3 and ΔT is the temperature difference. Recovering the residual heat generated from thermal hydrolysis can pre-heat the sludge; the analysis considers the difference between the pulper (95 °C) and the reactor output (165 °C). Sludge and water properties were assumed equal, so Cp and ρ are water’s specific heat and density, respectively.
Then, the study compared the implemented pre-treatment with two alternatives of micro-aerobic pre-treatment. The same mass flow of sludge was considered (48 Tons sludge day−1) to make a fair comparison. We based the first alternative on the type of sludge pre-treated in the research at a laboratory scale (raw sludge without thickening), which feeds the anaerobic digester (R3). Thus, 1200 m3 day−1 of waste-activated sludge (40 g TS L−1, mass flow = 48 tons d−1) were pre-treated in two lines of eight reactors of 150 m3 of effective volume each. Both lines work alternately in 48 h cycles at 0.35 vvm and 35 °C. Each line contains eight immersion heaters to maintain the temperature in the reactors, eight air blowers, and four feeding pumps. Here, it considers the same feeding pumps as the thermal pre-treatment; thus, each pump supposes the same power. Since thermal insulation, combined with an immersion heater, can maintain the temperature, the system uses a small amount of energy to heat (7 W). According to a local distributor’s catalog (https://repicky.com.ar, accessed on 7 September 2022), the air blower’s size calculates to maintain 0.35 vvm in 150 m3 of volume. With the instruments’ power and time of use, it is possible to estimate their energy requirements. In addition, a boiler allows the heating of the reactors. A ΔT from 22 °C to 35 °C was considered. Energy requirements were estimated, as explained before.
The second alternative of aerobic pre-treatment works similarly, differing by using pre-treated thickened waste-activated sludge (300 m3 day−1 at 160 g TS L−1) on two lines of two reactors of 150 m3 of effective volume each. We assumed that the efficiency of this process in terms of solubilization degree was the same that we obtained experimentally for the waste-activated sludge without thickening (first alternative). Since increasing the solid content will most likely increase the oxygen demand in this alternative, two blowers per reactor were considered. Thus, each line contains four immersion heaters, eight air blowers, one feeding pump per reactor, and one centrifuge. With instruments’ power and time of use, it is possible to estimate their energy requirements. In addition, a boiler facilitates the heating of the reactors. Energy requirements were estimated, as explained before.
Figure 1 presents a schematic view of each process. The Supplementary Material has additional information on the energy balance and equipment used in each process.

3. Results and Discussion

3.1. Micro-Aerobic Pre-Treatment of Waste Activated Sludge

Table 2 summarizes the physicochemical parameters measured for the waste-activated sludge with and without micro-aerobic pre-treatment. The TS, TVS, and VSS were lower in the aerobically pre-treated sludge than in the raw sludge. In contrast, the concentration of ashes suffered a minimal variation (4.12%), which indicates the reduction in TS was affected mainly by the loss of TVS, decreasing by 14.74%, similar to the SSV (14.21%). The decomposition of the extracellular polymeric substances (EPS) attached to the floccules because of the low oxygen content can be responsible for these results. Previous research reported that this decomposition occurs in activated sludge under anaerobic and anoxic conditions [27].
These solid decreasings are lower than those obtained in previous studies of micro-aerobic hydrolysis on mixed sludge [16,28] and can be explained by the nature of the sludge since mixed sludge is partly composed of primary sludge, which is considered a substrate with greater biodegradability [1]. The tCOD decreased by 6.71% during the pre-treatment, a small value compared to the solid diminished. This is a significant result since the purpose of the pre-treatment application is the solubilization of the particulate organic matter (namely solids) for its later biodegradation in anaerobic digestion. In this sense, the concentration of sCOD increased in the pre-treated sludge by 38.8% concerning the raw sludge, showing that the decrease in tCOD was related mainly to solid degradation. In fact, sCOD/tCOD ratio obtained values of 18.9% and 28.1% for the raw sludge and the pre-treated sludge, respectively. This result shows that the micro-aerobic pre-treatment increased the ratio by 10%, which indicates solubilization of the particulate organic matter.
Regarding the soluble proteins, there is an increase in soluble proteins (31.6%) in pre-treated sludge compared to the raw sludge, which can be attributed to the “deflocculating” process observed in activated sludge systems operated with low aeration [16]. Indeed, with micro aeration of 0.35 vvm, the system replays this condition. Since the raw sludge comes from the secondary biological process, its microstructure could be like that of activated sludge [27], so it would react in a similar way when applying low aeration rates.
TAN in the pre-treated sludge increased by 29.38% concerning non-pre-treated sludge because of the release of nitrogen in the hydrolytic process. As a result, the concentration in the pre-treated sludge reached 1728.58 [mg/L], which could be considered high for the subsequent methanogenesis stage in the anaerobic digestion. Indeed, Yellezuome et al. [29] illustrated that the range of the reported inhibitions is between 1500 and 7000 [mg/L]. Thus, the release of TAN in the pre-treatment process must be considered to evaluate possible problems in the anaerobic digestion reactor.
Overall, the applied micro-aerobic pre-treatment reduced the solid content and increased the waste-activated sludge’s protein and COD solubilization, which might improve the performance of a subsequent anaerobic digestion step.

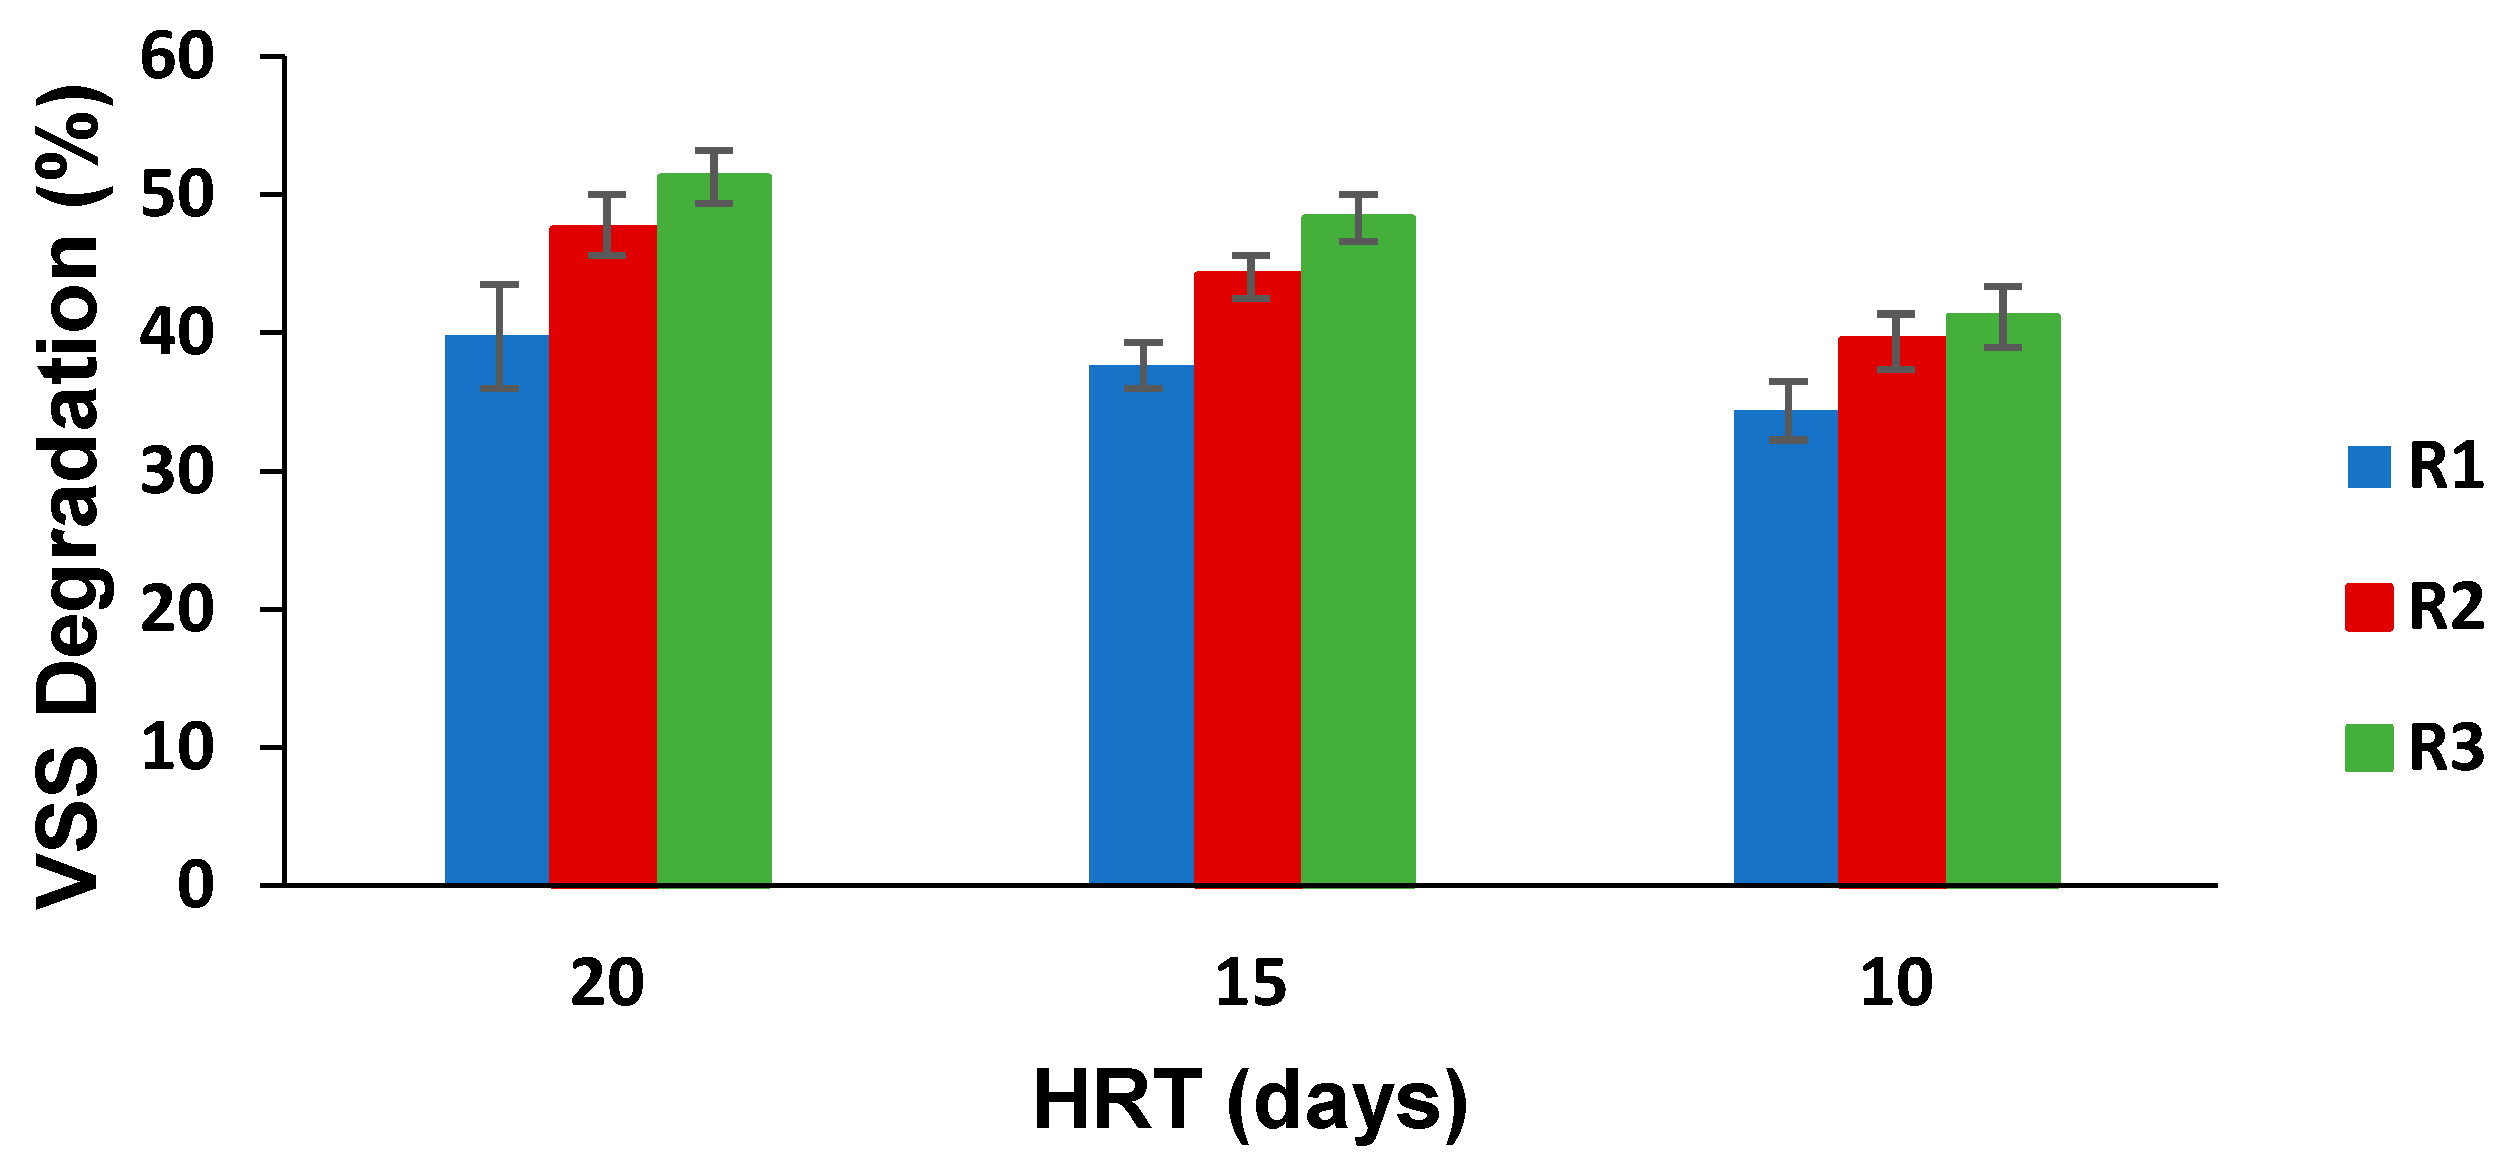
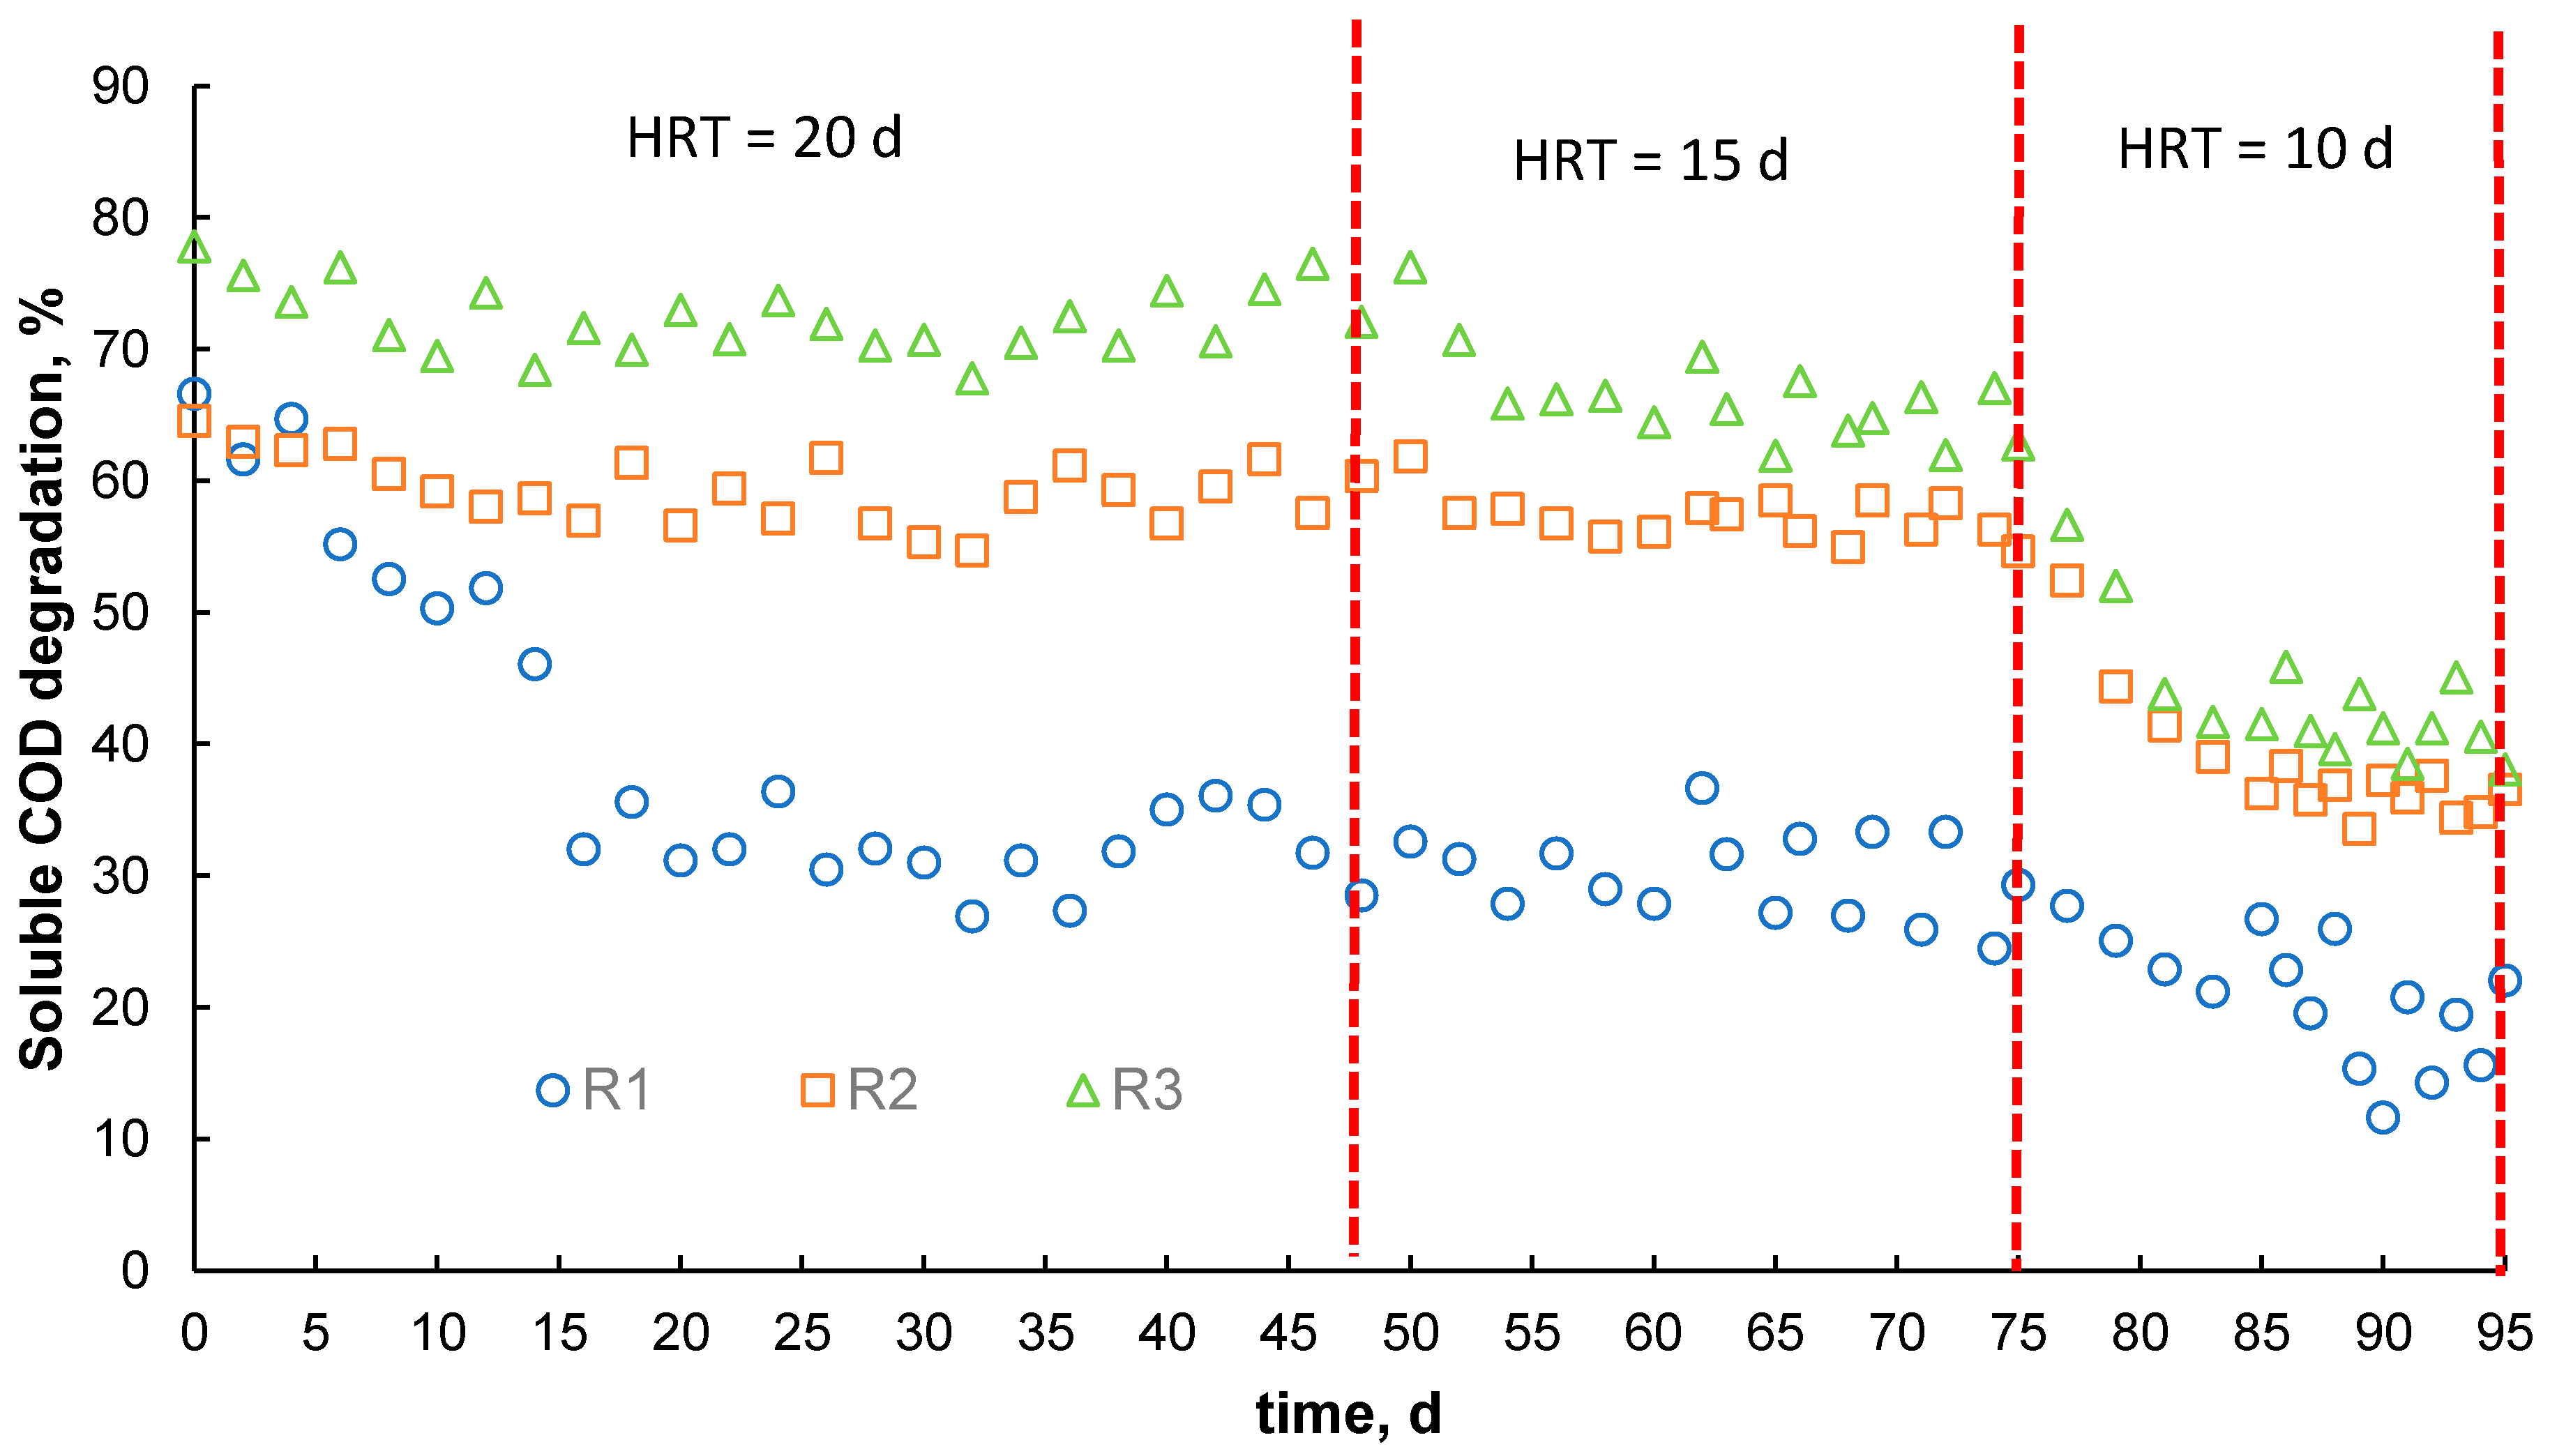
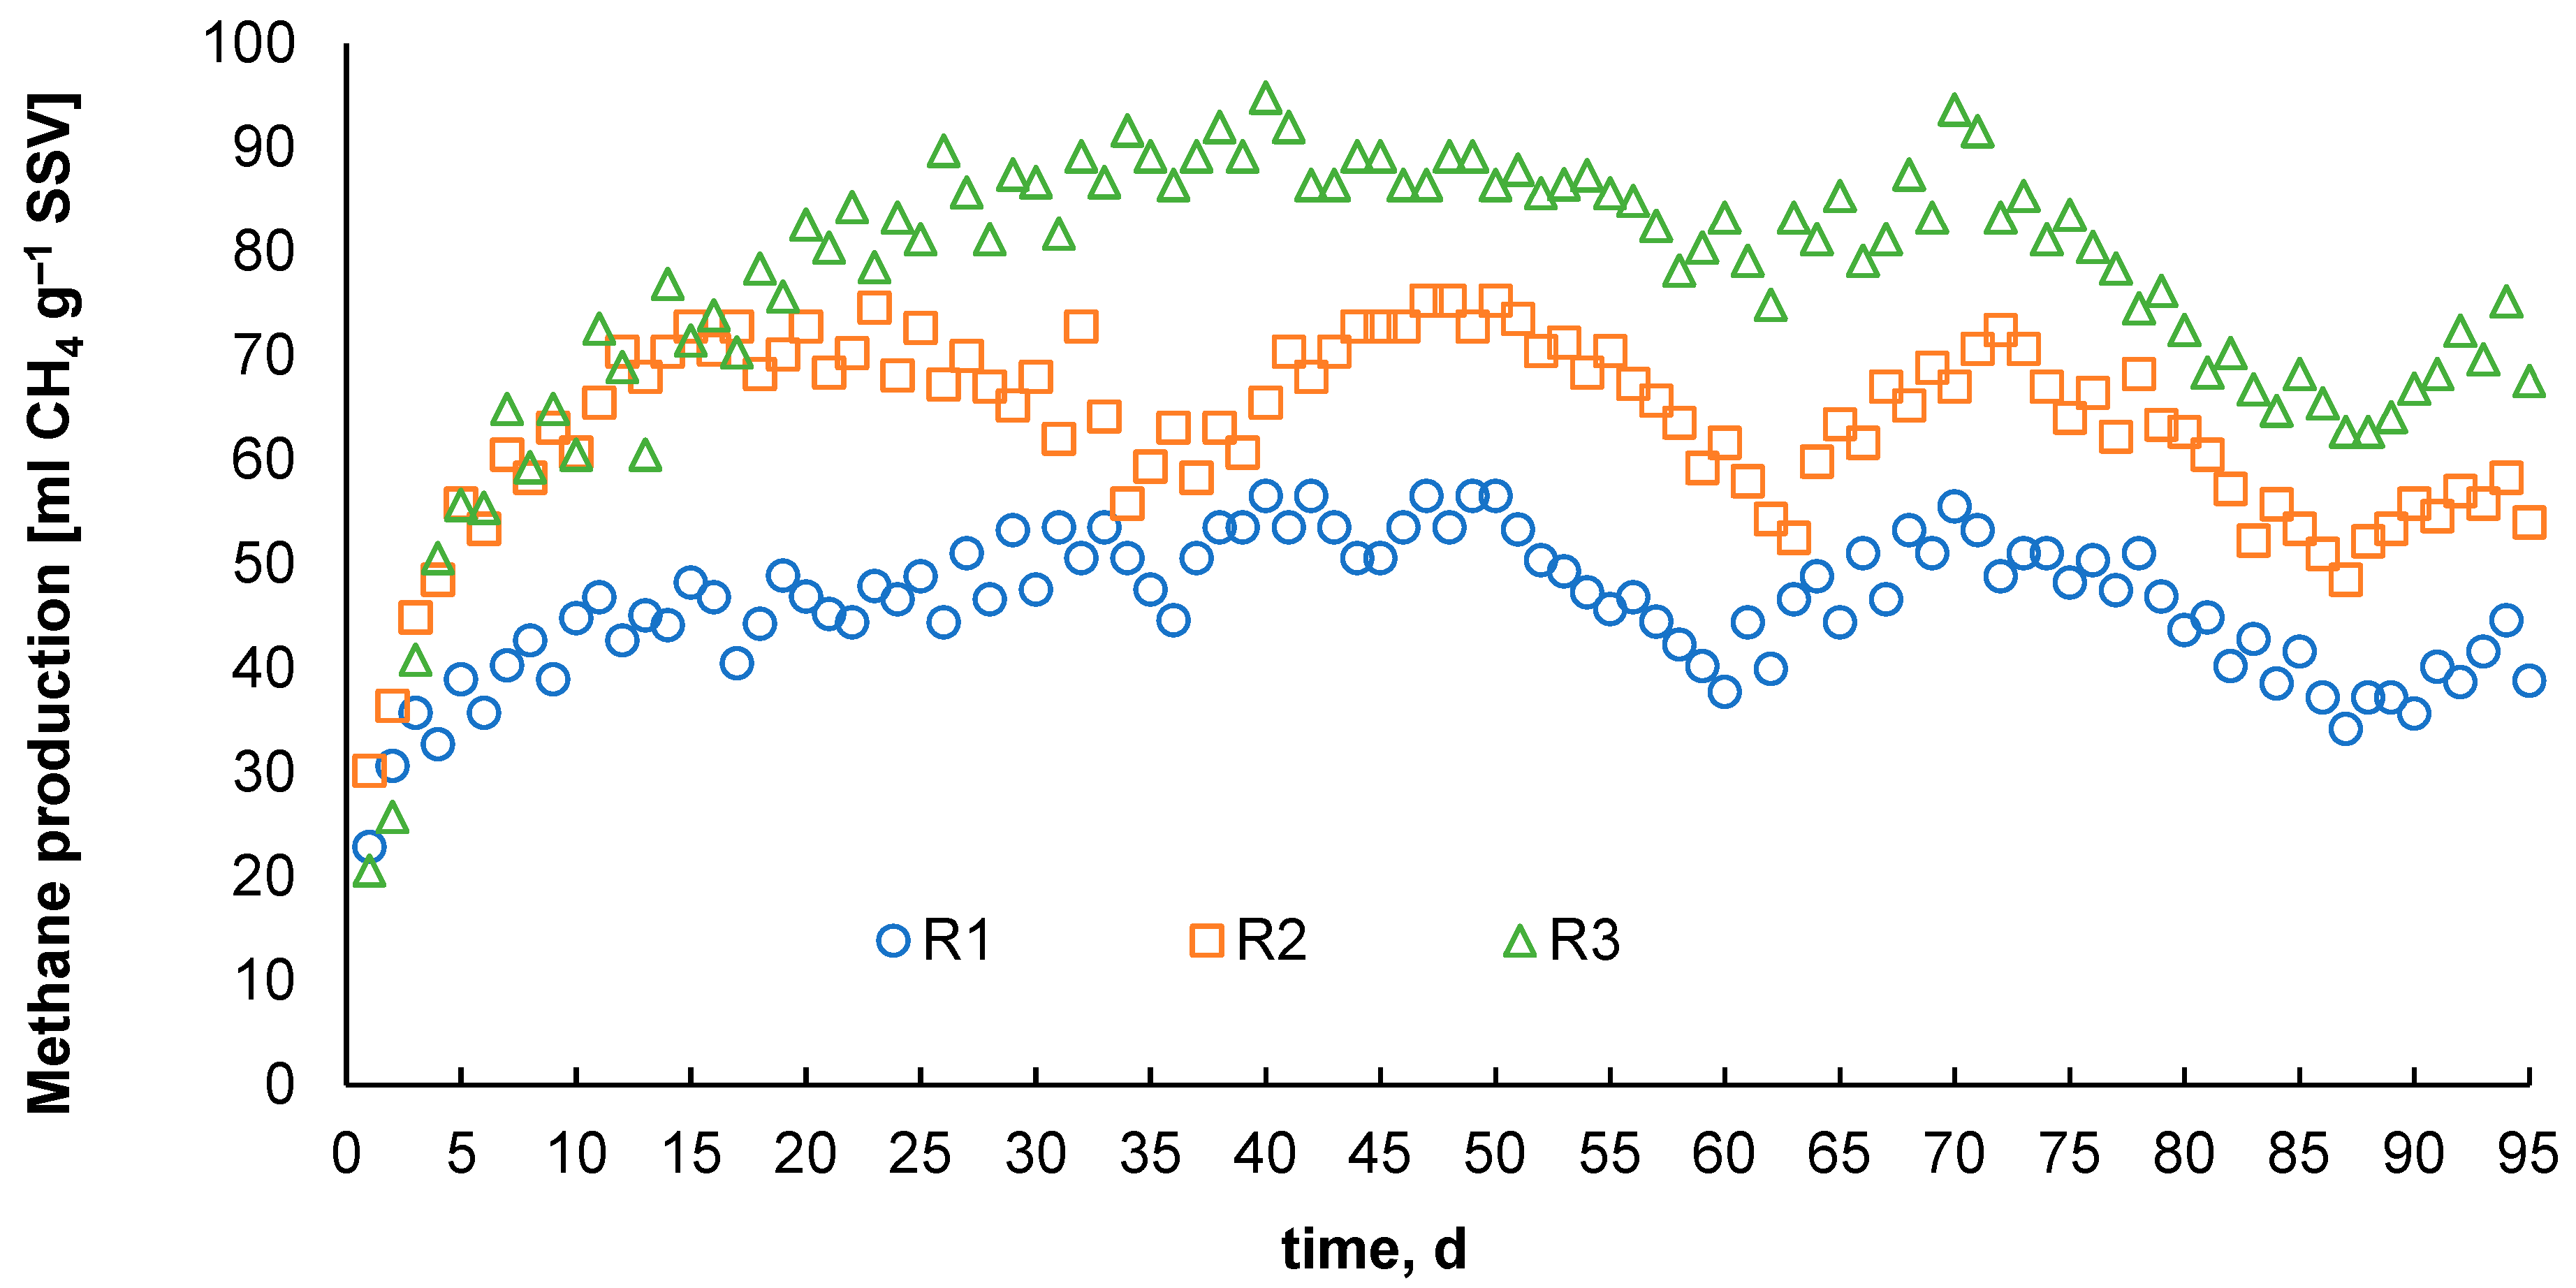
3.2. Anaerobic Digestion of Pre-Treated Sludge

Figure 2 shows the degradation of particulate organic matter measured as VSS at HRT values of 20, 15, and 10 days. The results show that both pre-treatments (i.e., thermal (R2) and micro-aerobic (R3)) allowed a higher degradation of the particulate organic matter for all HRT studied compared to the raw sludge. The highest degradation for all HRT evaluated (i.e., 41.16–51.27%) was for the process fed with aerobically pre-treated sludge. In fact, at HRT = 20 days the VSS degradation was 28.9% higher than the control reactor (R1) for the process fed with aerobic pre-treated sludge (R3). Meanwhile, in the process fed with thermally pre-treated sludge (R2), the increase in VSS degradation concerning the control in the anaerobic digestion was just 19.5%. The results illustrate a similar situation for HRT = 15 days (28.35 and 17.43 of increasing concerning R1 for R3 and R2, respectively); however, for HRT = 10 days, there is no significant difference between the anaerobic digesters fed with both pre-treated sludge (14.95% for R2 and 19.72% for R3 concerning the control). Higgins et al. [30] and Perez-Elvira et al. [31] reported minor improvements in VSS degradation for the control reactor when thermal pre-treatment was used. On the contrary, micro-aerobic pre-treated wastes seem to be a better solution in this aspect, as demonstrated by Xu et al. [18] using food waste and Montalvo et al. [32] using sewage sludge in batch systems. Those studies reached higher solid degradation for micro-aerobic pre-treatment compared to the control reactor treating mixed sludge and the digester fed with thermal pre-treated sludge.
Figure 3 shows the variation of sCOD degradation at the tested HRT. As shown in the Figure, during the first 15 days of operation at HRT = 20 days, there is a decrease in sCOD degradation, which is very strong in R1. From day 16 onward, there is a degradation more stable, obtaining values between 30 and 75%. Under this HRT (i.e., 20 days), the sCOD degradation was higher in the system fed with aerated pre-treated sludge (i.e., 70–80% in R2 and R3). At HRT = 15 days, there is a slight decrease in sCOD removal for all the reactors, being the reactor fed with micro-aerobic pre-treated sludge, which suffers a more substantial fall in sCOD degradation. However, the tendency was similar to that obtained at the HRT = 20 days, in which the highest sCOD removal was obtained in the digester fed with sludge pre-treated micro-aerobically. Finally, at HRT = 10 days, there is a substantial fall in sCOD degradation during the first 10 days for all the conditions due to the higher organic loading rate (OLR) applied. The removal of sCOD in the digesters fed with sludge pre-treated micro-aerobically (R3) and thermally (R2) was similar after 10 days of the acclimation period; although the t-student analysis (p-value < 0.05) showed that there are significant differences in the degradation efficiency between both reactors. However, both pretreatment methods allowed higher degradation efficiency regarding the control system.
Figure 3 also shows that the pre-treatment improved the degradation of the soluble fraction in the anaerobic digestion. The specific values at the steady state are in Figure S1 in Supplementary Data. When observing the soluble COD degradation of both pre-treatments, the micro-aerobic pre-treatment (R3) is more efficient than the thermal pre-treatment (R2) for all the studied conditions. The efficiencies are between 72 and 41% for R3 and 58 and 36% for R2. On the other hand, the higher the HRT value, the greater the difference between the removal efficiencies for each pre-treatment. Indeed, at HRT = 20 days, sCOD degradation difference between R3 and R2 is 23.02%, while at HRT = 15 and 10 days, this difference falls by 14.5% on average. The higher OLR with decreasing HRT can be responsible for this behavior.
The system fed with sludge micro-aerobically pre-treated obtained lower sCOD concentrations in the effluent, except at HRT = 10 d (Table 3). Furthermore, thermal hydrolysis (R2) generates a digestate with a higher content of soluble COD, even higher than the control system (R1). This situation is particularly strong at HRT = 10 days, where the sCOD concentration is almost 50% higher than the value of sCOD concentration of R1 (control) and 27.56% higher than sCOD concentration of R3. This result could be a consequence of either two; a volatile fatty acids accumulation because of the hydraulic retention time used and/or the production of recalcitrant compounds because of the high temperature applied during the thermal pre-treatment [3,33,34,35].
In agreement with the results of solids and soluble COD, the digester fed with sludge pre-treated micro-aerobically (R3) showed a better performance than the ones fed with thermally pre-treated sludge (R2) and un-treated mixed sludge (R1, control) in terms of methane production (see Figure 4). Figure 4 shows that during the first adaptation time (from 0 to 30 days, HRT = 20 d), there is a similar behavior between R3 (with micro-aerobically pre-treated sludge) and R2 (with thermally pre-treated sludge) until day 17, where R3 presents an increase in methane generation. This behavior is explained because both reactors (R2 and R3) fed with pre-treated sludge have greater availability of sCOD to be consumed by the microorganisms participating in the anaerobic digestion process. R1 (control) and R3 reached a steady state approximately on day 16, unlike R2, which reached a steady state on day 25. During the second adaptation time (from 47 to 75 days, HRT = 15 d), a decrease in methane production is observed for all reactors, with a less pronounced drop in the case of R3. This reduction in methane production may be due to the increase in OLR when HRT decreases from 20 to 15 days. An increase in OLR decreases organic matter removal and methane production because the digester (operating as a continuous stirred tank reactor, CSTR) is closer to the limit given by cell wash-out, including the intermediary accumulation that gives more instabilities to the system. During the last adaptation time (75 to 85 days, HRT = 10 d), the decrease in methane production in all the reactors becomes more evident.
The reactors maintained a stable generation of daily methane for all conditions studied. Indeed, in Figure 3, we can see that both show a concordant behavior, i.e., higher sCOD degradation generated higher methane volume, reaching a steady state on similar days.
Figure 4 also shows the steady-state efficiencies (see Figure S2 in Supplementary Data). At HRT = 20 days, the R3 reactor fed with sludge pre-treated micro-aerobically produced 89.1 ± 2.5 mL CH4 g VSS−1, which is 68% higher than the control reactor (R1), fed with raw mixed sludge (52.9 ± 3.4 mL CH4 g VSS−1) and 28% higher than the R2 reactor fed with thermally pre-treated sludge (67.8 ± 6.6 mL CH4 g VSS−1). The same behavior was observed at HRT = 15 days, where 83.6 ± 4.6 mL CH4 g VSS−1 was produced by the R3 reactor, which is 73% and 30% higher than R1 and R2 digesters, respectively (48.3 ± 4.8 mL CH4 g VSS−1 and 64.1 ± 5.8 mL CH4 g VSS−1, respectively). At HRT = 10 days, even though the methane production decreased due to the increase in the OLR, the R3 reactor produced 67.6 ± 4.9 mL CH4 g VSS−1, which is 74% and 25% more than the R1 and the R2 digester, respectively (38.9 ± 3.2 mL CH4 g VSS−1 and 54.1 ± 2.9 mL CH4 g VSS−1). These values of methane production are in the range of values presented in the literature. For example, Ruan et al. [19] showed values between 40 and 95 mL CH4/g VS, while Zhou et al. [36] reported values between 56 and 133 mL CH4/g VS. It is crucial to note that Zhou et al. [36], in their research, used in situ microaeration.
In summary, between 28% and 39% of the increase in methane production was achieved when thermal pre-treatment was used (R2) compared to untreated mixed sludge (R1). These results agree with Ortega-Martinez et al. [37] and Oosterhuis et al. [38], who obtained an increment between 25 and 40% in methane production using thermal pre-treatment under similar conditions. Micro-aerobic pre-treatment (R3), on the other hand, increased 68% to 73% of methane production compared to untreated mixed sludge (R1). These values are higher than the values obtained by Song et al. [39] using paper waste and higher than the values obtained by Ruan et al. [19] in semi-continuous systems, who reported that the micro-aeration pre-treatment of sewage sludge increased by 16.4% the biogas yield to a control system (without pre-treatment). However, these values are lower than the 200% improvement obtained by Montalvo et al. [16] and Rashvanlou et al. [17] with sewage sludge pre-treated under similar conditions. Although, it is essential to point out that these values were obtained in batch operation mode. As Rashvanlou et al. [17] explained, micro-aerobic pre-treatment could increase more than two times the acetic acid and other volatile fatty acids content in the sludge. The same was observed by Xu et al. [18], who obtained up to three times more acetic and butyric acid in food waste pre-treated micro-aerobically compared to the untreated one.
Thus, the semi-continuous assays showed that micro-aerobic pre-treatment improved the solid and sCOD removal in anaerobic digestion and the methane production at several HRT values.

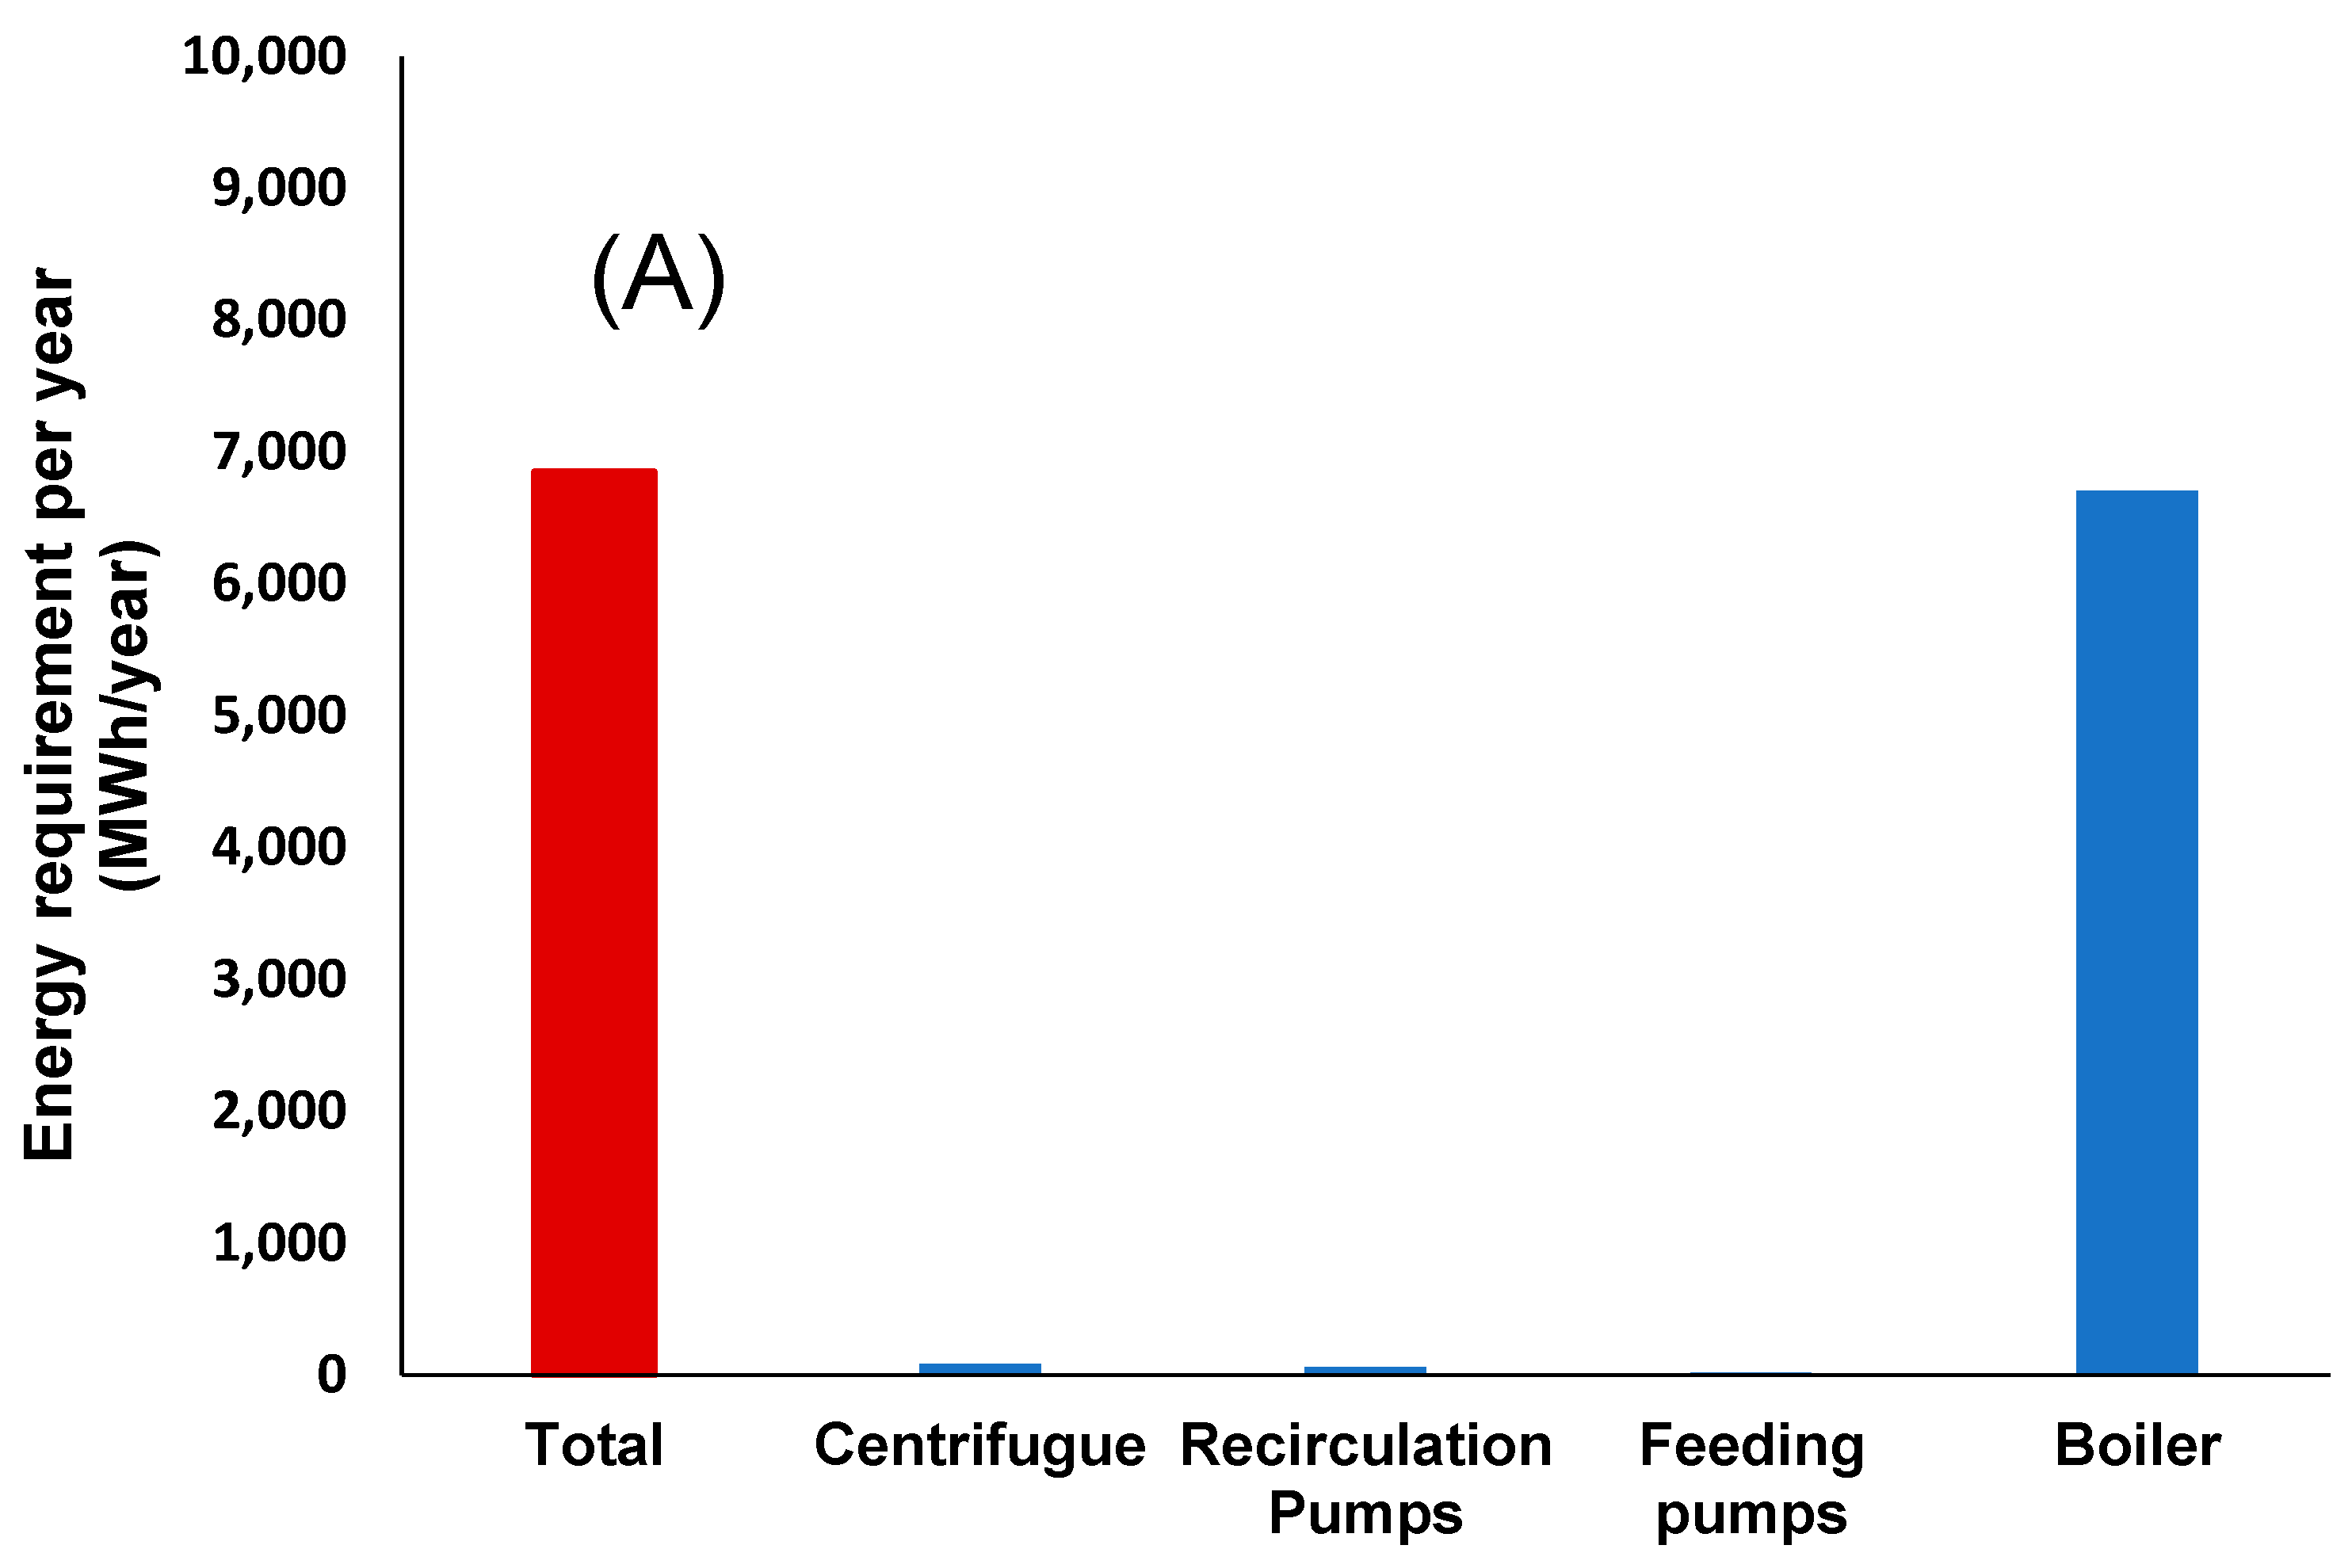
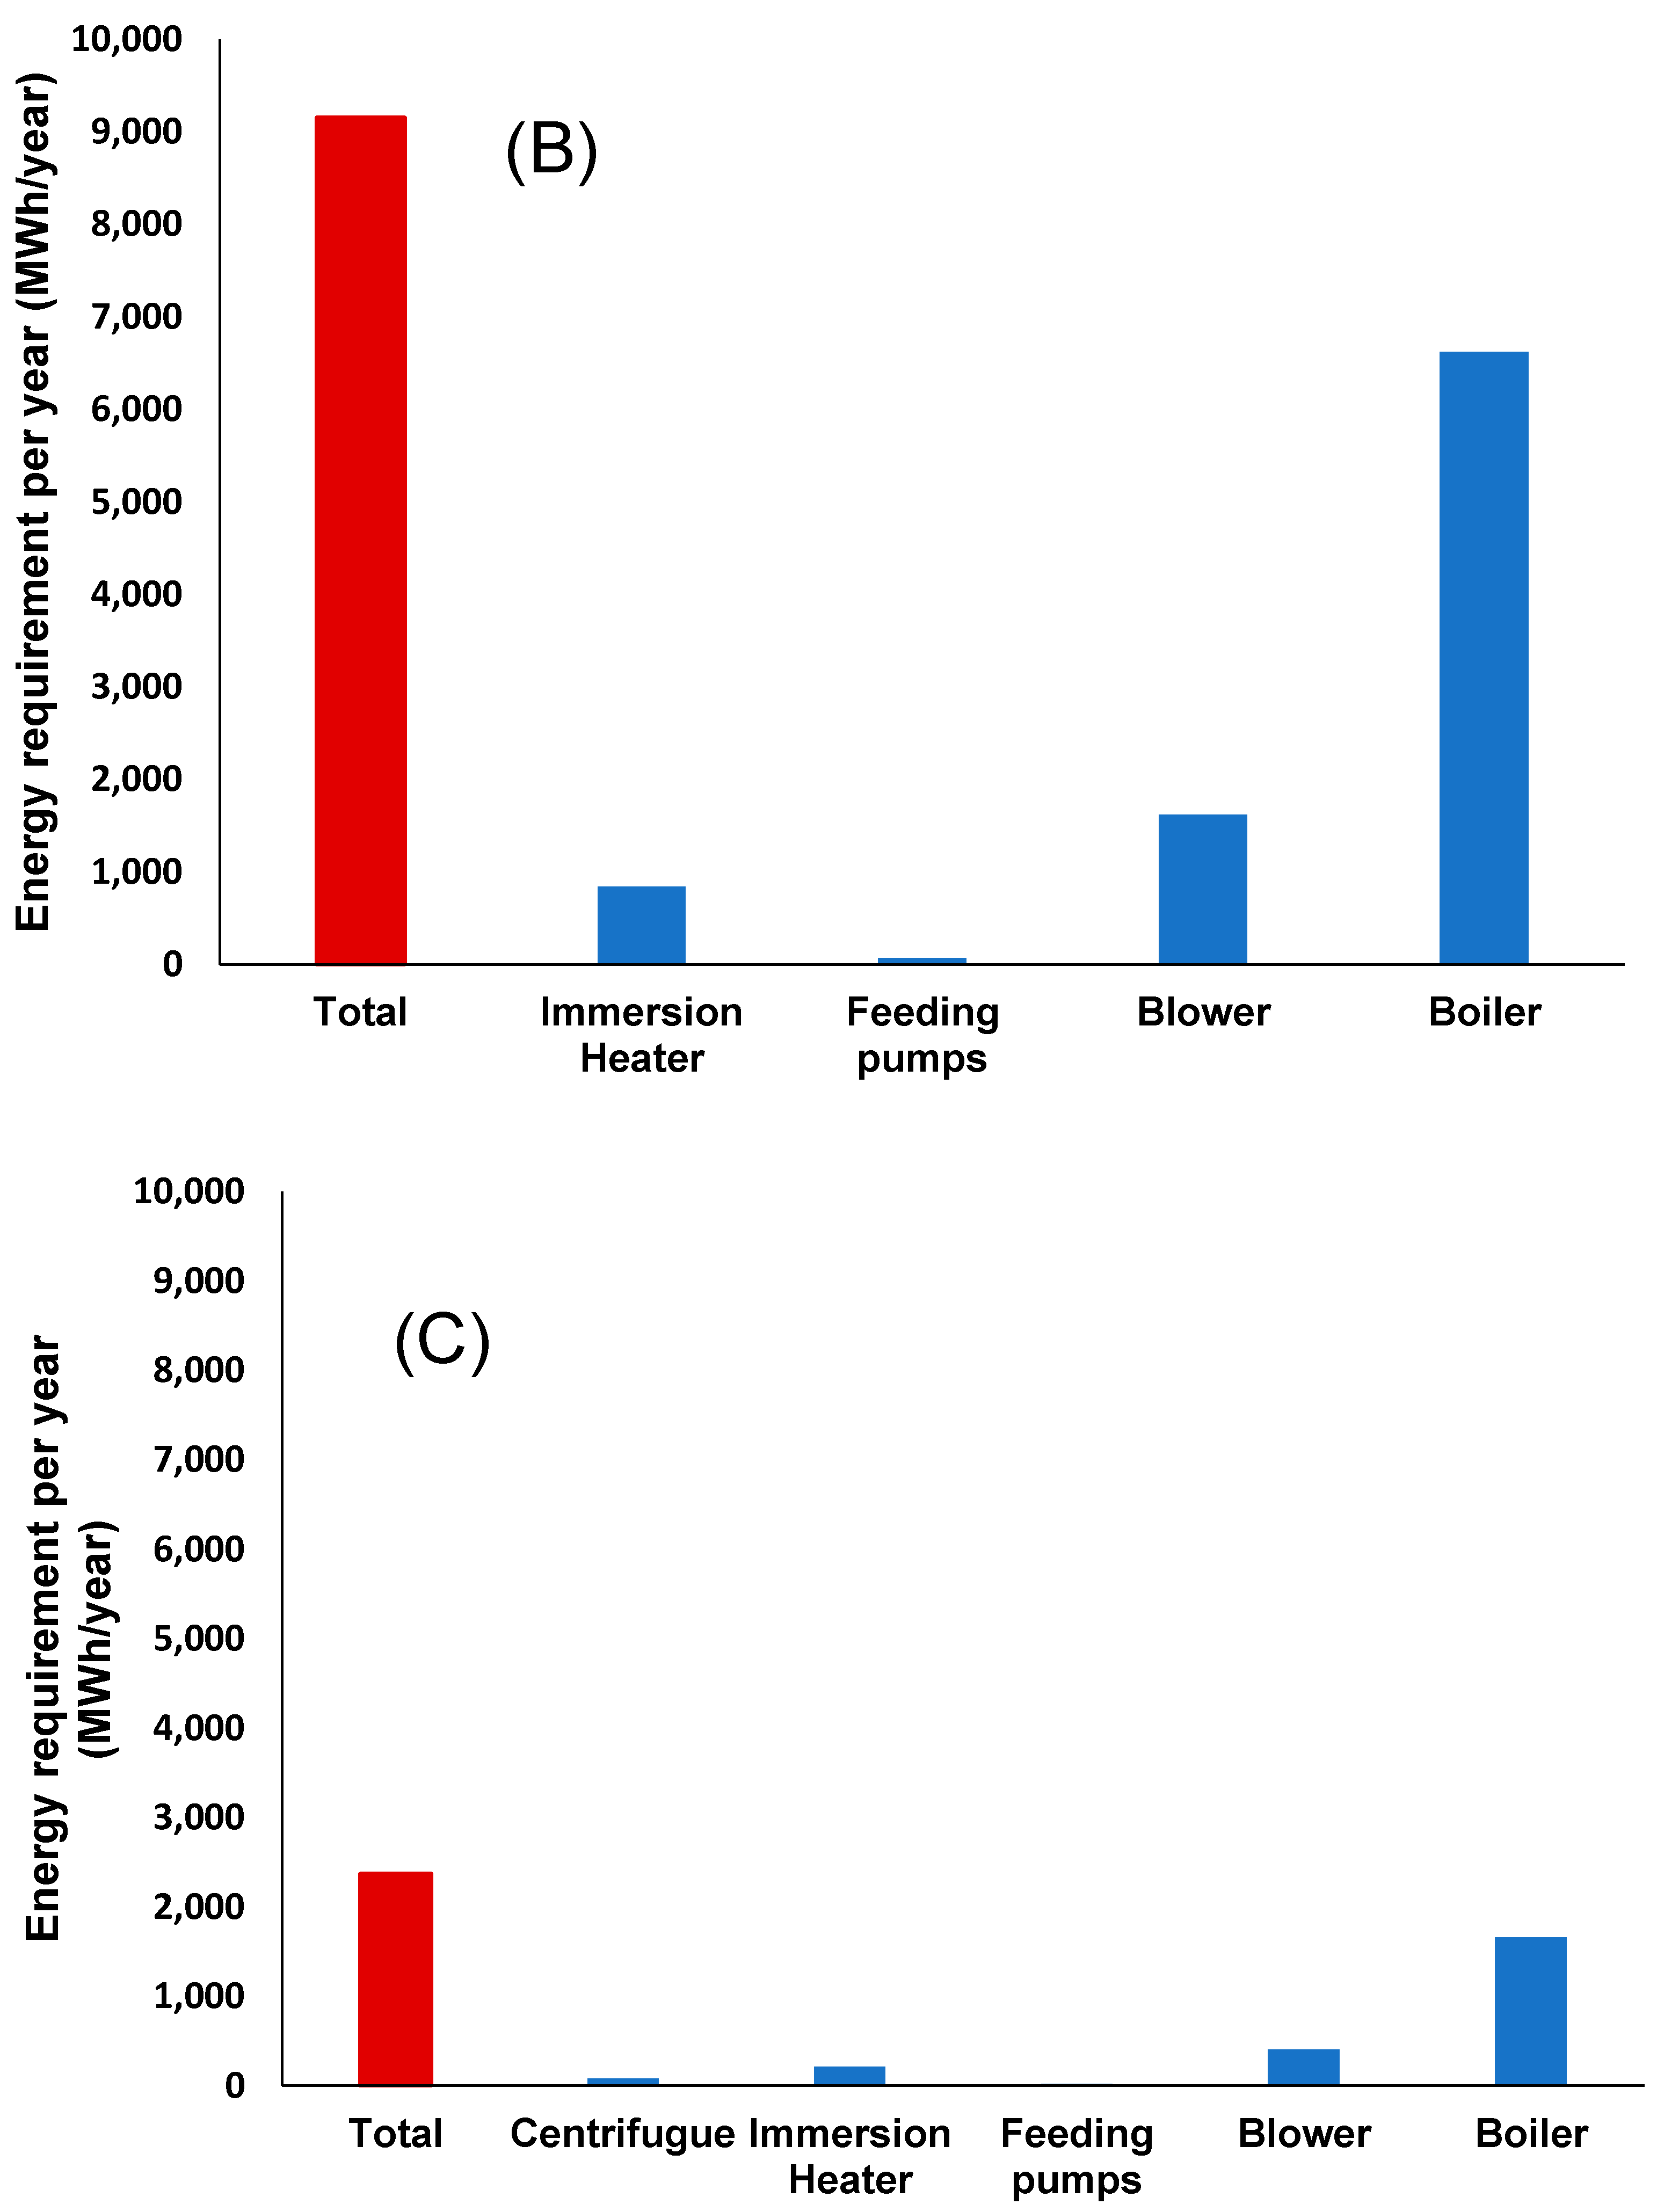
3.3. Energy Requirements Analysis

Figure 5 compares the energy requirements of the three pre-treatment alternatives analyzed. Thermal pre-treatment (Figure 5A) needs around 6.9 GWh year−1 to pre-treat 48 Tons of TS per day−1 of thickened waste-activated sludge (63 kWh m−3 sludge). The boiler uses a large part of the energy; indeed, it uses around 600 kg h−1 of saturated steam (See Supplementary Data), which agrees with what has been reported by Garcia-Cascallana et al. [40] for secondary sludge. These results agree with Cano et al. [20] for a thermal pre-treatment, in which a full-scale CAMBI process with heat recovery from the flash tank requires 50 kWh m−3.
Micro-aerobic pre-treatment (Figure 5B) needs around 9.2 GWh year−1 in order to pre-treat 48 Tons of TS per day−1 of waste-activated sludge (21 kWh m−3 sludge) which is 32% more than the thermal pre-treatment alternative. This value is explained by the high volume of waste-activated sludge needed (1200 m3 of waste-activated sludge at 40 g TS L−1). Nevertheless, if thickened waste-activated sludge uses the same concentration as thermal pre-treatment, annual energy requirements decrease considerably (Figure 5C). As a result, it needs 2.8 GWh year−1 (25 kWh m−3 sludge) 60% for heating, and 30% for aeration purposes, meaning that around ~60% less energy is required annually in this alternative compared to thermal pre-treatment applied to the same sludge.
According to the analysis made by Cano et al. [20], the energy consumption of pre-treatments of sludge can vary between 150 kWh m−3 in the case of microwave and thermal pre-treatment to 1.4 kWh m−3 in the case of ultrasonic pre-treatments. According to these values, micro-aerobic pre-treatment is on the lower end. Using a ball mill (21 kWh m−3) [41] or a thermal hydrolysis pre-treatment with full energy integration using a combined heat and power system (15.2 kWh m−3) [42] obtained similar values for mechanical pre-treatment.
These results illustrate that the applicability of micro-aerobic pre-treatment is also related to the solid’s input. Therefore, further analyses are imperative to verify if the previous advantages mentioned are maintained. Additionally, a dewaterability analysis of the final digestate should be made since the primary energy benefit of thermal pre-treatment is due to the improved dewaterability, which offers the most savings in terms of annual operating costs [3,7].

4. Conclusions

The micro-aerobic pre-treatment improved the solubilization of secondary sewage sludge, with increases in the soluble concentration of proteins (31.6%) and sCOD (38.8%). The comparison of anaerobic digestion of primary sludge together to WAS pre-treated thermally and micro-aerobically at three HRT (20, 15, and 10 days) showed that the micro-aerobic pre-treatment increased considerably methane production, soluble COD degradation, and VSS degradation in comparison to untreated sludge and thermally pre-treated sludge. The energy analysis showed that the energy consumption of micro-aerobic pre-treatment was higher than the thermal pre-treatment, although the consumption of microaerobic pre-treatment can decrease by adding a thickening step because it reduces the volume of aeration and reduces the need for energy. Micro-aerobic pre-treatment could be an interesting alternative if the benefits shown in this article are maintained or improved at high solids input.

Supplementary Materials

The following supporting information can be downloaded at: https://www.mdpi.com/article/10.3390/fermentation8100565/s1, Supplementary Data S1: Energy Requirements Analysis for Micro-aerobic with thickening process; Supplementary Data S2: Energy Requirements Analysis for Micro-aerobic without thickening process; Supplementary Data S3: Energy Requirements Analysis for thermal pre-treatment. Supplementary Data S4: Figures; Figure S1: Values at steady state of sCOD degradation for the R1 (control), R2 (thermal pre-treatment), and R3 (micro-aerobic pre-treatment) digesters at 20, 15, and 10 days of HRT; Figure S2: Average volume at steady state of methane production for the R1 (control), R2 (thermal pre-treatment), and R3 (micro-aerobic pre-treatment) digesters at 20, 15 and 10 days of HRT.

Author Contributions

A.C.: Methodology, Investigation, formal analysis; E.O.-M.: formal analysis, Writing—Review & Editing; J.P.-D.: Writing—Review & Editing; S.M.: Conceptualization, Supervision, Funding acquisition; C.H.: Conceptualization, formal analysis, Writing—Review & Editing, Supervision, Funding acquisition. All authors have read and agreed to the published version of the manuscript.

Funding

The authors gratefully acknowledge the financial support provided by Universidad de Santiago de Chile under DICYT project 091711MM and project 092111HC_AYUDANTE.

Institutional Review Board Statement

Not applicable.

Informed Consent Statement

Not applicable.

Data Availability Statement

All data generated or analyzed during this study are included in this published article.

Acknowledgments

The authors gratefully acknowledge the financial support provided by DICYT project 091711MM and project 092111HC_AYUDANTE. This work is dedicated to the memory of our esteemed and wonderful colleague Silvio Montalvo Martinez, who led this research until his death in October 2019. The authors gratefully acknowledge the support of Engineering Faculty, University of Santiago de Chile.

Conflicts of Interest

The authors declare no conflict of interest.

References

  1. Carrere, H.; Dumas, C.; Battimelli, A.; Batstone, D.J.; Delgenes, J.P.; Steyer, J.P.; Ferrer, I. Pretreatment methods to improve sludge anaerobic degradability: A review. J. Hazard. Mater. 2010, 183, 1–15. [Google Scholar] [CrossRef] [PubMed]
  2. Zhang, B.; Ji, M.; Wang, F.; Li, R.Y.; Zhang, K.Q.; Yin, X.B.; Li, Q. Damage of EPS and cell structures and improvement of high-solid anaerobic digestion of sewage sludge by combined (Ca(OH)(2) + multiple-transducer ultrasonic) pretreatment. Rsc Adv. 2017, 7, 22706–22714. [Google Scholar] [CrossRef] [Green Version]
  3. Gonzalez, A.; Hendriks, A.; van Lier, J.B.; de Kreuk, M. Pre-treatments to enhance the biodegradability of waste activated sludge: Elucidating the rate limiting step. Biotechnol. Adv. 2018, 36, 1434–1469. [Google Scholar] [CrossRef] [Green Version]
  4. Perez-Elvira, S.I.; Sapkaite, I.; Fdz-Polanco, F. Evaluation of thermal steam-explosion key operation factors to optimize biogas production from biological sludge. Water Sci. Technol. 2015, 72, 937–945. [Google Scholar] [CrossRef] [PubMed] [Green Version]
  5. Sapkaite, I.; Barrado, E.; Fdz-Polanco, F.; Perez-Elvira, S.I. Optimization of a thermal hydrolysis process for sludge pre-treatment. J. Environ. Manag. 2017, 192, 25–30. [Google Scholar] [CrossRef] [Green Version]
  6. Donoso-Bravo, A.; Olivares, D.; Lesty, Y.; Bossche, H.V. Exploitation of the ADM1 in a XXI century wastewater resource recovery facility (WRRF): The case of codigestion and thermal hydrolysis. Water Res. 2020, 175, 115654. [Google Scholar] [CrossRef]
  7. Barber, W.P.F. Thermal hydrolysis for sewage treatment: A critical review. Water Res. 2016, 104, 53–71. [Google Scholar] [CrossRef]
  8. Zhang, D.; Feng, Y.M.; Huang, H.B.; Khunjar, W.; Wang, Z.W. Recalcitrant dissolved organic nitrogen formation in thermal hydrolysis pretreatment of municipal sludge. Environ. Int. 2020, 138, 105629. [Google Scholar] [CrossRef]
  9. Arimi, M.M.; Zhang, Y.J.; Gotz, G.; Geissen, S.U. Treatment of melanoidin wastewater by anaerobic digestion and coagulation. Environ. Technol. 2015, 36, 2410–2418. [Google Scholar] [CrossRef]
  10. Lu, D.; Sun, F.Q.; Zhou, Y. Insights into anaerobic transformation of key dissolved organic matters produced by thermal hydrolysis sludge pretreatment. Bioresour. Technol. 2018, 266, 60–67. [Google Scholar] [CrossRef]
  11. Cui, R.R.; Gong, H.; Xu, Y.; Xu, E.H.; Yang, D.H.; Gu, G.W.; Dai, X.H. One-stage partial nitritation-anammox treatment of reject water from high-solid-sludge anaerobic digestion with thermal hydrolysis pretreatment: Inhibition and system recovery. J. Environ. Chem. Eng. 2022, 10, 107958. [Google Scholar] [CrossRef]
  12. Dwyer, J.; Starrenbury, D.; Tait, S.; Barr, K.; Batstone, D.J.; Lant, P. Decreasing activated sludge thermal hydrolysis temperature reduces product colour, without decreasing degradability. Water Res. 2008, 42, 4699–4709. [Google Scholar] [CrossRef] [PubMed]
  13. Yan, W.W.; Xu, H.; Lu, D.; Zhou, Y. Effects of sludge thermal hydrolysis pretreatment on anaerobic digestion and downstream processes: Mechanism, challenges and solutions. Bioresour. Technol. 2022, 344, 126248. [Google Scholar] [CrossRef] [PubMed]
  14. Uthirakrishnan, U.; Sharmila, V.G.; Merrylin, J.; Kumar, S.A.A.; Dharmadhas, J.S.; Varjani, S.; Banu, J.R. Current advances and future outlook on pretreatment techniques to enhance biosolids disintegration and anaerobic digestion: A critical review. Chemosphere 2022, 288, 1323553. [Google Scholar] [CrossRef]
  15. Tamilarasan, K.; Arulazhagan, P.; Rani, R.U.; Kaliappan, S.; Banu, J.R. Synergistic impact of sonic-tenside on biomass disintegration potential: Acidogenic and methane potential studies, kinetics and cost analytics. Bioresour. Technol. 2018, 253, 256–261. [Google Scholar] [CrossRef]
  16. Montalvo, S.; Ojeda, F.; Huilinir, C.; Guerrero, L.; Borja, R.; Castillo, A. Performance evaluation of micro-aerobic hydrolysis of mixed sludge: Optimum aeration and effect on its biochemical methane potential. J. Environ. Sci. Health A Toxic Hazard. Subst. Environ. Eng. 2016, 51, 1269–1277. [Google Scholar] [CrossRef] [Green Version]
  17. Rashvanlou, R.B.; Rezaee, A.; Farzadkia, M.; Gholami, M.; Kermani, M. Effect of micro-aerobic process on improvement of anaerobic digestion sewage sludge treatment: Flow cytometry and ATP assessment. Rsc Adv. 2020, 10, 35718–35728. [Google Scholar] [CrossRef]
  18. Xu, S.Y.; Selvam, A.; Wong, J.W.C. Optimization of micro-aeration intensity in acidogenic reactor of a two-phase anaerobic digester treating food waste. Waste Manag. 2014, 34, 363–369. [Google Scholar] [CrossRef]
  19. Ruan, D.N.; Zhou, Z.; Pang, H.J.; Yao, J.; Chen, G.; Qiu, Z. Enhancing methane production of anaerobic sludge digestion by microaeration: Enzyme activity stimulation, semi-continuous reactor validation and microbial community analysis. Bioresour. Technol. 2019, 289, 121643. [Google Scholar] [CrossRef] [PubMed]
  20. Cano, R.; Perez-Elvira, S.I.; Fdz-Polanco, F. Energy feasibility study of sludge pretreatments: A review. Appl. Energy 2015, 149, 176–185. [Google Scholar] [CrossRef]
  21. Mainardis, M.; Buttazzoni, M.; Gievers, F.; Vance, C.; Magnolo, F.; Murphy, F.; Goi, D. Life cycle assessment of sewage sludge pretreatment for biogas production: From laboratory tests to full-scale applicability. J. Clean. Prod. 2021, 322, 129056. [Google Scholar] [CrossRef]
  22. Kalaiselvan, N.; Glivin, G.; Bakthavatsalam, A.K.; Mariappan, V.; Premalatha, M.; Raveendran, P.S.; Jayaraj, S.; Sekhar, S.J. A waste to energy technology for Enrichment of biomethane generation: A review on operating parameters, types of biodigesters, solar assisted heating systems, socio economic benefits and challenges. Chemosphere 2022, 293, 133486. [Google Scholar] [CrossRef]
  23. Nguyen, D.; Khanal, S.K. A little breath of fresh air into an anaerobic system: How microaeration facilitates anaerobic digestion process. Biotechnol. Adv. 2018, 36, 1971–1983. [Google Scholar] [CrossRef]
  24. Koch, K. Calculating the degree of degradation of the volatile solids in continuously operated bioreactors. Biomass Bioenergy 2015, 74, 79–83. [Google Scholar] [CrossRef]
  25. Association, A.P.H.; Association, A.W.W.; Federation, W.E. Standard Methods for the Examination of Water and Wastewater, 23rd ed.; American Water Works Association: Denver, CO, USA, 2017. [Google Scholar]
  26. Lowry, O.H.; Rosebrough, N.J.; Farr, A.L.; Randall, R.J. Protein measurement with the Folin phenol reagent. J. Biol. Chem. 1951, 193, 265–275. [Google Scholar] [CrossRef]
  27. Xu, Y.; Lu, Y.Q.; Zheng, L.K.; Wang, Z.W.; Dai, X.H. Perspective on enhancing the anaerobic digestion of waste activated sludge. J. Hazard. Mater. 2020, 389, 121847. [Google Scholar] [CrossRef]
  28. Montalvo, S.; Vielma, S.; Borja, R.; Huilinir, C.; Guerrero, L. Increase in biogas production in anaerobic sludge digestion by combining aerobic hydrolysis and addition of metallic wastes. Renew. Energy 2018, 123, 541–548. [Google Scholar] [CrossRef]
  29. Yellezuome, D.; Zhu, X.P.; Wang, Z.Z.; Liu, R.H. Mitigation of ammonia inhibition in anaerobic digestion of nitrogen-rich substrates for biogas production by ammonia stripping: A review. Renew. Sustain. Energy Rev. 2022, 157, 112043. [Google Scholar] [CrossRef]
  30. Higgins, M.J.; Beightol, S.; Mandahar, U.; Suzuki, R.; Xiao, S.; Lu, H.W.; Le, T.; Mah, J.; Pathak, B.; DeClippeleir, H.; et al. Pretreatment of a primary and secondary sludge blend at different thermal hydrolysis temperatures: Impacts on anaerobic digestion, dewatering and filtrate characteristics. Water Res. 2017, 122, 557–569. [Google Scholar] [CrossRef]
  31. Perez-Elvira, S.I.; Sapkaite, I.; Fdz-Polanco, F. Separate Digestion of Liquid and Solid Fractions of Thermally Pretreated Secondary Sludge Assessment and Global Evaluation. Braz. J. Chem. Eng. 2016, 33, 699–704. [Google Scholar] [CrossRef]
  32. Montalvo, S.; Huilinir, C.; Ojeda, F.; Castillo, A.; Lillo, L.; Guerrero, L. Microaerobic pretreatment of sewage sludge: Effect of air flow rate, pretreatment time and temperature on the aerobic process and methane generation. Int. Biodeterior. Biodegrad. 2016, 110, 1–7. [Google Scholar] [CrossRef]
  33. Bougrier, C.; Delgenes, J.P.; Carrere, H. Impacts of thermal pre-treatments on the semi-continuous anaerobic digestion of waste activated sludge. Biochem. Eng. J. 2007, 34, 20–27. [Google Scholar] [CrossRef]
  34. Ortega-Martinez, E.; Chamy, R.; Jeison, D. Thermal pre-treatment: Getting some insights on the formation of recalcitrant compounds and their effects on anaerobic digestion. J. Environ. Manag. 2021, 282, 111940. [Google Scholar] [CrossRef]
  35. Bougrier, C.; Delgenès, J.P.; Carrère, H. Combination of Thermal Treatments and Anaerobic Digestion to Reduce Sewage Sludge Quantity and Improve Biogas Yield. Process Saf. Environ. Prot. 2006, 84, 280–284. [Google Scholar] [CrossRef]
  36. Zhou, Z.; Ming, Q.; An, Y.; Ruan, D.N.; Chen, G.; Wei, H.J.; Wang, M.Y.; Wu, Z.C. Performance and microbial community analysis of anaerobic sludge digestion enhanced by in-situ microaeration. J. Water Process Eng. 2021, 42, 102171. [Google Scholar] [CrossRef]
  37. Ortega-Martinez, E.; Sapkaite, I.; Fdz-Polanco, F.; Donoso-Bravo, A. From pre-treatment toward inter-treatment. Getting some clues from sewage sludge biomethanation. Bioresour. Technol. 2016, 212, 227–235. [Google Scholar] [CrossRef]
  38. Oosterhuis, M.; Ringoot, D.; Hendriks, A.; Roeleveld, P. Thermal hydrolysis of waste activated sludge at Hengelo Wastewater Treatment Plant, The Netherlands. Water Sci. Technol. 2014, 70, 1–7. [Google Scholar] [CrossRef]
  39. Song, C.; Li, W.W.; Cai, F.F.; Liu, G.Q.; Chen, C. Anaerobic and Microaerobic Pretreatment for Improving Methane Production From Paper Waste in Anaerobic Digestion. Front. Microbiol. 2021, 12, 688290. [Google Scholar] [CrossRef]
  40. Garcia-Cascallana, J.; Barrios, X.G.; Martinez, E.J. Thermal Hydrolysis of Sewage Sludge: A Case Study of a WWTP in Burgos, Spain. Appl. Sci. 2021, 11, 964. [Google Scholar] [CrossRef]
  41. Muller, J.A.; Winter, A.; Strunkmann, G. Investigation and assessment of sludge pre-treatment processes. Water Sci. Technol. 2004, 49, 97–104. [Google Scholar] [CrossRef]
  42. Perez-Elvira, S.I.; Fdz-Polanco, F. Continuous thermal hydrolysis and anaerobic digestion of sludge. Energy integration study. Water Sci. Technol. 2012, 65, 1839–1846. [Google Scholar] [CrossRef]
Figure 1. Schematic view of a process line of: (A) Thermal pre-treatment process with thickened activated sludge; (B) Micro-aerobic pre-treatment process with activated sludge; and (C) Micro-aerobic pre-treatment process with thickened activated sludge.
Fermentation 08 00565 g001
Figure 2. VSS degradation for the R1 (control), R2 (thermal pre-treatment), and R3 (micro-aerobic pre-treatment) digesters at 20, 15, and 10 days of HRT.
Fermentation 08 00565 g002
Figure 3. Profiles on time of sCOD degradation for the R1 (control), R2 (thermal pre-treatment) and R3 (micro-aerobic pre-treatment) digesters at 20, 15, and 10 days of HRT.
Fermentation 08 00565 g003
Figure 4. Profile on time of methane production for the R1 (control), R2 (thermal pre-treatment), and R3 (micro-aerobic pre-treatment) digesters at 20, 15, and 10 days of HRT.
Fermentation 08 00565 g004
Figure 5. Annual energy requirements for: (A) thermal pre-treatment; (B) micro-aerobic pre-treatment of waste-activated sludge without thickening; (C) micro-aerobic pre-treatment of thickened waste-activated sludge.
Fermentation 08 00565 g005aFermentation 08 00565 g005b
Table 1. Characterization of the substrates and inoculums used in R1, R2 and R3 digesters.
TS
g L−1
TSS g L−1VSS g L−1sCOD
gO2 L−1
Soluble Proteins mg L−1
R1Inoculum (LA1)28.325.417.53.0-
LM1
(40%WAS, 60% Primary sludge)
42.638.230.211.748.8
R2Inoculum (LA2)33.729.720.18.1-
LM2
(40% Thermally pre-treated WAS, 60% Primary sludge)
49.743.833.328.5342.5
R3Inoculum (LA1)28.325.417.53.0-
LM3
(40% Micro-aerobically pre-treated WAS, 60% Primary sludge)
38.236.429.022.5403.6
Table 2. Variation in different parameters during the micro-aerobic processes.
ParametersWaste Activated SludgeMicro-Aerobically Pre-Treated Waste Activated Sludge Increase or Decrease (%)
TS g L−140.5235.67−11.97
VS g L−134.5729.48−14.74
VSS g L−133.0128.32−14.21
Ashes g L−15.956.19+4.12
tCOD gO2 L−1113.07105.49−6.71
sCOD gO2 L−1 21.3529.64+38.80
Soluble proteins mg L−1 343.23451.70+31.60
TAN g L−11.341.73+29.38
Table 3. sCOD obtained at the outlet of the R1, R2 and R3 digesters at 20, 15 and 10 days of HRT.
sCOD Obtained at the Outlet (g L−1)
HRT 20 DaysHRT 15 DaysHRT 10 Days
R17.99 ± 0.368.19 ± 0.459.41 ± 0.57
R211.72 ± 0.7012.28 ± 0.39 18.18 ± 0.41
R36.2 ± 0.627.87 ± 0.5413.17 ± 0.56
Publisher’s Note: MDPI stays neutral with regard to jurisdictional claims in published maps and institutional affiliations.

