Article

Anaerobic Digestion of Cereal Rye Cover Crop

1
Department of Health Sciences Environmental Health and Sustainability Program, Illinois State University, 324 Felmley Hall of Sciences Annex, Normal, IL 61761, USA
2
Department of Agriculture, Illinois State University, 324 Felmley Hall of Sciences Annex, Normal, IL 61761, USA
3
School of Biological Sciences, Illinois State University, 324 Felmley Hall of Sciences Annex, Normal, IL 61761, USA
*
Author to whom correspondence should be addressed.
Fermentation 2022, 8(11), 617; https://doi.org/10.3390/fermentation8110617
Submission received: 24 October 2022 / Revised: 7 November 2022 / Accepted: 7 November 2022 / Published: 9 November 2022
(This article belongs to the Special Issue Energy Converter: Anaerobic Digestion)

Abstract

:
The rapid growth of cover crop planting area in the U.S. helps with erosion control, soil health, control of greenhouse gases, and also provides abundant biomass for the production of bioenergy and bioproducts. Given the cover crops’ compositional heterogeneity and variability, a tolerate platform technology such as anaerobic digestion (AD) is preferred but has not been widely used for cover crop biorefining. This study evaluated the biogas and methane yields from six cereal rye (Secale cereale L.) cover crops grown in the Midwest, using both bench- and pilot-scale anaerobic digesters. The effects of two critical factors, the total solids (TS) content and ensiling, on digester performance were also investigated. Methane yields of 174.79–225.23 L/kg-VS were obtained from the bench-scale tests using cereal rye as the mono feedstock. The pilot-scale test with no pH adjustment showed a slightly higher methane yield. Ensiling increased the methane yield by 23.08% at 6% TS, but disturbed AD at 8% TS, and failed AD at 10% and 15% TS. Findings from this study would help farmers and the biorefining industry to determine the baseline performance and revenue of cereal rye AD and to develop strategies for process control and optimization.

1. Introduction

USDA defines cover crops as grasses, legumes, and forbs for seasonal cover and other conservation purposes, primarily used for erosion control, soil health improvement, and water quality improvement [1]. Cover crops also mitigate greenhouse gas (GHG) emissions [2,3]. Commonly used cover crops include grasses (i.e., ryegrass), legumes (i.e., peas and clover), brassicas (i.e., radishes), and non-legume broadleaves (i.e., spinach and flax). U.S. farmers reported planting 6.23 million hectares (10,000 m2) of cover crops in 2017, a 50% increase compared to the 4.17 million hectares reported in 2012 [1]. Considering the USDA Census of Agriculture is conducted every five years, researchers have estimated that the U.S. cover crop adoption was roughly 8.09 million hectares in 2020 and has been projected to reach 40.47 million hectares by 2025 [4]. The growing cover crop planting area provides a new biomass source to the biorefining industry. The 2020 variety tests conducted in Tennessee reported mean averages of 2.25, 3.58, and 3.36 tonnes per hectare of dry matter biomass yields for brassicas, cereals, and legumes, respectively [5]. It was estimated that 109–154 million tonnes of biomass could be harvested if cereal rye was grown as a cover crop after corn and soybean harvest in the U.S. This amount of biomass has a liquid fuel potential comparable to the current U.S. ethanol industry [6].
Cover crops are promising feedstocks for biorefining into biofuels and bioproducts. Many publications have addressed the use of oilseed cover crops, such as carinata, camelina, canola, rapeseed, and pennycress, to produce biofuels [7,8,9,10,11]. Bhardwaj reported that canola seed yields in Virginia are more than2.24 tonnes/ha, which results in 896 kg of oil, compared to 358 kg of oil from one hectare of soybean [12]. Taheripour et al. estimated that growing oilseed cover crops in the available area of land for Sustainable Aviation Fuels (SAFs) production could generate up to 92 million tonnes of savings in GHG emissions per year [13]. In February 2022, Nuseed and BP entered a 10-year strategic agreement using a non-food cover crop (Nuseed Carinata) as a biofuel feedstock [14]. A few studies have worked on bioproduct production from cover crops. Shahi et al. isolated lignocellulosic components of five cover crops (rye, oat, clover, vetch, and barley) and concluded that cover crops can be alternative feedstocks for biopolymers production [15]. Senthilkumaran et al. compared cover crop protein contents to other plants and evaluated their properties, such as barrier, thermal and mechanical properties, solubility, surface hydrophobicity, and water uptake capacity, for the production of bioplastics [16]. Patterson et al. reported up to 19.9% dry weight of bioplastic polyhydroxybutyrate (PHB) in camelina sativa seed [17]. PHB is a natural thermoplastic polyester with properties similar to petroleum-based plastics but biodegradable.
One challenge in cover crop biorefining is the cover crops’ compositional heterogeneity and variability. The heterogeneity and variability are caused by the diverse cover crop varieties and the different harvest times and storage methods. In temperate regions, cereal rye and other cover crops would be harvested before maturity [18], leading to structural differences from fully senesced crops. Song et al. found that, with increasing maturity of cereal rye, its water-soluble fraction of dry matter decreased substantially from 28.6% to 15.2%, while the total carbohydrate content stayed roughly constant [6]. Additionally, as cover crops mature, they accumulate more carbon than nitrogen. Therefore, the carbon (C) to nitrogen (N) ratio (C: N ratio) increases [19]. Ensilage (wet storage) is often adopted for processing and storing immature (green) grasses and crops for animal feeds and biofuel feedstocks [1,20]. During the ensiling process, lactic acid-producing bacteria ferment substrates (i.e., carbohydrates) within the feedstock into lactic acid with or without acetic acid, resulting in a pH reduction to inhibit undesirable microorganisms. When the pH decreases to the critical pH value, typically 4.1–5.0, a long-term stable storage process can be successfully established [21,22].
Given the cover crops’ compositional heterogeneity and variability, a highly tolerant biorefining technology such as anaerobic digestion (AD) would be favored. AD has been used to produce biogas from diverse organic wastes with varying compositions [23,24,25,26]. The biogas from AD generally contains 60–70% methane (CH4) and 30–40% CO2 and can be used to produce energy in the form of heat, electricity, and transportation fuels [27,28]. Extensive research exists on AD of lignocellulosic biomass such as corn stover, switchgrass, rice straw, and giant reed [29,30,31,32]. However, there are only a few studies focused on AD of cover crops. Belle et al. co-digested radish cover crop and dairy manure and reported that methane production increased by 39% with radish addition compared to manure only [33]. Feng et al. co-ensiled cover crops (red clover, Trifolium pretense) and barley straw for biogas production and achieved stable biogas yields [34]. Furthermore, they noted that manure addition to the digestion process led to a higher methane yield and buffer capacity [35]. Vlierberghe et al. investigated the effects of concurrent storage and alkali pretreatment on AD of cover crops (cereal rye and sunflower) [36,37]. Igos et al. provided the first overview of the environmental and economic consequences of co-digesting rye and maize for energy production, with large uncertainties [38]. More research is needed to evaluate cover crop AD for bioenergy and the feasibility of system scaleup.
This study focused on the AD of cereal rye biomass. Cereal rye grows 1–2 m tall and is often planted as a cover crop in the fall to provide winter cover between cash crops such as corn and soybean. It was reported that 0.85 million hectares of cereal rye were planted in 2021 [39]. The Midwest Cover Crops Council rates cereal rye as an excellent nitrogen scavenger, soil builder, erosion fighter, weed fighter, and grazing [40]. This study aims to: (1) compare the biogas and methane yields of six different cereal rye populations that were planted and harvested in the Midwest; (2) verify the cereal rye methane potential in a complete-mix pilot-scale digester; and (3) evaluate the effects of ensiling and total solid (TS) contents on cereal rye methane yields. In this study, cereal rye biomass was used as the mono feedstock, not co-digested with manure or other feedstocks. This strategy would allow broad applications of cereal rye biomass for bioenergy production.

2. Materials and Methods

2.1. AD Feedstocks, Inoculum, and Micronutrients

Feedstocks for biogas yield comparison. Six different cereal rye (Secale cereale L.) populations were broadcast seeded and raked in fall 2020, and each one was sown on 1.52 m × 1.52 m plots in the Illinois State University (ISU) Horticulture Center located in Normal, IL, USA (latitude 40.51° N), and harvested in May 2021. Out of the six cereal rye, Elbon, Wheeler, and Wrens Abruzzi are pure populations and commercially available, Winter Grazer (seeds purchased from Pennington) and PH2019 (ProHarvest seeds, variety not stated, sourced grain from South Dakota) are not pure populations but are commercially available, and ISURF Mix is a local selection of the rye grown and harvested from the ISU farm located outside Lexington IL, USA (latitude 40.64° N). The top, middle, and bottom sections of the cereal rye were hand harvested separately. Each section was about 1/3 of the total height. Collected biomass was air-dried to less than 10% moisture content for three months, from May to August 2021, in a greenhouse. To measure the mass distribution in the top, middle, and bottom sections, 20 pieces of each section were randomly selected and weighted. Finally, biomass was ground into small particles (estimated 5 cm) using an electric shedder before use.
Feedstock for ensiling. Cereal rye (variety not stated) was planted on the ISU farm at Lexington, IL, and harvested green in May 2020. The green biomass contained 76% moisture content and was chopped to 5 cm using an electric shedder. Then, the biomass was loaded into a plastic silage bag and pressed to push out air for ensiling. No additives were added during the six-month ensiling process from May 2020 to November 2020. The same green biomass was also air-dried to less than 10% moisture content at normal room temperature. Both the dried and ensiled cereal rye were used as AD feedstocks for comparison.
Effluent and micronutrients. Digestion effluent taken from a mesophilic liquid anaerobic digester (fed with municipal sewage sludge operated by the Bloomington Normal Water Reclamation District, IL, USA) was used as the inoculum. Digestion effluent provides nutrients and already-adapted digestion microbes. The inoculum was kept in a 37 °C incubation chamber before use. Commercial BioGas1 AD micronutrients were purchased from Aquafix, Inc., in Madison, WI. The BioGas1 contains bioavailable cobalt, nickel, and iron. Lignocellulosic biomass, including cover crops, usually does not contain sufficient micronutrients for AD. Addition of micronutrients helps stabilize the AD process.

2.2. AD Experimental Setup

Comparison of cereal rye biogas yields. Batch AD experiments were carried out using 0.5-L glass reactors with triplicates in 37 °C incubators. Digestion effluent and DI water were added to achieve an overall TS content of 4% (wet basis) and a feedstock/inoculum ratio (F/I ratio) of 6 based on the volatile solids. A total of 54 reactors (6 populations × 3 sections for each population × 3 reactors for each sample) were made as the treatments, and two reactors without adding feedstock were made as the controls. In addition, 1 mL BioGas1 micronutrients were added to each reactor. A 5-L Tedlar gas bag (CEL Scientific, Santa Fe Springs, CA, USA) was attached to each reactor to collect biogas every 3–7 days depends on the biogas volume during the 38-day experimental period.
Ensiled cereal rye AD experiment. To examine the effects of TS on AD performance, the ensiled cereal rye biomass was mixed with inoculum and DI water to achieve a series of TS contents at 6%, 8%, 10%, and 15%. The same procedure was applied for the non-ensiled cereal rye biomass. As described above, AD experiments were carried out in 0.5-L glass reactors for all samples with triplicates in 37 °C incubators. 1 mL BioGas1 micronutrients were added to each reactor. A total of 24 reactors were made as the treatments, and two reactors without adding feedstock were made as the controls. For each reactor, a 5-L bag was attached to collect biogas every 2–3 days during the 40-day experimental period.
Pilot-scale batch AD experiment. Pilot-scale digesters were purchased through quasar energy group (Cleveland, OH). The digester is made of stainless steel and has an inner space of 120 L (diameter 50 cm, height 61 cm). It is equipped with a temperature controller that regularly checks the feedstock temperature every 10–99 s, a two-blade stir with an adjustable speed of 0–150 rpm, a hydraulic pump that opens or closes the lid, a feedstock feeding port, a biogas collection port, an observation port with a flashlight, a discharge outlet in the bottom, and a pressure release valve. A picture of the pilot-scale digester is provided in the Supplementary Materials (Figure S1). For this experiment, the temperature inside the digester was checked every 40 s and maintained within the range of 37–39 °C. The stir bars were controlled at 15 rpm to mix feedstock. The air-dried top, middle, and bottom sections of the Elbon cereal rye were re-mixed together based on mass distribution. A total of 1.2 kg of air-dried Elbon biomass was used as feedstock for a batch AD experiment. Digestion effluent and DI water were added to achieve an TS of 2.9% and a F/I ratio of 1.7 based on the volatile solids. In addition, 140 mL of micronutrients were added. The solids content designed for this experiment was lower than the bench-scale experiments to reduce biomass floating problems. The volume of the feedstock inside of the digester was estimated to be 70 L, leaving a 50-L headspace. An airtightness test was performed prior to the experiment to avoid gas leaking. No smell of biogas was noticed during the experiment. A 50-L Tedlar biogas bag was attached to collect biogas every 0.5–2 days during the 46-day experimental period.

2.3. Sampling and Analytical Methods

Biogas was collected in bags, and the composition of biogas, consisting of CH4, CO2, O2, H2S, and balance gas (mainly N2), was measured using a biogas analyzer (Landtec Biogas 5000, Dexter, MI, USA). The analyzer was calibrated by the manufacturer before the test and was checked monthly using the calibration gas (mixture 3: 60% CH4 and 40%CO2) and 100 ppm H2S, both purchased from Landtec. An in-line membrane filter was installed to remove water vapor from the produced biogas prior to the composition analysis. The volume of the biogas produced from the bench tests was measured at a normal lab condition using the biogas analyzer built-in flowrate meter at 0.55 lpm (liter per minute). The volume of the biogas produced from the pilot-scale digester was measured at a normal lab condition using an air sampling pump and a mechanical flowmeter at 10 lpm. For the bench digesters, liquid and solid samples were taken at the beginning and the end of the experiments. For the pilot-scale digester, an approximate 20 mL liquid sample was taken from the discharge every week.
The digested feedstock samples were stored in a −20 °C freezer before analysis. The total solids (TS), volatile solids (VS), pH, and alkalinity of the feedstock and inoculum were measured based on a slightly revised Standard Methods Examination of Water and Wastewater [41]. Specifically, the samples were oven-dried at 105 °C for 24 h, using a Fish-Scientific Isotemp oven, to calculate TS content based on the weight difference. The dried samples were then put into a 450 °C oven (Fish-Scientific Isotemp Muffle Furnace, West Sacramento, CA, USA) for 4 h to measure volatile compounds. The pH value and alkalinity were found by diluting a 5 g sample with DI water for a total of 50 mg and then measured using a pH titrator (Hach AT1000 Potentiometric Titrator, Hach Company, Loveland, CO, USA). Ammonium nitrogen was analyzed using a Hach DR1900 Spectrophotometer, following the Hach method 10031. Organic compounds such as acid detergent fiber (ADF) and neutral detergent fiber (NDF) were analyzed using wet chemistry methods by the Midwest Laboratory, Inc., in Omaha, NE, USA. All samples were measured in triplicate.

2.4. Data Analysis

Measured biogas and methane production data were fitted into a modified Gompertz model to determine the theoretical cumulative methane yield, maximum daily methane yield, and lag phase during the AD process. Details about this model have been provided in a previous study [42]. The three parameters and their standard errors were calculated using an online tool (https://mt.procycla.es/bmp/app, accessed on 5 November 2022). ANOVA (analysis of variance) and t-test were conducted using the software R Studio (Version 2022.02.2, Posit Software, Boston, MA, USA) to compare the digester performance, such as methane yields. Mean averages and standard errors were reported in figures using the software SigmaPlot (Version 13, SPSS Inc., Chicago, IL, USA). Outliers were excluded from the mean average and standard error calculations. A significance level of 0.05 was used.

3. Results and Discussion

3.1. Analysis of Cereal Rye Biomass

All air-dried cereal rye samples had a TS content of over 93% and a VS content of over 84% (Table 1). The top parts generally had higher solids contents than the bottom parts. Due to the high solids content, no microbial contamination was observed. The dry matter distribution percentages of the top, middle, and bottom sections were 29.1/32.5/38.4, 38.4/29.1/32.5, 42.5/30.5/27.0, 35.7/28.5/35.7, 29.8/30.0/40.2, and 35.9/36.0/28.1 for Elbon, Wheeler, PH2019, Wrens Abruzzi, Winter Grazer, and ISURF mix, respectively. A figure of the distribution was provided in the Supplementary Materials Figure S2. The dry matter distribution was not consistent. The cereal rye was hand harvested, which may have partially caused the inconsistency in the dry matter distribution.

3.2. Comparison of Cereal Rye Methane Yields

Digesters were healthy during the batch experiment. The pH values (7.96–8.23) and ammonium-N concentrations (0.35–0.56 g/L) were within normal ranges at the end of the experiment [43,44]. The cumulative methane yields from the cereal rye are shown in Figure 1. The Elbon and Wheeler samples had relatively lower methane yields, while the Winter Grazer and ISURF Mix samples had relatively higher yields. ANOVA tests showed that there were significant differences among the bottom, middle, and top plant sections for Elbon (p = 0.0185), Wheeler (p = 0.0309), Wrens Abruzzi (p = 0.00522), ISURF Mix (p = 0.0381), but not for PH2019 or Winter Grazer. If integrate all three sections based on the distribution of VS, the overall methane yields from the six populations were 174.79, 174.55, 193.65, 182.22, 213.30, and 225.23 L/kg-VS for Elbon, Wheeler, PH2019, Wrens Abruzzi, Winter Grazer, and ISURF Mix, respectively. The results were lower than the previously reported cover crop BMP (biochemical methane potential). Feng et al. reported BMP of mixed cover crops (mainly red clover, Trifolium pretense) at approximate 265 and 332 L/kg-VS after 30 and 90 days experiment, respectively, under a thermophilic condition and an F/I ratio of 1, based on VS content [34]. Vlierberghe et al. reported the BMP of oat and rye at an estimated 290–370 L/kg-VS after up to 180 days of alkaline storage and pretreatment [36,37]. The differences in feedstock and experimental design could have caused the different methane yields. A figure of the cereal rye methane yields over time was included in the Supplementary Materials Figure S3.
The methane yields obtained from cereal rye in this study are comparable to many other non-pretreated lignocellulosic biomass such as crop residues and energy crops. Previous studies have reported methane yields of 182–285 L/kg-VS for corn stover [45,46], 179–274 L/kg-VS for wheat straw [47,48], 135–309 for switchgrass [49,50], and 82–200 for miscanthus [51,52], respectively. To enhance methane yields from lignocellulosic biomass, many pretreatment methods have been studied and summarized [29,32,53]. Cereal rye has a similar composition to those crop residues and energy crops; therefore, in theory, these pretreatment methods can also be applied to cereal rye to increase the methane yield.

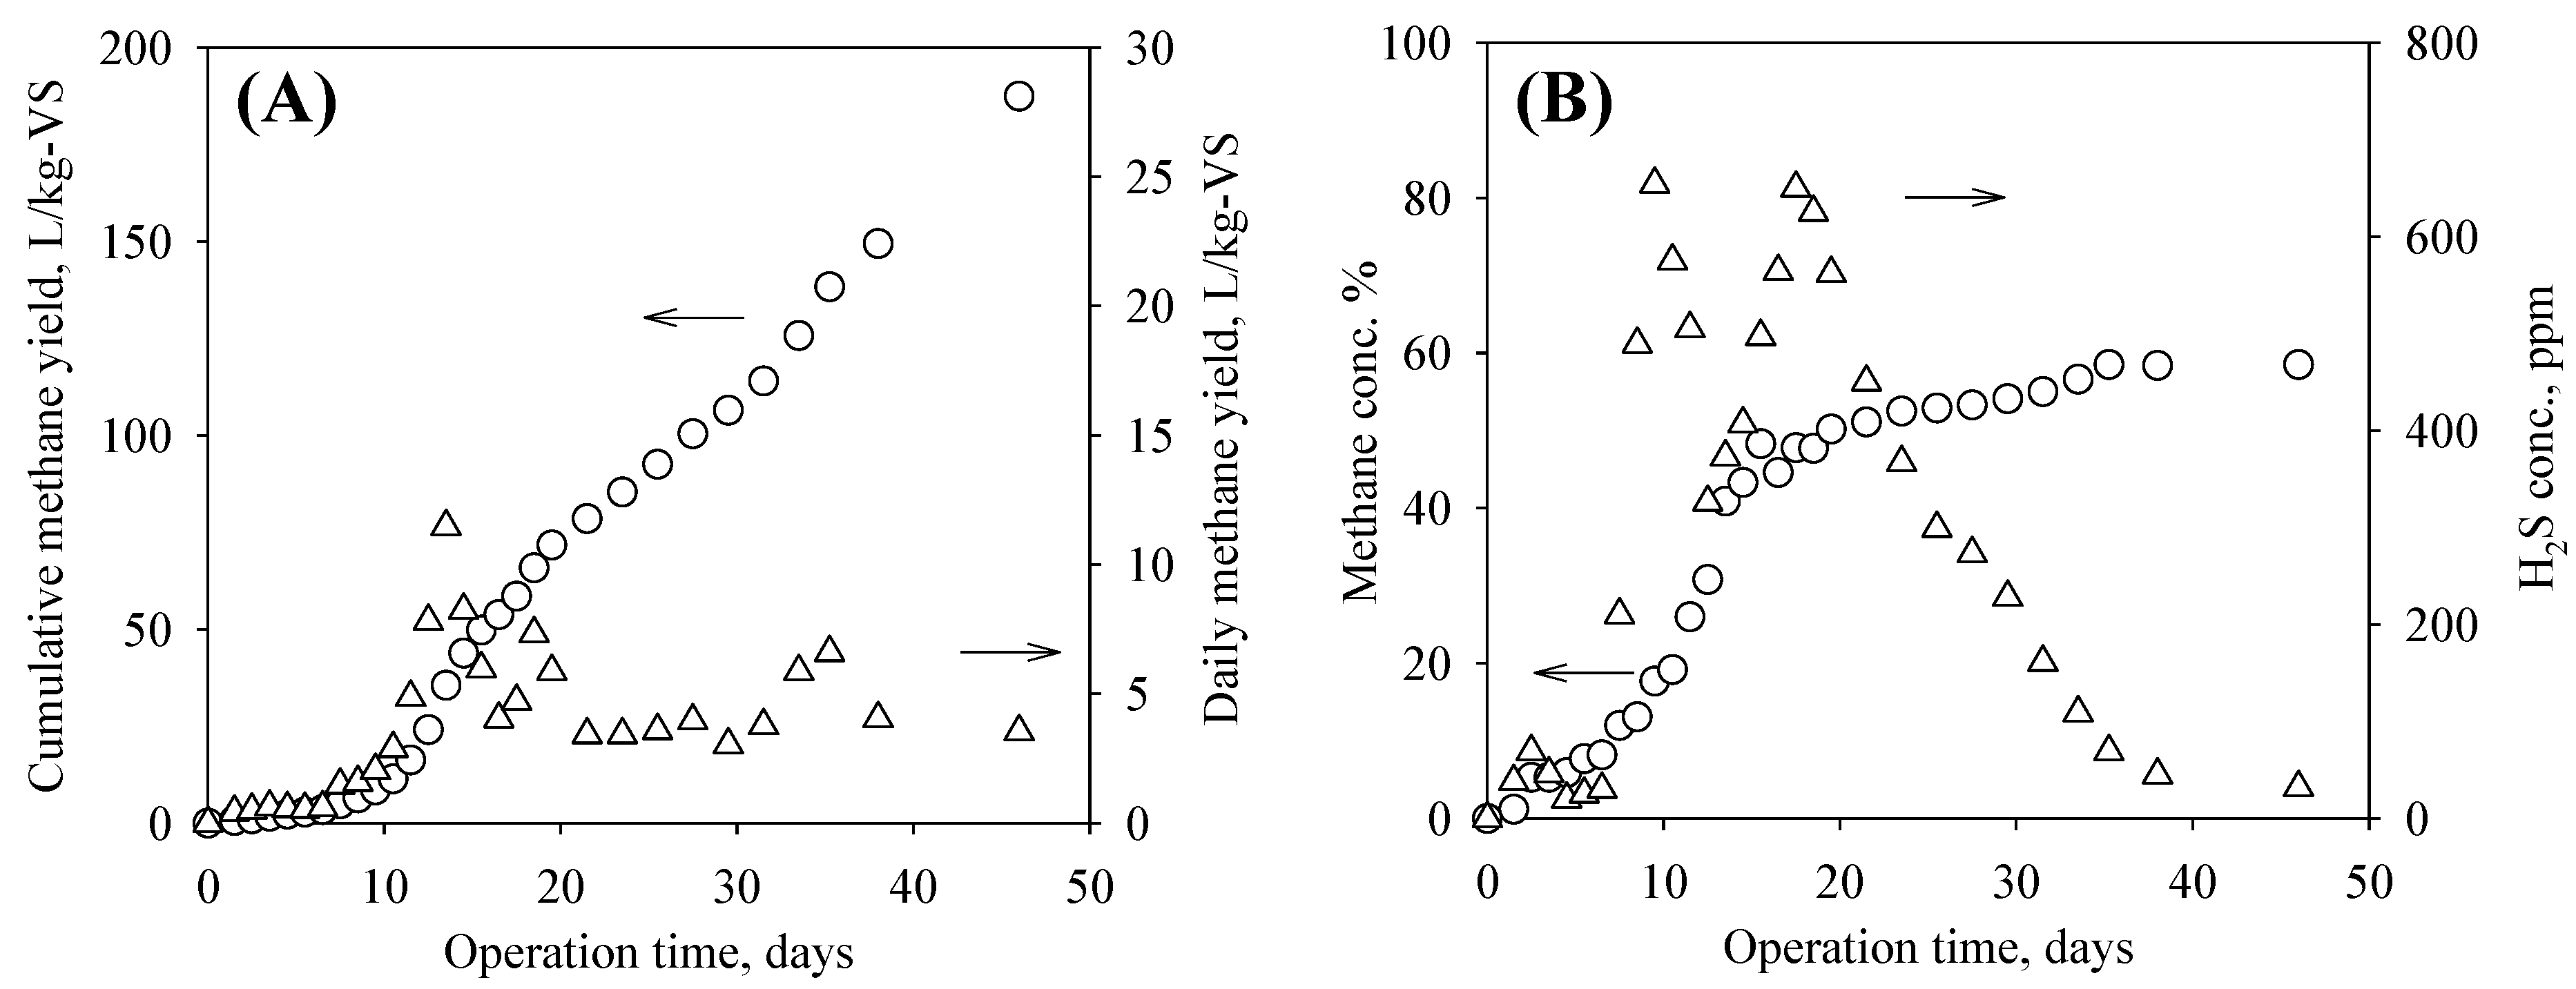
3.3. Pilot-Test Results

Biomass floating at the surface was observed at the beginning of the experiment. After one week, all biomass was submerged in liquid. The pH value (8.05–8.20) and ammonium-N (0.43–0.65 g/L) stayed within healthy ranges [43,44]. The pilot-test of the Elbon cereal rye showed a cumulative methane yield of 187.42 L-CH4/kg-VS in 46 days, which was slightly higher than the bench-scale test result (174.79 L-CH4/kg-VS), likely due to the continuous mixing and a longer retention time. The daily methane yield peaked on day 13.5 at 11.02 L/kg-VS/day. The last sample taken on day 46 included the biogas collected in the bag and the biogas in the digester headspace. Therefore, the day 46 daily methane yield (3.54 L-CH4/kg-VS/day) shown in Figure 2 was higher than the actual yield. Without considering the biogas in the headspace, the daily methane on day 46 was 0.82 L-CH4/kg-VS/day. The methane concentration was low in the beginning 10 days as it was diluted by the nitrogen gas in the headspace but then raised to the 50–60% range. H2S concentration raised to the first peak of 654 ppm on day 9.5, the second peak of 650 ppm on day 17.5, and then gradually decreased. Based on the modified Gompertz model, the cumulative methane yield, maximum daily methane yield, and lag phase were calculated to be 207.43 ± 15.80 L/kg-VS, 5.52 ± 0.24 L/kg-VS/day, and 8.34 ± 0.61 days, respectively. The ADF and NDF decreased from 34.8 ± 1.4% (dry basis) and 54.6 ± 1.1% in the raw biomass to 30.0 ± 0.9% and 42.6% ± 1.8% in the digested biomass, respectively.
Although the biomass floating issue was noticed, the pilot-test results showed that it was feasible to scale up cereal rye AD at the designed operating conditions to produce biogas without adjusting the pH condition. Reducing the biomass size furthermore is one possible solution to the floating issue. For this experiment, dewatering the digested cereal rye biomass was not difficult. The hydrogen sulfide concentration in biogas was lower than that produced from other feedstocks such as manure or municipal solid wastes [27]; therefore, it would be easier to be utilized. Based on the pilot test results and the estimated 20,396 kg/ha of harvested biomass (4893 kg/ha of dry matter), the potential methane energy yield was 3.38 × 10⁵ MJ per hectare. Other studies have reported higher biomass yields. For example, Stute et al. reported 5313 kg/ha of harvested cereal rye dry matter [54]. Penn State Extension reported 8967–11,209 kg/ha of Sudangrass dry matter [55]. The potential energy production from cereal rye biomass via AD could generate a significant revenue for farmers and the biorefining industry. For a full-scale digester that takes cover crops within a radius of 60 km, each year the available energy output is estimated to be 3.83 × 10¹⁰ MJ, which can generate a revenue of 160.70 million U.S. dollars, with the assumptions of six dollars per 1000 MJ natural gas energy and 70% of the produced methane is available for output. Six dollars per 1000 MJ was the average imports price for natural gas from March 2022 to August 2022, based on the EIA reports [56].

3.4. Effects of TS and Ensiling on AD

Solid content played a significant role in determining the methane yield. For the non-ensiled dry cereal rye samples, at 15% TS, biomass was soaked but not fully submerged in the liquid. Therefore, not much methane was produced due to the mass transfer limit (Figure 3A). At 6–10% TS, all reactors were healthy, and no significant difference (p = 0.101) was observed in methane yield. The solids content may have also affected the NH4-N concentration in the digesters, although the levels were within the healthy range [43,44] (Table 2). For ensiled samples, the digesters failed at 15% and 10% TS due to the low pH value and low alkalinity, as shown in Table 2. Ensiling is known for lowering the pH by producing carboxylic acids such as acetic, butyric, propionic, and lactic acids [21,22]. The accumulated acids at high solids contents inhibited methanogenesis. The inhibition was also observed from digesters with 8% TS. Those digesters did not produce much methane during days 3–26 but recovered and eventually produced a fair amount of methane. Additionally, those digesters performed differently during the recovery phase, evidenced by the three large error bars shown in Figure 3B. To some degree, the digesters still underperformed at 8% TS. At 6% TS, the methane yield was 276.13 L/kg-VS, 23.08% higher than that produced from non-ensiled 6% TS digesters.
The effects of ensiling on methane yield seem complicated and need to be combined with the effects of solids content and F/I ratio based on volatile solids. The digesters could tolerate the acids produced during ensiling at 6% TS and increased methane yield, but not at a solids content of 8%, 10%, and 15%. Previous studies have reported synergistic effects in methane yield from ensiled cover crop biomass. Feng et al. reported a 5–15% methane yield increase from co-ensiled cover crop and barley straw [34]. Vlierberghe et al. reported a significant increase in methane yield from two cover crops after long-term alkaline pretreatment and storage, a process that is similar to ensiling [36,37]. The F/I ratio was 1 for those two previous studies. For this study, the F/I ratio was 1.45 for the 8% TS digesters (underperformed) and 0.40 for the 6% TS digester (overperformed), respectively. It seems there was a critical level for TS and F/I ratio, which determined a synergistic or an antagonistic effect of ensiling on AD. The lower solids content and lower F/I ratio dilute the acids and enhance mass transfer, which usually favor methane yield. This observation is in agreement with a previously published review that noted that a higher biogas yield achieved with a lower dry matter content [22].
Ensiling also changed the biogas composition. Figure 4 shows the methane and hydrogen sulfide concentrations in the produced biogas, excluding the failed (ensiled 10% TS and 15% TS, non-ensiled 15% TS) and unstable (ensiled 8% TS) AD conditions. The ensiled cereal rye at 6% TS had a higher CH4 concentration than the non-ensiled cereal rye throughout the entire experiment, supporting its higher accumulative methane yields (Figure 3) and indicating that the ensiling process converted cereal rye biomass into more digestible compounds and therefore has the potential to be used as a pretreatment method. The ensiled cereal rye had a high H2S concentration (660 ppm) on day 3 but quickly decreased. The non-ensiled cereal rye had the first peak of 216–248 ppm on day 5 and a second and smaller peak (62–88 ppm) during days 23–26. This observation suggested that sulfur-containing compounds became more digestible after the ensiling process. Overall, the H2S concentration in the biogas produced in this study is lower than that produced from other feedstocks, such as animal manure [57].
Although the cereal rye digestibility improved and methane yield increased after ensiling at 6% TS, the effects of ensiling on energy preservation need further studies. Several studies have reported energy loss during ensiling, mainly due to organic matter loss [58,59]. The moisture content, chop length, additives, and silo type are key factors to consider during the ensiling storage [22]. A good additive could minimize storage loss [22]. Additionally, using alkaline as the additive could adjust the ensiling pH conditions and potentially improve biogas yield [36,37]. Future work is needed to research the effects of alkaline additives on the cereal rye ensiling and biogas production.

4. Conclusions

Using cereal rye cover crop as the mono feedstock for anaerobic digestion is feasible. Methane yields from six cereal rye populations were comparable to other non-pretreated lignocellulosic biomass and can be further improved. The pilot-scale test verified the methane yield and demonstrated the feasibility of upscaling cereal rye AD to produce bioenergy without adjusting the pH conditions. Critical solids contents were identified for both ensiled and non-ensiled cereal rye. Ensiling improved cereal rye digestibility, but its effects on methane yield can be either positive or negative, determined by the solids contents and feedstock to inoculum ratio.

Supplementary Materials

The following supporting information can be downloaded at: https://www.mdpi.com/article/10.3390/fermentation8110617/s1. Figure S1: The pilot-scale anaerobic digester. Figure S2: Dry matter distribution of the top, middle, and bottom sections of the six cereal rye. Figure S3: Cereal rye methane yields over time.

Author Contributions

Conceptualization, L.Y. and J.C.S.; Methodology, L.Y., L.D.L. and D.E.K.; Software, L.Y.; Validation, L.Y. and D.E.K.; Formal Analysis, L.Y.; Investigation, L.D.L. and L.Y.; Resources, J.C.S. and N.J.H.; Data Curation, L.Y. and D.E.K.; Writing—Original Draft Preparation, L.Y.; Writing—Review and Editing, D.E.K., N.J.H. and J.C.S.; Visualization, L.Y.; Supervision, L.Y.; Project Administration, L.Y. and D.E.K.; Funding Acquisition, L.Y., D.K. and J.C.S. All authors have read and agreed to the published version of the manuscript.

Funding

This study was funded by the USDA-NIFA NLGCA Capacity Building Grants for Non-Land Grant Colleges of Agriculture Program (Award number: 2020-70001-31279). This material is based upon work that is supported by the U.S. Department of Agriculture, Agriculture and Food Research Initiative Competitive Grant No. 2019-69012-29851.

Institutional Review Board Statement

Not applicable.

Informed Consent Statement

Not applicable.

Data Availability Statement

All data are within the manuscript and the supplementary materials.

Acknowledgments

This study was supported by ISU Farm manager Jason Lindbom and his crews.

Conflicts of Interest

The authors declare no conflict of interest.

References

  1. Wallander, S.; Smith, D.; Bowman, M.; Classsen, R. Cover Crop Trends, Programs, and Practices in the United States; U.S. Dept of Agriculture: Washington, DC, USA, 2021. [Google Scholar]
  2. Abdalla, M.; Hastings, A.; Cheng, K.; Yue, Q.; Chadwick, D.; Espenberg, M.; Truu, J.; Rees, R.; Smith, P. A critical review of the impacts of cover crops on nitrogen leaching, net greenhouse gas balance and crop productivity. Glob. Change Biol. 2019, 25, 2530–2543. [Google Scholar] [CrossRef] [PubMed] [Green Version]
  3. Kaye, J.; Quemada, M. Using cover crops to mitigate and adapt to climate change. A review. Agron. Sustain. Dev. 2017, 37, 4. [Google Scholar] [CrossRef] [Green Version]
  4. Hamilton, A.; Mortensen, D.A.; Allen, M.K. The state of the cover crop nation and how to set realistic goals for the popular conservation practice. J. Soil Water Conserv. 2017, 72, 111A–115A. [Google Scholar] [CrossRef]
  5. Sykes, V.R.; Wilson, A.; Bates, G.; McIntosh, D.; McClure, A.T.; Raper, T.; Blair, R.; Walker, F. Cover Crop Variety Tests in Tennessee 2020; University of Tennessee: Knoxville, TN, USA, 2020; Available online: https://search.utcrops.com/ (accessed on 1 May 2022).
  6. Shao, X.; DiMarco, K.; Richard, T.L.; Lynd, L.R. Winter rye as a bioenergy feedstock: Impact of crop maturity on composition, biological solubilization and potential revenue. Biotechnol. Biofuels 2015, 8, 35. [Google Scholar] [CrossRef] [Green Version]
  7. Zanetti, F.; Isbell, T.A.; Gesch, R.W.; Evangelista, R.L.; Alexopoulou, E.; Moser, B.; Monti, A. Turning a burden into an opportunity: Pennycress (Thlaspi arvense L.) a new oilseed crop for biofuel production. Biomass Bioenergy 2019, 130, 105354. [Google Scholar] [CrossRef]
  8. Alam, A.; Dwivedi, P. Modeling site suitability and production potential of carinata-based sustainable jet fuel in the Southeastern United States. J. Clean. Prod. 2019, 239, 117817. [Google Scholar] [CrossRef]
  9. Trejo-Pech, C.O.; Larson, J.A.; English, B.C.; Yu, T.E. Cost and profitability analysis of a prospective pennycress to sustainable aviation fuel supply chain in Southern USA. Energies 2019, 12, 3055. [Google Scholar] [CrossRef] [Green Version]
  10. Robertson, K.A. Biomass Potential in Sustainable Aviation Fuel Development: Switchgrass Production Optimization and Carinata Oilseed Enterprise Viability Analysis. Master’s Thesis, University of Tennessee Knoxville, Knoxville, TN, USA, 2020. [Google Scholar]
  11. Jarvis, B.; Romsdahl, T.B.; McGinn, M.G.; Nazarenus, T.J.; Cahoon, E.B.; Chapman, K.D.; Sedbrook, J.C. CRISPR/Cas9-induced fad2 and rod1 mutations stacked with fae1 confer high oleic acid seed oil in pennycress (Thlaspi arvense L.). Front. Plant Sci. 2021, 12, 652319. [Google Scholar] [CrossRef]
  12. Bhardwaj, H. Utilizing locally-produced canola to manufacture biodiesel. In Issues in New Crops and New Uses; Janick, J., Whipkey, A., Eds.; ASHS Press: Alexandria, VA, USA, 2007. [Google Scholar]
  13. Taheripour, F.; Sajedinia, E.; Karami, O. Oilseed cover crops for sustainable aviation fuels production and reduction in greenhouse gas emissions through land use savings. Front. Energy Res. 2022, 9, 790421. [Google Scholar] [CrossRef]
  14. BP. Nuseed and Bp Enter into Strategic Agreement to Accelerate Market Adoption of Nuseed Carinata As a Sustainable Low-Carbon Biofuel Feedstock; BP: London, UK, 2022. [Google Scholar]
  15. Shahi, N.; Joshi, G.; Min, B. Potential sustainable biomaterials derived from cover crops. BioResources 2020, 15, 5641–5652. [Google Scholar] [CrossRef]
  16. Senthilkumaran, A.; Babaei-Ghazvini, A.; Nicherson, M.T.; Acharya, B. Comparison of protein content, availability, and different properties of plant protein sources with their application in packaging. Polymers 2022, 14, 1065. [Google Scholar] [CrossRef] [PubMed]
  17. Patterson, N.; Tang, J.; Han, J.; Tavva, V.; Hertig, A.; Zhang, Z.; Ramseier, T.M.; Bohmert-Tararev, K.; Peroples, O.P.; Snell, K.D. Generation of High Polyhydroxybutryate Producing Oilseeds. U.S. Patent No 9,181,559, 10 November 2015. [Google Scholar]
  18. Blanco-Canqui, H.; Ruis, S.J.; Proctor, C.A.; Creech, C.F.; Drewnoski, M.E.; Redfearn, D.D. Harvesting cover crops for biofuel and livestock production: Another ecosystem service? Agron. J. 2020, 112, 2373–2400. [Google Scholar] [CrossRef]
  19. Miller, J. Cover Crop Biomass and Termination Considerations. Delaware Agrononmy Blog. 25 March 2022. Available online: https://sites.udel.edu/agronomy/2022/03/25/cover-crop-biomass-and-termination-considerations/ (accessed on 1 September 2022).
  20. Karsten, H.; Milliron, R. Double-Cropping Winter Annuals and Corn Silage. Available online: https://www.agproud.com/articles/31868-double-cropping-winter-annuals-and-corn-silage (accessed on 1 September 2022).
  21. Sun, H.; Cui, X.; Li, R.; Guo, J.; Dong, R. Ensiling process for efficient biogas production from lignocellulosic substrates: Methods, mechanisms, and measures. Bioresour. Technol. 2021, 342, 125928. [Google Scholar] [CrossRef] [PubMed]
  22. Villa, R.; Rodriguez, L.O.; Fenech, C.; Anika, O.C. Ensiling for anaerobic digestion: A review of key considerations to maximise methane yields. Renew. Sustain. Energy Rev. 2020, 134, 110401. [Google Scholar] [CrossRef]
  23. Xu, F.; Li, Y.; Ge, X.; Yang, L.; Li, Y. Anaerobic digestion of food waste—Challenges and opportunities. Bioresour. Technol. 2018, 247, 1047–1058. [Google Scholar] [CrossRef]
  24. Ampese, L.; Sganzerla, W.G.; Ziero, H.D. Research progress, trends, and updates on anaerobic digestion technology: A bibliometric analysis. J. Clean. Prod. 2022, 331, 130004. [Google Scholar] [CrossRef]
  25. Bhatnagar, N.; Ryan, D.; Murphy, R.; Enright, A.M. A comprehensive review of green policy, anaerobic digestion of animal manure and chicken litter feedstock potential—Global and Irish perspective. Renew. Sustain. Energy Rev. 2022, 154, 111884. [Google Scholar] [CrossRef]
  26. Ervasti, S.; Kostensalo, J.; Tampio, E. Effects of seasonal and local co-feedstocks on the performance of continuous anaerobic digestion of cattle slurry. Bioresour. Technol. Rep. 2022, 19, 101207. [Google Scholar] [CrossRef]
  27. Yang, L.; Ge, X.; Wan, C.; Yu, F.; Li, Y. Progress and perspectives in converting biogas to transportation fuels. Renew. Sustain. Energy Rev. 2014, 40, 1133–1152. [Google Scholar] [CrossRef]
  28. Ge, X.; Yang, L.; Sheet, J.P.; Yu, Z.; Li, Y. Biological conversion of methane to liquid fuels: Status and opportunities. Biotechnol. Adv. 2014, 32, 1460–1475. [Google Scholar] [CrossRef]
  29. Yang, L.; Xu, F.; Ge, X.; Li, Y. Challenges and strategies for solid-state anaerobic digestion of lignocellulosic biomass. Renew. Sustain. Energy Rev. 2014, 44, 824–834. [Google Scholar] [CrossRef]
  30. Yang, L.; Kopsell, D.E.; Kottke, A.M.; Johnson, M.Q. Development of a cartridge design anaerobic digestion system for lignocellulosic biomass. Biosyst. Eng. 2017, 160, 134–139. [Google Scholar] [CrossRef]
  31. Yang, L.; Li, Y. Anaerobic digestion of giant reed for methane production. Bioresour. Technol. 2014, 171, 233–239. [Google Scholar] [CrossRef] [PubMed]
  32. Sawatdeenarunat, C.; Surendra, K.C.; Takara, D.; Oechsner, H.; Khanal, S.K. Anaerobic digestion of lignocellulosic biomass: Challenges and opportunities. Bioresour. Technol. 2014, 178, 178–186. [Google Scholar] [CrossRef]
  33. Belle, A.; Lansing, S.; Mulbry, W.; Weil, R.R. Anaerobic co-digestion of forage radish and dairy manure in complete mix digesters. Bioresour. Technol. 2015, 178, 230–237. [Google Scholar] [CrossRef]
  34. Feng, L.; Perschke, Y.; Fontaine, D.; Ward, A.J.; Eriksen, J.; Sorensen, P.; Moller, H.B. Co-ensiling of cover crops and barley straw for biogas production. Renew. Energy 2019, 142, 677–683. [Google Scholar] [CrossRef]
  35. Feng, L.; Perschke, Y.M.; Fontaine, D.; Nikolausz, M.; Ward, A.J.; Rocha, U.N.; Correa, F.B.; Eriksen, J.; Sorensen, P.; Moller, H.B. Anaerobic digestion of co-ensiled cover crop and barley straw: Effect of co-ensiling ratios, manure addition and impact on microbial community structure. Ind. Crops Prod. 2020, 144, 112025. [Google Scholar] [CrossRef]
  36. Vlierberghe, C.V.; Escudie, R.; Bernet, N.; Santa-Catalina, G.; Frederic, S.; Carrere, H. Conditions for efficient alkaline storage of cover crops for biomethane production. Bioresour. Technol. 2022, 348, 126722. [Google Scholar] [CrossRef]
  37. Vlierberghe, C.V.; Escudie, R.; Bernet, N.; Frederic, S.; Carrere, H. Long term alkaline storage and pretreatment process of cover crops for anaerobic digestion. Bioresour. Technol. 2021, 330, 124986. [Google Scholar] [CrossRef]
  38. Igos, E.; Golkowska, K.; Koster, D.; Vervisch, B.; Benetto, E. Using rye as cover crop for bioenergy production: An environmental and economic assessment. Biomass Bioenergy 2016, 95, 116–123. [Google Scholar] [CrossRef]
  39. AgMRC. Rye Profile. Available online: https://www.agmrc.org/commodities-products/grains-oilseeds/rye-profile (accessed on 15 October 2022).
  40. MCCC. Selector Tools. Available online: https://www.midwestcovercrops.org/selector-tool/ (accessed on 1 September 2022).
  41. Rice, E.W.; Baird, R.B.; Eaton, A.D. Standard Methods for the Examination of Water and Wastewater, 23rd ed.; American Public Health Association, American Water Works Association, Water Environment Federation: Washington, DC, USA, 2017. [Google Scholar]
  42. Dechrugsa, S.; Kantachote, D.; Chaiprapat, S. Effects of inoculum to substrate ratio, substrate mix ratio and inoculum source on batch co-digestion of grass and pig manure. Bioresour. Technol. 2013, 146, 101–108. [Google Scholar] [CrossRef]
  43. Wang, Z.; Xu, F.; Li, Y. Effects of total ammonia nitrogen concentration on solid-state anaerobic digestion of corn stover. Bioresour. Technol. 2013, 144, 281–287. [Google Scholar] [CrossRef] [PubMed]
  44. Karthikeyan, O.P.; Visvanathan, C. Effect of C/N ratio and ammonia-N accumulation in a pilot-scale thermophilic dry anaerobic digester. Bioresour. Technol. 2012, 113, 294–302. [Google Scholar]
  45. Wang, S.; Li, F.; Wu, D.; Zhang, P.; Wang, H.; Tao, X.; Ye, J.; Nabi, M. Enzyme pretreatment enhancing biogas yield from corn stover: Feasibility, optimization, and mechanism analysis. J. Agric. Food Chem. 2018, 66, 10026–10032. [Google Scholar] [CrossRef] [PubMed]
  46. Lizasoain, J.; Trulea, A.; Gittinger, J.; Kral, I. Corn stover for biogas production: Effect of steam explosion pretreatment on the gas yields and on the biodegradation kinetics of the primary structural compounds. Bioresour. Technol. 2017, 244, 949–956. [Google Scholar] [CrossRef] [PubMed]
  47. Singh, R.; Behera, S.; Yadav, Y.K.; Kumar, S. Potential of wheat straw for biogas production using thermophiles. In Recent Advances in Bioenergy Research; Kumar, S., Ed.; Sardar Swaran Singh National Institute of Renewable Energy: Punjab, India, 2014; Volume 3. [Google Scholar]
  48. Mancini, G.; Papirio, S.; Lens, P.N.; Esposito, G. Increased biogas production from wheat straw by chemical pretreatments. Renew. Energy 2018, 119, 608–614. [Google Scholar] [CrossRef]
  49. Niu, H.; Kong, X.; Li, L.; Sun, Y.; Yuan, Z.; Zhou, X. Analysis of biogas produced from switchgrass by anaerobic digestion. Bioresoure 2015, 10, 7178–7187. [Google Scholar] [CrossRef] [Green Version]
  50. Masse, D.; Gilbert, Y.; Savoie, P.; Belanger, G. Methane yield from switchgrass harvested at different stages of development in Eastern Canada. Bioresour. Technol. 2010, 101, 9536–9541. [Google Scholar] [CrossRef]
  51. Menardo, S.; Bauer, A.; Theuretzbacher, F.; Piringer, G.; Nilsen, P.; Balsari, P.; Pavliska, O.; Amon, T. Biogas production from steam-exploded miscanthus and utilization of biogas energy and CO2 in greenhouses. Bioenergy Res. 2013, 6, 620–630. [Google Scholar] [CrossRef]
  52. Uellendahl, H.; Wang, G.; Moller, H.B.; Jorgensen, U.; Skiadas, I.; Gavala, H.; Ahring, B. Energy balance and cost-benefit analysis of biogas production from perennial energy crops pretreated by wet oxidation. Water Sci. Technol. 2008, 58, 1841–1847. [Google Scholar] [CrossRef] [Green Version]
  53. Zheng, Y.; Zhao, J.; Xu, F.; Li, Y. Pretreatment of lignocellulosic biomass for enhanced biogas production. Prog. Energy Combust. Sci. 2014, 42, 35–53. [Google Scholar] [CrossRef]
  54. Stute, J.; Shelley, K.; Mueller, D.; Wood, T. Planting Winter Rye after Corn Silage: Managing for Forage; University of Wisconsin (UW) Extension: Madison, WI, USA, 2017; Available online: https://fyi.extension.wisc.edu/forage/files/2017/06/Rye_090507_final-1.pdf (accessed on 1 September 2022).
  55. Reed, H.; Duiker, S.W. Exploring Summer Cover Crop Options; Penn State Extension: State College, PA, USA, 2021; Available online: https://extension.psu.edu/summer-cover-crop-options (accessed on 1 September 2022).
  56. EIA. Natural Gas Prices. 2022. Available online: https://www.eia.gov/dnav/ng/ng_pri_sum_dcu_nus_m.htm (accessed on 6 November 2022).
  57. Vu, H.; Nyuyen, L.; Wang, Q.; Ngo, H.; Liu, Q.; Zhang, X.; Nghiem, L. Hydrogen sulphide management in anaerobic digestion: A critical review on input control, process regulation, and post-treatment. Bioresour. Technol. 2021, 346, 126634. [Google Scholar] [CrossRef] [PubMed]
  58. Calabro, P.S.; Fazzino, F.; Sidari, R.; Zema, D.A. Optimization of orange peel waste ensiling for sustainable anaerobic digestion. Renew. Energy 2020, 154, 849–862. [Google Scholar] [CrossRef]
  59. Kreuger, E.; Nges, I.A.; Bjornsson, L. Ensiling of crops for biogas production: Effects on methane yield and total solids determination. Biotechnol. Biofuels 2011, 4, 44. [Google Scholar] [CrossRef] [PubMed]
Figure 1. Cumulative methane yields from cereal rye. The asterisk indicates significant differences between the three plant sections.
Fermentation 08 00617 g001
Figure 2. Daily and cumulative methane yields (A) and methane and hydrogen sulfide concentrations in biogas (B). Note: arrows point to the corresponding y axis for circles and triangles.
Fermentation 08 00617 g002
Figure 3. Methane yields of non-ensiled (A) and ensiled (B) cereal rye biomass.
Fermentation 08 00617 g003
Figure 4. Methane (A) and hydrogen sulfide (B) concentrations in produced biogas.
Fermentation 08 00617 g004
Table 1. Total Solids (TS) and Volatile Solids (VS) of cereal rye biomass (Average ± SE).
Cereal RyeBottomMiddleTop
TS, %VS, %TS, %VS, %TS, %VS, %
Elbon93.02 ± 0.1786.21 ± 0.2494.21 ± 0.6187.60 ± 0.0494.25 ± 0.6187.08 ± 0.02
Wheeler94.20 ± 0.0384.49 ± 0.0395.10 ± 0.0086.18 ± 0.3395.58 ± 0.3688.69 ± 0.05
PH201997.12 ± 0.2489.01 ± 0.6995.79 ± 0.5788.21 ± 0.2996.83 ± 0.5090.66 ± 0.78
Wrens Abruzzi96.27 ± 0.4389.54 ± 0.6396.09 ± 0.2589.73 ± 0.3896.29 ± 0.1389.12 ± 0.21
Winter Grazer96.74 ± 0.4387.29 ± 0.2297.49 ± 0.3190.78 ± 0.1598.03 ± 0.4691.58 ± 0.21
ISURF Mix96.20 ± 0.1188.77 ± 0.3796.43 ± 0.0187.48 ± 0.1596.77 ± 0.2289.93 ± 0.04
Table 2. Final characteristics of the digesters. (Average ± SE).
ConditionsNH4-N
mg/L
pHAlkalinity
mg/L CaCO3
Non-ensiled15% TS260.83 ± 42.298.38 ± 0.05430.92 ± 30.84
10%TS641.67 ± 29.178.56 ± 0.04501.60 ± 16.46
8% TS865.00 ± 70.897.79 ± 0.02507.53 ± 13.31
6% TS142.50 ± 6.297.64 ± 0.08489.67 ± 22.62
Ensiled15% TS5.00 ± 5.005.20 ± 0.05302.15 ± 8.37
10%TS20.00 ± 7.645.03 ± 0.01328.47 ± 18.29
8% TS40.00 ± 7.657.73 ± 0.11667.20 ± 24.86
6% TS36.67 ± 6.017.75 ± 0.05569.10 ± 7.10
Publisher’s Note: MDPI stays neutral with regard to jurisdictional claims in published maps and institutional affiliations.

