Article

Efficient Heating of Activated Carbon in Microwave Field

1
School of Energy Science and Engineering, Harbin Institute of Technology, Harbin 150001, China
2
School of Thermal Engineering, Shandong Jianzhu University, Jinan 250101, China
3
Faculty of Agriculture, Cairo University, Giza 12613, Egypt
*
Authors to whom correspondence should be addressed.
These authors contributed equally to this work.
Submission received: 26 February 2023 / Revised: 28 April 2023 / Accepted: 4 May 2023 / Published: 8 May 2023
(This article belongs to the Special Issue Adsorption on Carbon-Based Materials)

Abstract

:
Activated carbon (AC) is widely utilized in water treatment, gas adsorption, and purification as well as the protection of environment due to the characteristics of prominent catalytic and adsorbent effect. The heating performances are therefore of significant importance for the further applications. The main objective of this study was therefore to detail the heating performance of activated carbon in microwave field, and the factors affecting the heating performance were also explored. In this study, the heating performance of AC as affected by microwave power (400, 450, 500, 550, and 600 W), feeding load (5, 10, 15, 20, and 25 g), and reactor volume (50, 100, 150, 200, and 250 mL) were detailed and reported. The results showed that when the microwave powers were 400, 450, 500, 550, and 600 W, the temperatures of AC increased to the desired value (about 200 °C) within 90, 85, 70, 60, and 35 s with average heating rates of 2.0, 2.2, 2.8, 3.0, and 5.9 °C/s, respectively. When the feeding loads were 5, 10, 15, 20, and 25 g, the temperatures of AC increased to desired temperature within 40, 70, 60, 50, and 50 s with average heating rates of 4.2, 2.8, 3.1, 3.50, and 3.55 °C/s, respectively. When the reactor volumes were 50, 100, 150, 200, and 250 mL, the temperatures of AC increased to the desired temperature within 25, 60, 70, 70, and 160 s with average heating rates of 7.6, 3.3, 2.8, 2.6, and 1.2 °C/s, respectively. In general, the faster heating rate of activated carbon was achieved at higher microwave power, more feeding load, and smaller reactor volume. Fitting formulae were given to predict the transient temperatures of AC in the microwave field, and the relative errors were in the ranges of −15.4~12.4%, −15.4~13.5% and −18.7~12.4% at different microwave powers, feeding loads, and reactor volumes, respectively.

1. Introduction

Activated carbon (AC) is a porous material, which can be produced from coal [1], biomass [2], and synthetic organics [3,4]. The preparation technology is critically necessary for the properties of AC, and can be divided into physical and chemical activation methods [5]. Physical activation is widely used in commerce, and it experiences carbonisation in neutral environments and activation in an oxidizing atmosphere [6,7]. Chemical activation is usually utilized for raw materials containing cellulose, with the participation of activating agent, such as alkali hydroxides (NaOH and KOH) and metal salts (ZnCl2) [8,9,10]. Physical activated AC needs a long activation time and has a low adsorption capacity [11,12]. In contrast, the chemical activated AC consumes less processing time and obtains more porous structure [13,14,15]. No matter which technique is used, prepared AC has unique physical and chemical characteristics, and it is widely used in people’s life and industry [16,17,18,19,20,21], e.g., water treatment [22,23,24], gas adsorption and purification [25,26,27], electrical appliances [28], and the protection of the environment [29,30].
Microwave treatment is an attractive and promising heating technique, and it is widely utilized in the manufacturing technology [31], food processing industry [32], and gasification and pyrolysis fields [33,34,35,36]. As compared with the conventional electric heating method, the microwave one has the ability to penetrate into the materials, produce heat, and form high temperatures inside the object [37,38], showing prominent advantages, such as rapid heating rate [39,40], more value-add production [41], and easy control [42]. Because of the prominent advantages of microwave heating, it is broadly applied in pyrolysis technique. Microwave-assisted pyrolysis (MAP) is one of the most attractive thermochemical processing methods [43,44] where high conversion efficiency [45,46] and low energy consumption [47] can be achieved.
Due to the desired catalytic capacity and prominent dielectric properties [48], AC presents promising potential acting as the catalyst and microwave absorber in the process of MAP [49,50]. Plentiful work had been undertaken to investigate the effect of AC on the pyrolysis performance. It was reported that the addition of AC in MAP increased the bio-gas yield and enhanced H2 selectivity (55.7 vol.%) whilst it decreased the bio-oil yield as compared with traditional pyrolysis [51]. MAP of high density polyethylene (HDPE) with AC as a catalyst was investigated [52], and higher hydrocarbon production yield was obtained as compared with a conventional technique with coke as the catalyst. The absorbent effect of AC was examined by co-pyrolysis of Chlorella vulgaris and HDPE heated by a microwave [53]. With the addition of AC, the compounds containing nitrogen and oxygen decreased by 75.75% and 45.62% respectively, showing excellent denitrification and deoxygenation effects on the bio-oil produced by pyrolyzing Chlorella vulgaris only.
Previous work mainly focused on the catalytic and absorbent effects of AC and ignored the heating performance of AC, especially in the microwave field. Thus, it is necessary to study the heating performance of AC in the process of microwave-assisted heating. Fu et al. [54] explored the heating performance of HDPE in the microwave heating process. It was observed that larger chamber volume, more feeding load, and higher microwave power may result in a faster heating rate of HDPE. Similar results were observed by Hong et al. [55], which explored the heating performance of low density polyethylene (LDPE). They found that more feeding load and higher microwave power may improve the heating rate of LDPE, while larger chamber volume resulted in a lower heating rate of LDPE. In this article, the heating performance of AC was investigated, aiming to provide a better understanding of microwave heating of AC in a microwave field.
Although the heating performances of AC are significant in many practical situations, the relevant research was not reported, according to our knowledge. The main objective of this study was to explore and present the heating performance of AC in a microwave field. The specific objectives were: (a) to present the microwave heating performance of AC, and (b) to investigate the influences of microwave power, feeding load and reactor volume on the heating performance. The results obtained from this study can not only provide a fundamental understanding of microwave heating of AC but can also propose relationships for estimating the transient temperatures of AC in the microwave field.

2. Materials and Methods
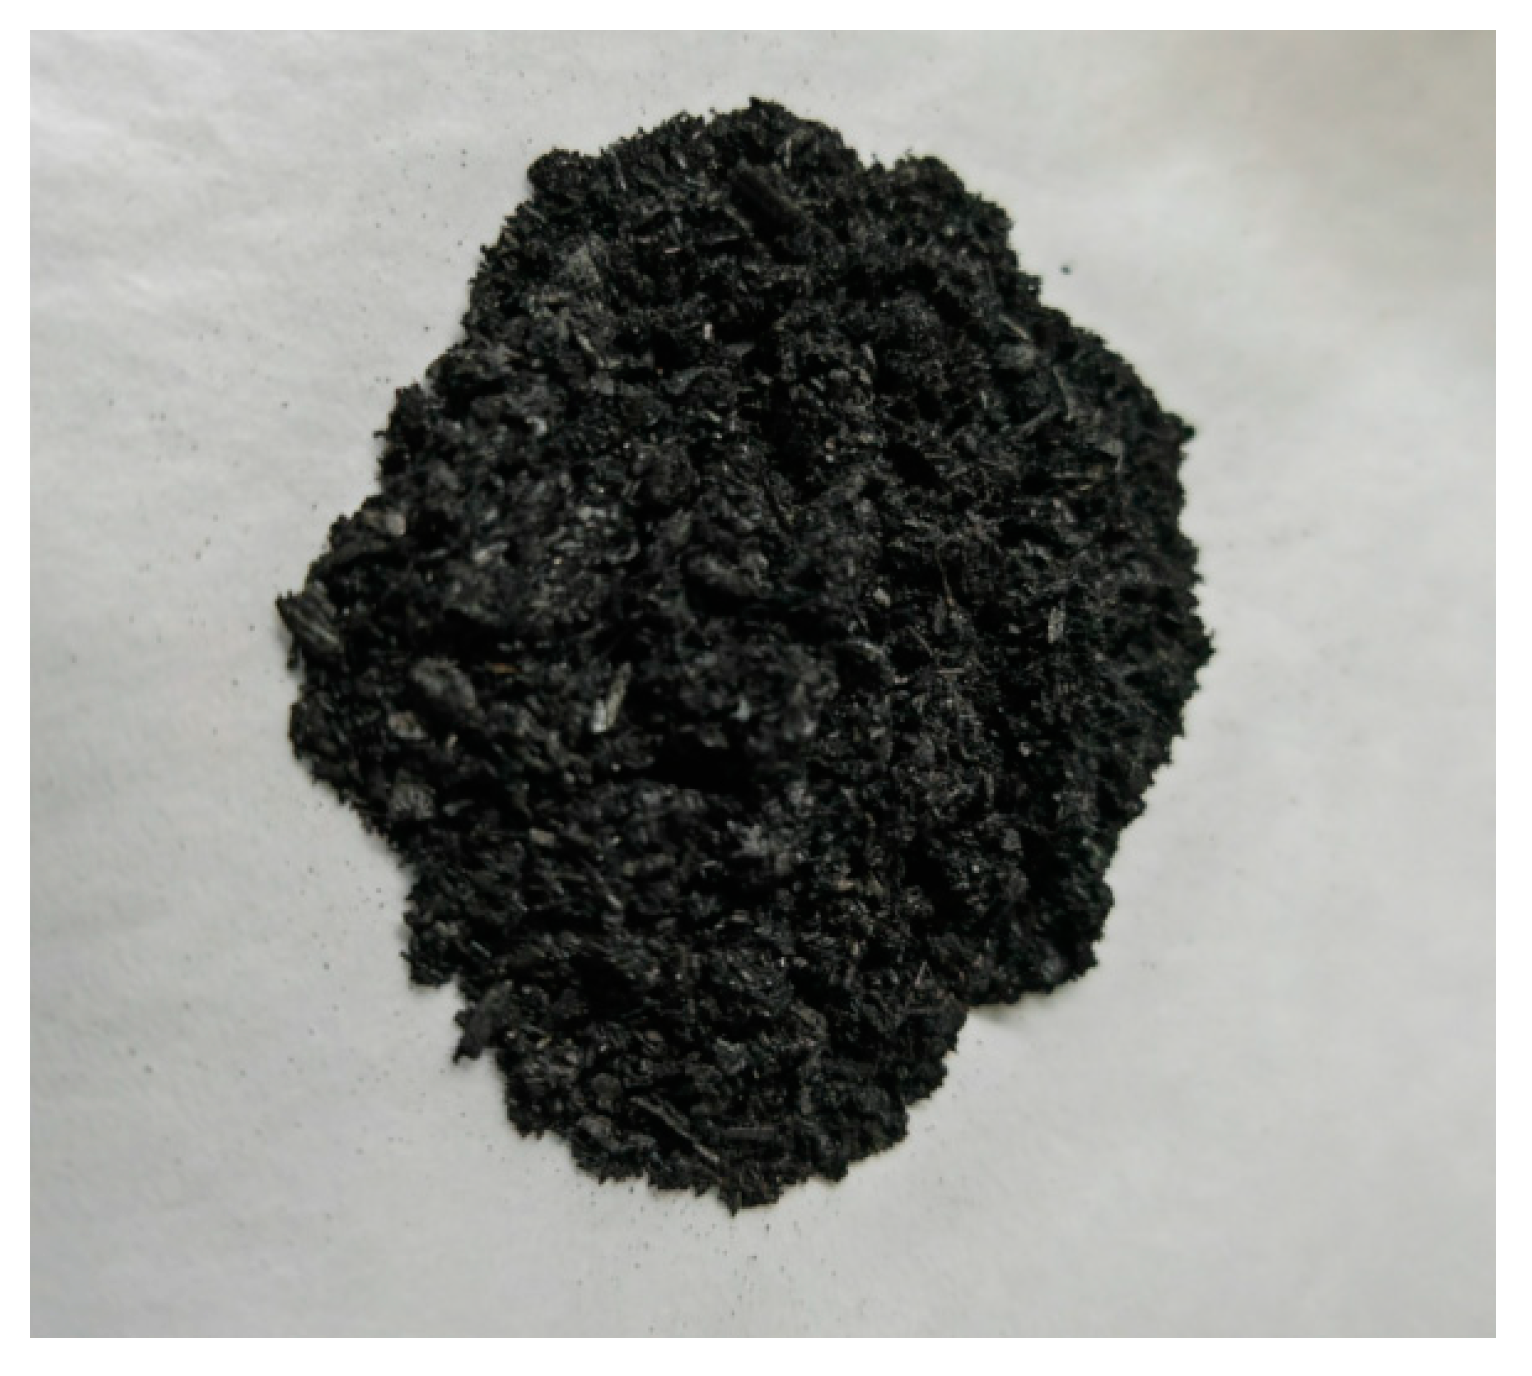
2.1. Materials

In this study, activated carbon (AC) was selected as the feedstock in the microwave chamber. The AC was bought from Henan Lize Environmental Protection Technology Co., Ltd. (Zhengzhou, China), which was derived from the corn stalk, pyrolyzed in the absence of oxygen, with the temperature ranging from 500 °C to 600 °C. The AC sample is shown in Figure 1.

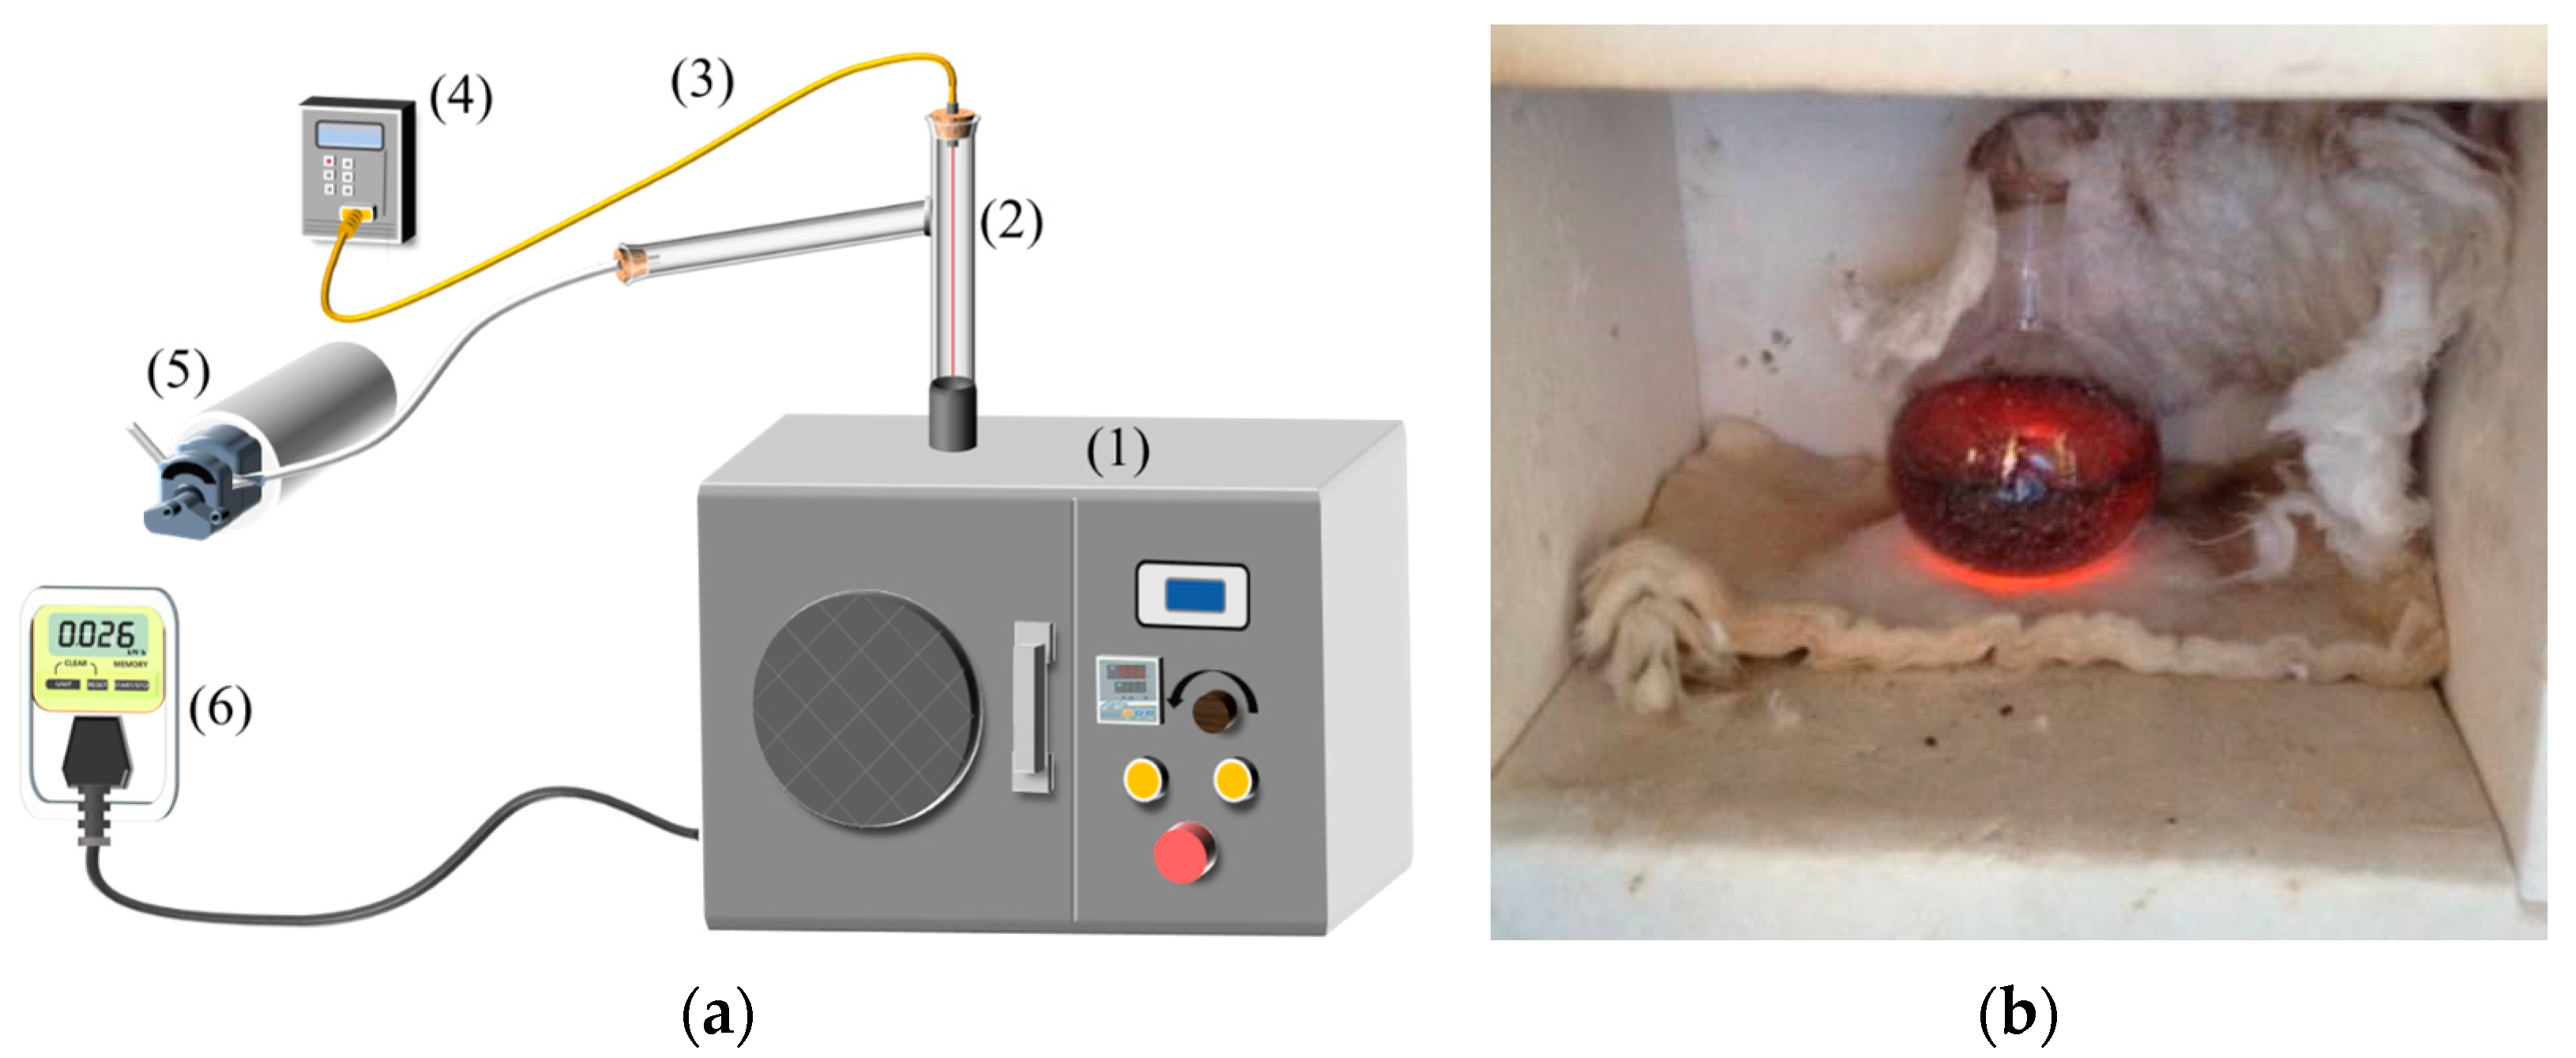
2.2. Experimental System

Figure 2 depicts the systematic diagram of the experiment utilized in this study. The experimental system is primarily composed of three subsystems: the microwave assisted heating system, the temperature measurement system, and the ancillary system. The microwave assisted heating system mainly consists of two parts: a microwave oven and a quartz reactor (as shown in Figure 2b). The oven provides the microwave with powers from 300–700 W and frequency of 2450 MHz and it is manufactured by Beijing Yihuida Microwave Equipment Company (Beijing, China). The physical dimensions of this oven are 300, 300, and 350 mm in length, width, and height, respectively.
The quartz reactors were customized by Donghua Quartz Products Company (Lianyungang, China), and five sizes (50, 100, 150, 200 and 250 mL) were selected in the research. The quartz reactors can resist high temperatures, and the round ones are good for investigating the heating performance of particles, and are therefore widely used [54,55]. The temperature measurement system primarily consists of two parts: a K-type thermocouple measuring the temperature of AC and a digital thermometer displaying the experimental temperature. The ancillary system primarily consists of a vacuum pump to remove gas, protecting from the oxidation of AC. The oven is padded with insulated cotton, which wraps the reactor and reduces heat loss. Due to the weak microwave absorbability, the temperature of the insulating cotton has nearly no change, without obvious influence on the experimental results.

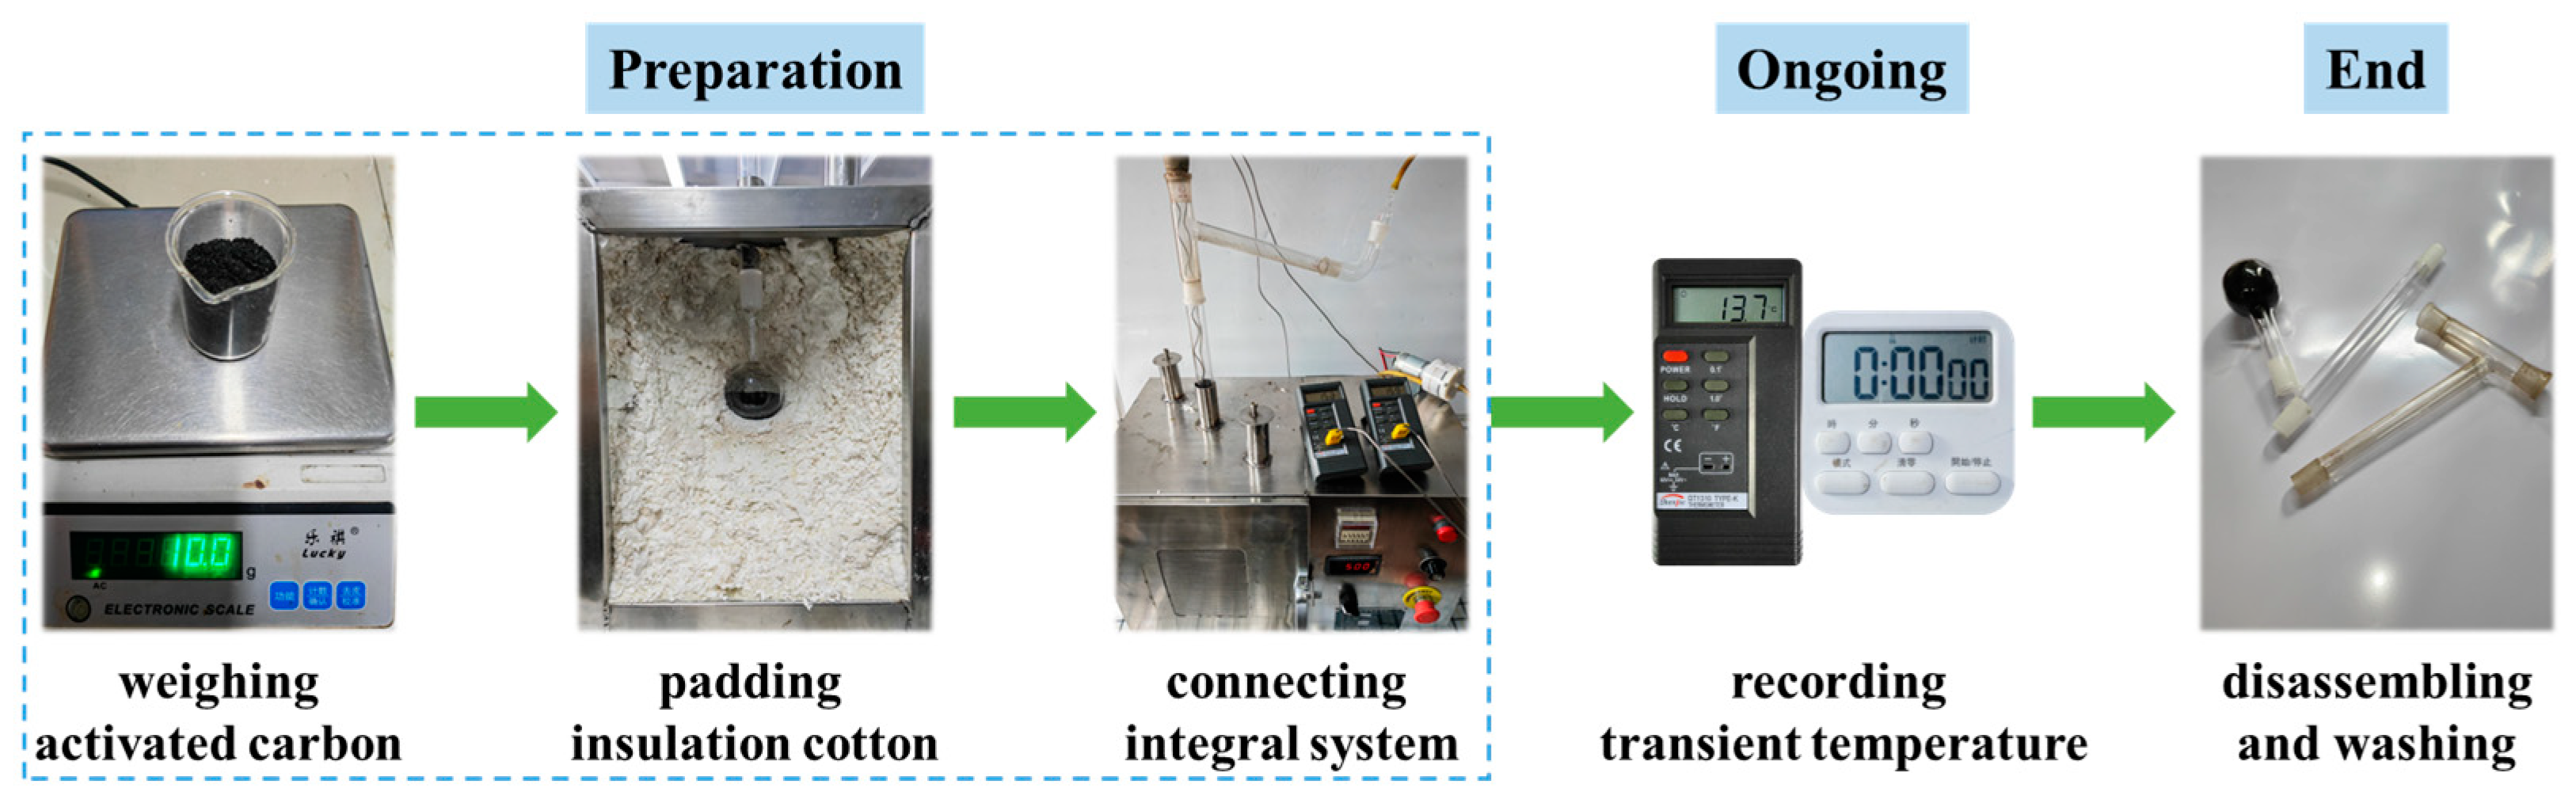
2.3. Experimental Procedures

To explore the heating performance of AC in the microwave chamber, the experiment was organized as shown in Figure 3: (1) weigh the feedstock for 10 g precisely and then put it into the reactor whose volume was 150 mL; (2) place the reactor in the microwave oven, pad the insulated cotton inside the microwave oven, and measure the displayed temperature; (3) connect the integral experimental system as depicted in Figure 2, and then switch the vacuum pump to remove the remained gas; (4) switch the microwave oven at the power of 500 W, and record the temperature per five seconds until around 200 °C was reached; (5) experiment was completed and all connection pipes were washed for the subsequent experiment. Each experiment was repeated three times.
Subsequently, follow the above operations, and repeat the experiments by modifying the microwave powers as 400, 450, 550, and 600 W, respectively, with the feeding load and reactor volume fixed at 10 g and 150 mL. Next, repeat the experiments by modifying the feeding loads as 5, 15, 20, and 25 g, respectively, with the microwave power and reactor volume fixed at 500 W and 150 mL. Last, repeat the experiments by modifying the reactor volumes as 50, 100, 200, and 250 mL, respectively, with the microwave power and feeding load fixed at 500 W and 10 g. The detail factors in the heating experiments are listed in Table 1.

2.4. Experimental Conditions and Data Processing

The heating performances of AC obtained from the microwave assisted heating chamber were investigated in detail and the influences of microwave power, feeding load, and reactor volume were explored. The microwave powers were 400, 450, 500, 550, and 600 W; the feeding loads were 5, 10, 15, 20, and 25 g; and the reactor volumes were 50, 100, 150, 200, and 250 mL.
The experimental data were fitted by third-degree polynomial, and the effect of fitting was evaluated by the relative error, which can be calculated as follows:
e = x 0 x x × 100 %
where e is the relative error, and x0 and x are predicted and experimental values, respectively.

3. Results

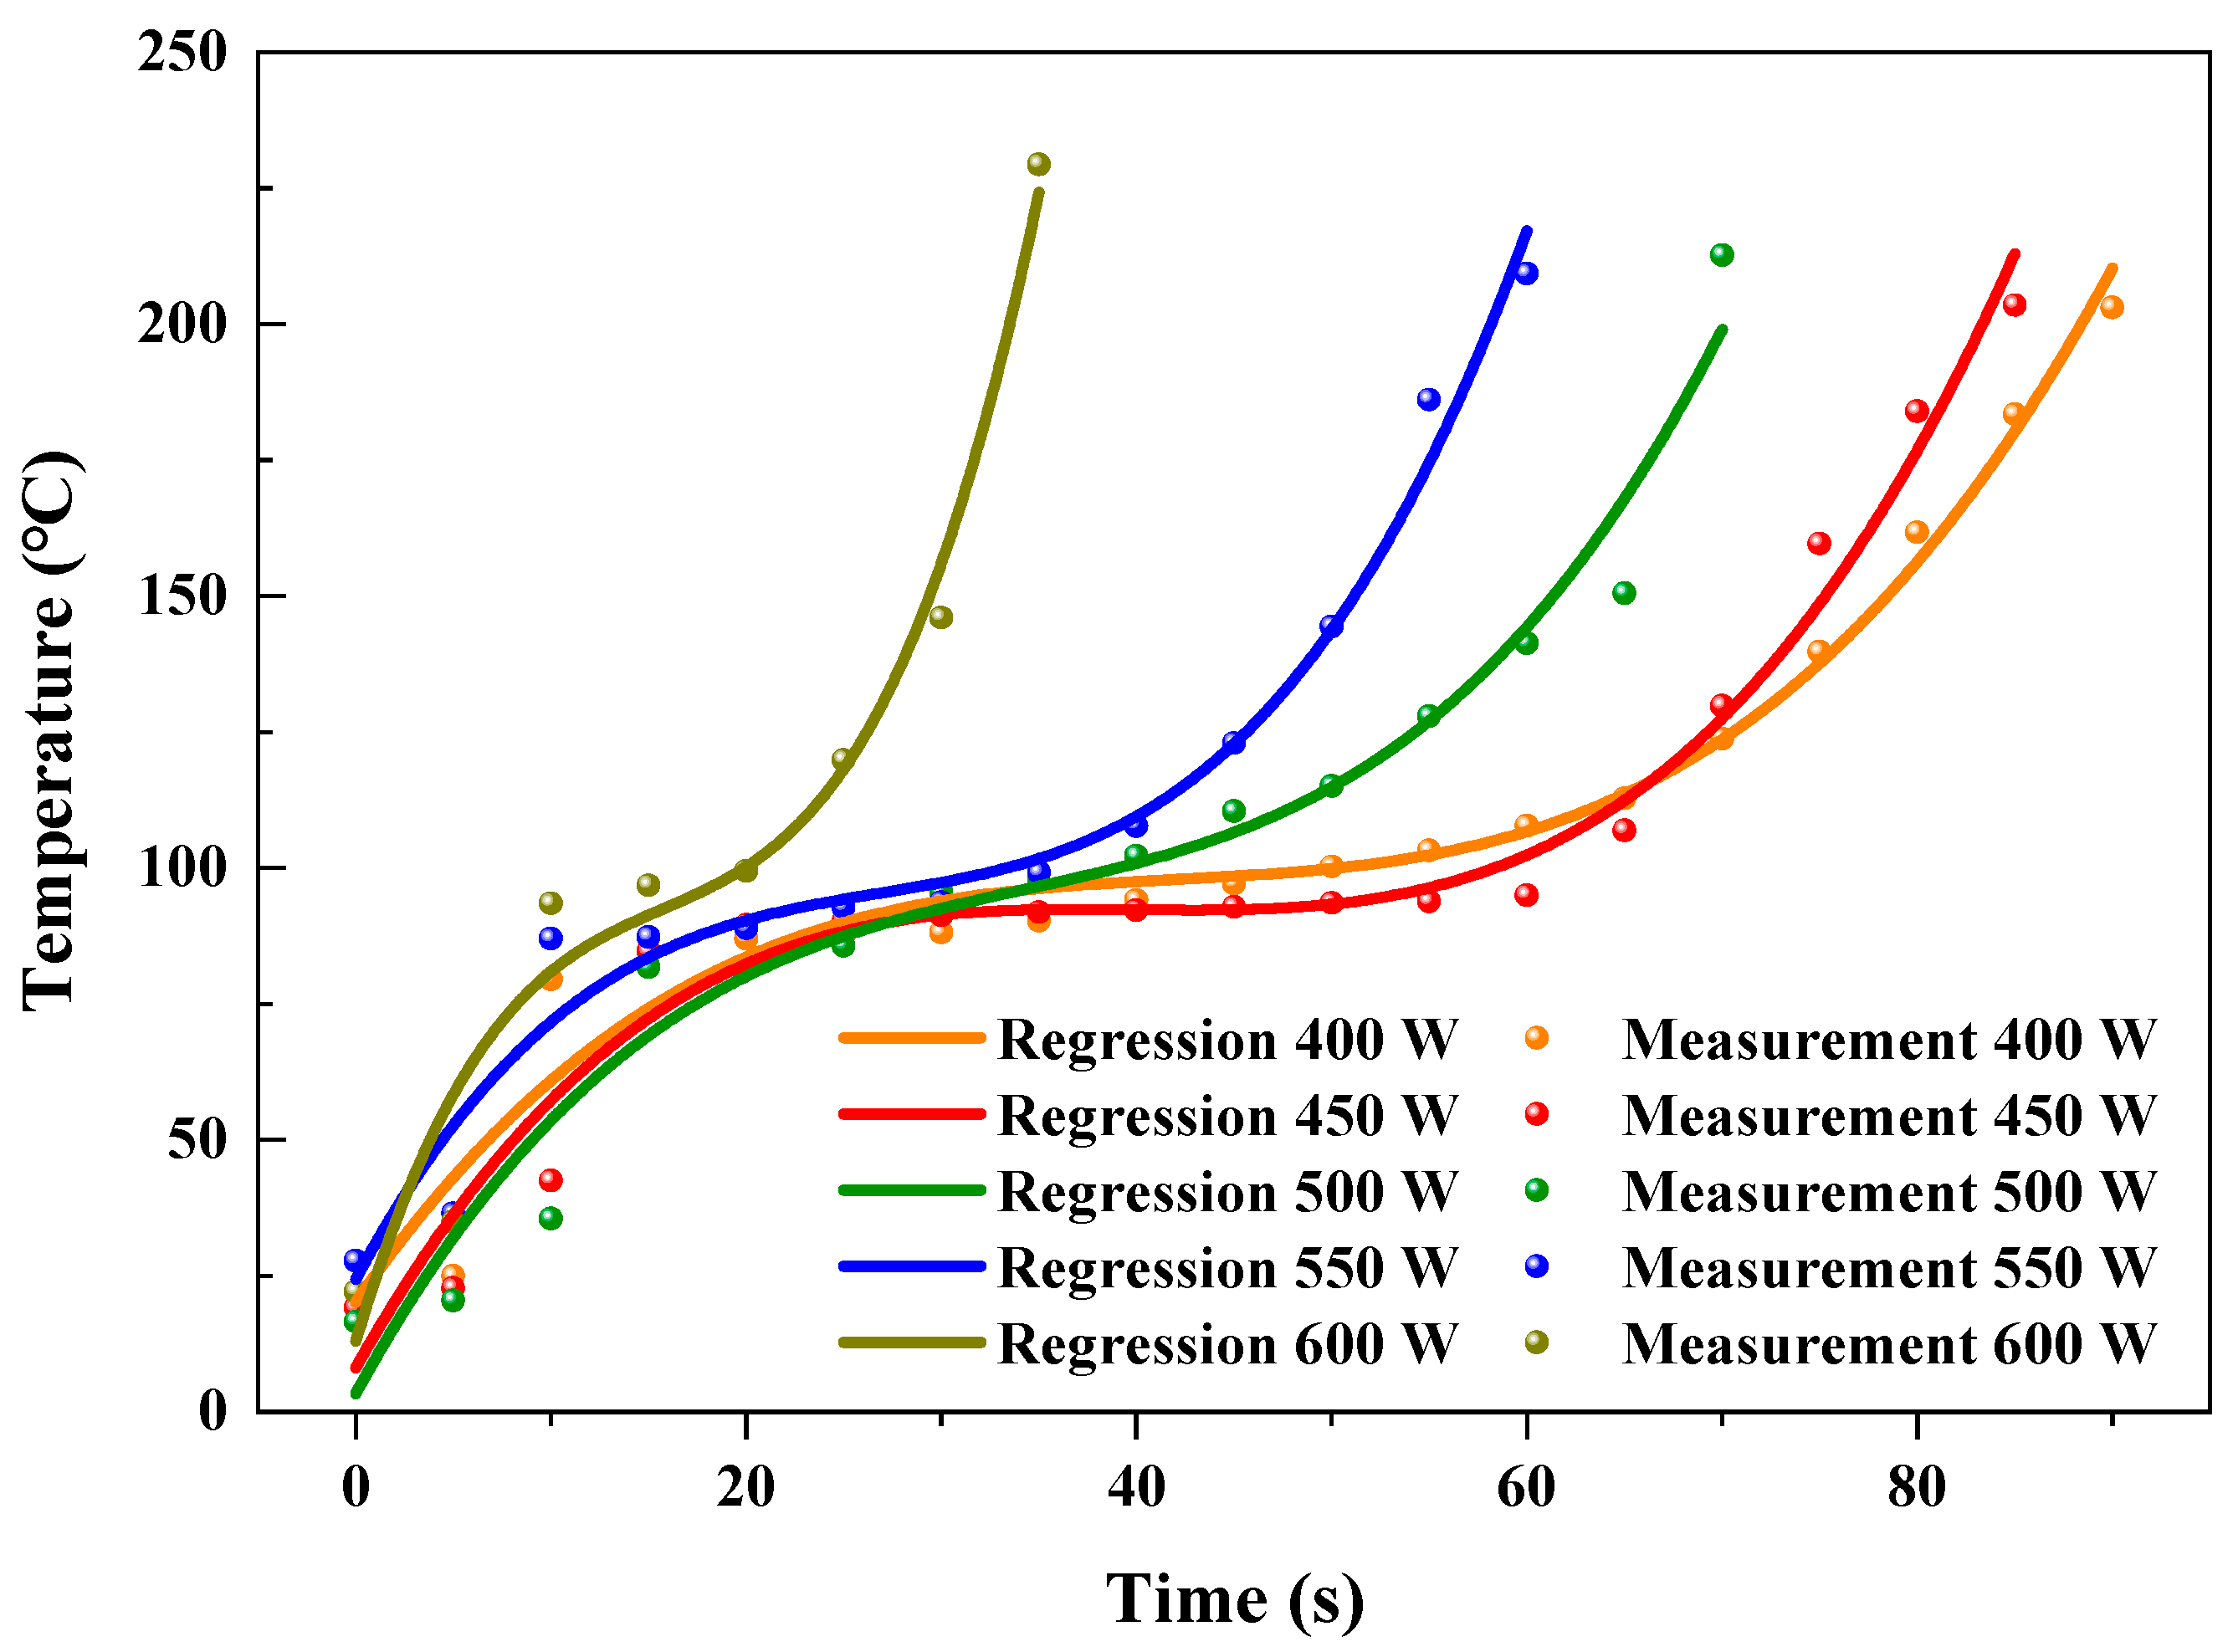
3.1. Effect of Microwave Power

3.1.1. Transient Temperature

Figure 4 shows the heating performances of activated carbon (AC) at different microwave powers (400, 450, 500, 550, and 600 W) with the fixed feeding load (10 g) and reactor volume (150 mL). It showed that as time went on, the temperature of AC improved monotonously with the increase in time. This was due to more microwave energy being absorbed by the AC particles with increased heating time. Higher microwave power was provided, and shorter time was needed for the desired temperature (about 200 °C). The times that the temperature of AC reached the desired value were 90, 85, 70, 60, and 35 s when the microwave powers were 400, 450, 500, 550, and 600 W, with average heating rates of 2.0, 2.2, 2.8, 3.0, and 5.9 °C/s, respectively, as shown in Table 2. The highest heating rate of AC occurred at the microwave power of 600 W, and the lowest occurred at the microwave power of 400 W. These were due to more energy provided and absorbed by AC with the increment of microwave power.
The heating rates of AC, e.g., 2.8 °C/s at microwave power of 500 W, were generally higher that the heating rates of plastic waste, e.g., as reported by Fu et al. [54]. These were due to the fact that AC generally has higher microwave absorbability (tanδ = 0.62) than plastic waste (tanδ = 0.0001–0.0004) [56].
The obvious flat level of temperature was observed at low microwave power (400 W) when the heating time ranged from 15 to 65 s. With the power increased, the time interval of flat level contracted gradually until the shortest interval sustained for around 10 s at 600 W. The time intervals were 50, 45, 25, 20, and 10 s, respectively. Generally, the heating rates rose with the increased microwave powers, resulting in the flat level disappearing gradually.

3.1.2. Temperature Prediction

With respect to microwave heating temperature of AC, dependency on heating time at different microwave power was observed, implying that the temperatures of AC in the heating process had the potential to be predicted according to the heating time. At the fixed feeding load and reactor volume of 10 g and 150 mL, respectively, when the microwave power was 400 W, the temperatures of AC can be predicted by the fitting formula:
T = 20.15947 + 5.16272 t 0.11821 t 2 + 9.36855 × 10 4 t 3     R 2   =   0.973
where T is the transient temperature of AC (unit: °C) and t is the heating time (unit: s).
At the condition with microwave power of 450 W, the temperatures of AC can be predicted by the fitting formula:
T = 8.09708 + 6.39073 t 0.16069 t 2 + 0.00134 t 3     R 2   =   0.972
At the condition with microwave power of 500 W, the temperatures of AC can be predicted by the fitting formula:
T = 3.33302 + 6.5421 t 0.16799 t 2 + 0.00164 t 3     R 2   =   0.963
At the condition with microwave power of 550 W, the temperatures of AC can be predicted by the fitting formula:
T = 24.38503 + 6.7244 t 0.22767 t 2 + 0.00282 t 3     R 2   =   0.973
At the condition with microwave power of 600 W, the temperatures of AC can be predicted by the fitting formula:
T = 12.95455 + 12.0731 t 0.66968 t 2 + 0.01421 t 3     R 2   =   0.948
Figure 5 shows the predicted and experimental temperatures at different microwave powers. The R2 of fitting results were 97.3, 97.2, 96.3, 97.3, and 94.8% for the microwave powers of 400, 450, 500, 550, and 600 W, respectively, as shown in Table 2. To further evaluate the accuracy of the fitting formulae for predicting the temperature of AC in the heating process by virtue of using heating time, the relative errors between predicted and experimental temperatures were calculated. The variation of temperature of AC was not stabilized at the initial heating period, which resulted from the prominent influence of the ambient environment. The relative errors between predicted and experimental temperatures were relatively noticeable at the first 10 s. The maximum relative errors reached 72.4, 58.8, −79.9, 44.3, and 66.7%, corresponding to the microwave powers of 400, 450, 500, 550, and 600 W, respectively. After the initial 10 s, the prediction of heating temperature showed a relative accurate prediction. The relative errors ranged from −12.6 to 6.6, −14.5 to 7.9, −15.4 to 12.4, −6.1 to 3.9, and −5.6 to 6.9%, with the microwave powers at 400, 450, 500, 550, and 600 W, respectively. The maximum relative error predicted (−79.9%) for different microwave powers was generally higher than the predicted value (35.51%) for heating plastic waste reported by Fu et al. [54]. This resulted from the dramatic fluctuation of the temperature at the initial heating period.
Generally, 84.9% of the predicted temperatures had low relative errors (from −17.6 to 12.4%) with the experimental temperatures, indicating that the fitting formulae had satisfied the ability to predict the temperatures of AC and the effect of absorbability for the microwave in the process of microwave assisted heating.

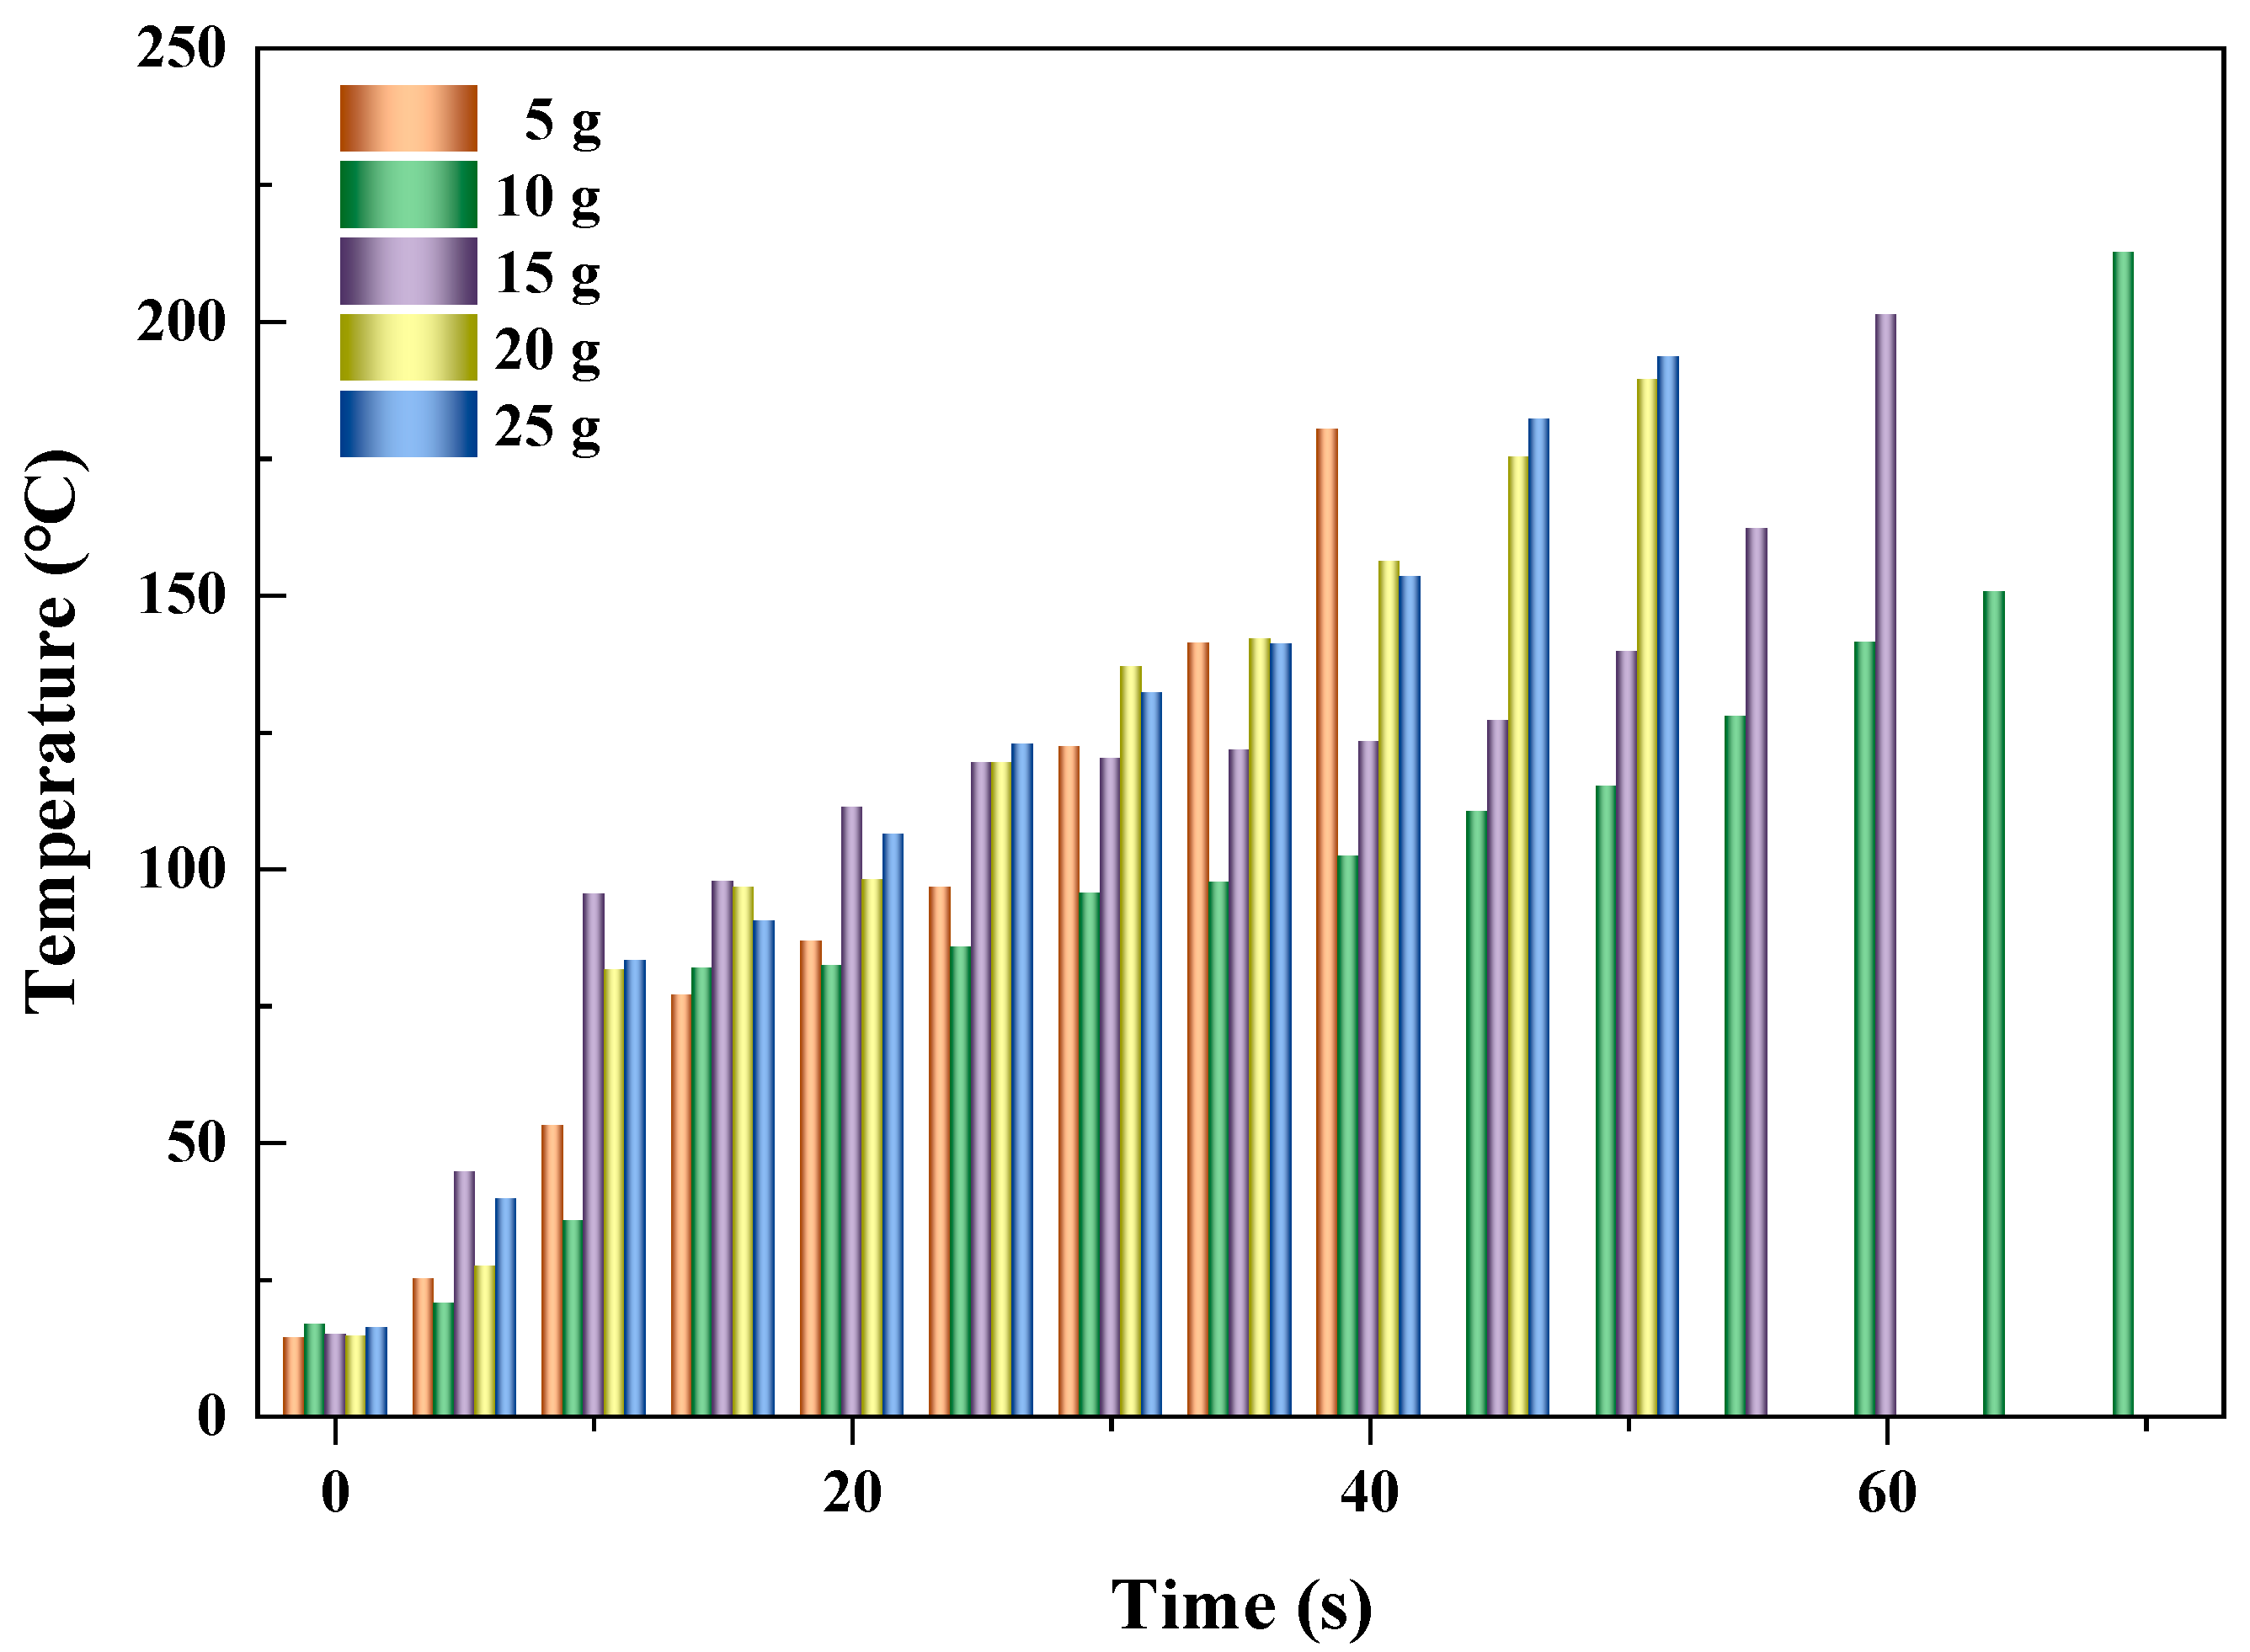
3.2. Effect of Feeding Load

3.2.1. Transient Temperature

Figure 6 shows the heating performances of AC at different feeding loads (5, 10, 15, 20, and 25 g) when the microwave power and reactor volume were fixed at 500 W and 150 mL, respectively. It showed that as time went on, the temperature of AC improved monotonously with the increase in time, resulting from more microwave energy absorbed by the AC particles with increased heating time. Normally, when more AC was fed, a shorter time was needed for the desired temperature (about 200 °C). It was obviously observed that the times for the temperature of AC reaching the desired value were 70, 60, and 50 s when the feeding loads were 10, 15, and 20 g, with average heating rates of 2.8, 3.1, and 3.5 °C/s, respectively, as shown in Table 3. This was because the increased feeding load at fixed microwave power and reactor volume led to decreased radiating surface per unit mass, with more heat stored for improving the temperature of AC [38]. At the condition when the feeding load was 25 g, the temperature of AC reached a desired value after 50 s, being the same as that of 20 g. The more accurate heating rate for the feeding load of 20 g was 3.50 °C/s, whereas that of 25 g was 3.55 °C/s, indicating the heating rate of AC became slow when the feeding load ranged from 20 g to 25 g. Another noticeable phenomenon was that when the AC was fed at 5 g, the feeding rate was 4.2 °C/s, obviously being higher than those at the other conditions. This was mainly because hot spots were generated inside by the micro-plasma [2]. The flat level existed at the conditions in which the feeding loads were 10, 15, and 20 g, with time intervals of 20, 15, and 5 s, respectively. When the feeding load was 25 g, the flat level disappeared due to the high heating rate caused by less heat loss, while with respect to the feeding load of 5 g, no obvious flat level was observed due to the high heating rate resulting from the hot spot. Generally, as the heating rate rose, the flat level disappeared gradually at different feeding loads.

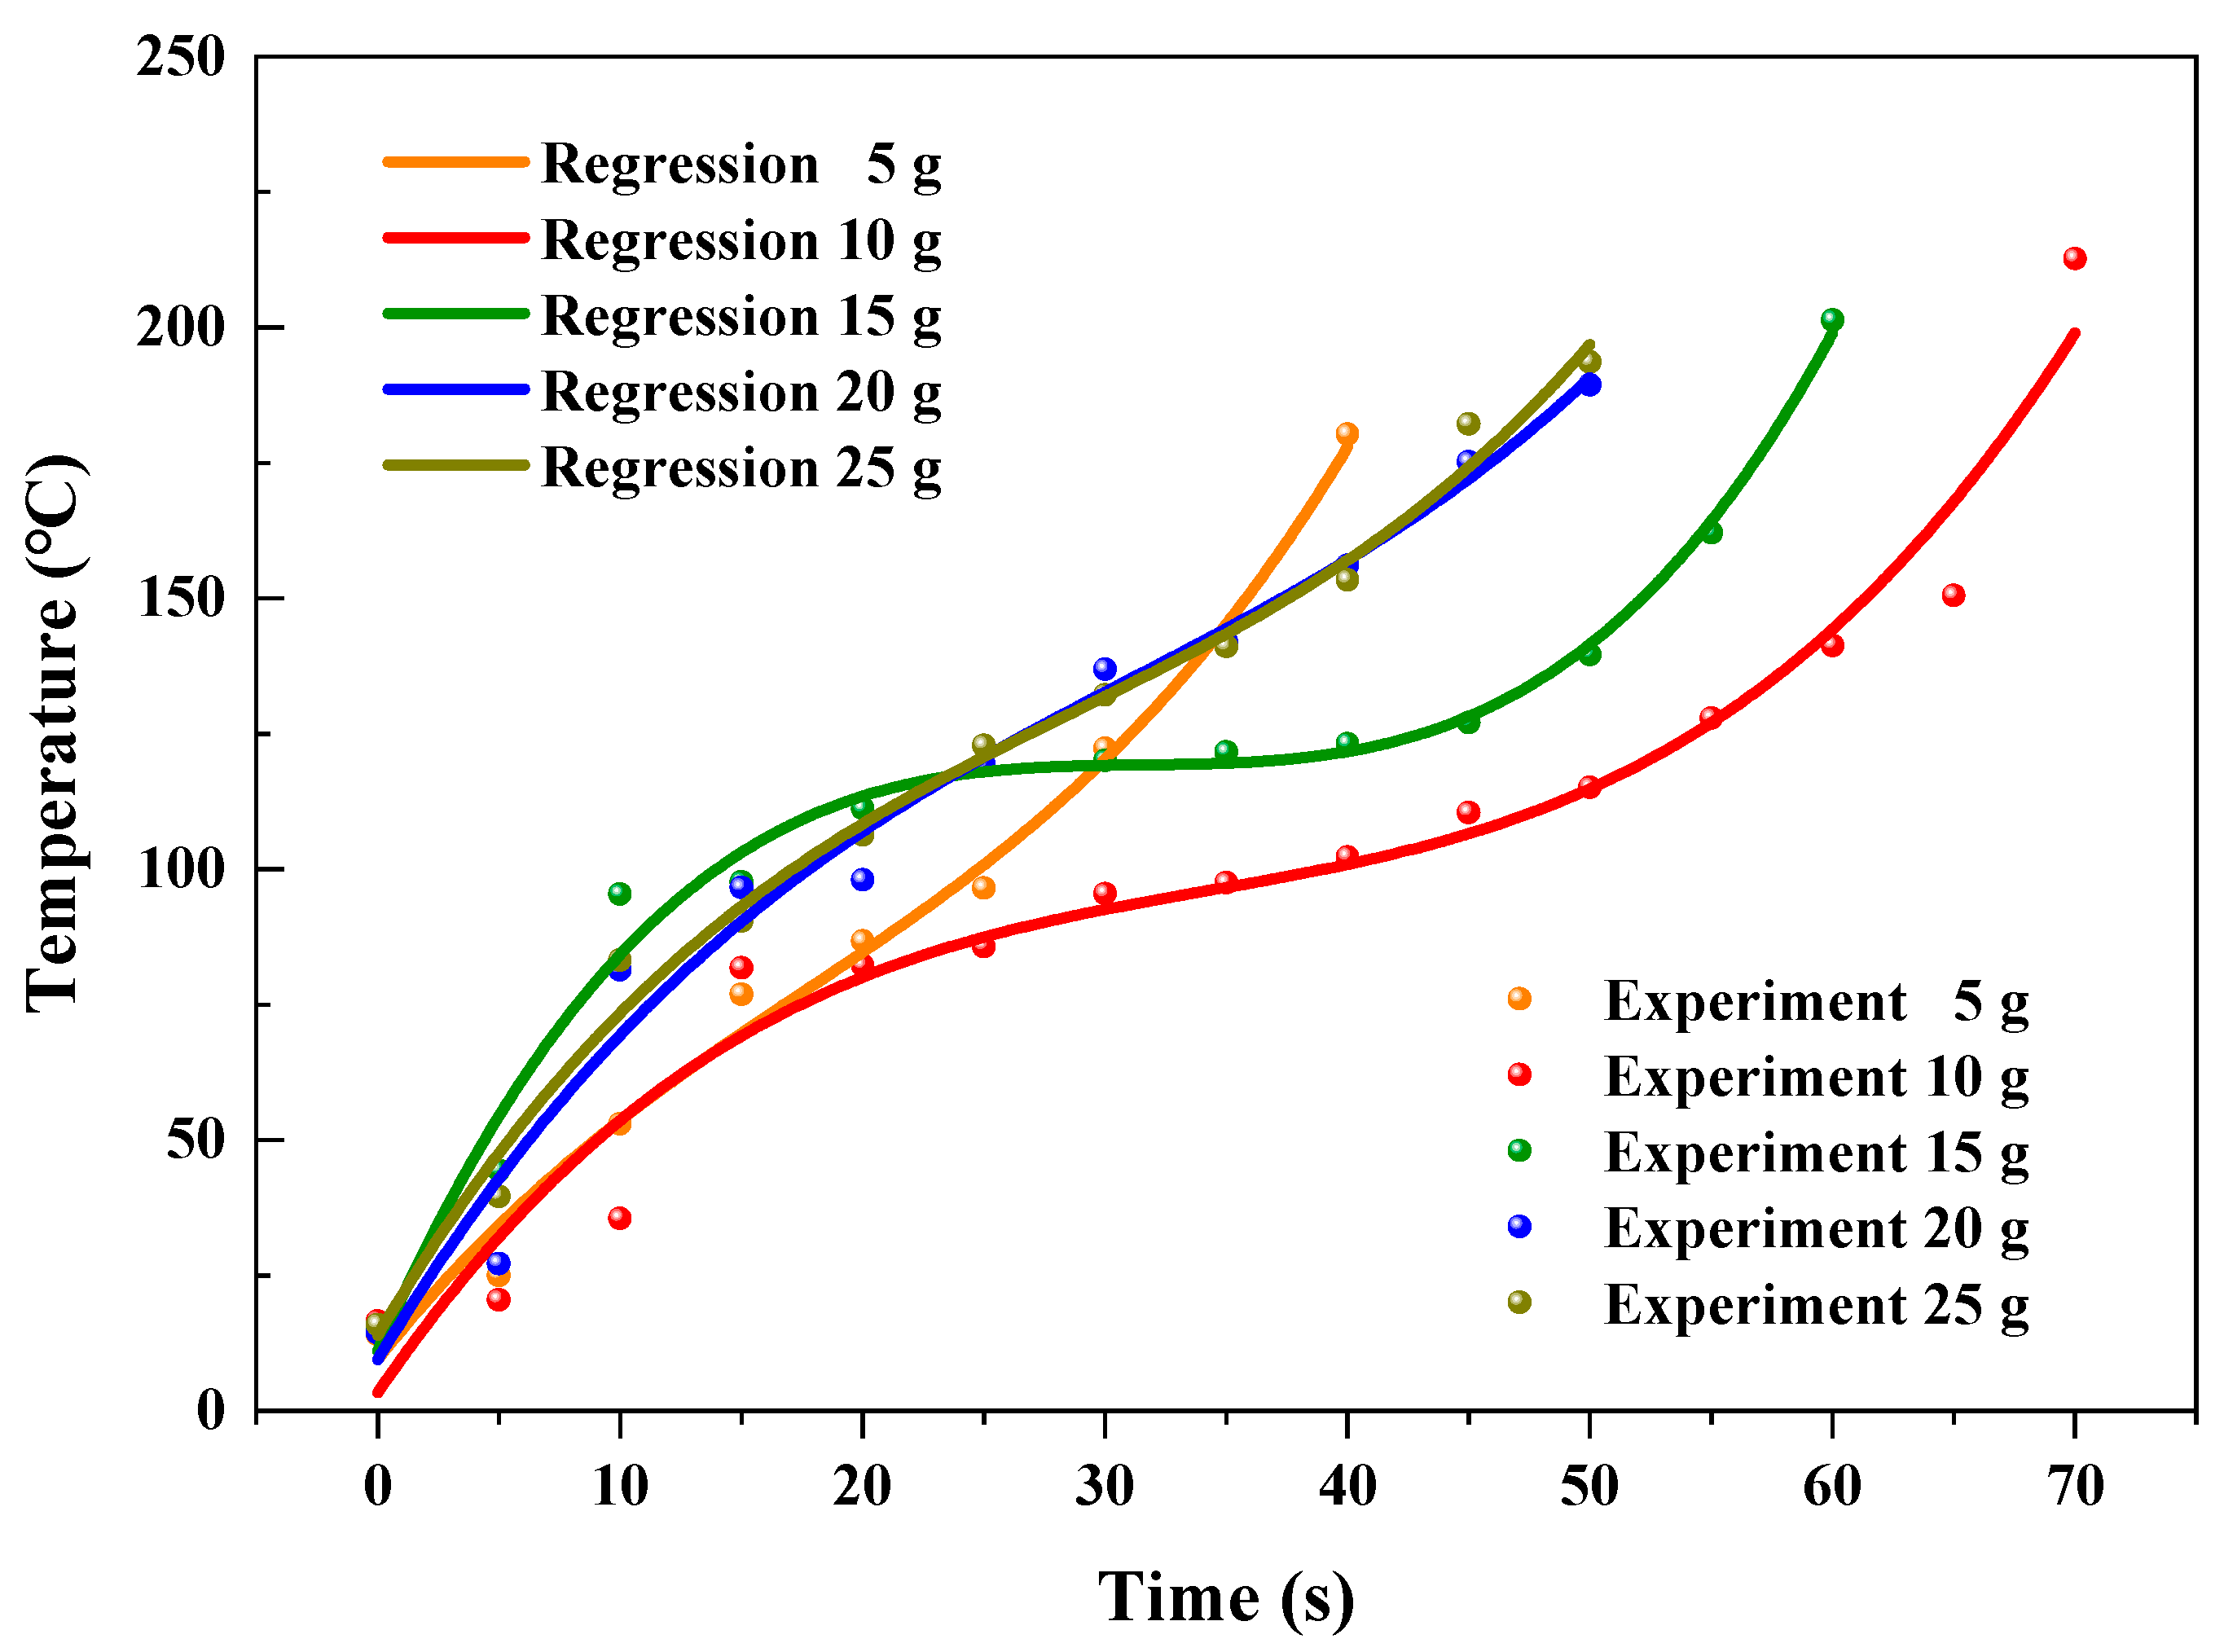
3.2.2. Temperature Prediction

At the fixed microwave power and reactor volume of 500 W and 150 mL, respectively, when the feeding load was 5 g, the temperatures of AC can be predicted by the fitting formula:
T = 9.44747 + 5.65735 t 0.15344 t 2 + 0.00293 t 3     R 2   =   0.991
where T is the transient temperature of AC (unit: °C), and t is the heating time (unit: s).
At the condition with feeding load of 10 g, the temperatures of AC can be predicted by the fitting formula:
T = 3.33302 + 6.5421 t 0.16799 t 2 + 0.00164 t 3     R 2   =   0.963
At the condition with feeding load of 15 g, the temperatures of AC can be predicted by the fitting formula:
T = 11.03255 + 10.19754 t 0.3218 t 2 + 0.0034 t 3     R 2   =   0.989
At the condition with feeding load of 20 g, the temperatures of AC can be predicted by the fitting formula:
T = 9.41469 + 7.46643 t 0.16458 t 2 + 0.00176 t 3     R 2   =   0.982
At the condition with feeding load of 25 g, the temperatures of AC can be predicted by the fitting formula:
T = 16.92308 + 7.19036 t 0.17205 t 2 + 0.002 t 3     R 2   =   0.991
Figure 7 shows the predicted and experimental temperatures at different feeding loads. The R2 of fitting results were 99.1, 96.3, 98.9, 98.2, and 99.1% for the feeding loads of 5, 10, 15, 20, and 25 g, respectively, as shown in Table 3.
To further evaluate the accuracy of the fitting formulae for predicting the temperatures of AC in the heating process by virtue of using heating time, the relative errors between predicted and experimental temperatures were calculated. Resulting from the prominent influence by the ambient environment, the variation of temperature of AC was not stabilized at the initial heating period. The relative errors between predicted and experimental temperatures were relatively noticeable for the first 10 s. The maximum relative errors reached 37.1, −79.9, −24.9, 57.5, and 23.3%, corresponding to the microwave powers of 5, 10, 15, 20, and 25 g, respectively. After the initial 10 s, the prediction of heating temperature showed relative accurate prediction. The relative errors were ranging from −9.4 to 4.4, −15.4 to 12.4, −1.8 to 5.6, −6.5 to 9.2, and −1.9 to 13.5%, with the feeding loads of 5, 10, 15, 20, and 25 g, respectively. Generally, 83.1% of the predicted temperatures had low relative errors (from −15.4 to 13.5%) with the experimental temperatures, indicating that the fitting formulae had the ability to predict the temperatures of AC in the process of microwave assisted heating.

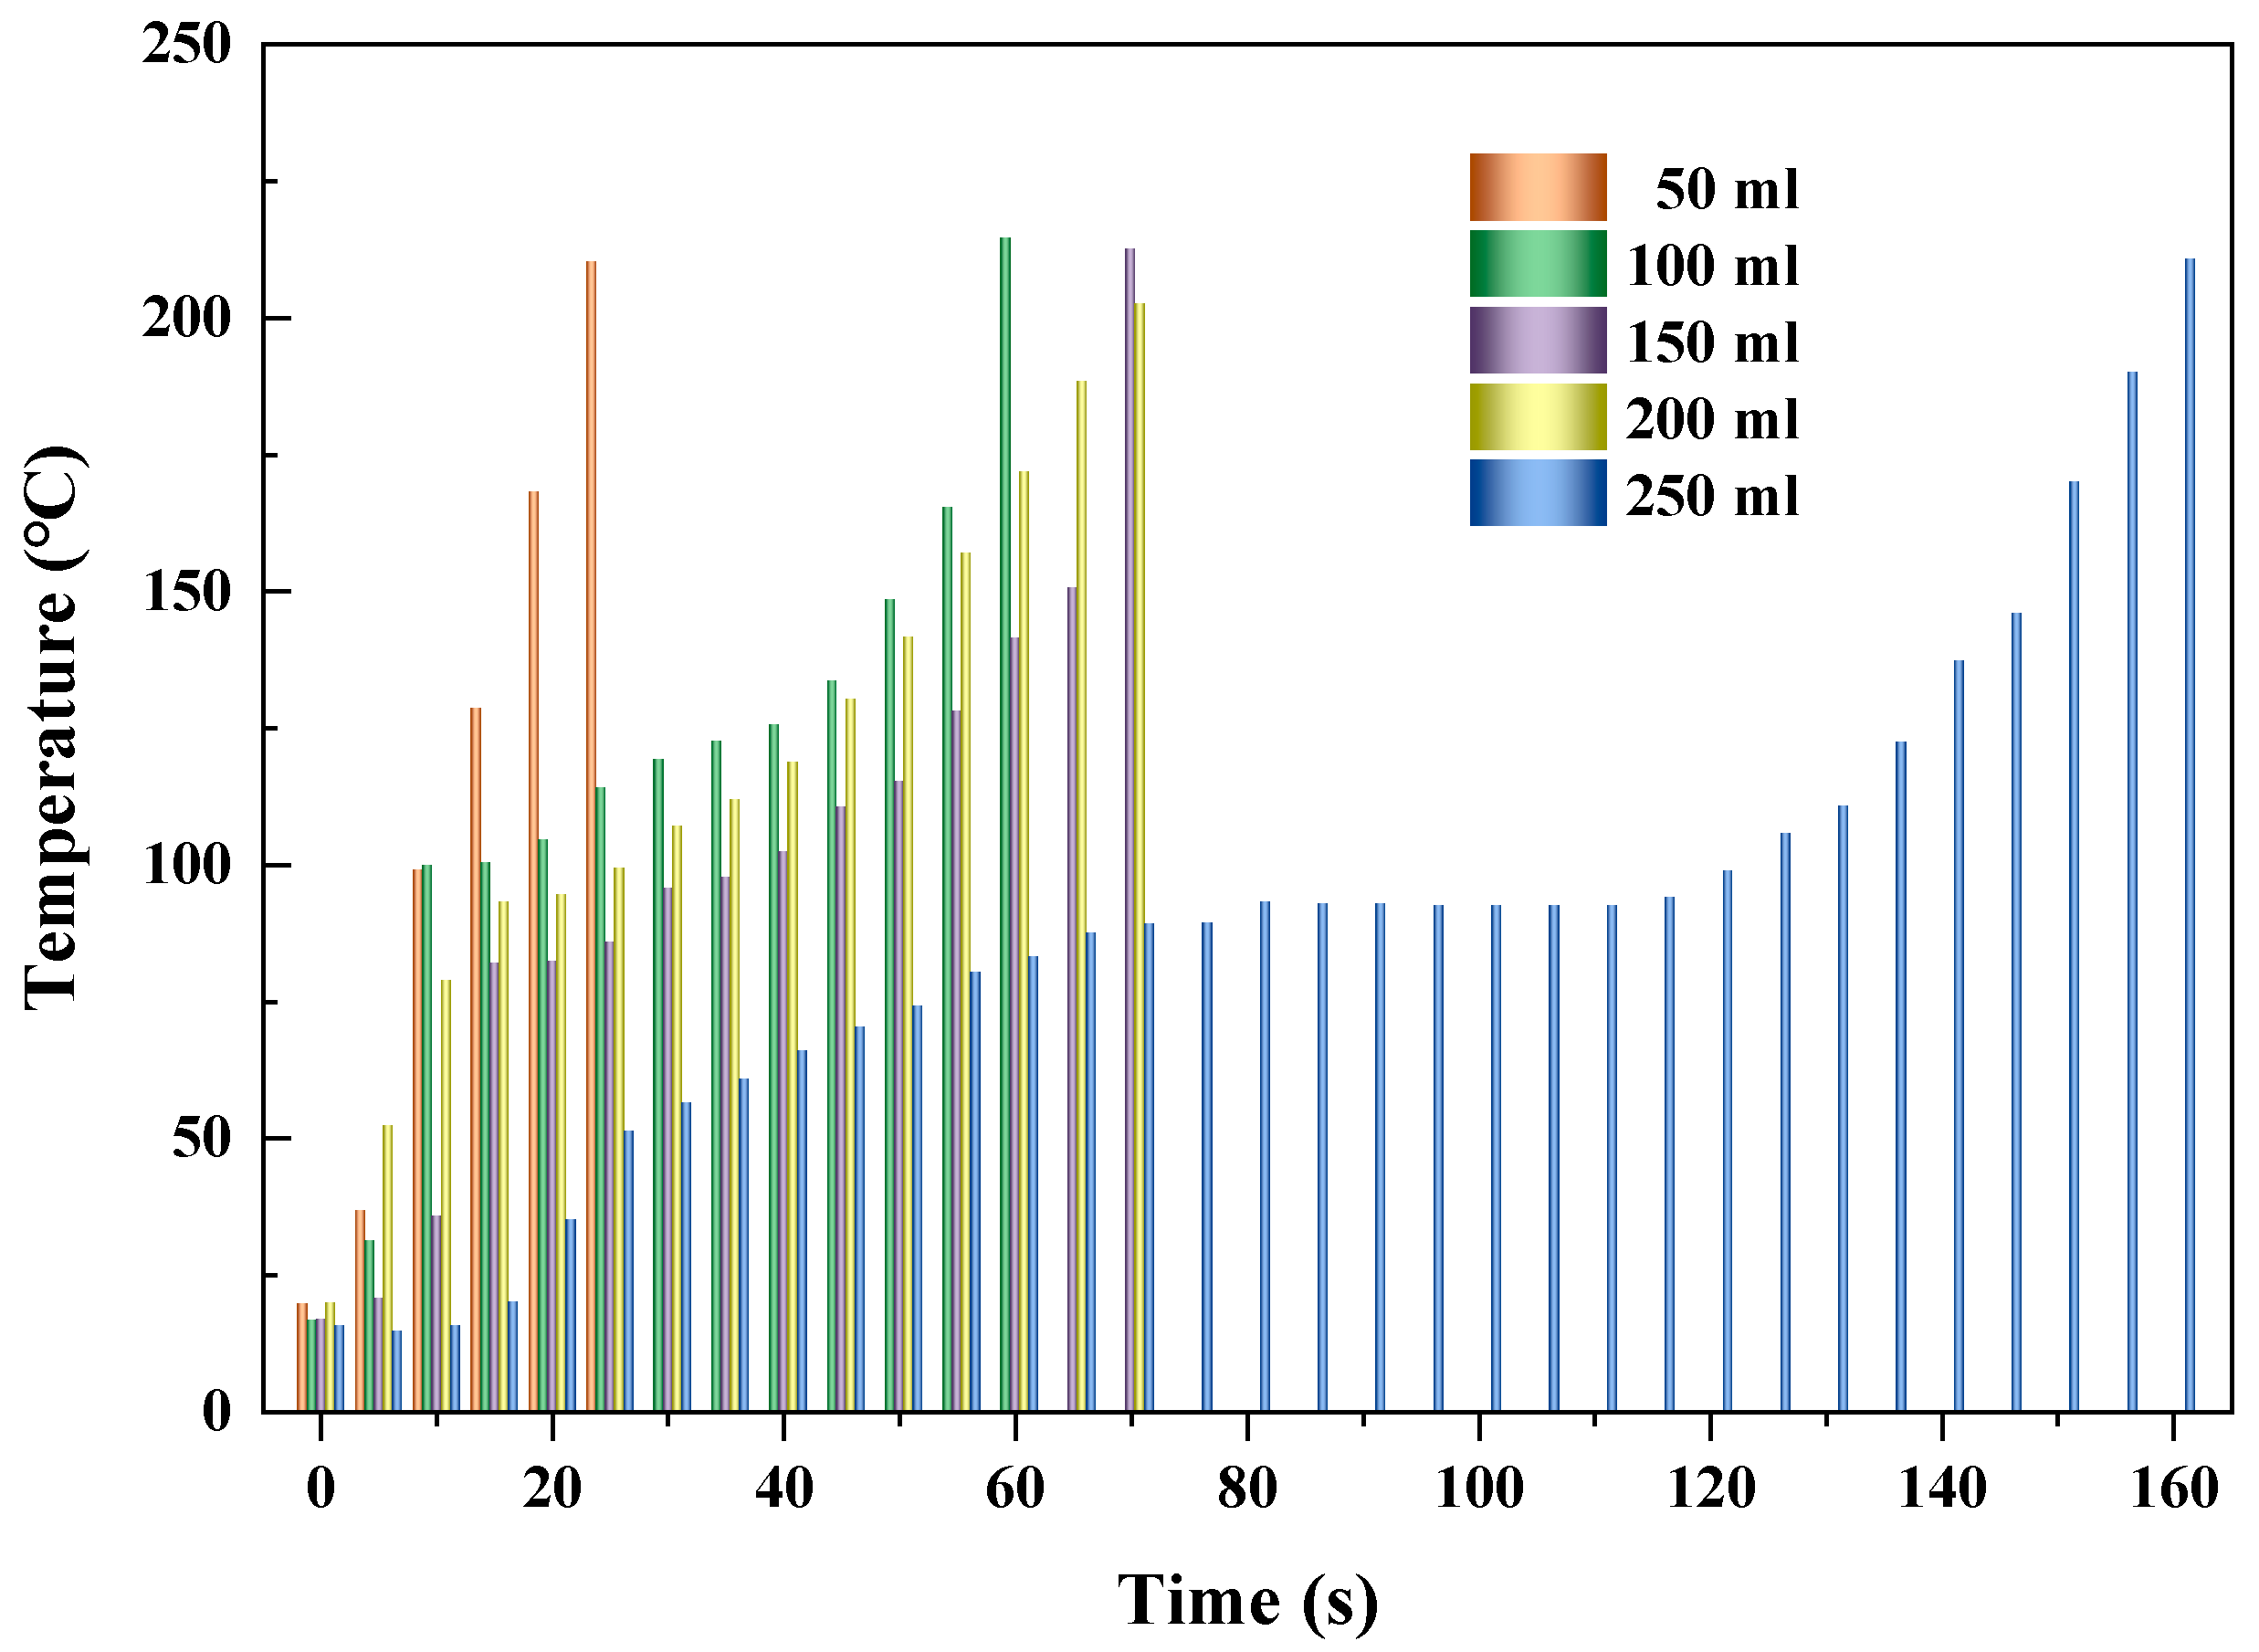
3.3. Effect of Feeding Load

3.3.1. Transient Temperature

Figure 8 shows the heating performances of AC at different reactor volumes (50, 100, 150, 200, and 250 mL) when the microwave power and feeding load were fixed at 500 W and 10 g, respectively. It shows that as time went on, the temperature of AC improved monotonously with the increase in time. This was because more microwave energy was absorbed by the AC particles with increased heating time. Larger reactor volume was provided, and longer time was needed for the desired temperature (about 200 °C). The times that the temperature of AC reached the desired value were 25, 60, 70, 70, and 160 s when the reactor volumes were 50, 100, 150, 200, and 250 mL, with average heating rates of 7.6, 3.3, 2.8, 2.6, and 1.2 °C/s, respectively, as shown in Table 4. The highest heating rate of AC occurred at the reactor volume of 50 mL, and the lowest occurred at the reactor volume of 250 mL. The variation of temperature for heating AC presented an identical tendency as reported by Hong et al. [49]. This was due to the increased reactor volume at fixed microwave power and feeding load leading to increased radiating surface per unit mass, with less heat stored for improving the temperature of AC. At the conditions of various reactor volumes, the flat lever existed obviously at reactor volume of 250 mL, with a time interval of 55 s. With respect to the other conditions, the flat level was relatively insignificant.

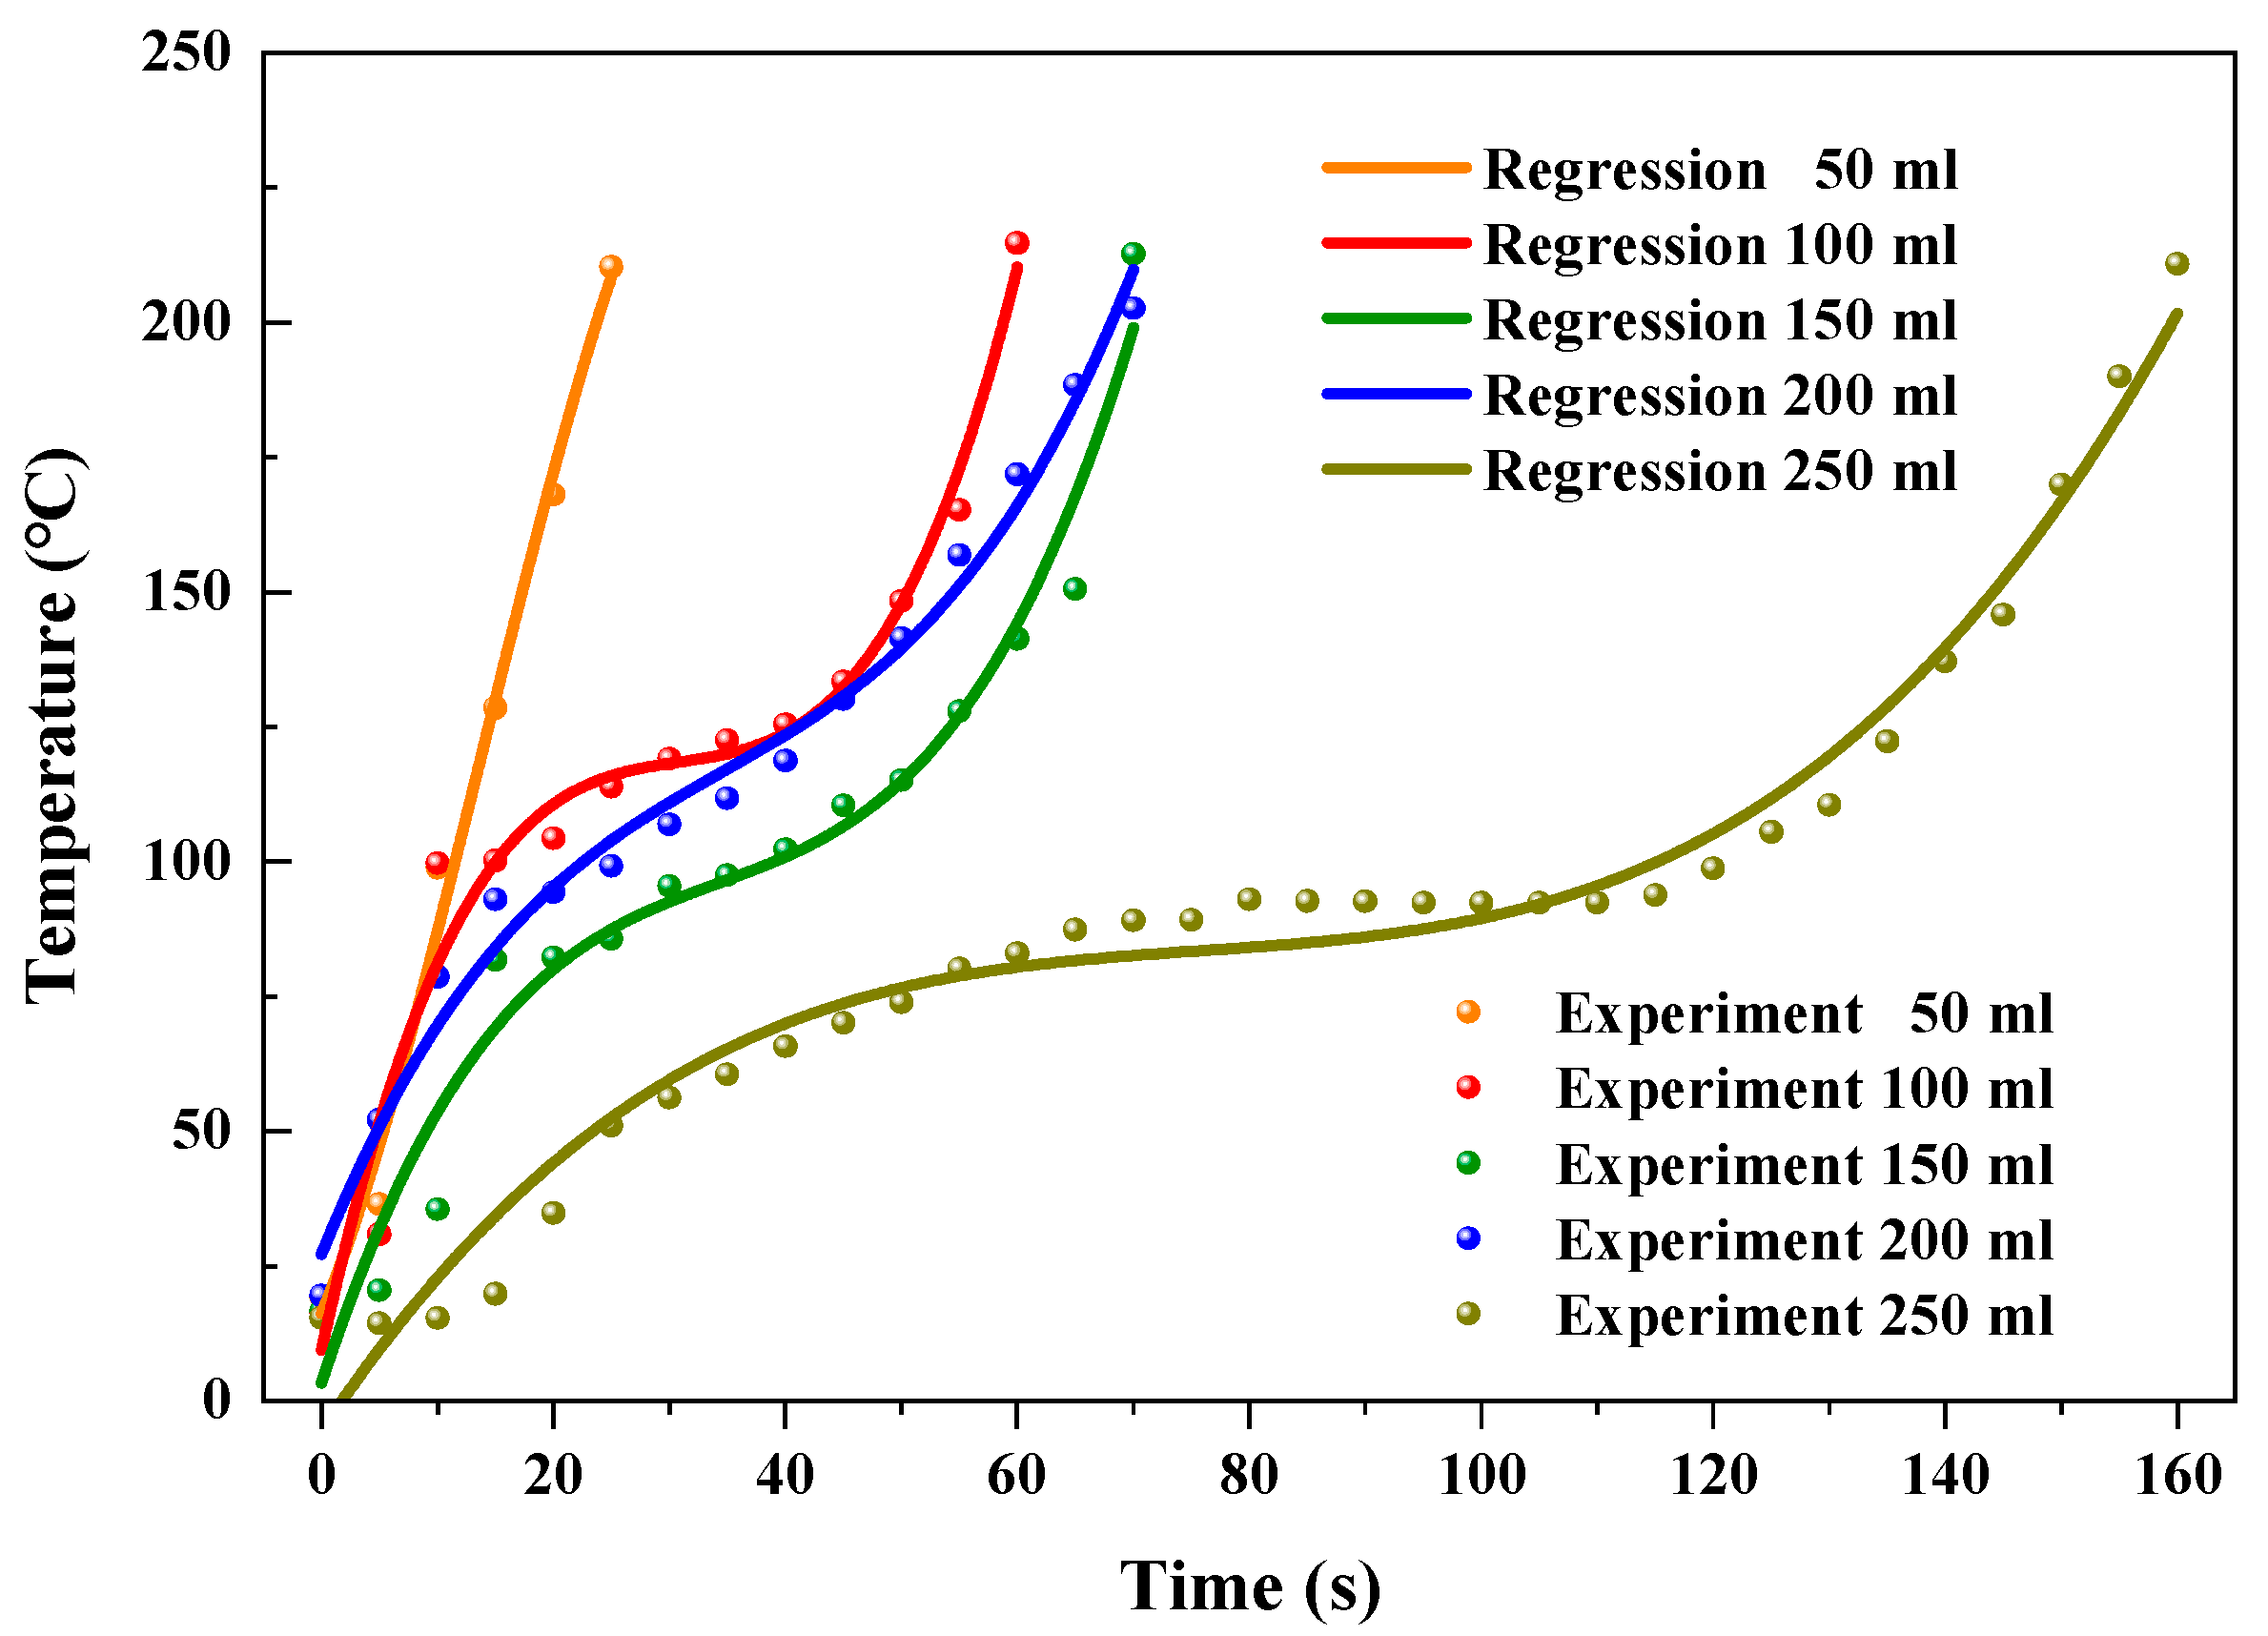
3.3.2. Temperature Prediction

At the fixed microwave power and feeding load of 500 W and 10 g, respectively, when the reactor volume was 50 mL, the temperatures of AC can be predicted by the fitting formula:
T = 16.19603 + 5.10791 t 0.26089 t 2 + 0.0063 t 3     R 2   =   0.989
where T is the transient temperature of AC (unit: °C) and t is the heating time (unit: s).
At the condition with reactor volume of 100 mL, the temperatures of AC can be predicted by the fitting formula:
T = 9.32445 + 9.95766 t 0.31173 t 2 + 0.00336 t 3     R 2   =   0.969
At the condition with reactor volume of 150 mL, the temperatures of AC can be predicted by the fitting formula:
T = 3.33302 + 6.5421 t 0.16799 t 2 + 0.00164 t 3     R 2   =   0.963
At the condition with reactor volume of 200 mL, the temperatures of AC can be predicted by the fitting formula:
T = 27.14578 + 5.30854 t 0.11778 t 2 + 0.00113 t 3     R 2   =   0.987
At the condition with reactor volume of 250 mL, the temperatures of AC can be predicted by the fitting formula:
T = 5.60409 + 3.22793 t 0.04059 t 2 + 1.78239 × 10 4 t 3     R 2   =   0.975
Figure 9 shows the predicted and experimental temperatures at different reactor volumes. The R2 of fitting results were 98.9, 96.9, 96.3, 98.7, and 97.5% for the reactor volumes of 50, 100, 150, 200, and 250 mL, respectively, as shown in Table 4.
To further evaluate the accuracy of the fitting formulae for predicting the temperatures of AC in the heating process by virtue of heating time, the relative errors between predicted and experimental temperatures were calculated. The variation of the temperature of AC was not stabilized at the initial heating period, which resulted from the prominent influence of the ambient environment. The relative errors between predicted and experimental temperature were relatively noticeable for the first 5 s (initial 20 s was the time period in which prominent relative error existed for 250 mL reactor volume). The maximum relative errors reached 30.1, 67.4, −24.9, 39.2, and −136.4%, corresponding to the reactor volumes of 50, 100, 150, 200, and 250 mL, respectively. After the initial 5 s (20 s for 250 mL reactor volume), the prediction of heating temperature showed a relatively accurate prediction. The relative errors were ranging from −12.0 to 2.5, −18.7 to 6.1, −15.4 to 12.4, −11.5 to 4.8, and −9.6 to 8.3%, with the reactor volumes of 50, 100, 150, 200, and 250 mL, respectively. Generally, 85.4% of the predicted temperatures had low relative errors (from −18.7 to 12.4%) with the experimental temperatures, indicating the fitting formulae had the ability to predict the temperatures of AC in the process of microwave assisted heating.

4. Conclusions

The heating performances of activated carbon (AC) in a microwave field were investigated and some conclusions were obtained.
When the microwave powers were 400, 450, 500, 550, and 600 W, the temperatures of AC in the heating process increased to the desired temperature (about 200 °C) within 90, 85, 70, 60, and 35 s with average heating rates of 2.0, 2.2, 2.8, 3.0, and 5.9 °C/s, respectively. High microwave power emitted more radiant energy and heated AC with a more rapid heating rate. Fitting formulae were given to predict the temperatures, and the relative errors ranged from −12.6 to 6.6, −14.5 to 7.9, −15.4 to 12.4, −6.1 to 3.9, and −5.6 to 6.9%, corresponding to the microwave powers of 400, 450, 500, 550, and 600 W, respectively.
When the feeding loads were 10, 15, 20, and 25 g, the temperatures of AC increased to desired temperature within 70, 60, 50, and 50 s with average heating rates of 2.8, 3.1, 3.50, and 3.55 °C/s, respectively. In general, more feeding load resulted in faster heating rates, but hot spot occurred at the feeding load of 5 g. Fitting formulae were given to predict the temperatures, and the relative errors ranged from −9.4 to 4.4, −15.4 to 12.4, −1.8 to 5.6, −6.5 to 9.2, and −1.9 to 13.5%, corresponding to the feeding loads of 5, 10, 15, 20, and 25 g, respectively.
When the reactor volumes were 50, 100, 150, 200, and 250 mL, the temperatures of AC increased to the desired temperature within 25, 60, 70, 70, and 160 s with average heating rates of 7.6, 3.3, 2.8, 2.6, and 1.2 °C/s, respectively. Larger reactor volumes resulted in a lower heating rate due to the increased heat loss. Fitting formulae were given to predict the temperatures, and the relative errors ranged from −12.0 to 2.5, −18.7 to 6.1, −15.4 to 12.4, −11.5 to 4.8, and −9.6 to 8.3%, corresponding to the reactor volumes of 50, 100, 150, 200, and 250 mL, respectively.
The results obtained in this paper can: (a) describe the transient temperatures of AC heated in microwave field, and (b) predict the transient temperatures of AC in microwave field.

Author Contributions

C.S.: Experiment and writing original draft, H.S.: Experiment and writing original draft, H.L. (Hui Li): Validation, H.L. (Hui Liu): Supervision, E.M.: Validation, W.Z.: Validation, Y.Z.: Supervision. All authors have read and agreed to the published version of the manuscript.

Funding

National Natural Science Foundation of China (52076049), Scientific Research Starting Foundation for the Postdoctors at Heilongjiang Province (AUGA4120000518).

Acknowledgments

Financial support was provided by the National Natural Science Foundation of China (52076049), Scientific Research Starting Foundation for the Postdoctors at Heilongjiang Province (AUGA4120000518).

Conflicts of Interest

The authors declare no conflict of interest.

Abbreviations

The following abbreviations are used in this manuscript:
ACActivated carbon
MAPMicrowave assisted pyrolysis
HDPEHigh density polyethylene
LDPELow density polyethylene

References

  1. Chingombe, P.; Saha, B.; Wakeman, R. Surface modification and characterisation of a coal-based activated carbon. Carbon 2005, 43, 3132–3143. [Google Scholar] [CrossRef]
  2. Ao, W.; Fu, J.; Mao, X.; Kang, Q.; Ran, C.; Liu, Y.; Zhang, H.; Gao, Z.; Li, J.; Liu, G. Microwave assisted preparation of activated carbon from biomass: A review. Renew. Sustain. Energy Rev. 2018, 92, 958–979. [Google Scholar] [CrossRef]
  3. Yue, Z.; Economy, J.; Bordson, G. Preparation and characterization of NaOH-activated carbons from phenolic resin. J. Mater. Chem. 2006, 16, 1456–1461. [Google Scholar] [CrossRef]
  4. Kumari, M.; Chaudhary, G.R.; Chaudhary, S.; Umar, A. Transformation of solid plastic waste to activated carbon fibres for wastewater treatment. Chemosphere 2022, 294, 133692. [Google Scholar] [CrossRef]
  5. Heidarinejad, Z.; Dehghani, M.H.; Heidari, M.; Javedan, G.; Ali, I.; Sillanpää, M. Methods for preparation and activation of activated carbon: A review. Environ. Chem. Lett. 2020, 18, 393–415. [Google Scholar] [CrossRef]
  6. Bouchelta, C.; Medjram, M.S.; Bertrand, O.; Bellat, J.-P. Preparation and characterization of activated carbon from date stones by physical activation with steam. J. Anal. Appl. Pyrolysis 2008, 82, 70–77. [Google Scholar] [CrossRef]
  7. Colomba, A.; Berruti, F.; Briens, C. Model for the physical activation of biochar to activated carbon. J. Anal. Appl. Pyrolysis 2022, 168, 105769. [Google Scholar] [CrossRef]
  8. Chen, Y.; Zhu, Y.; Wang, Z.; Li, Y.; Wang, L.; Ding, L.; Gao, X.; Ma, Y.; Guo, Y. Application studies of activated carbon derived from rice husks produced by chemical-thermal process—A review. Adv. Colloid Interface Sci. 2011, 163, 39–52. [Google Scholar] [CrossRef]
  9. Liu, Z.; Sun, Y.; Xu, X.; Meng, X.; Qu, J.; Wang, Z.; Liu, C.; Qu, B. Preparation, characterization and application of activated carbon from corn cob by KOH activation for removal of Hg (II) from aqueous solution. Bioresour. Technol. 2020, 306, 123154. [Google Scholar] [CrossRef]
  10. Bejjanki, D.; Banothu, P.; Kumar, V.B.; Kumar, P.S. Biomass-Derived N-Doped Activated Carbon from Eucalyptus Leaves as an Efficient Supercapacitor Electrode Material. J. Carbon Res. 2023, 9, 24. [Google Scholar] [CrossRef]
  11. Yahya, M.A.; Al-Qodah, Z.; Ngah, C.W.Z. Agricultural bio-waste materials as potential sustainable precursors used for activated carbon production: A review. Renew. Sustain. Energy Rev. 2015, 46, 218–235. [Google Scholar] [CrossRef]
  12. Yi, H.; Nakabayashi, K.; Yoon, S.-H.; Miyawaki, J. Pressurized physical activation: A simple production method for activated carbon with a highly developed pore structure. Carbon 2021, 183, 735–742. [Google Scholar] [CrossRef]
  13. Kumar, D.P.; Ramesh, D.; Subramanian, P.; Karthikeyan, S.; Surendrakumar, A. Activated carbon production from coconut leaflets through chemical activation: Process optimization using Taguchi approach. Bioresour. Technol. Rep. 2022, 19, 101155. [Google Scholar] [CrossRef]
  14. Rambabu, N.; Rao, B.V.S.K.; Surisetty, V.R.; Das, U.; Dalai, A.K. Production, characterization, and evaluation of activated carbons from de-oiled canola meal for environmental applications. Ind. Crops Prod. 2015, 65, 572–581. [Google Scholar] [CrossRef]
  15. Cui, X.Y.; Jia, F.; Chen, Y.X.; Gan, J. Influence of single-walled carbon nanotubes on microbial availability of phenanthrene in sediment. Ecotoxicology 2011, 20, 1277–1285. [Google Scholar] [CrossRef]
  16. Ouachtak, H.; El Guerdaoui, A.; El Haouti, R.; Haounati, R.; Ighnih, H.; Toubi, Y.; Alakhras, F.; Rehman, R.; Hafid, N.; Addi, A.A. Combined molecular dynamics simulations and experimental studies of the removal of cationic dyes on the eco-friendly adsorbent of activated carbon decorated montmorillonite Mt@ AC. RSC Adv. 2023, 13, 5027–5044. [Google Scholar] [CrossRef]
  17. Bhatnagar, A.; Hogland, W.; Marques, M.; Sillanpää, M. An overview of the modification methods of activated carbon for its water treatment applications. Chem. Eng. J. 2013, 219, 499–511. [Google Scholar] [CrossRef]
  18. Reza, M.S.; Yun, C.S.; Afroze, S.; Radenahmad, N.; Bakar, M.S.A.; Saidur, R.; Taweekun, J.; Azad, A.K. Preparation of activated carbon from biomass and its’ applications in water and gas purification, a review. Arab. J. Basic Appl. Sci. 2020, 27, 208–238. [Google Scholar] [CrossRef]
  19. Abd, A.A.; Othman, M.R.; Kim, J. A review on application of activated carbons for carbon dioxide capture: Present performance, preparation, and surface modification for further improvement. Environ. Sci. Pollut. Res. 2021, 28, 43329–43364. [Google Scholar] [CrossRef]
  20. Amin, M.; Shah, H.H. Effect of Absorption Time for the Preparation of Activated Carbon from Wasted Tree Leaves of Quercus alba and Investigating Life Cycle Assessment. J. Carbon Res. 2022, 8, 57. [Google Scholar] [CrossRef]
  21. Madani, N.; Moulefera, I.; Boumad, S.; Cazorla-Amorós, D.; Gandía, F.J.V.; Cherifi, O.; Bouchenafa-Saib, N. Activated Carbon from Stipa tenacissima for the Adsorption of Atenolol. J. Carbon Res. 2022, 8, 66. [Google Scholar] [CrossRef]
  22. Hussain, O.A.; Hathout, A.S.; Abdel-Mobdy, Y.E.; Rashed, M.M.; Abdel Rahim, E.A.; Fouzy, A.S.M. Preparation and characterization of activated carbon from agricultural wastes and their ability to remove chlorpyrifos from water. Toxicol. Rep. 2023, 10, 146–154. [Google Scholar] [CrossRef]
  23. Kuan, W.-H.; Hu, Y.-S.; Chiu, C.-Y.; Hung, K.-Y.; Chou, S.-S. Microwave-catalyzed conversion of phenolic resin waste to activated carbon and its applications for removing ammonium from water. Catalysts 2021, 11, 783. [Google Scholar] [CrossRef]
  24. Regti, A.; Lakbaibi, Z.; Ben El Ayouchia, H.; El Haddad, M.; Laamari, M.R.; El Himri, M.; Haounati, R. Hybrid methods combining computational and experimental measurements for the uptake of eriochrome black T dye utilising fish scales. Int. J. Environ. Anal. Chem. 2021, 1–20. [Google Scholar] [CrossRef]
  25. Tian, H.; Pan, J.; Zhu, D.; Guo, Z.; Yang, C.; Xue, Y.; Wang, D.; Wang, Y. Performance on desulfurization and denitrification of one-step produced activated carbon for purification of sintering flue gas. J. Environ. Manag. 2022, 323, 116281. [Google Scholar] [CrossRef]
  26. Mohd Azmi, N.Z.; Buthiyappan, A.; Abdul Raman, A.A.; Abdul Patah, M.F.; Sufian, S. Recent advances in biomass based activated carbon for carbon dioxide capture—A review. J. Ind. Eng. Chem. 2022, 116, 1–20. [Google Scholar] [CrossRef]
  27. Chuah, C.Y.; Laziz, A.M. Recent Progress in Synthesis and Application of Activated Carbon for CO2 Capture. J. Carbon Res. 2022, 8, 29. [Google Scholar] [CrossRef]
  28. Albaiz, A.; Alsaidan, M.; Alzahrani, A.; Almoalim, H.; Rinaldi, A.; Jalilov, A.S. Active Carbon-Based Electrode Materials from Petroleum Waste for Supercapacitors. J. Carbon Res. 2023, 9, 4. [Google Scholar] [CrossRef]
  29. Ma, X.; Hou, Y.; Yang, L.; Lv, H. Adsorption behaviors of VOCs under coal-combustion flue gas environment using activated carbon injection coupled with bag filtering system. Colloids Surf. A Physicochem. Eng. Asp. 2021, 627, 127158. [Google Scholar] [CrossRef]
  30. Li, Y.; Li, Y.; Li, L.; Shi, X.; Wang, Z. Preparation and analysis of activated carbon from sewage sludge and corn stalk. Adv. Powder Technol. 2016, 27, 684–691. [Google Scholar] [CrossRef]
  31. Baghel, P.K. Application of microwave in manufacturing technology: A review. Mater. Today Proc. 2023. [Google Scholar] [CrossRef]
  32. Viji, P.; Madhusudana Rao, B.; Debbarma, J.; Ravishankar, C.N. Research developments in the applications of microwave energy in fish processing: A review. Trends Food Sci. Technol. 2022, 123, 222–232. [Google Scholar] [CrossRef]
  33. State, R.N.; Volceanov, A.; Muley, P.; Boldor, D. A review of catalysts used in microwave assisted pyrolysis and gasification. Bioresour. Technol. 2019, 277, 179–194. [Google Scholar] [CrossRef] [PubMed]
  34. Zhang, Y.; Cui, Y.; Liu, S.; Fan, L.; Zhou, N.; Peng, P.; Wang, Y.; Guo, F.; Min, M.; Cheng, Y. Fast microwave-assisted pyrolysis of wastes for biofuels production–A review. Bioresour. Technol. 2020, 297, 122480. [Google Scholar] [CrossRef] [PubMed]
  35. Qiu, T.; Liu, C.; Cui, L.; Liu, H.; Muhammad, K.; Zhang, Y. Comparison of corn straw biochars from electrical pyrolysis and microwave pyrolysis. Energy Sources Part A Recovery Util. Environ. Eff. 2023, 45, 636–649. [Google Scholar] [CrossRef]
  36. Sardi, B.; Uno, I.; Pasila, F.; Altway, A.; Mahfud, M. Low rank coal for fuel production via microwave-assisted pyrolysis: A review. FirePhysChem 2023, in press. [Google Scholar] [CrossRef]
  37. Zhang, Y.; Fan, S.; Liu, T.; Xiong, Q. A review of aviation oil production from organic wastes through thermochemical technologies. Appl. Energy Combust. Sci. 2022, 9, 100058. [Google Scholar] [CrossRef]
  38. Ke, C.; Liu, T.; Zhang, Y.; Xiong, Q. Energy absorption performances of silicon carbide particles during microwave heating process. Chem. Eng. Process.-Process Intensif. 2022, 172, 108796. [Google Scholar] [CrossRef]
  39. Yin, C. Microwave-assisted pyrolysis of biomass for liquid biofuels production. Bioresour. Technol. 2012, 120, 273–284. [Google Scholar] [CrossRef]
  40. Arpia, A.A.; Chen, W.-H.; Lam, S.S.; Rousset, P.; de Luna, M.D.G. Sustainable biofuel and bioenergy production from biomass waste residues using microwave-assisted heating: A comprehensive review. Chem. Eng. J. 2021, 403, 126233. [Google Scholar] [CrossRef]
  41. Ellison, C.; Abdelsayed, V.; Smith, M.; Shekhawat, D. Comparative evaluation of microwave and conventional gasification of different coal types: Experimental reaction studies. Fuel 2022, 321, 124055. [Google Scholar] [CrossRef]
  42. Fan, S.; Zhang, Y.; Cui, L.; Xiong, Q.; Maqsood, T. Conversion of Polystyrene Plastic into Aviation Fuel through Microwave-Assisted Pyrolysis as Affected by Iron-Based Microwave Absorbents. ACS Sustain. Chem. Eng. 2023, 11, 1054–1066. [Google Scholar] [CrossRef]
  43. Zhang, Y.; Fan, S.; Liu, T.; Fu, W.; Li, B. A review of biochar prepared by microwave-assisted pyrolysis of organic wastes. Sustain. Energy Technol. Assess. 2022, 50, 101873. [Google Scholar] [CrossRef]
  44. Wei, D.; Chen, C.; Huang, X.; Zhao, J.; Fan, D.; Zeng, T.; Bi, Y. Products and pathway analysis of rice straw and chlorella vulgaris by microwave-assisted co-pyrolysis. J. Energy Inst. 2023, 107, 101182. [Google Scholar] [CrossRef]
  45. Zhang, Y.; Zhang, J.; Chen, F.; Ma, H.; Chen, D. Influence of biochar with loaded metal salts on the cracking of pyrolysis volatiles from corn straw. Energy Sources Part A Recovery Util. Environ. Eff. 2020, 1–10. [Google Scholar] [CrossRef]
  46. Qu, J.; Sun, Y.; Awasthi, M.K.; Liu, Y.; Xu, X.; Meng, X.; Zhang, H. Effect of different aerobic hydrolysis time on the anaerobic digestion characteristics and energy consumption analysis. Bioresour. Technol. 2021, 320, 124332. [Google Scholar] [CrossRef]
  47. Zhang, Y.; Wang, J.; Bian, X.; Huang, X.; Qi, L. A continuous gas leakage localization method based on an improved beamforming algorithm. Measurement 2017, 106, 143–151. [Google Scholar] [CrossRef]
  48. Sun, Y.; Zhang, Z.; Sun, Y.; Yang, G. One-pot pyrolysis route to Fe−N-Doped carbon nanosheets with outstanding electrochemical performance as cathode materials for microbial fuel cell. Int. J. Agric. Biol. Eng. 2020, 13, 207–214. [Google Scholar] [CrossRef]
  49. Ren, X.; Shanb Ghazani, M.; Zhu, H.; Ao, W.; Zhang, H.; Moreside, E.; Zhu, J.; Yang, P.; Zhong, N.; Bi, X. Challenges and opportunities in microwave-assisted catalytic pyrolysis of biomass: A review. Appl. Energy 2022, 315, 118970. [Google Scholar] [CrossRef]
  50. Mushtaq, F.; Abdullah, T.A.T.; Mat, R.; Ani, F.N. Optimization and characterization of bio-oil produced by microwave assisted pyrolysis of oil palm shell waste biomass with microwave absorber. Bioresour. Technol. 2015, 190, 442–450. [Google Scholar] [CrossRef]
  51. Shi, K.; Yan, J.; Luo, X.; Lester, E.; Wu, T. Microwave-assisted pyrolysis of bamboo coupled with reforming by activated carbon for the production of hydrogen-rich syngas. Energy Procedia 2017, 142, 1640–1646. [Google Scholar] [CrossRef]
  52. Russell, A.D.; Antreou, E.I.; Lam, S.S.; Ludlow-Palafox, C.; Chase, H.A. Microwave-assisted pyrolysis of HDPE using an activated carbon bed. RSC Adv. 2012, 2, 6756–6760. [Google Scholar] [CrossRef]
  53. Chen, C.; Fan, D.; Zhao, J.; Qi, Q.; Huang, X.; Zeng, T.; Bi, Y. Study on microwave-assisted co-pyrolysis and bio-oil of Chlorella vulgaris with high-density polyethylene under activated carbon. Energy 2022, 247, 123508. [Google Scholar] [CrossRef]
  54. Fu, W.; Dai, J.; Zhang, Y.; Guang, M.; Liu, Y.; Li, B. Heating performances of high density polyethylene (HDPE) plastic particles in a microwave chamber. Sustain. Energy Technol. Assess. 2021, 48, 101581. [Google Scholar] [CrossRef]
  55. Hong, K.; Fu, W.; Guang, M.; Zhang, Y.; Li, B. Microwave heating performances of low density polyethylene (LDPE) plastic particles. J. Anal. Appl. Pyrolysis 2021, 160, 105356. [Google Scholar] [CrossRef]
  56. Zhang, Y.; Chen, P.; Liu, S.; Fan, L.; Zhou, N.; Min, M.; Cheng, Y.; Peng, P.; Anderson, E.; Wang, Y.; et al. Microwave-Assisted Pyrolysis of Biomass for Bio-Oil Production. In Pyrolysis; Mohamed, S., Ed.; IntechOpen: Rijeka, Croatia, 2017. [Google Scholar]
Figure 1. Picture of activated carbon.
Carbon 09 00048 g001
Figure 2. Microwave assisted heating system. (1) microwave chamber; (2) connection pip; (3) K-type thermocouple; (4) temperature indicator; (5) vacuum pump; (6) electric power detector. (a) Systematic diagram; (b) Quartz chamber.
Carbon 09 00048 g002
Figure 3. Flow chart of experimental procedures.
Carbon 09 00048 g003
Figure 4. Heating performances of AC at different microwave powers.
Carbon 09 00048 g004
Figure 5. Regressive and experimental temperatures at different microwave powers.
Carbon 09 00048 g005
Figure 6. Heating performances of AC at different feeding loads.
Carbon 09 00048 g006
Figure 7. Regressive and experimental temperatures at different feeding loads.
Carbon 09 00048 g007
Figure 8. Heating performances of AC at different reactor volumes.
Carbon 09 00048 g008
Figure 9. Regressive and experimental temperatures at different reactor volumes.
Carbon 09 00048 g009
Table 1. Factors for the heating of activated carbon.
FactorUnitValue
Microwave powerW400, 450, 500, 550, 600
Feeding loadg5, 10, 15, 20, 25
Reactor volumemL50, 100, 150, 200, 250
Table 2. The heating rates and R2 of temperature fitting at different microwave powers.
Microwave Power (W)Heating Rate (°C/s)Fitting R2 (%)
4002.097.3
4502.297.2
5002.896.3
5503.097.3
6005.994.8
Table 3. The heating rates and R2 of temperature fitting at different feeding loads.
Feeding Load (g)Heating Rate (°C/s)Fitting R2 (%)
54.299.1
102.896.3
153.198.9
203.5098.2
253.5599.1
Table 4. The heating rates and R2 of temperature fitting at different reactor volumes.
Reactor Volume (mL)Heating Rate (°C/s)Fitting R2 (%)
507.698.9
1003.396.9
1502.896.3
2002.698.7
2501.297.5
Disclaimer/Publisher’s Note: The statements, opinions and data contained in all publications are solely those of the individual author(s) and contributor(s) and not of MDPI and/or the editor(s). MDPI and/or the editor(s) disclaim responsibility for any injury to people or property resulting from any ideas, methods, instructions or products referred to in the content.

