Article

Production, Characterization, and Activation of Biochars from a Mixture of Waste Insulation Electric Cables (WIEC) and Waste Lignocellulosic Biomass (WLB)

1
VALORIZA—Research Center for Endogenous Resource Valorization, Polytechnic Institute of Portalegre, Campus Politécnico 10, 7300-555 Portalegre, Portugal
2
MEtRICs, Chemistry Department, NOVA School of Science and Technology (FCT NOVA), Universidade NOVA de Lisboa, Campus Caparica, 2829-516 Caparica, Portugal
3
Associated Laboratory of Guaratinguetá, Institute of Bioenergy Research, IPBEN-UNESP, São Paulo State University, São Paulo 12516-410, Brazil
*
Author to whom correspondence should be addressed.
Submission received: 15 February 2023 / Revised: 18 April 2023 / Accepted: 6 May 2023 / Published: 9 May 2023
(This article belongs to the Special Issue Biomass—a Renewable Resource for Carbon Materials (2nd Edition))

Abstract

:
Waste insulation electrical cables (WIEC) currently do not have an added value, due to their physical–chemical characteristics. Carbonization is known to enhance feedstock properties, particularly fuel and material properties; as such, this article aimed to study the production and activation of biochars using WIEC and lignocellulosic biomass wastes as feedstock. Biochars were produced in a ceramic kiln with an average capacity of 15 kg at different temperatures, namely 300, 350 and 400 °C. After production, the biochars were further submitted to a washing process with water heated to 95 °C ± 5 °C and to an activation process with 2 N KOH. All biochars (after production, washing and activation) were characterized regarding an elemental analysis, thermogravimetric analysis, heating value, chlorine removal, ash content, apparent density and surface area. The main results showed that the increase in carbonization temperature from 300 to 400 °C caused the produced biochars to present a lower amount of oxygen and volatile matter, increased heating value, greater chlorine removal and increased ash content. Furthermore, the activation process increased the surface area of biochars as the production temperature increased. Overall, the carbonization of WIEC mixed with lignocellulosic wastes showed potential in enhancing these waste physical and chemical properties, with prospects to yield added-value products that activates biochar.

1. Introduction

Nowadays, the problems related to humanity’s carbon footprint have become an important theme, and carbon neutrality has been pointed out as the only viable pathway to solve our current environmental issues. As such, it is necessary to research new materials that can be considered similar to fossil fuels but which are characterized by a reduced or zero contribution to the overall balance of carbon dioxide [1]. The search for alternative fuels with low emissions and renewable characteristics is crucial to mitigate environmental impacts and meet the increased global energy demand [2]. In this sense, wastes (e.g., biomass wastes, municipal solid wastes, mixed wastes and construction and demolition wastes) are presented as valuable and sustainable energy sources to generate clean energy instead of fossil fuels, presenting a fundamental role in sustainable development strategies [3,4,5].
There are significant amounts of plastic and mixed wastes that cannot be recycled and are not adequate for direct combustion or gasification due their heterogeneity and high chlorine contents. These wastes usually end up being landfilled instead of being recognized for their potential as energy sources. Wastes from electrical equipment (e-waste or WEEE, which includes waste insulation electric cables—WIEC) are the fastest-growing waste type and are becoming a major environmental problem, mainly for developing and emerging economies [6,7,8,9]. This increase is associated with the consumption of electrical equipment (EEE), which increases annually around 2.5 Mt, resulting from economic and technological development [10]. The amount of WEEE generated is increasing year by year, thus making it difficult for recycling to keep up with this growth [11]. In the last 5 years, the global amount of WEEE has increased by more than 9.0 Mt, producing an amount of 53.9 Mt in 2019, with Europe being the third-largest producer of these wastes with annual rates of 2% and estimating that less than 40% of these wastes are recycled [6]. In Portugal, in 2017, 43.5% of WEEEs were recycled. This increasing trend is clearly related to a higher consumption of electrical equipment associated with a short lifetime and limited repair options for the equipment [12,13].
Plastics assume different proportions in WEEEs, varying according to size and characteristics. The plastic component can serve as housing, casing, insulation, internal shelves or lining. The amount of plastic by weight represents a range between 3.5% and 45%, presenting a great challenge to the recycling of WEEE derived from the mixture of plastics that is used for each component and the plastic’s mechanical properties [14,15,16]. The characteristics of different types of plastics must be taken into account for WEEE management to provide a solid benchmark of environmental performance in recycling WEEE plastics [17].
Considering that wastes—in particular, biomass and mixed wastes—have very particular properties regarding their chemical characteristics, an understanding and comprehension of the various processes that integrate the energy recovery from them is essential. To enhance the process of converting wastes into products with value, a pretreatment is usually necessary. To further use these wastes in thermochemical conversion processes, adsorption processes, as an additive in construction materials or for agricultural applications, carbonization can be applied to deal with the inherent recalcitrance present in the components of these materials, being an alternative to homogenizing the material, increasing their energy density or even their porosity. Carbonization is a thermochemical process carried out at atmospheric pressure, temperatures between 300 and 500 °C in a nonoxidizing atmosphere, with slow heating rates [18,19,20,21]. This process has emerged as one of the approaches to treat biomass and wastes before submitting the feedstock to gasification processes, for example, to avoid the excessive production of tars and harmful compounds such as chlorine and yield better-quality syngas [22,23]. The main product of this thermal process is known as biochar. Currently, there is a great interest in biochar production due to the possibility of energy storage and possible use as anodes, filters and biofuels. The use of different reaction conditions and different feedstock allow the production of biochar with customized physical and chemical properties [24,25,26]. When the feedstock is a biomass, the lignin content has a positive effect on the biochar yield and its physical–chemical properties [27,28] The lignin content of a biomass also influences the particle size, porosity and aromatic carbon content of the biochar products [29].
The production of biochar brings many benefits to the environment, because it can be produced from a broad range of renewable sources and has low production costs and various applications [30]. Biochars can also be produced from biomass or mixed wastes, but conversion conditions must be optimized in order to maximize the energy efficiency and production yield, as these wastes are usually heterogeneous and their composition is variable, depending on the source and collection period [31].
This work aimed to produce biochar with waste insulation electric cables (WIEC) and waste lignocellulosic biomass (WLB) using the carbonization process. The main goal was to evaluate the characteristics of the produced biochars and assess their use in further thermochemical conversion processes (e.g., as feedstock for gasification) and their use as activated carbon precursors. Overall, applying carbonization can be one solution to achieve better properties for these wastes to find them added-value applications to decrease the large amounts that are currently being landfilled.

2. Materials and Methods
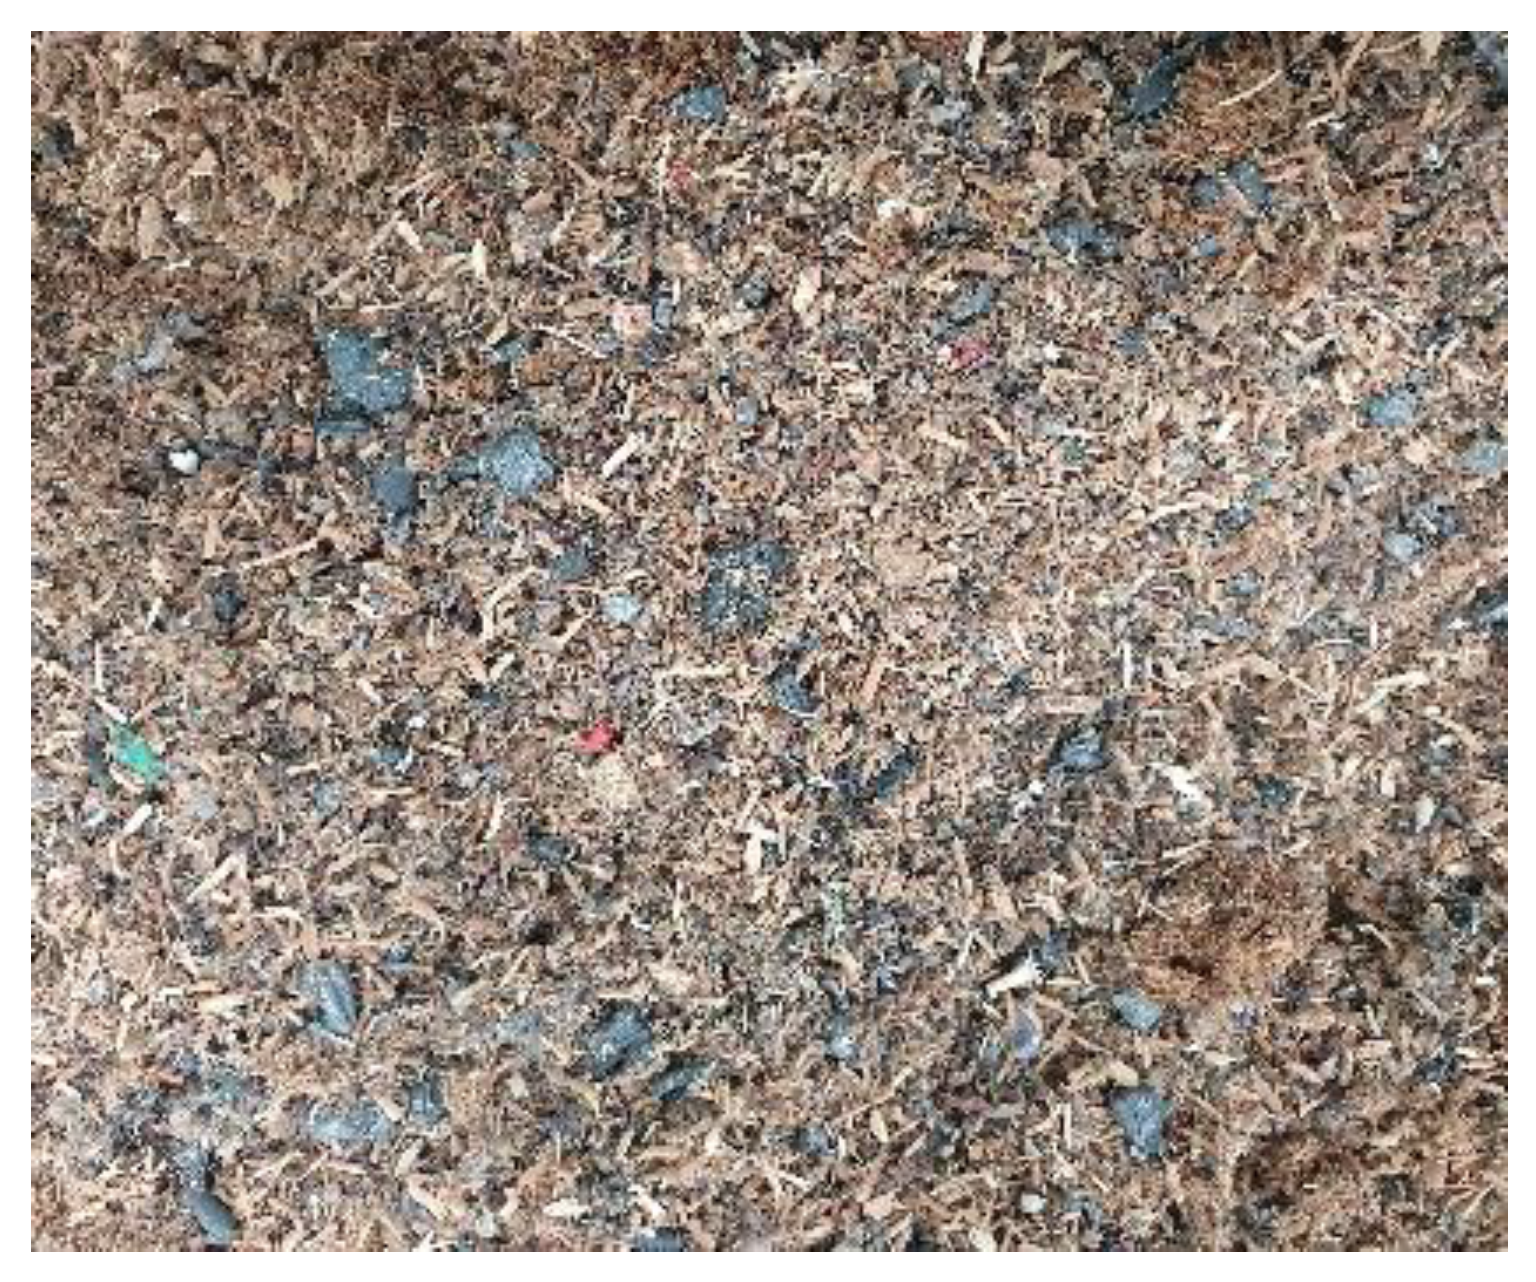
2.1. Feedstock

Lignocellulosic biomass wastes (WLB) were supplied by a biomass waste management company (CMC Biomassa) located in Portugal. This company collects lignocellulosic waste from deforestation, furniture and other wood wastes, which are later recycled into fractions that can be recovered as raw material and transformed into pellets, briquettes, flooring, new pallets, etc.
Waste insulation electric cables (WIEC) were supplied by a company dedicated to the management, recycling and recovery of waste, namely the recovery of noble metals (AFCarreto). This recovery from the pickling of electrical cables leads to the generation of a large amount of polymeric wastes, which are part of the coating of electrical cables corresponding to a mixture of polyvinyl chloride (PVC) and polyethylene (PE) and noble metals in small quantities.
Detailed characterizations of both WIEC and WLB can be found in [32]. For this work, a mixture with 50% WIEC and 50% WLB was prepared for the carbonization tests, as shown in Figure 1.

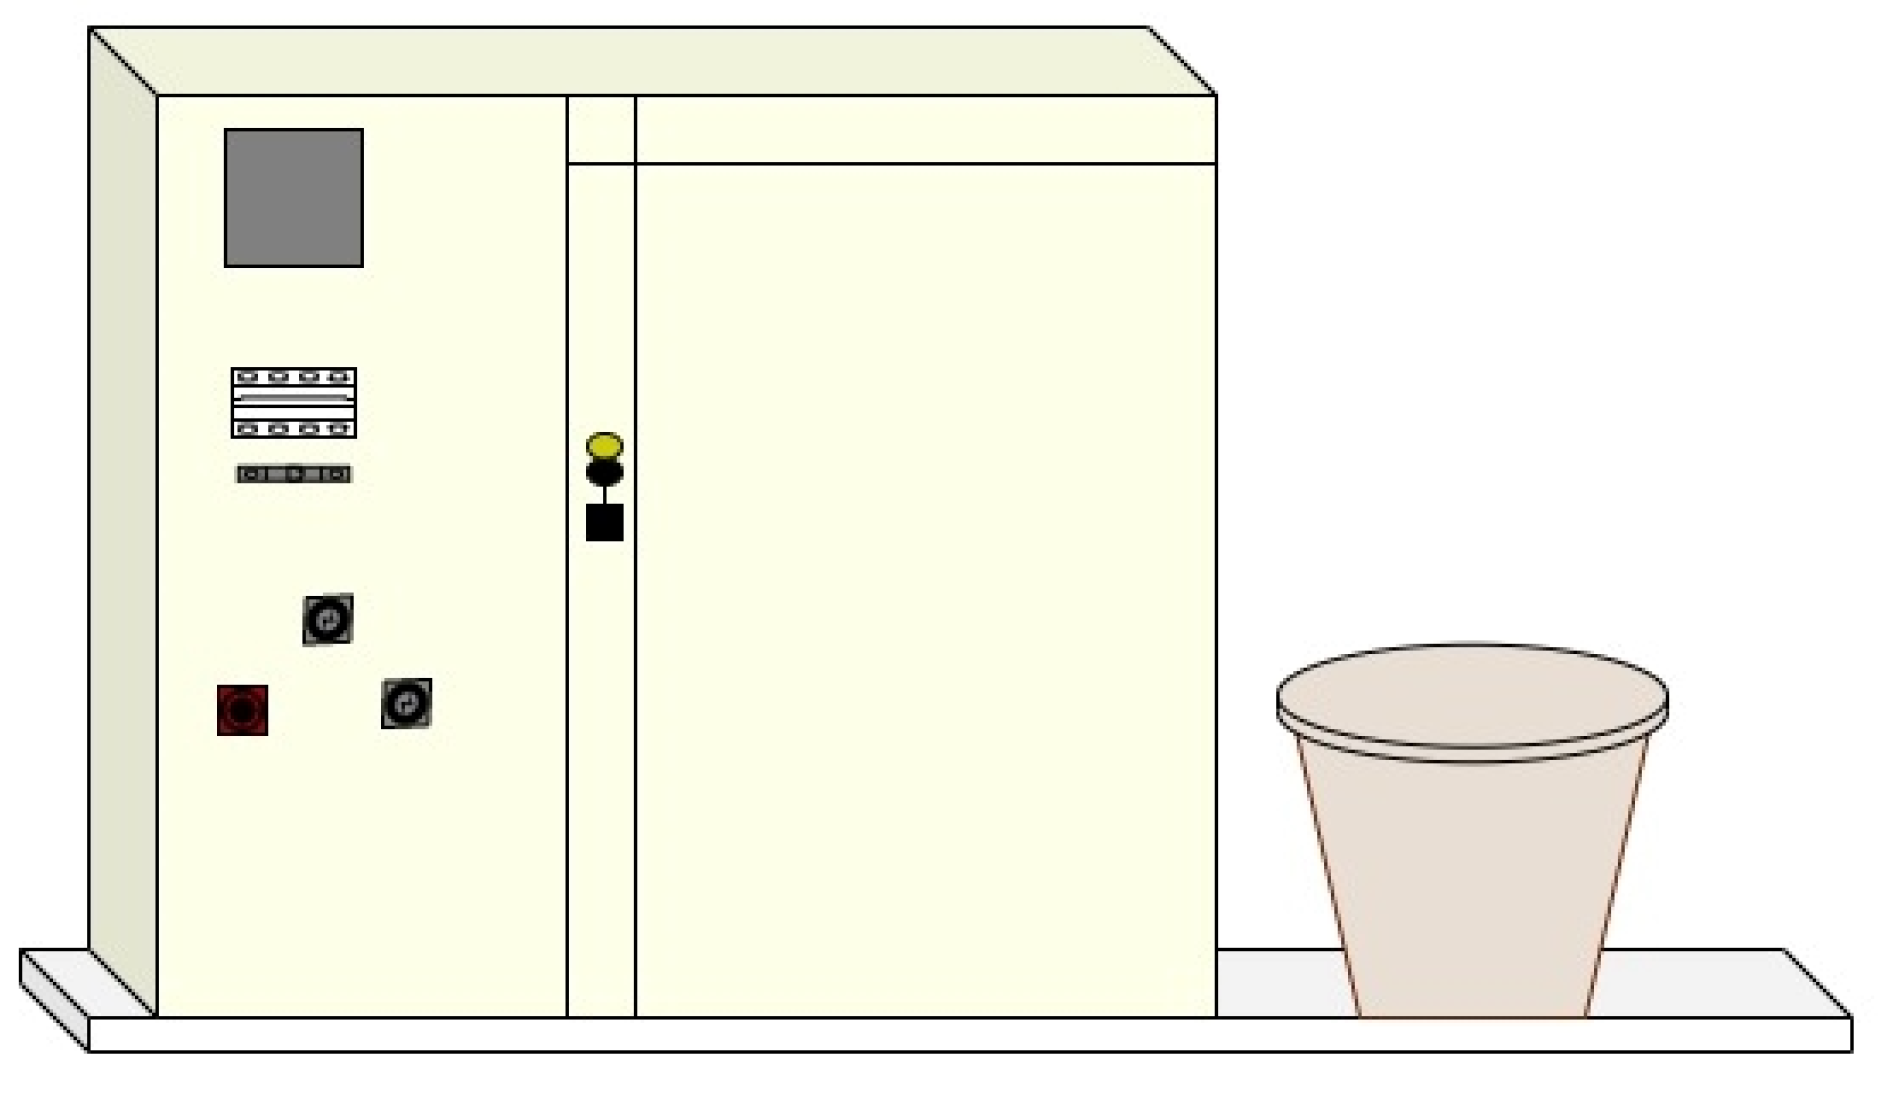
2.2. Carbonization Experiments

The carbonization experiments were based on the carbonization study carried out by [32], whose main objective was to optimize the carbonization process to obtain biochar with higher chemical and energy properties for energy recovery. Using the results of the best mixture, temperature and residence time, carbonization was carried out on a pilot scale. Briefly, an electric oven (KS 72L ceramic oven) with a capacity between 12 and 20 kg per test (depending on the properties of the raw material) was used. The oven had a temperature and heating rate control panel and capacity of 72 L in the carbonization zone. For biochar production, 15 kg of the mixture (50% WIEC + 50%WLB) was placed in capped clay vessels (to ensure a nonoxidizing atmosphere) that were heated at a heating rate of 10 °C/min until reaching the final carbonization temperatures (300, 350 and 400 °C) and remained in the oven for 2 h. A general schematic for the used oven can be seen in Figure 2.

2.3. Biochar Washing Process

The produced biochars were crushed and sieved, and the fraction lower than 425 μm was used. This fraction was washed in heated water for the removal of water-soluble compounds based on the works of [33,34]. The biochars were placed in glass containers under heating and stirring plates with a ratio of 100 g/200 mL of deionized water and heated to the temperature of 95 ± 5 °C, remaining after temperature stabilization for 30 min. The biochars were then allowed to cool to room temperature and filtered. Afterwards, the biochars were dried in an oven (Holelab Greenhouse) at 105 °C until reaching a constant mass, which took about 24 h [32,35].

2.4. Biochar Activation Process

The activation process involved mixing 2 g of biochar (already washed and dried as described above) with 500 mL of a KOH 2 N solution under agitation for 1 h. After this process, the biochar samples were left at rest for 30 min and filtered for recovery. After the filtration process, the biochars were washed in deionized water, and the resulting solution was neutralized with the addition of HCl 1 N. The biochar samples were then filtered again and dried in an oven at 105 °C for 12 h prior to the characterization analysis.

2.5. Biochar Characterization

Table 1 presents the conditions for obtaining the Table 1 different biochar samples according to the processes described in Section 2.2, Section 2.3 and Section 2.4.
To evaluate the efficiency of the carbonization process, the biochar yield (Equation (1)), energy yield (Equation (2)) and energy density (Equation (3)) were determined.
Biochar   Yield   ( wt .   % ) = M 1 M 0 × 100   %
where M1 is the final mass in g, and M0 is the initial mass in g.
Energy   Yield   ( wt .   % ) = M 1 × HHV 1 M 0 × HHV 0 × 100   %
where M1 is a final mass in g, M0 is the initial mass in g, HHV1 is the final higher heating value in MJ/kg and HHV0 corresponds to the initial higher heating value in MJ/kg.
Energy   Density   ( % ) = Energy   Yield Char   Yield   × 100   %

2.5.1. Elemental Analysis

The elements of interest included carbon (C), hydrogen (H), nitrogen (N), sulfur (S) and oxygen (O). The amounts of C, H, N, S and O were determined using a Thermo Fisher Scientific Flash 2000 CHNS-O analyzer. Oxygen was determined by the difference in a dry base.

2.5.2. Thermogravimetric Analysis

A thermogravimetric analysis (TGA) was used to determine the moisture content, volatile matter and fixed carbon combined with ash. The tests were performed in triplicate with sample weights between 3 and 4 mg. A PerkinElmer thermogravimetric analyzer, STA 6000, using a heating rate of 20 °C/min was used. The content of each proximate analysis parameter was taken from the thermogravimetric profiles (sample mass variation versus temperature), considering the inflection points of the mass derivative on the function of time.

2.5.3. High Heating Value and Low Heating Value

For the high heating value (HHV) of the biochar samples, IKA C2000 calorimetry equipment was used, which performed the complete combustion of the samples in an adiabatic environment. For this measurement, a sample with 0.5 ± 0.1 g of each sample was placed in the calorimeter, and its total combustion was carried out. The measurements for each biochar sample were performed in triplicate, and the presented values represent the average values. The lower heating value (LHV) was determined using Equation (4) as follows:
LHV = HHV 2.26 × 9 H 100
where LHV is a lower heating value in MJ/kg, HHV is a higher heating value in MJ/kg and H is hydrogen.

2.5.4. Chlorine Content and Mineral Composition

The chlorine content of the produced biochars was determined through X-ray fluorescence (Niton XL 3T Gold++).
The biochars’ complete mineral composition (Al, B, Ba, Ca, Cr, Fe, K, Mg, Na, Ni and Zn) was determined through ICP-AES (Inductively Couple Plasma—Atomic Emission Spectrometer, Horiba Jobin-Yvon, Ultima), after ashing and acid digestion of the biochar samples. All the measurements were carried out in triplicate, and the results shown are the average values.

2.5.5. Ash Content

For the determination of the ash content, biochar samples were placed in porcelain crucibles in a muffle furnace at 500 °C ± 5 °C until the total burning of the organic matter. The ash content was calculated using Equation (5):
m ashes = m f   m crucible m sample
where mashes is the mass of the ashes in g, mf final mass in g, mcrucible is the mass of the calcinated empty crucible in g and msample is the mass of the initial sample in g.

2.5.6. Apparent Density

The determination of the apparent density is the relationship between the mass of a sample and its occupied volume. This determination was performed with a beaker and expressed in g/cm3, according to Equation (6).
D = M V
where M corresponds to the mass in g and V to the volume in cm3.

2.5.7. Fourier-Transform Infrared

Fourier-transform infrared spectra (FTIR) were obtained as an average of 128 scans at a resolution of 4 cm−1 using an ATR-FTIR spectrometer (Thermo Scientific Nicolet iS10), with a range of 4000 to 400 cm−1. The biochar samples were powdered and placed in the ATR diamond crystal and compacted using a vertical screw to the plane to perform the analysis.

2.5.8. Nitrogen Adsorption at 77 K

Nitrogen adsorption at 77 K was used to measure the specific area of the samples. For biochar samples, Micromeritics ASAP 202 Plus equipped with sensors and a vacuum system was used. The vacuum is controlled by a high vacuum pump with a 1 mmHg transducer. This equilibrium has two independent vacuum systems, which allows the preparation of two samples and the analysis of a third simultaneously.

3. Results and Discussion

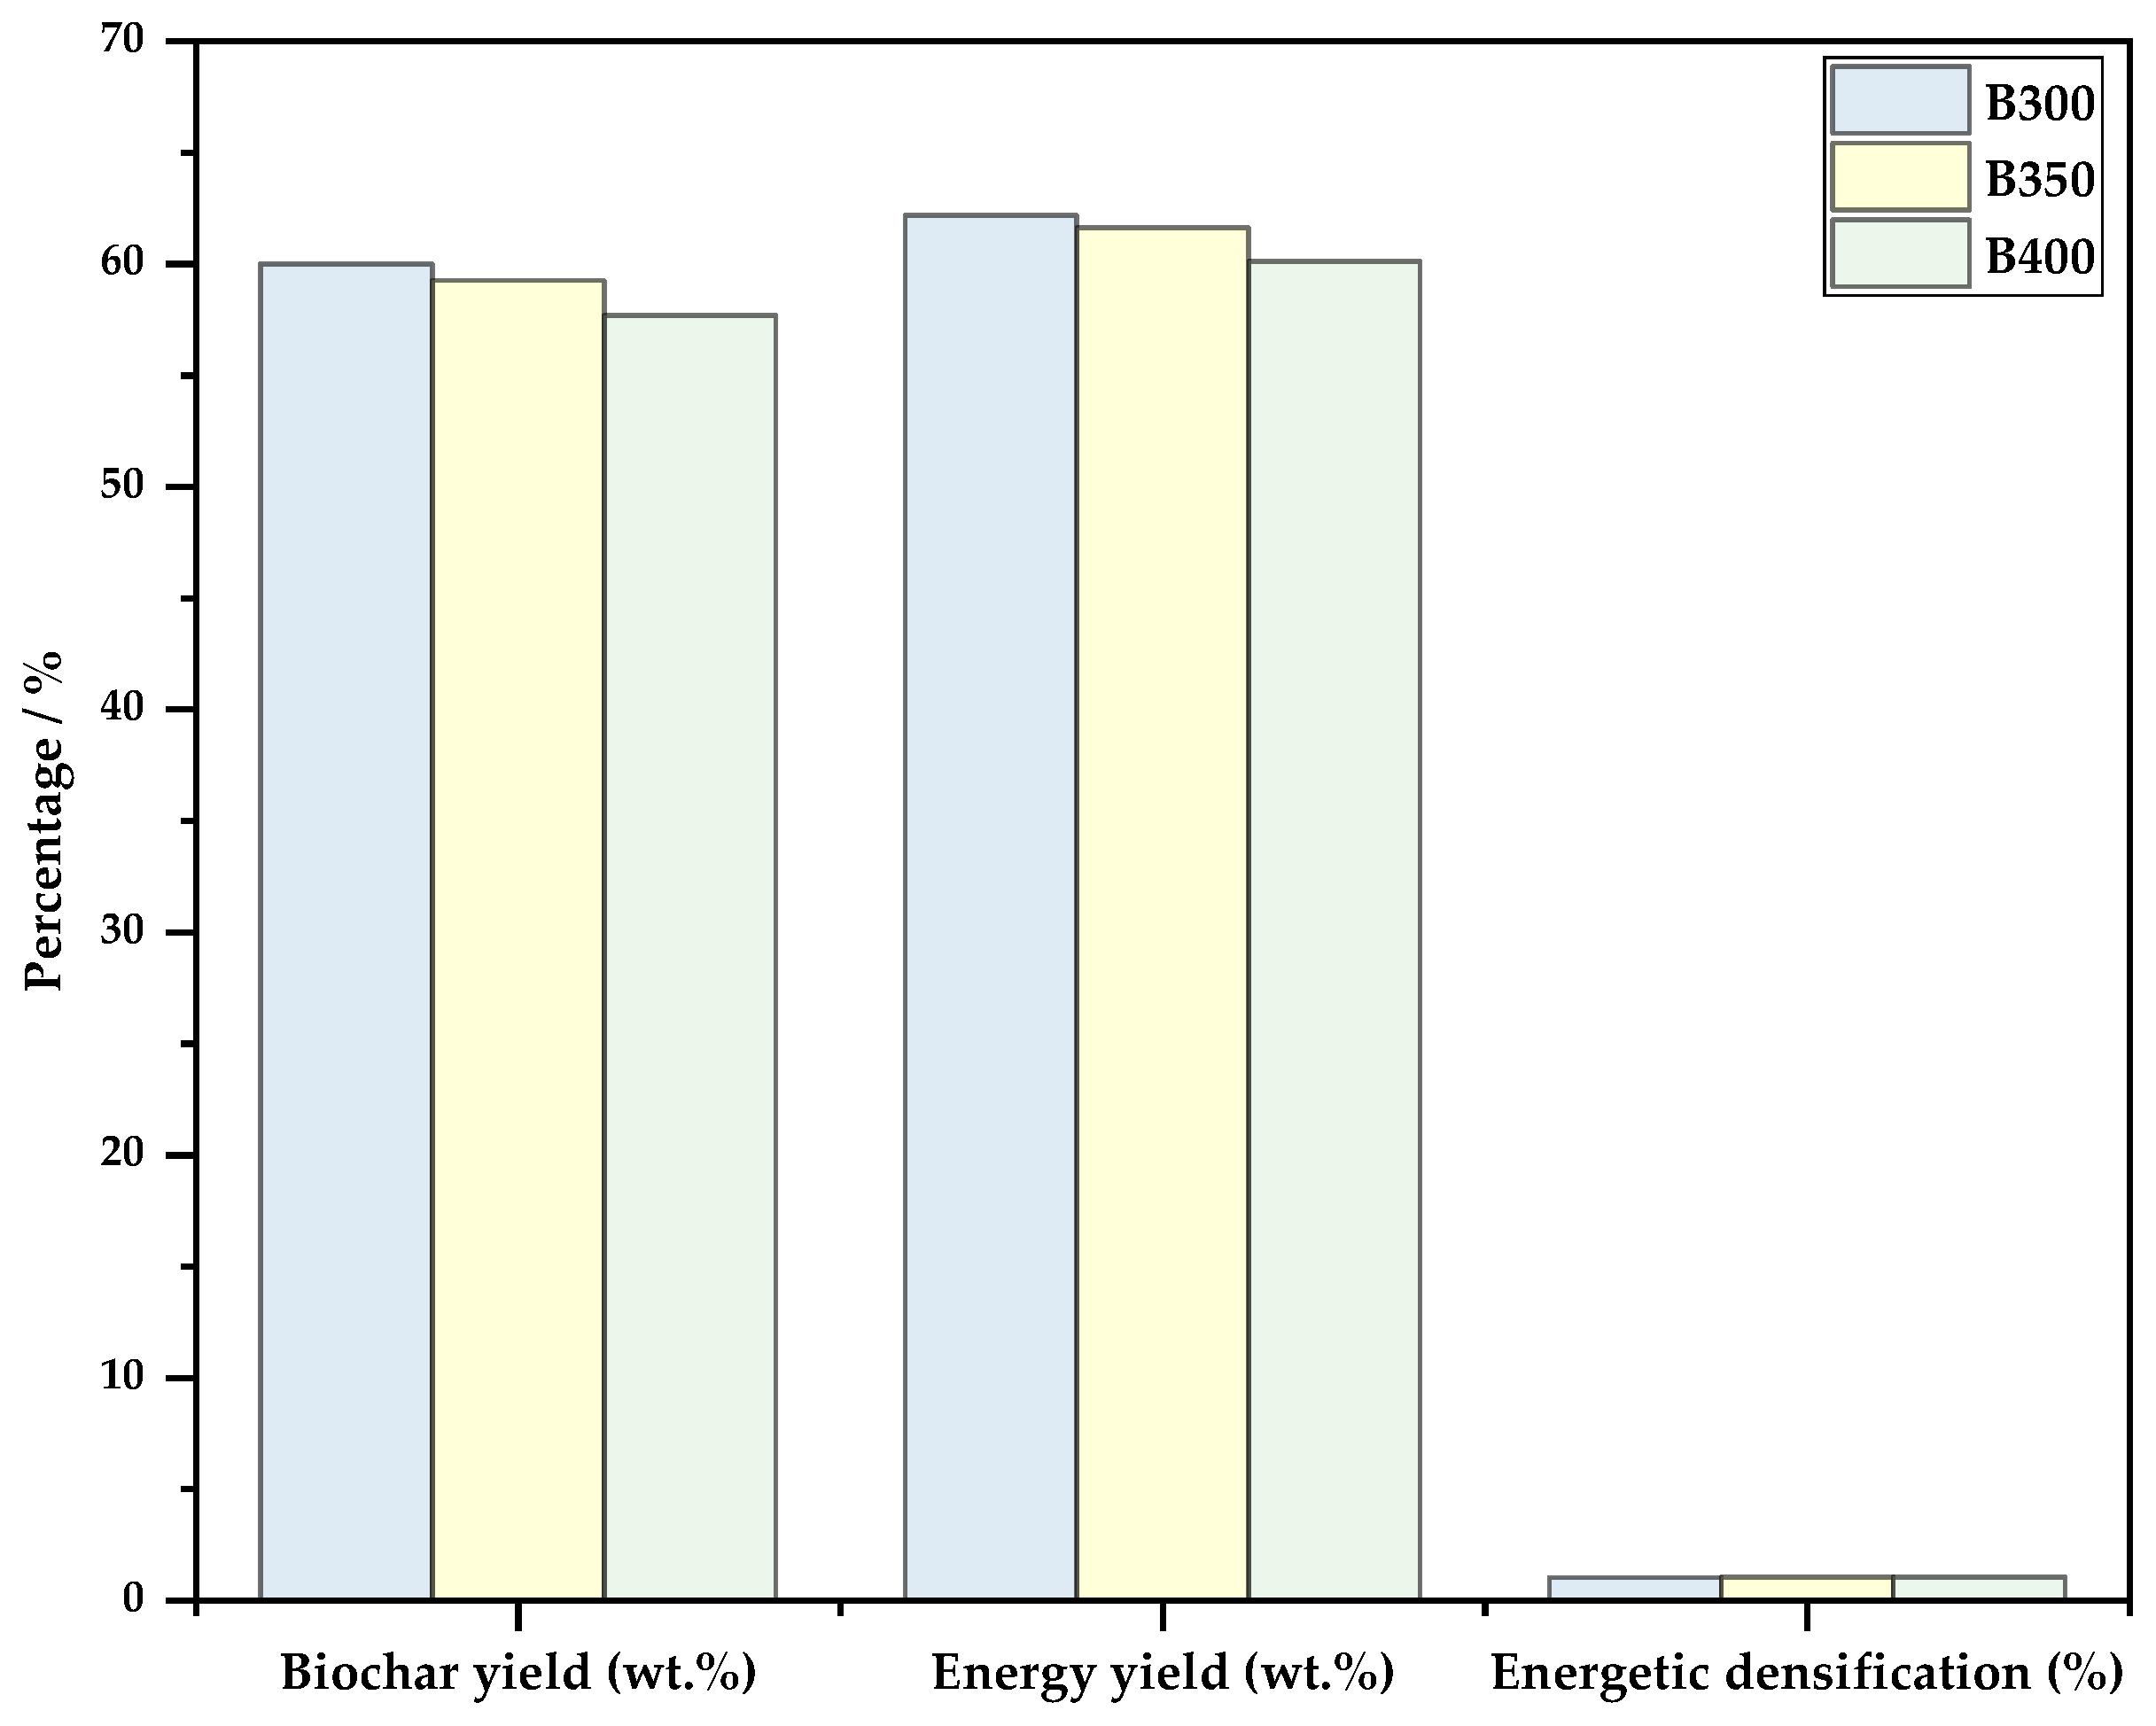
3.1. Biochar Yield, Enery Yield and Energetic Densification

The production of biochar can be affected by several factors: the characteristics of the materials used, the method, formation of byproducts, application, economic aspects and environmental impact. The chemical composition, particle size, pH value, moisture level, calorific value and volatility are important characteristics of materials that must be considered as they directly affect the biochar results [36]. The results obtained for the biochar samples (without washing or activation) regarding the biochar yield, energy yield and energy density are shown in Figure 3.
Temperature is one of the main factors that affect the biochar structure and physicochemical properties, as it affects the decomposition, formation and transformation of the biomass and wastes [37]. With higher temperatures, there is a favoring of free radical reactions such as decarboxylation, decarbonylation, dehydration, aromatization and intermolecular rearrangement, among others [27]. From the obtained results, it was possible to observe that, for the three biochar production conditions, the biochar yield was between 58 and 63%. Sample B300 consistently presented higher values for the parameters depicted in Figure 3, indicating that higher temperatures promote sample decomposition via the above-described reactions, entailing lower mass and energy yields. On the other hand, energy densification was similar for the three studies, and considering the type of wastes used as feedstock, higher temperature were most likely needed to reach a higher densification factor.

3.2. Biochar Characterization

3.2.1. Elemental Analysis and Heating Value

After the biochar production process at temperatures of 300, 350 and 400 °C, part of the biochar was washed, and another part was washed and activated. Table 2 presents the results for the elemental analysis, HHV and LHV of the produced biochars.
The main elements that are present in the WIEC/WLB mixture are C (52.3%) and O (42.7%). Concerning the produced biochars without treatment (B300, B350 and B400) and washed biochars (B300-L, B350-L and B400-L), it is possible to observe that the amount of C is not very variable, 42.85% ± 4%, but the amount of O was reduced by an average of 30% for the washed biochars. On the other hand, the amount of ash for the mixture was 3%, and after carbonization, the ash content increased to an average of 37% (results shown below. With the increase in the amount of ash in biochar, there is a reduction in the calorific value of the material by an average of 2 MJ/kg.
Activated carbons are very similar to other biochar samples, differing only in the amount of oxygen, which is 10% higher than other biochars. The activation process is carried out to produce a biochar that can be used for other methods, such as being used as an adsorbent for gas or liquid effluents.
The carbonization process promotes dehydration, thus promoting the elimination of H, resulting in an accumulation of C in the biochar. The content and proportions of these elements are the most important factors influencing the stability or carbon sequestration capacity of biochar. The lability of biochar is directly related to the oxygen content and indirectly to the C content present in the biochar [38]. The O/C and H/C ratios are indicative of biochar structures and provide an intrinsic measure of biochar stability. These relationships are negatively correlated with the percentage of aromatic C in the biochar [39]. Figure 4 shows the van Krevelen diagram for the obtained biochars.
The oxygen content plays an important role in the chemical behavior of the biochar surface; this factor is associated with a close relationship with the number and composition of substituted functional groups, and these functional groups constitute an important driver for the degradation potential. The H/C molar ratio can be used to evaluate the thermochemical alterations that produce fused aromatic ring structures in the material. A lower amount of H/C means that higher fused aromatic ring structures provide greater stability. The H/C ratio is considered an index of aromaticity and resistance of char to microbial and chemical degradation. As biochar is mainly composed of some aromatic compounds, the amount of C present is an important factor in determining the stability of biochar. According to Spokas [40], Budai et al. [41] and the European Biochar Certificate (EBC), the O/C and H/C molar ratios are indicators of biochar stability. Moreover, the upper limit for the O/C ratio is 0.4, and for the H/C ratio, the established limit is 0.7 [31].
Based on Figure 4, it is possible to observe that all the biochar samples that were washed have a stability below 0.2, and sample B400-A biochar is also considered stable for this parameter. Regarding the H/C ratio, it is possible to observe that the biochars are relatively similar, with little variation [42]. Using the two parameters to define the most stable biochar, it is possible to verify that B300-L and B400-A are the most stable.

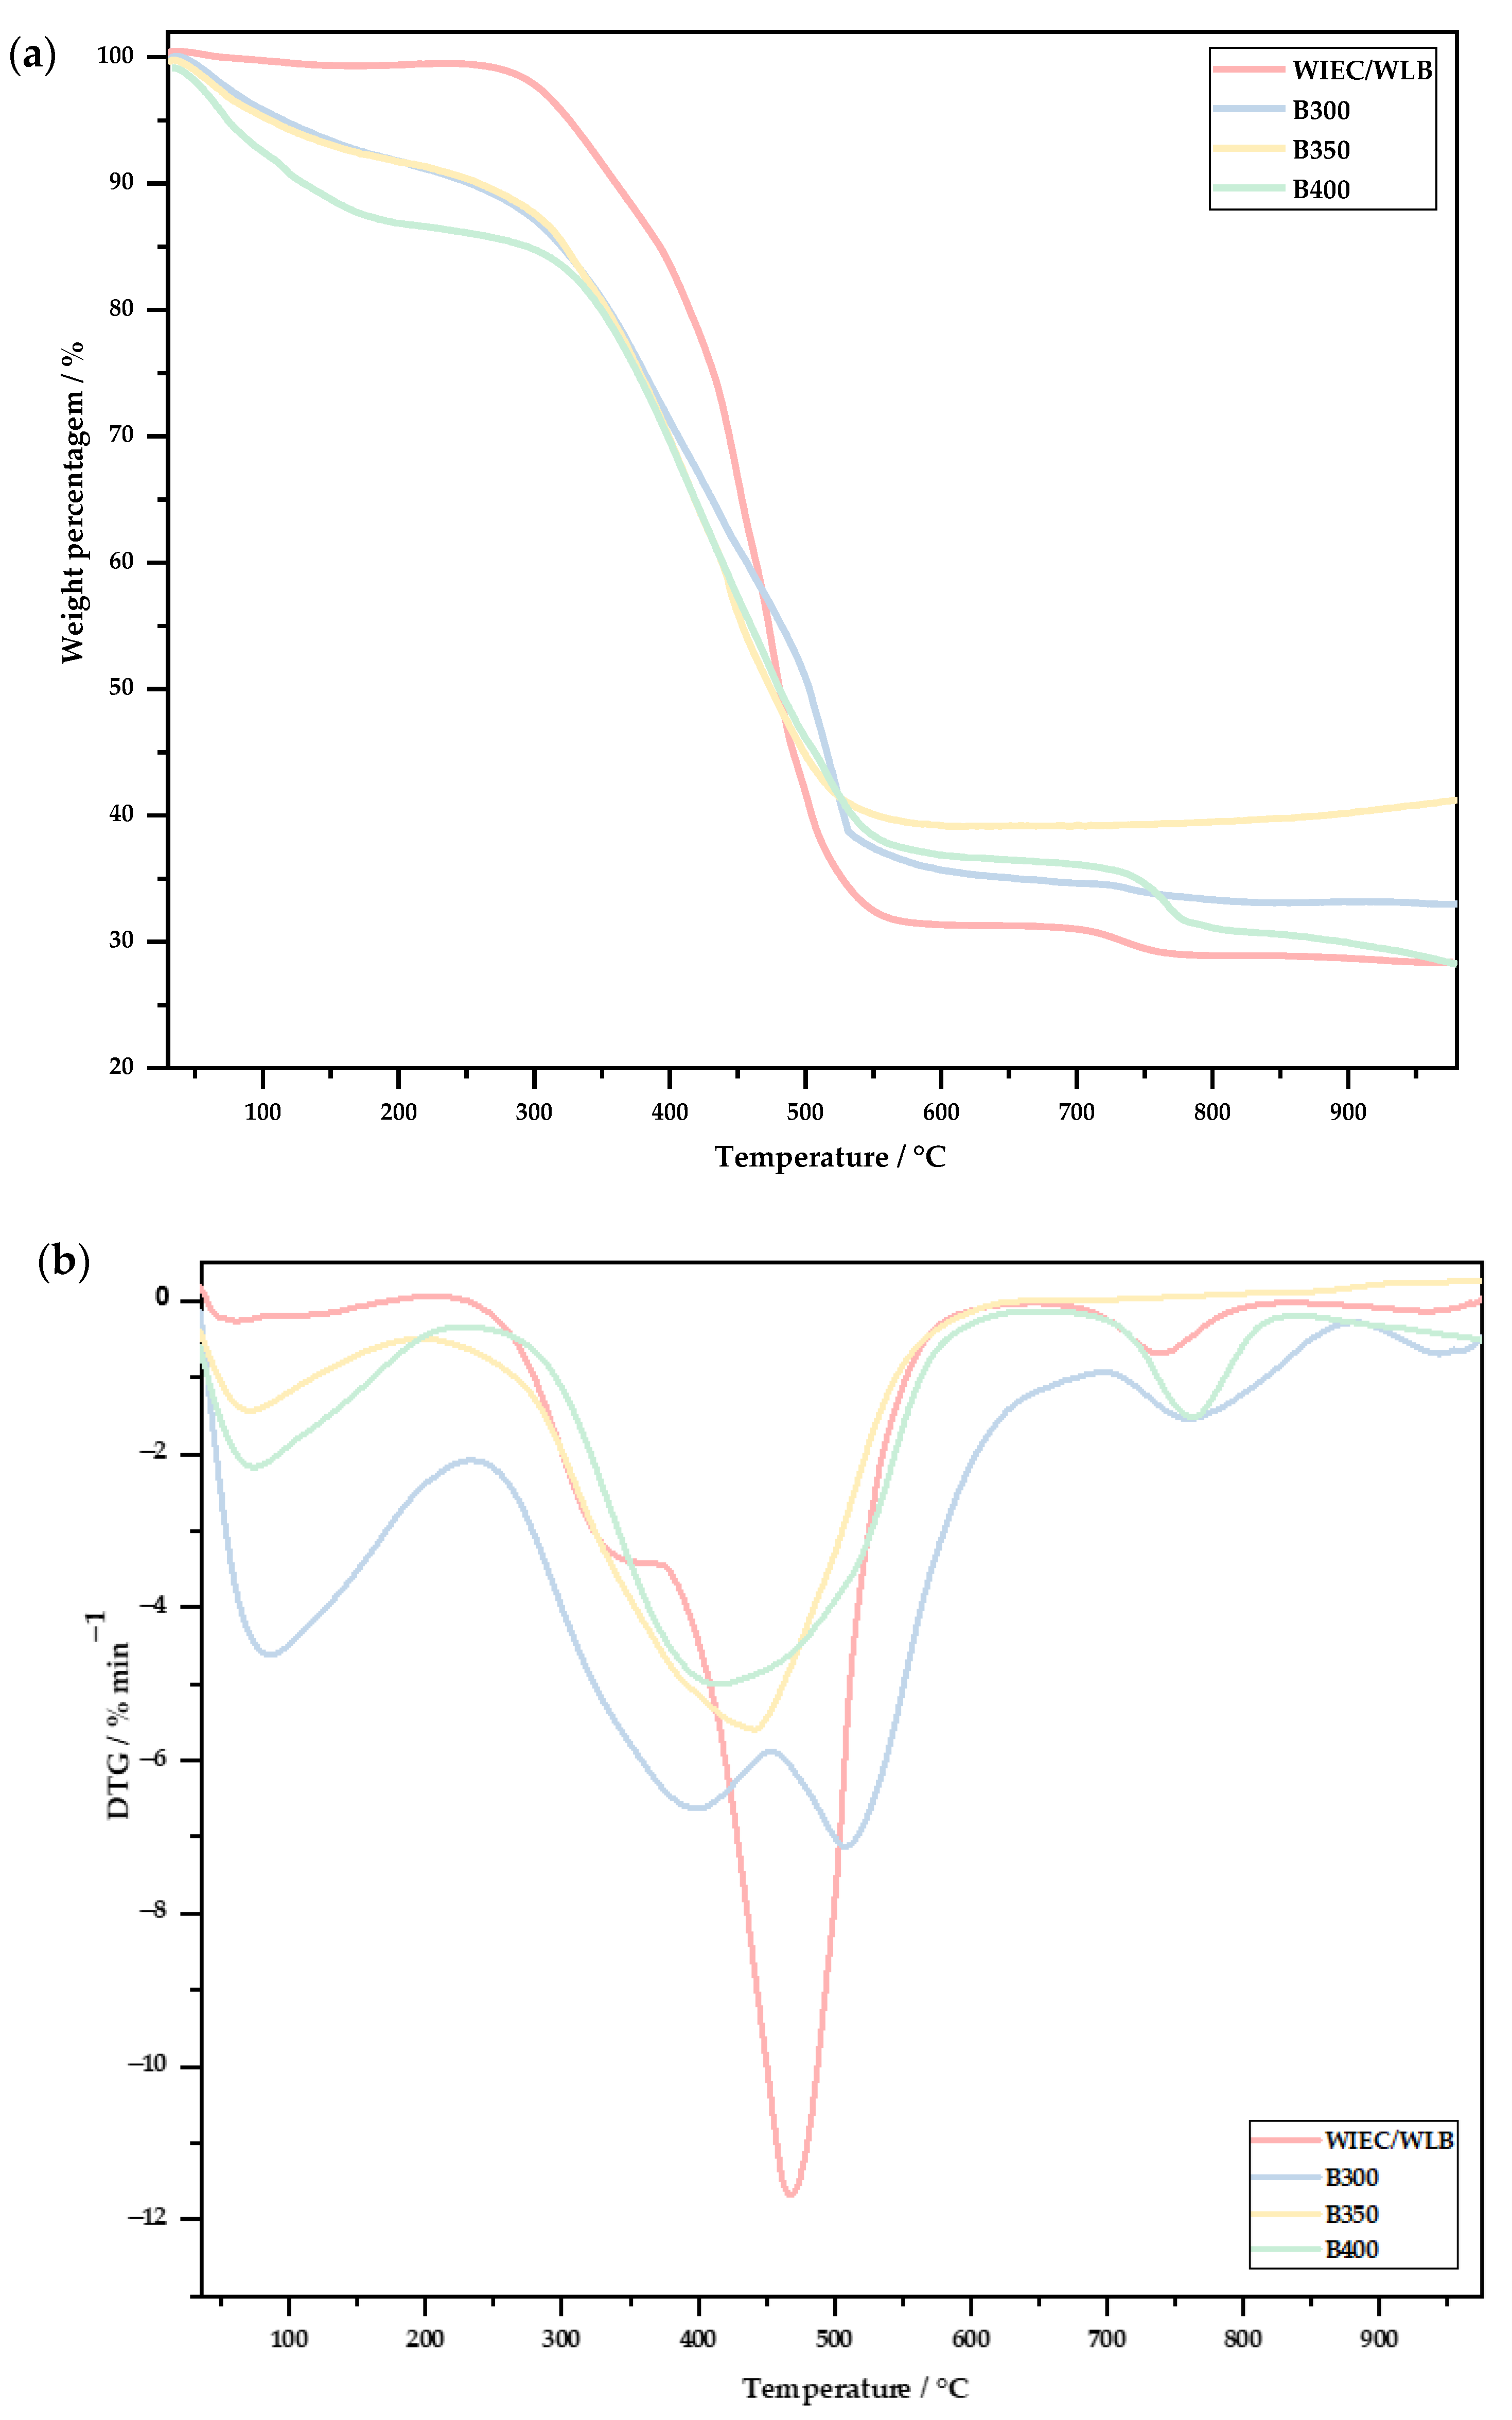
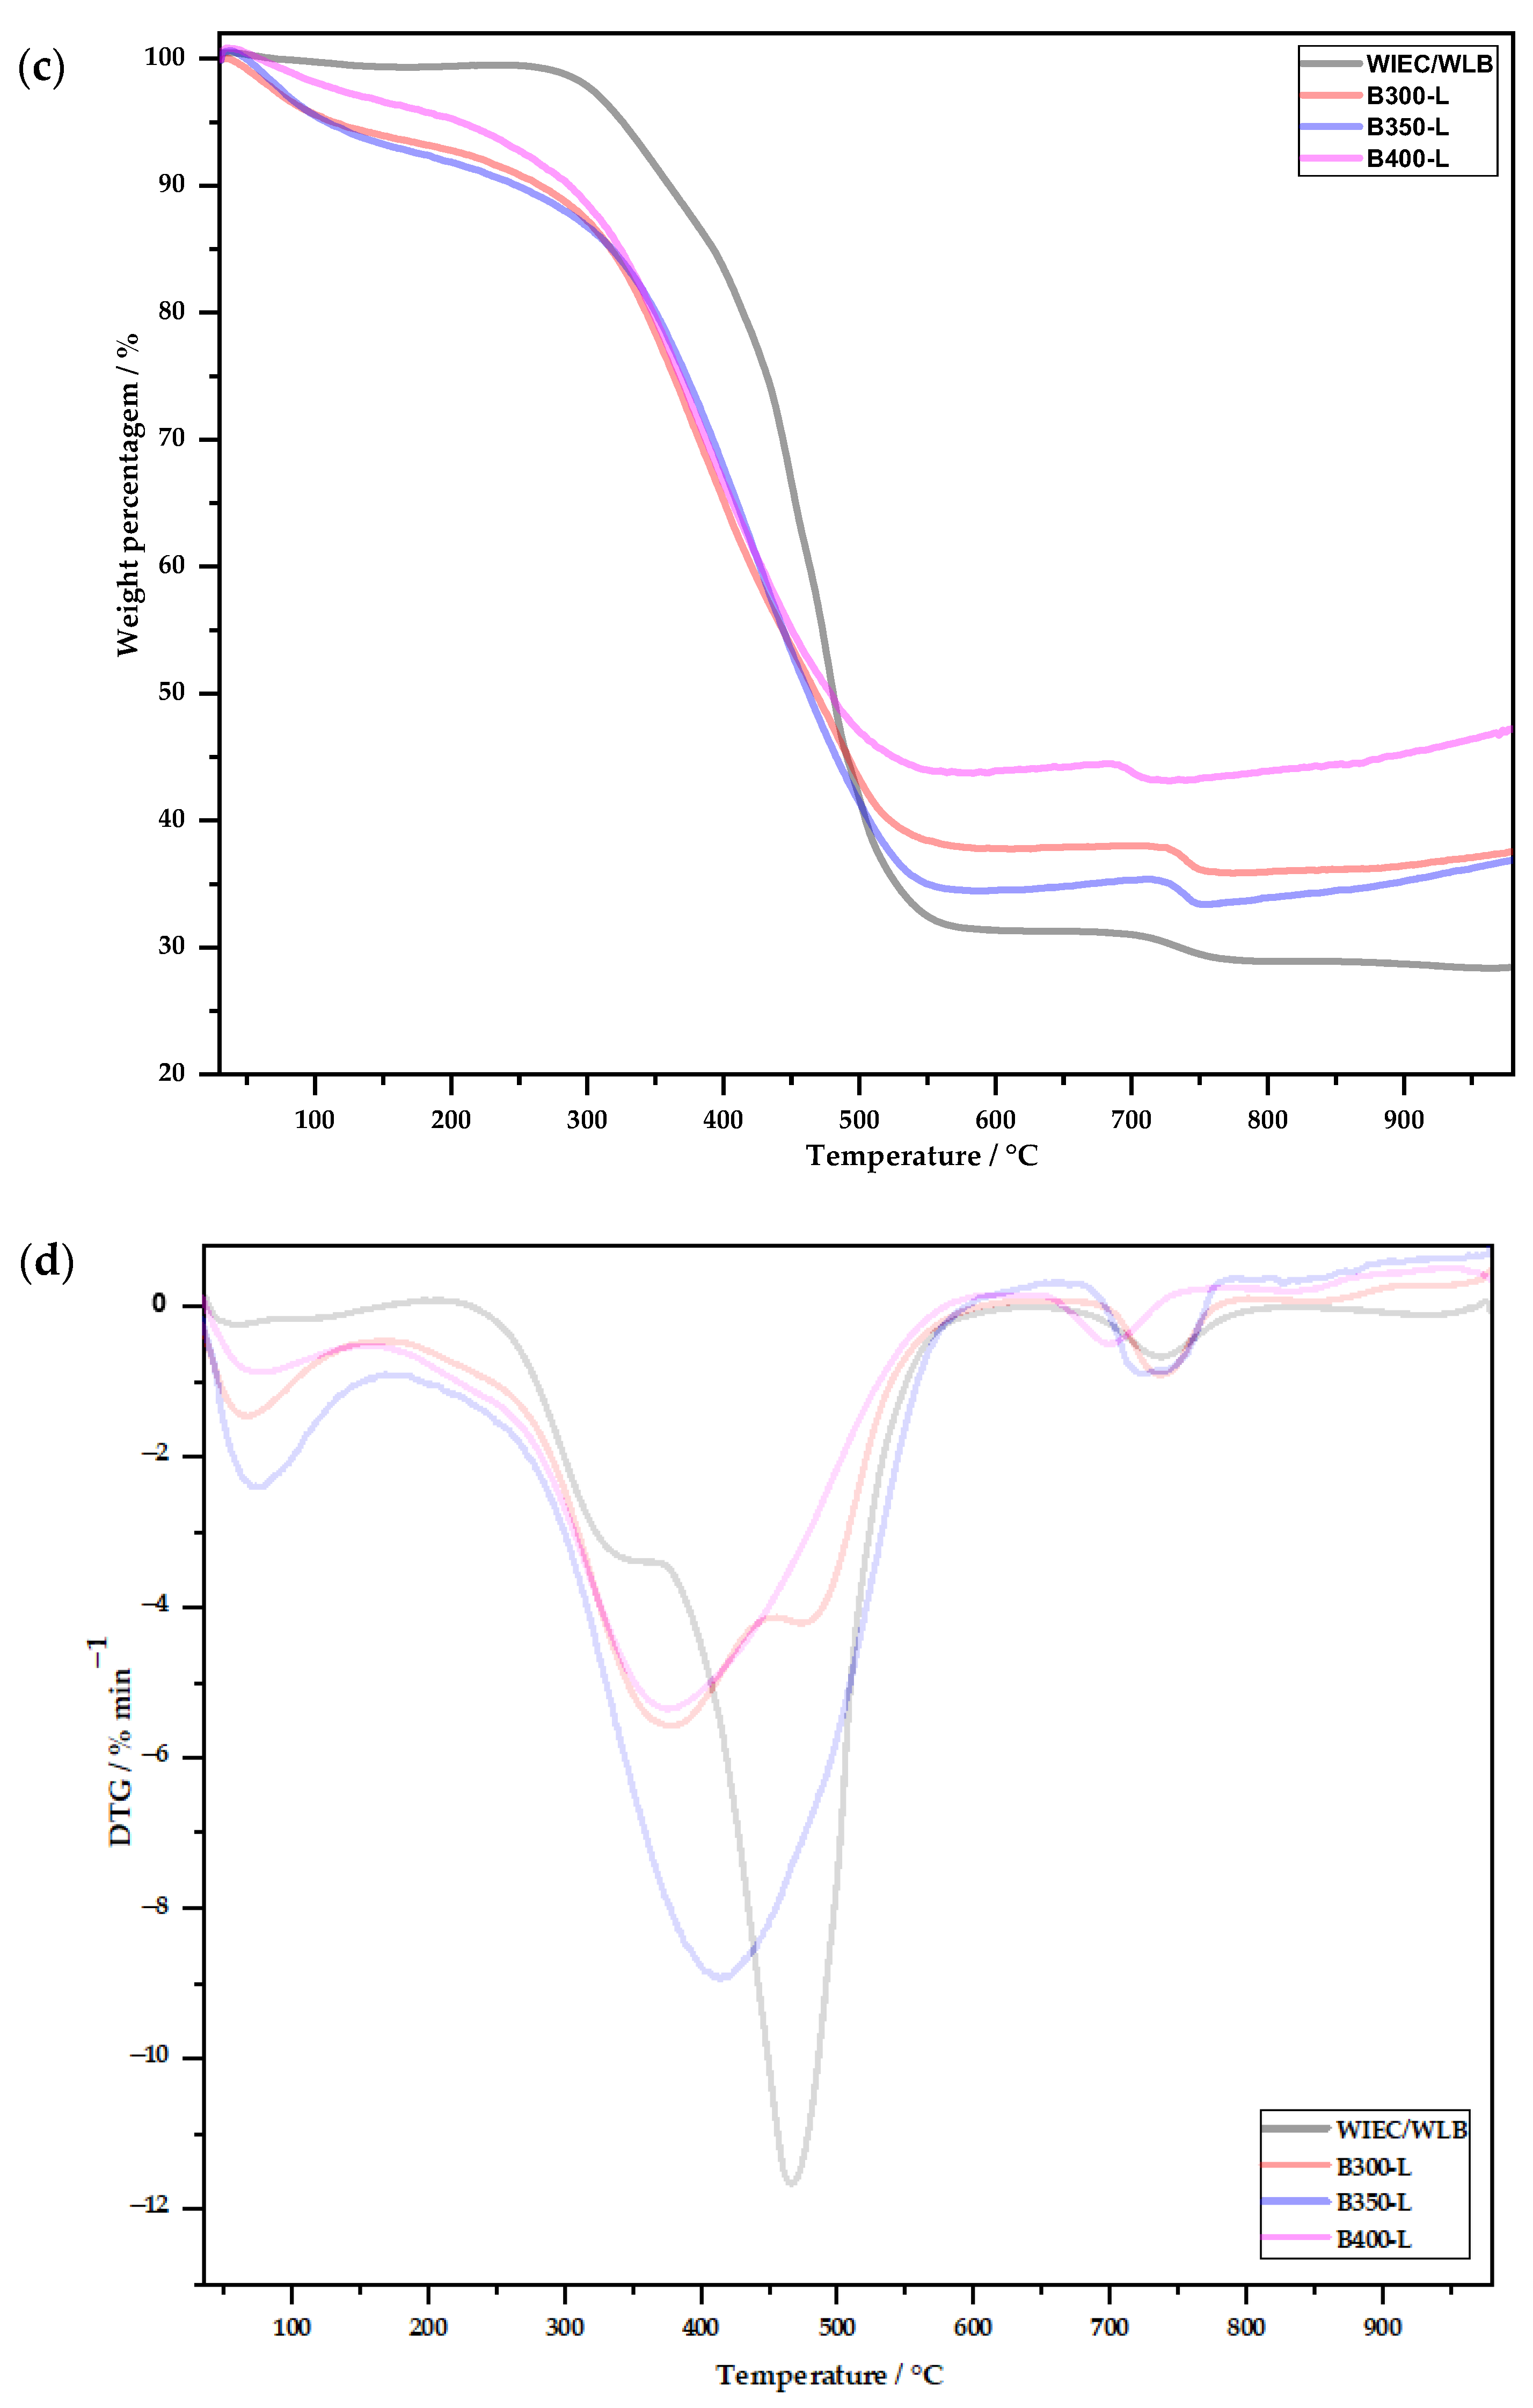
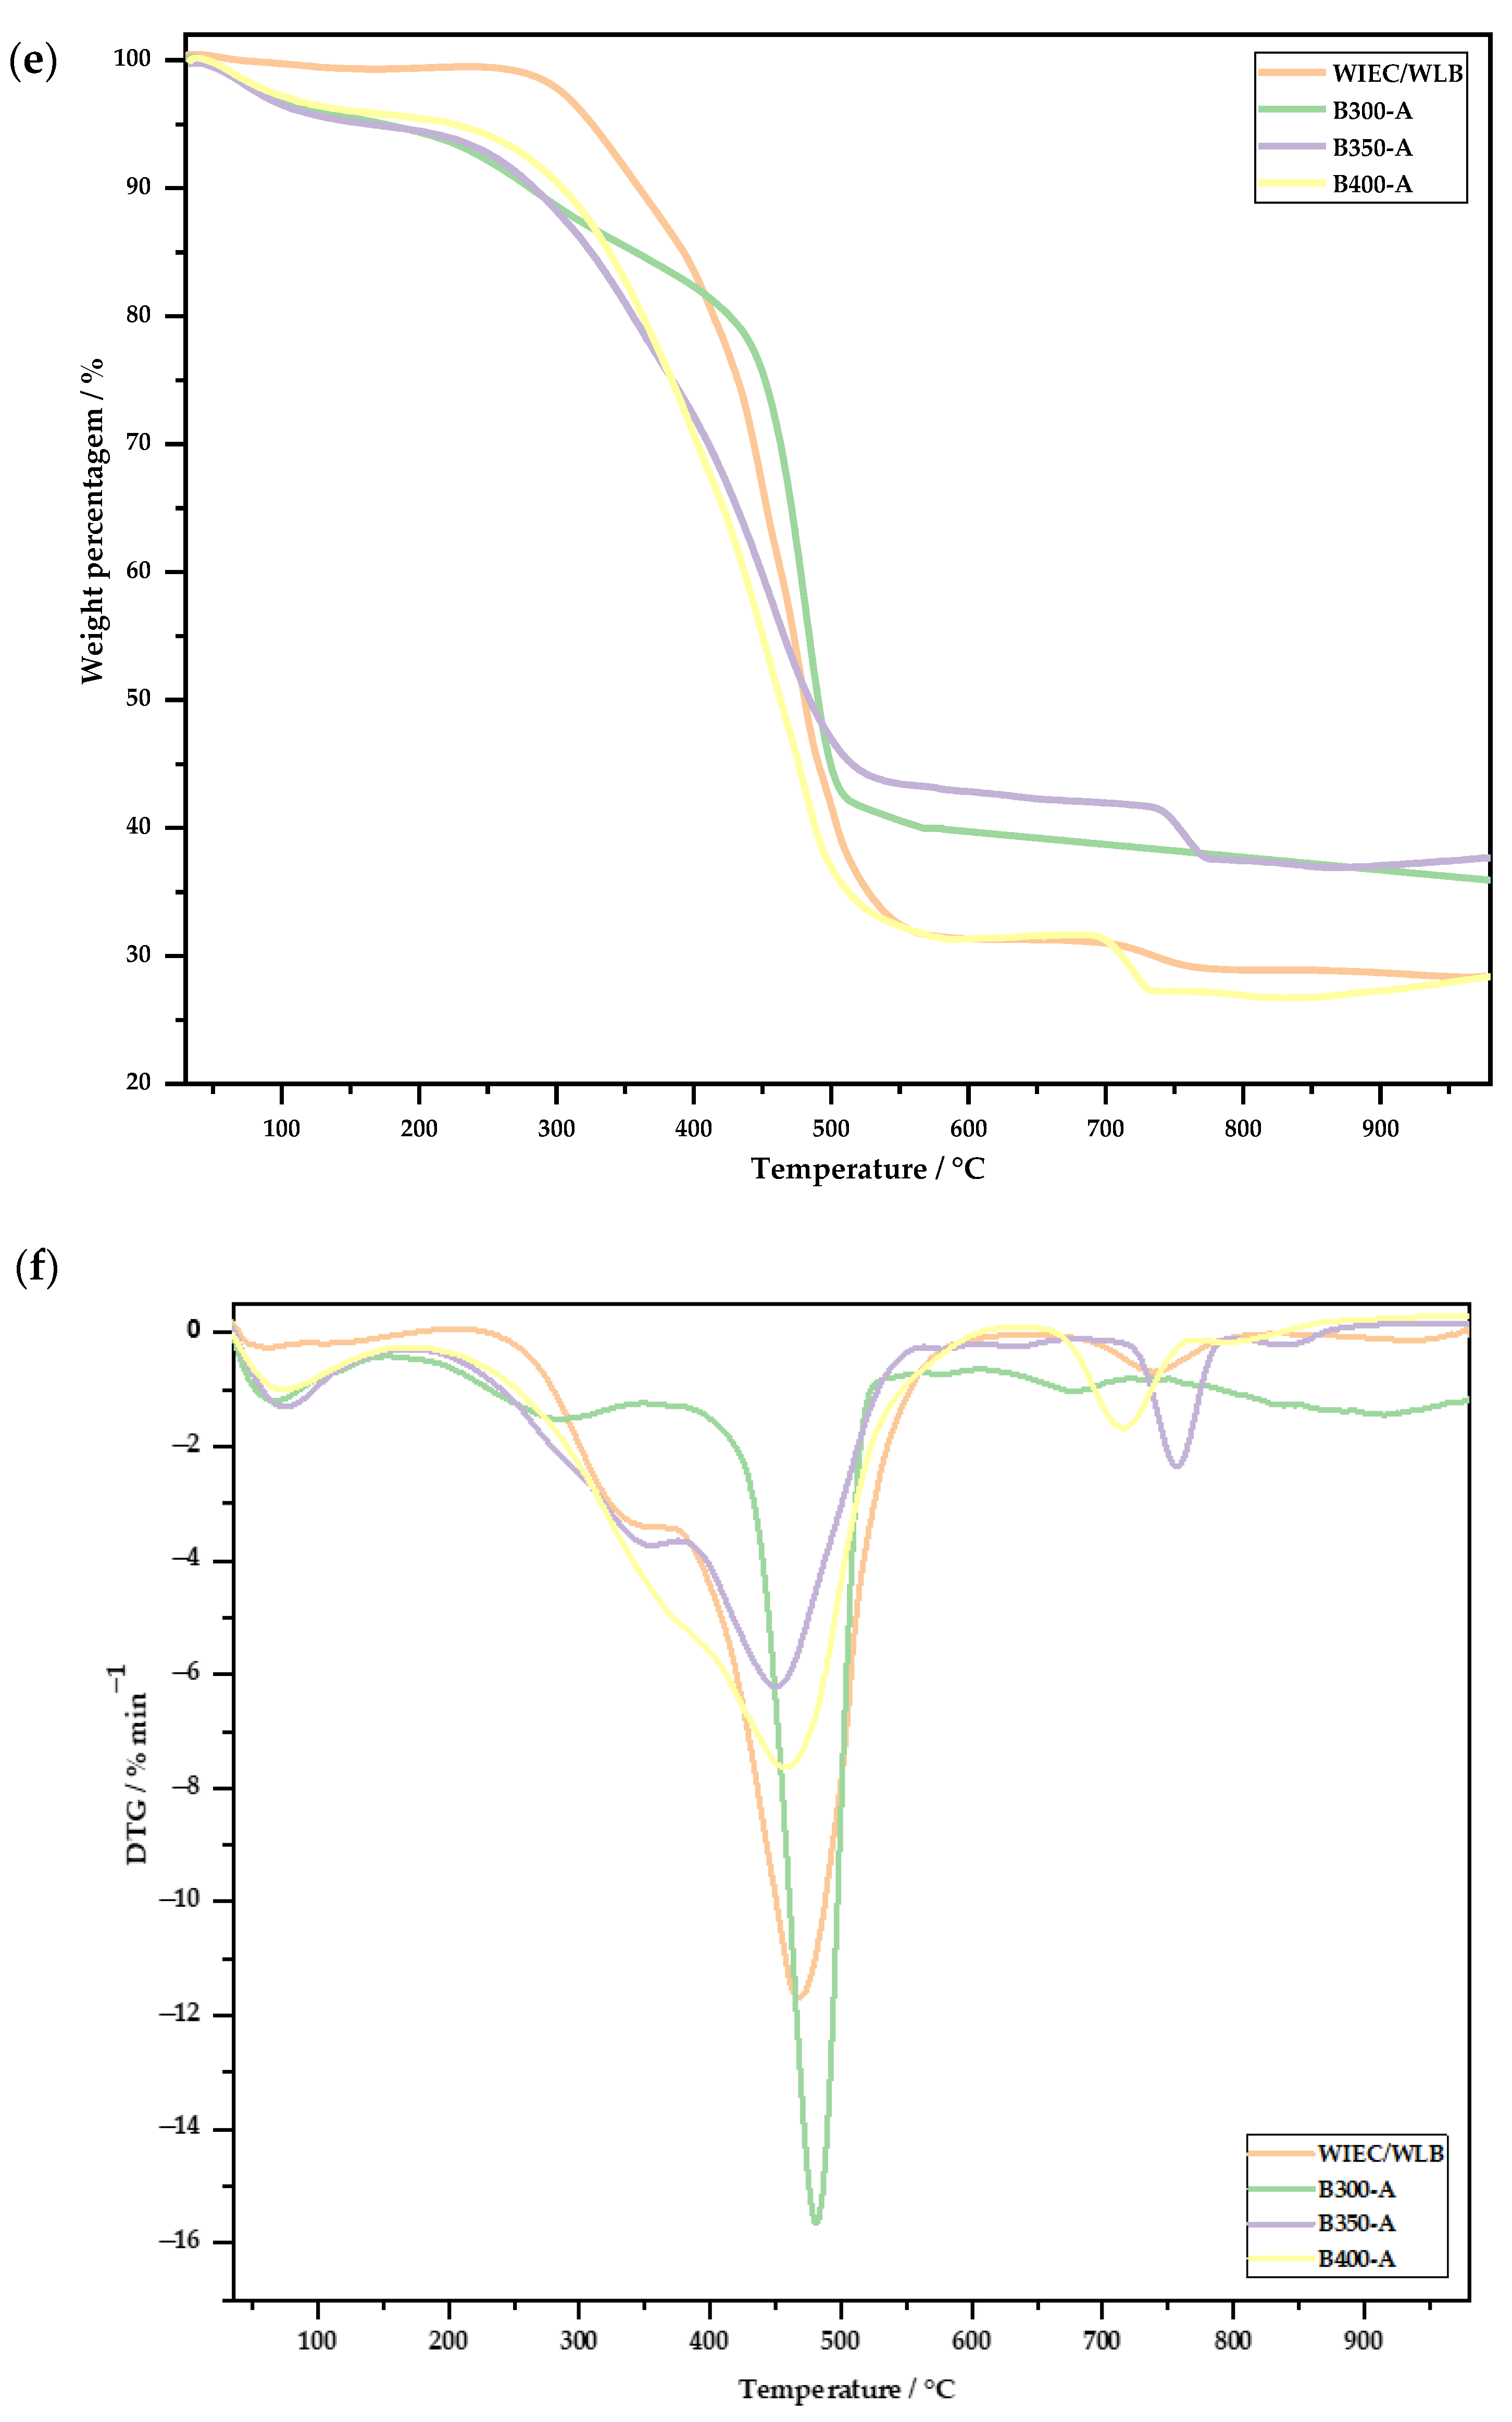
3.2.2. Thermogravimetric Analysis

Figure 5 shows the results for the TGA analysis of the produced biochars compared with the original feedstock.
The moisture content is an important parameter and is negatively correlated with the heating value of fuel and with the potential for biological degradation during storage. Materials with a relatively low moisture content become more prone to self-ignition at room temperature [43]. In the obtained TGA profiles (Figure 5), the WIEC/WLB mixture (original feedstock) has a low moisture content, less than 0.5%, which means that it is suitable for thermochemical conversion processes, as they contain less than 10% moisture [44]. However, the produced biochars showed higher moisture contents, between 8 and 15% (B300, B350 and B400). These results can be associated with the absorption of atmospheric moisture and the tars that are on the surface of the biochar [45]. As for the biochars that were washed and activated, despite having been dried in an oven before carrying out the tests, the values for the moisture contents can also be associated with atmospheric humidity. The moisture content variations of the washed biochars were between 2 and 7% and, for the activated biochars, less than 5%, and in all the studied biochars, the loss of mass in the first stage was associated with dehydration and the decomposition of the hydrated compounds and light volatiles, which occurs up to 200 °C [46].
The main degradation occurred after dehydration, causing a sharp decrease at 200 °C and ending close to 600 °C, reaching the peak of Tmax at 475 °C. This peak corresponds to a loss in volatile matter, being 45–50% of the weight for the biochars. This decrease in volatiles may be related to the decomposition of the biomass fraction (hemicellulose, cellulose and lignin), which occurs in a temperature range up to 400 °C, but also to the decomposition of some polymeric monomeric units with a higher degree of unsaturation [46].
The second curve can be divided into the depolymerization of biodegradable materials up to approximately 400 °C and degradation of less reactive and high molecular weight components [46,47]. The degradation of polystyrene (PS), polypropylene (PP) and polyethylene terephthalate (PET) occurs between 350 and 500 °C; this phenomenon can be observed in biochars produced at 400 °C, where the amount of organic matter present in the biochar is lower because they have already been previously degraded [48].
The third peak, which started after 600 °C, corresponds to the decomposition of inorganic substances such as inorganic carbonate and lignin aromatic rings [49,50], varying up to 850 °C for B300, B350 and B400 biochars, and for biochars that have been washed and/or activated up to 800 °C.

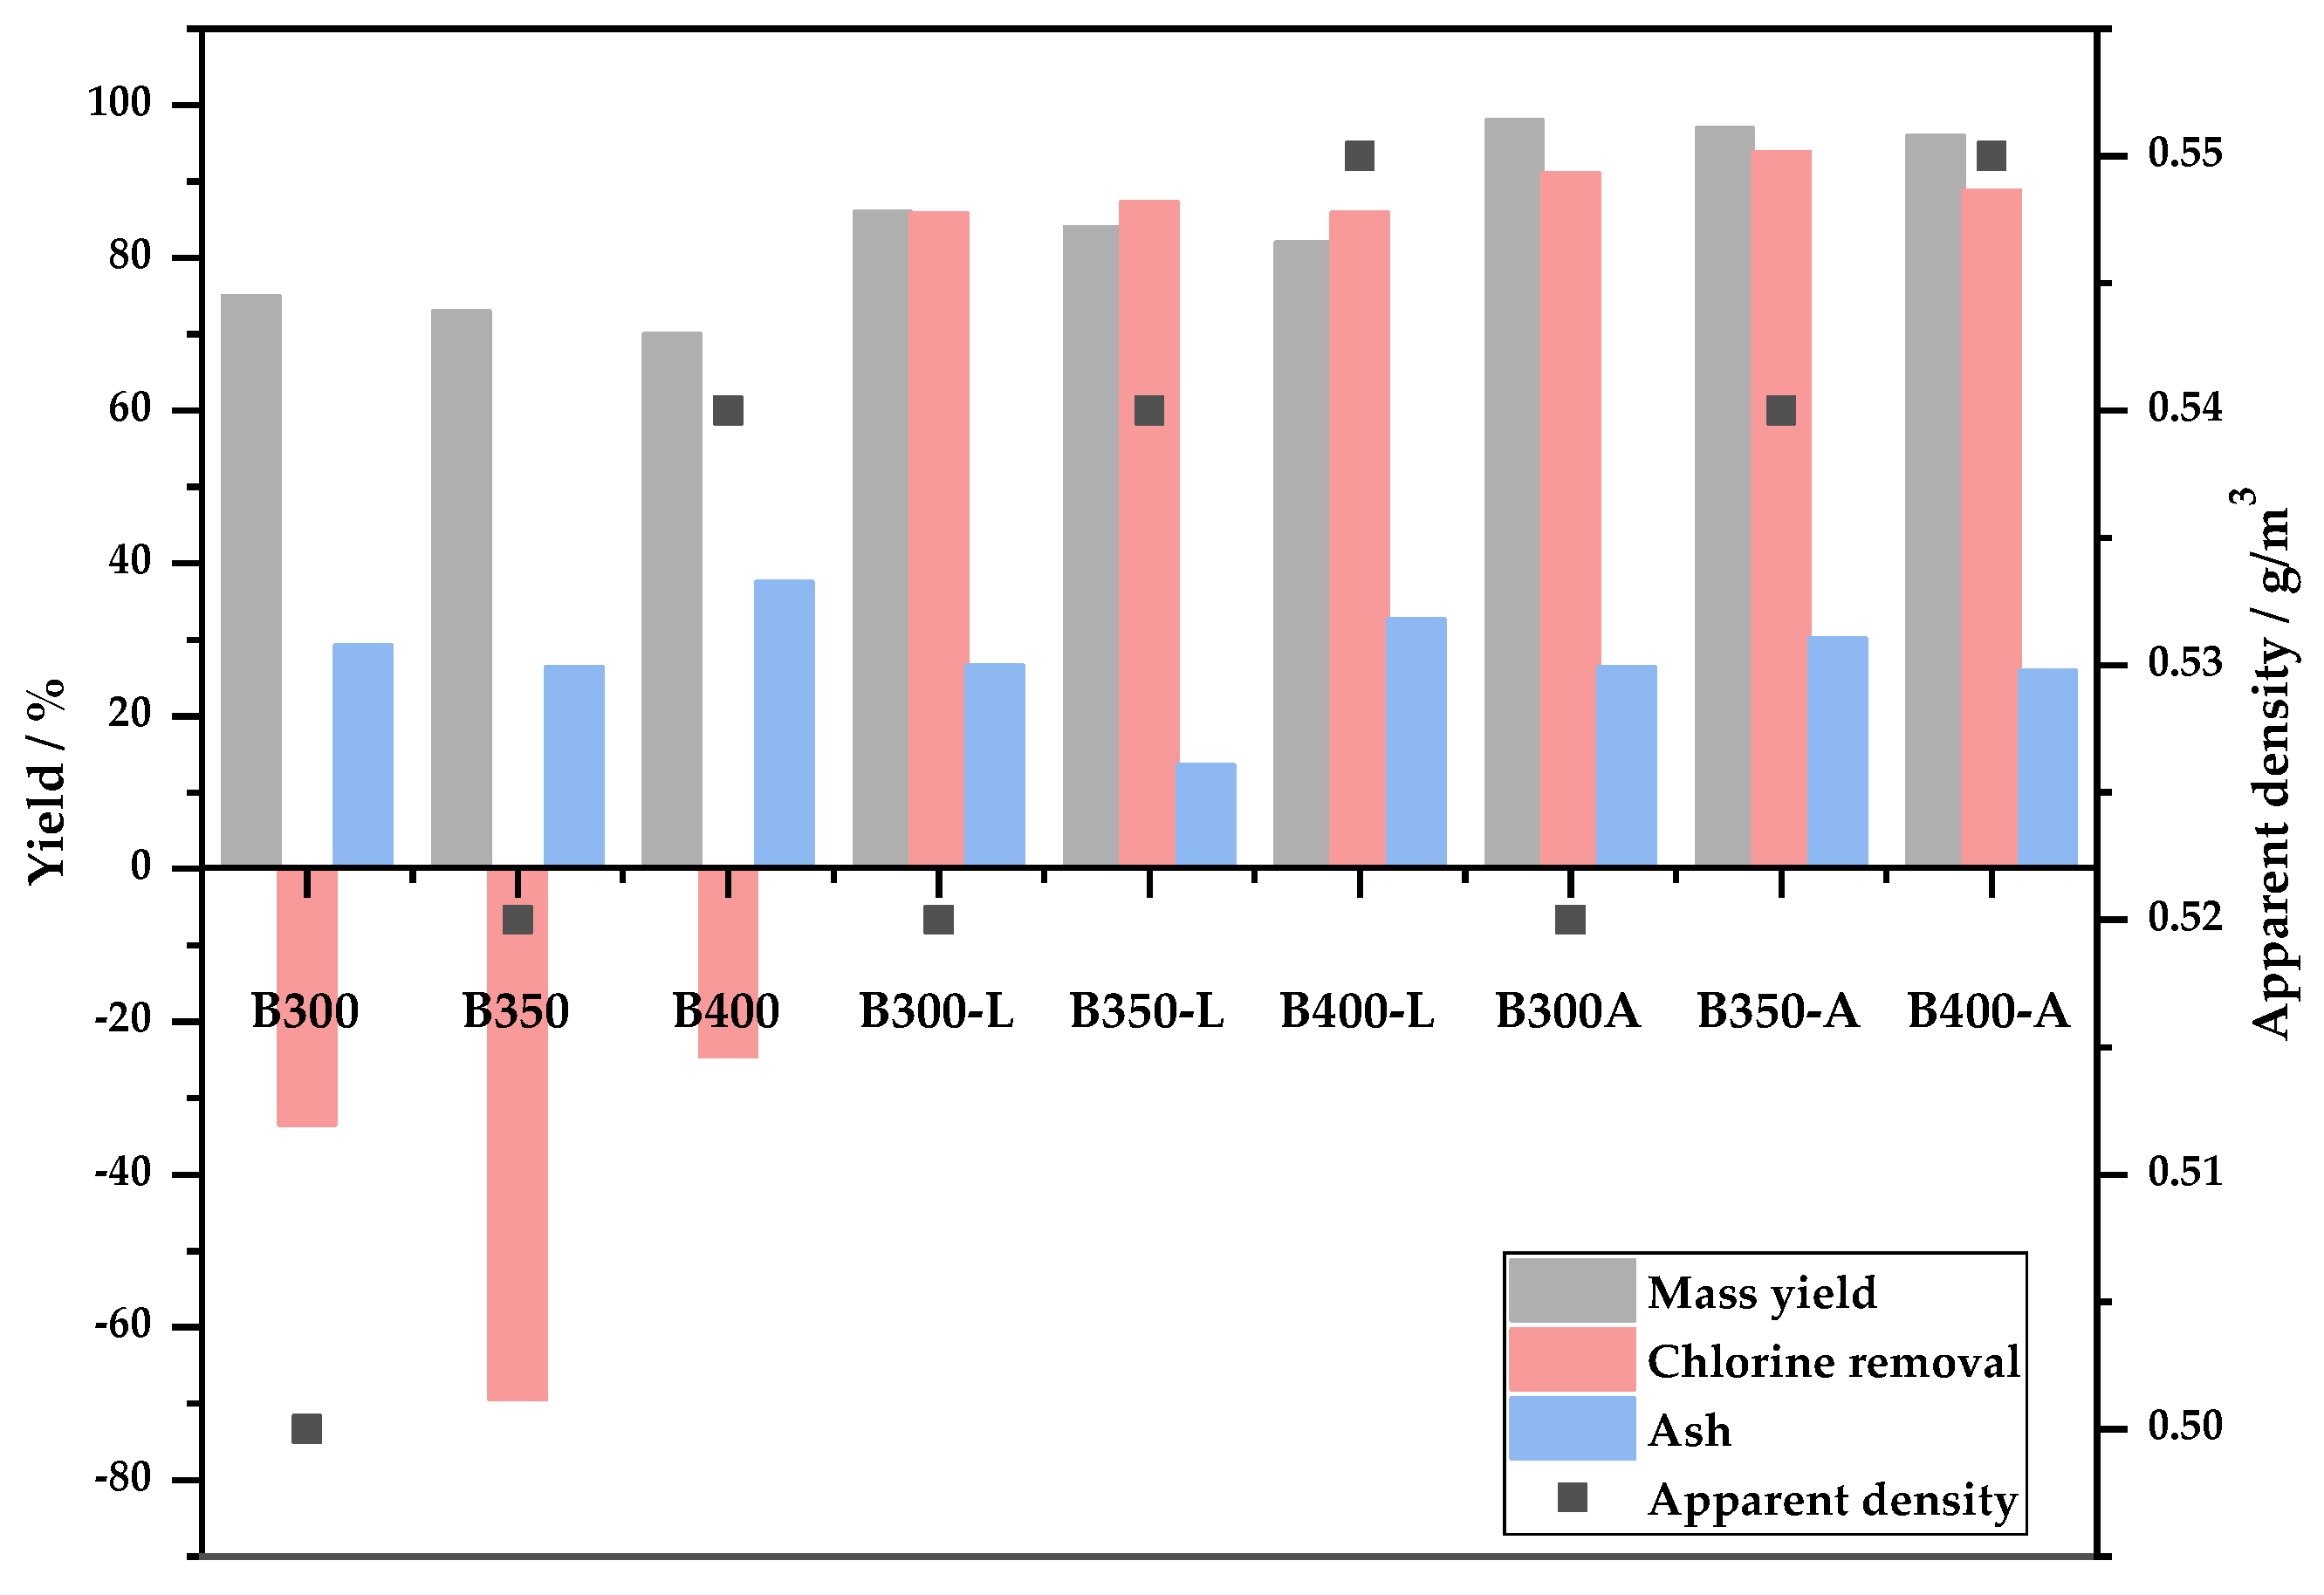
3.2.3. Mass Yield, Ash Content, Chlorine Removal Potential and Apparent Density of the Biochars

Figure 6 shows the results for the mass yield, ash content, chlorine removal potential and apparent density for all the produced biochars (without treatment, washed and activated).
It is possible to observe that, when compared with the nontreated biochar samples, the washed and activated samples show greater mass yields, particularly samples B300-A, B350-A and B400-A.
For the ash content results, there was an increase in the ash content when the carbonization temperature was increased from 300 to 400 °C. When washing the biochar, there was a reduction of the ash content, and with the activation of biochars B300-A and B350-A, the ash content increased. For samples B400-L and B400-A, the differences between the ash contents after the different processes were not noticeable. The ash contents obtained in biochars produced at 300 and 350 °C were very similar and differed significantly from B400, with very close mass yields (70–75%).
The chlorine removal potential for biochars B300, B350 and B400 were negative, which means that there was a concentration effect, caused by the mass loss, associated with the chlorine volatilization and, further, deposited onto the biochar surface. When the biochars were washed with hot water, the chlorine removal potential showed very significant values greater than 85%. This removal potential is an important indicator that demonstrates the further need to treat biochars that are produced from chlorine-containing wastes, since the chlorine content is extremely important in further thermal conversion processes. Excess chlorine is known not only for producing harmful emissions (such as HCl or PCDD/Fs) but also to cause equipment damage due to corrosion phenomena [51]. Activated biochars have shown to be very stable in terms of the mass yield, chlorine and ash removal. These biochars differ mainly regarding the apparent density, as the higher the production temperature, the greater the density of the biochar. Biochar samples B400-L and B400-A presented chlorine removal potentials of 86 and 89%, respectively, mass yields above 82% and ash contents of 33% for B400-L and 26% for B400-A, thus presenting the best carbonization and treatment conditions.
Overall, the apparent density of the produced biochars increased as the production temperature increased, varying between 0.50 and 0.54 g/m2. However, as it was a measure with experimental observations, this difference was not very significant. For the biochars that were washed (B300-L, B350-L and B400-L) and for the activated ones (B300-A, B350-A and B400-A), the values for the apparent density when compared to the nontreated biochars at the same production temperature were the same.

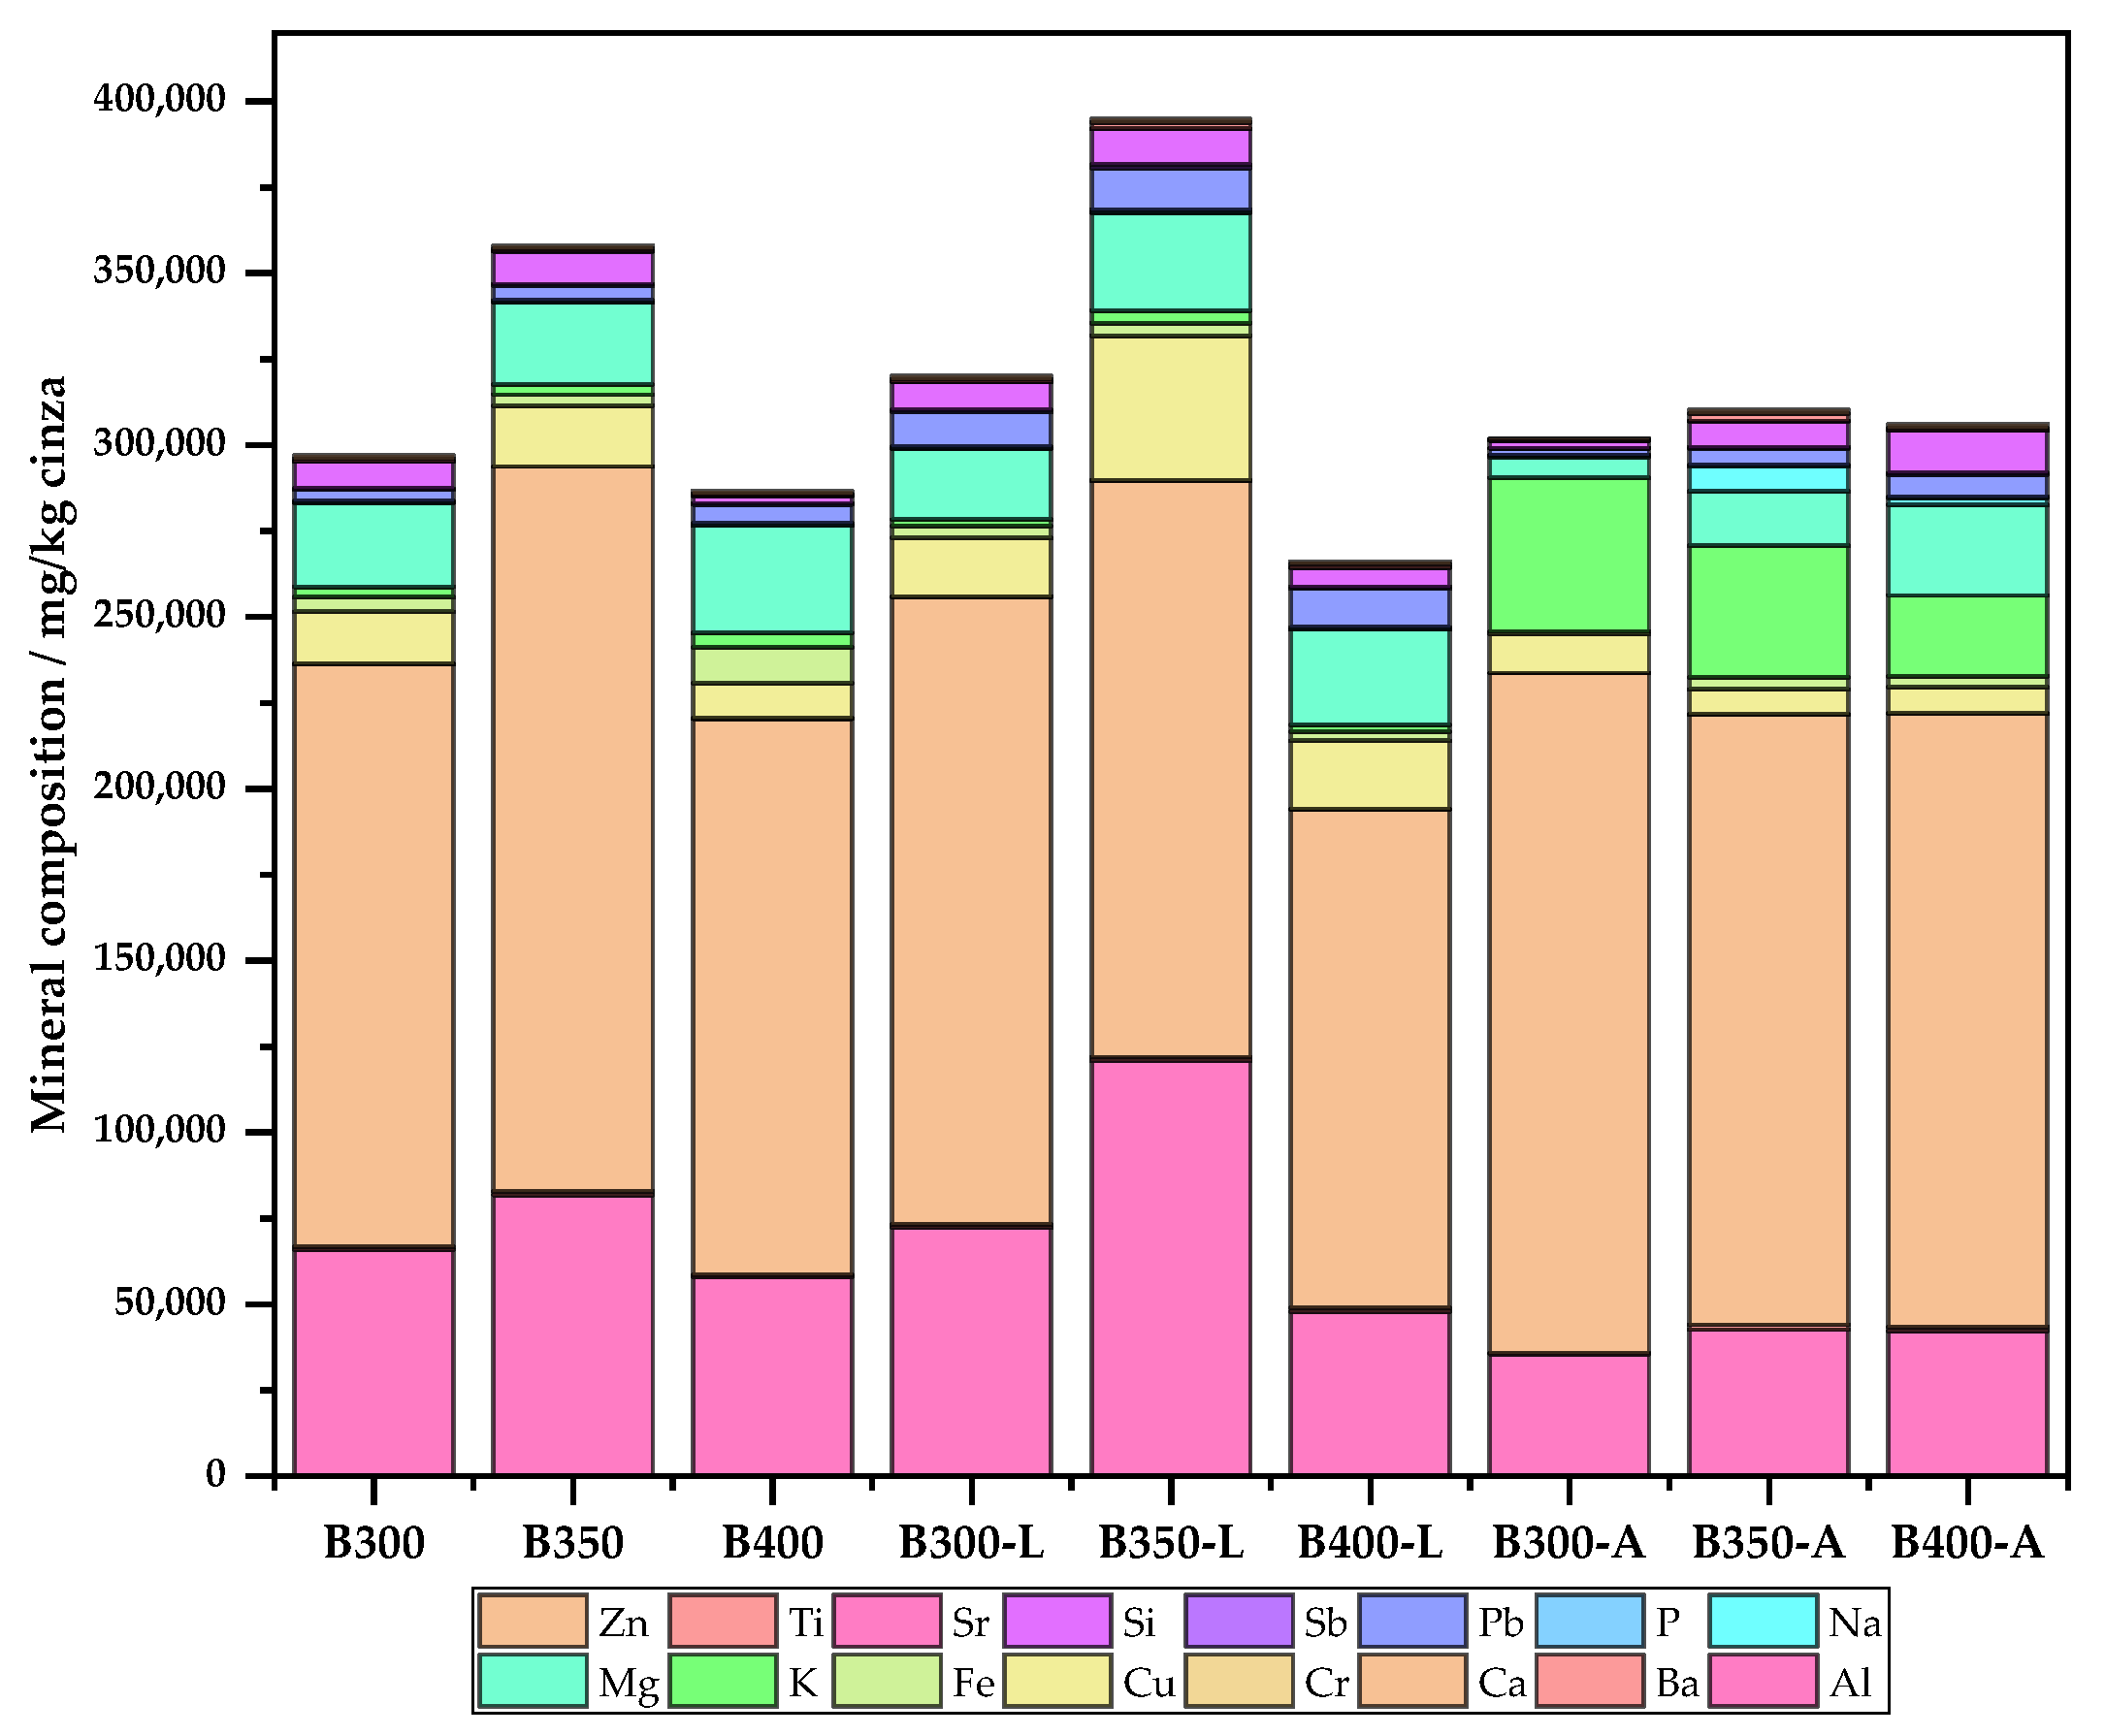
3.2.4. Mineral Composition

Figure 7 shows the mineral compositions for the different biochars.
It is possible to observe that the concentrations of aluminum in the ashes of biochars B300, B300-L, B300-A, B400, B400-L and B400-A are decreasing. These results can be related to the fact that, with washing, the aluminum concentration was reduced and, with the activation process, the reduction compared to the initial concentration was, on average, 50%. Regarding the calcium in all washed biochars, it was possible to observe that, when the production temperature increased, the concentration of this element was lower, and when the biochars were activated, the calcium concentration had no significant variation.
The concentrations of magnesium and silica for the different biochars that did not undergo treatment (B300, B350 and B400) and for the biochars that were subjected to a washing process (B300-L, B350-L and B400-L) also showed no relevant variations. For the activated biochars (B300-A, B350-A and B400-A), the concentrations of magnesium, copper, potassium and sodium were similar and higher when compared to the other studied biochars.

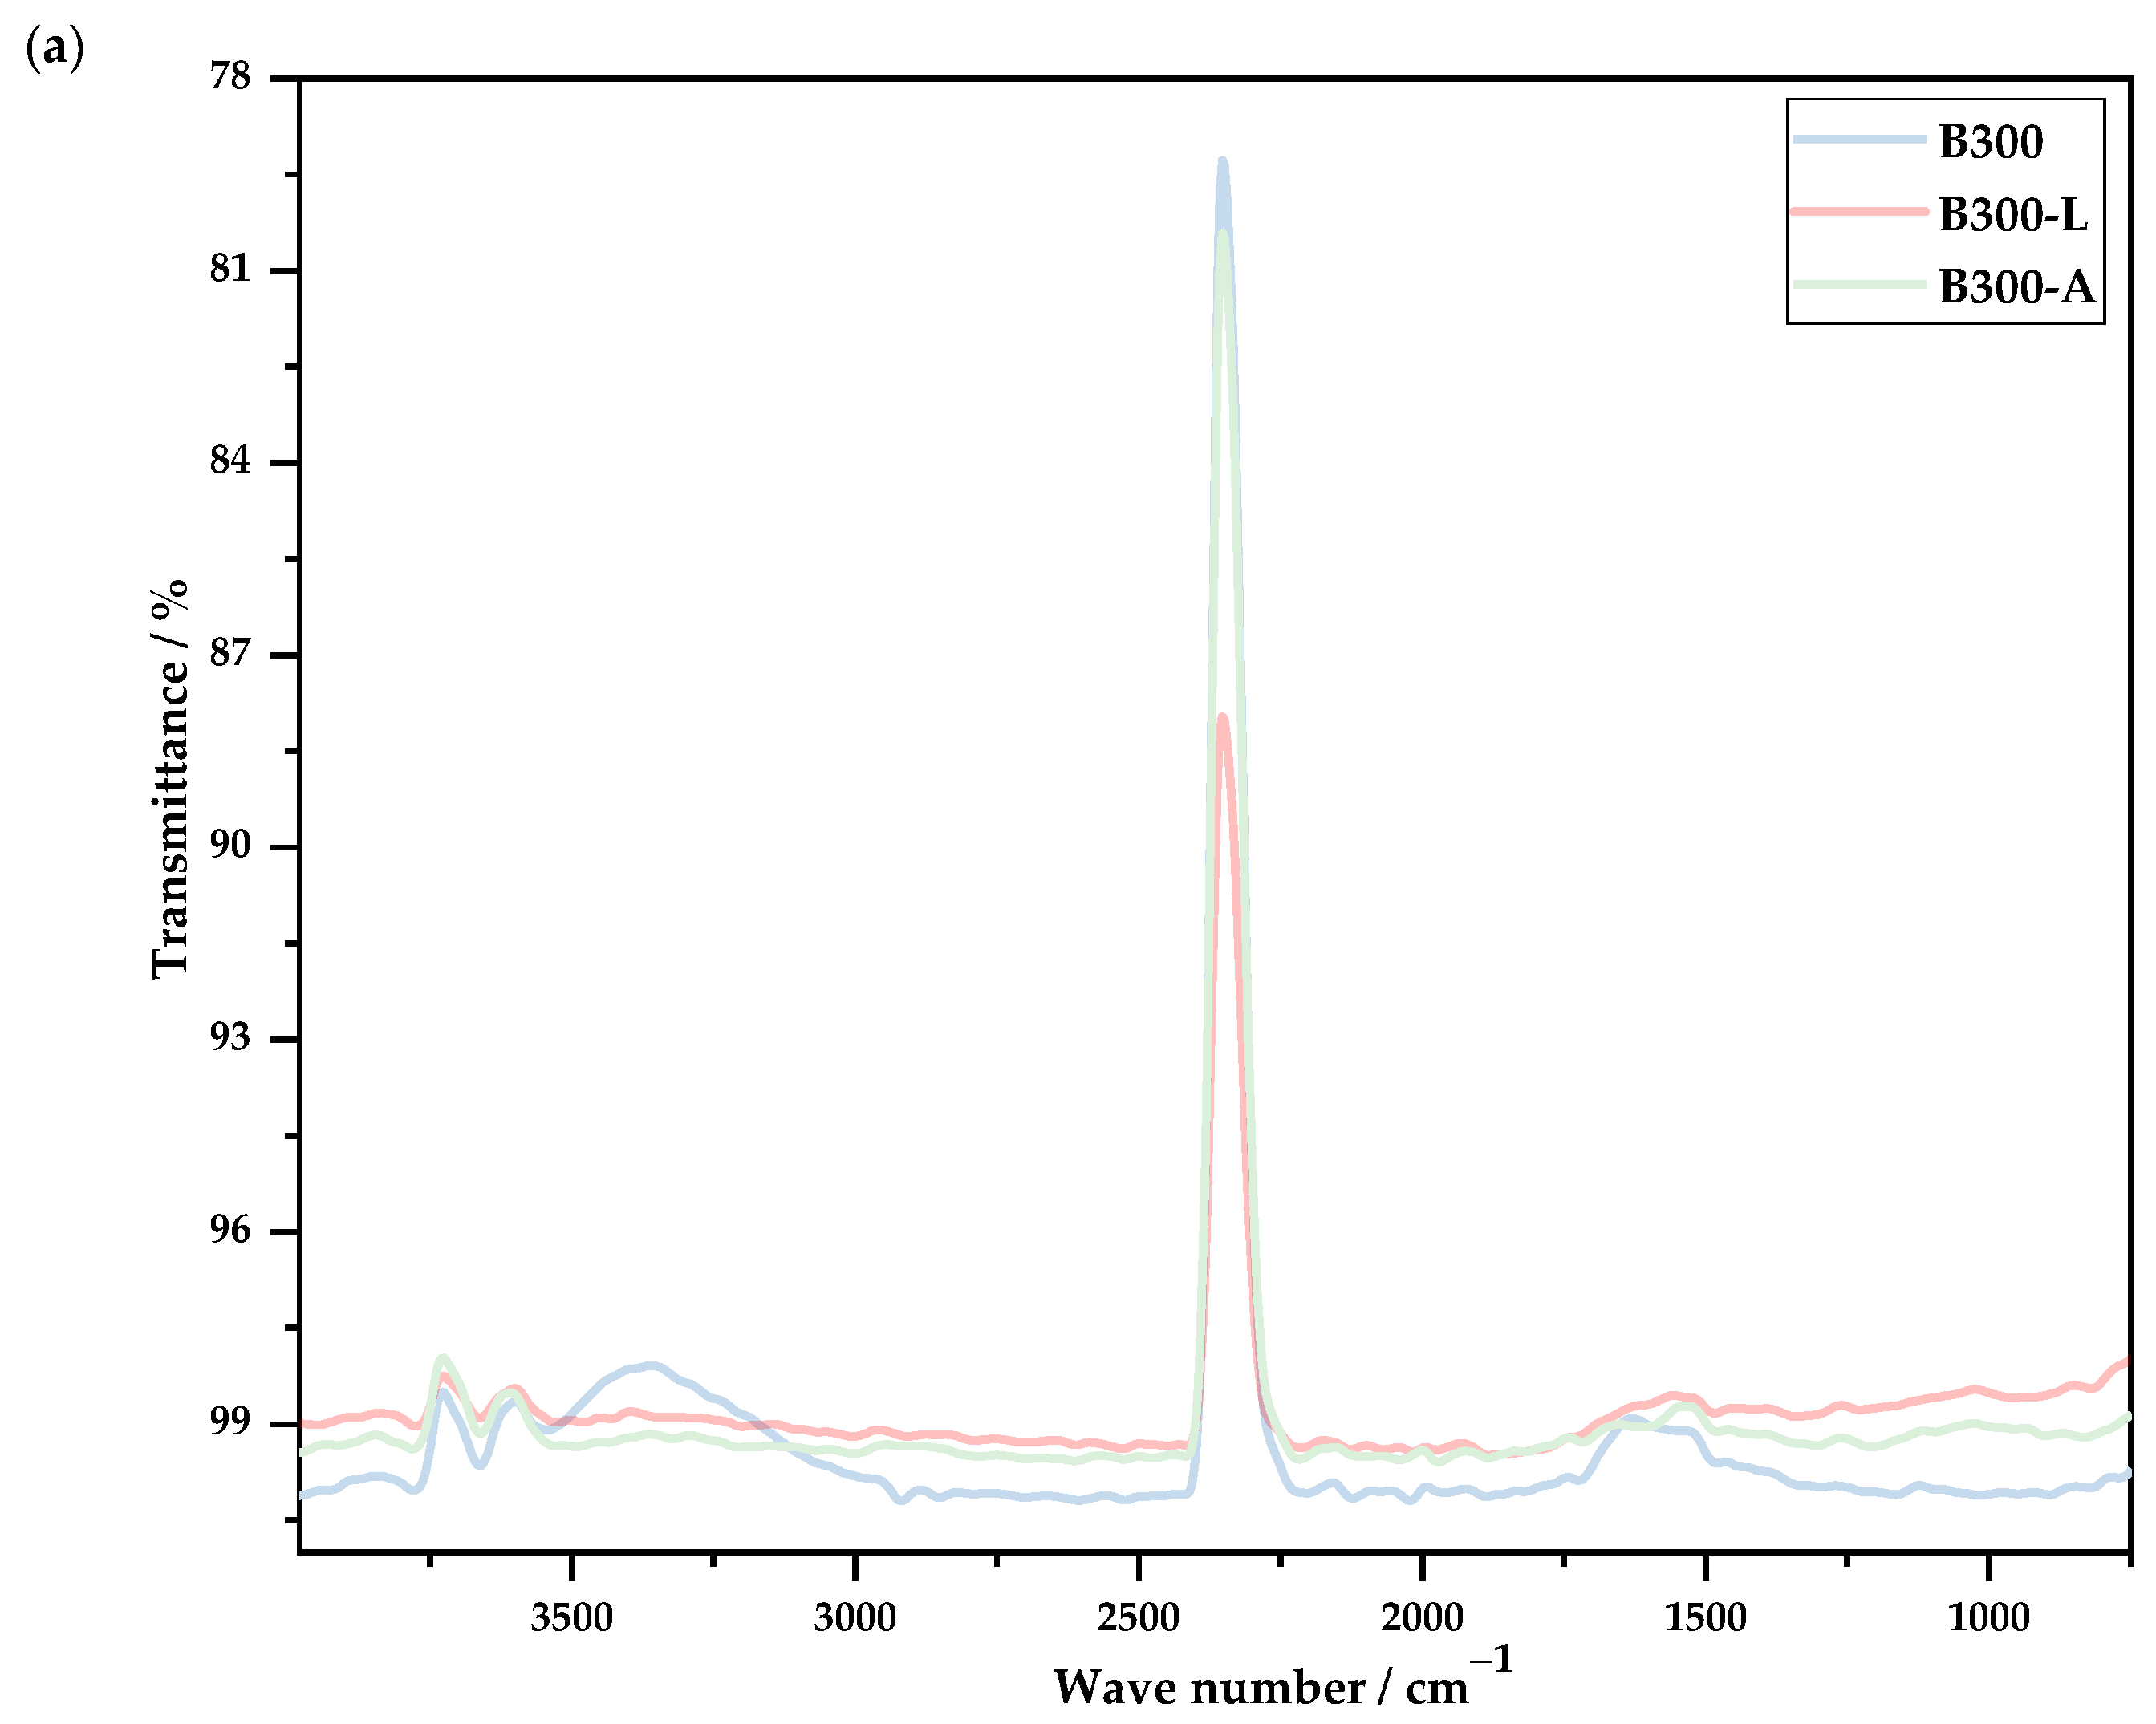
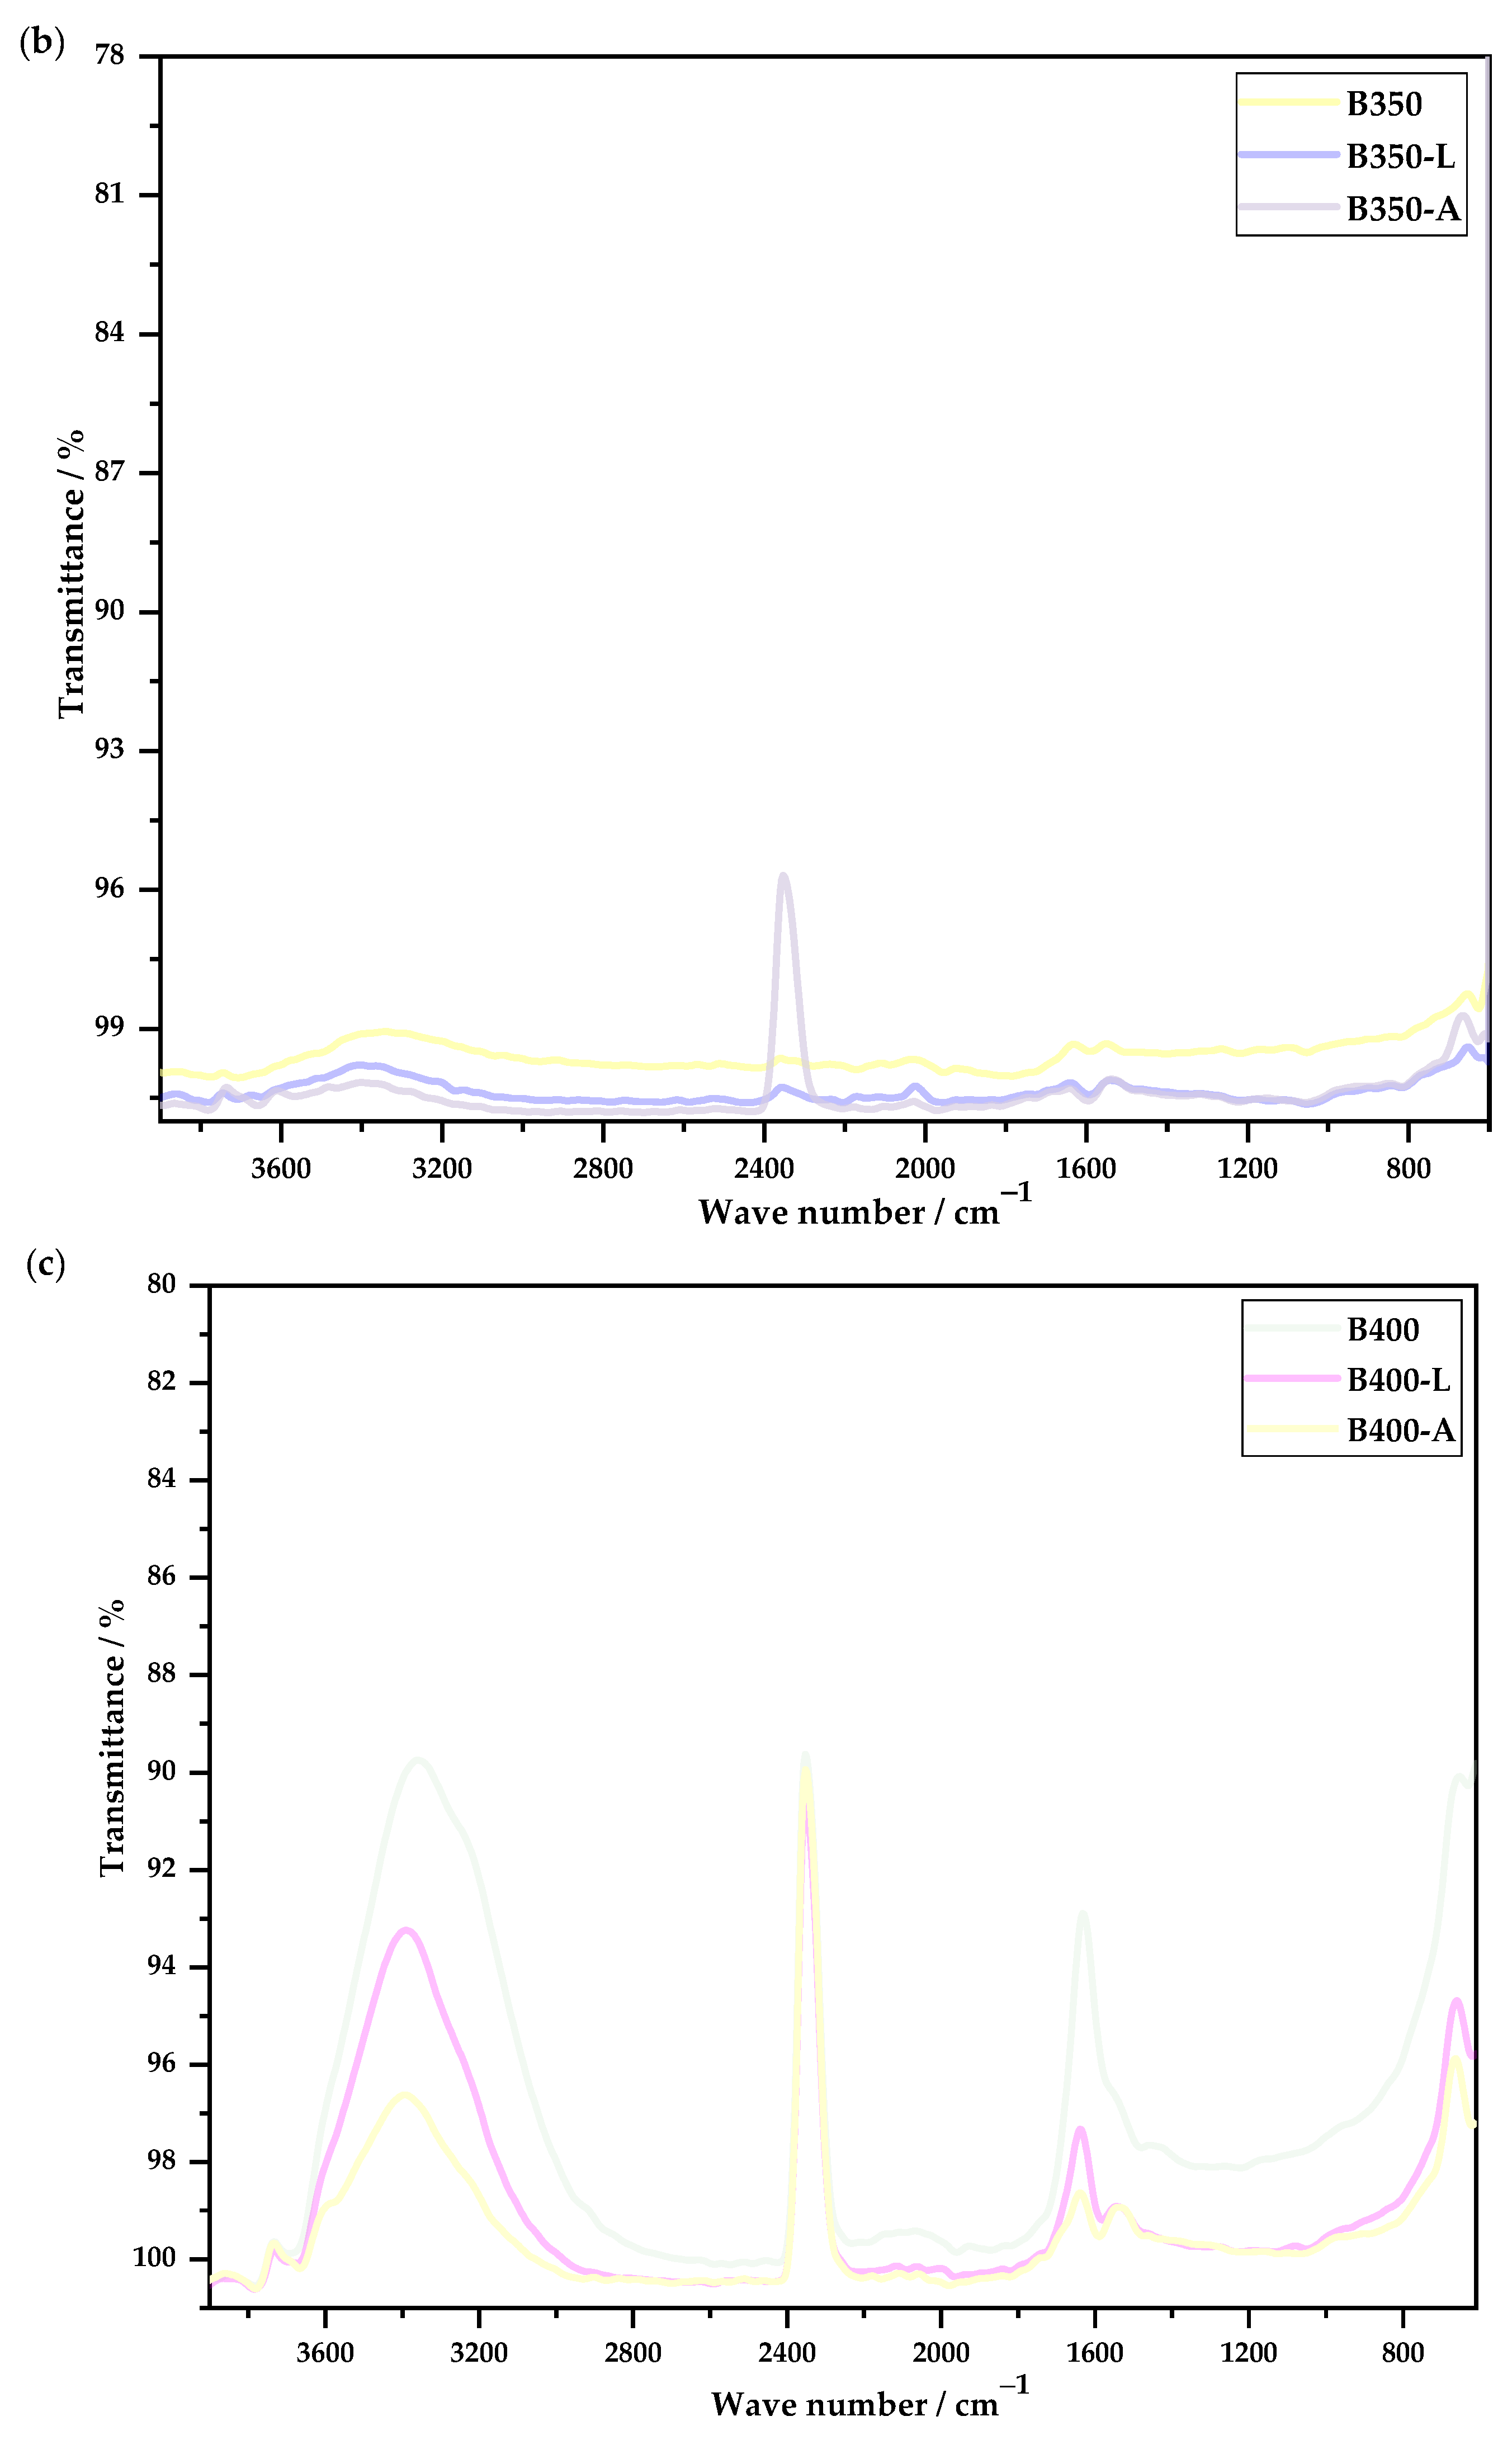
3.2.5. Fourier-Transform Infrared Spectroscopy

In a general observation of the FTIR spectra presented in Figure 8, it is possible to observe that there was a reduction in the intensity of the peaks between biochar samples B300, B350 and B400 for the biochars that were washed and activated.
The FTIR analysis provided us with an absorption spectrum of chemical clusters and not substances. Despite being an analysis that hardly identifies a substance, in the PP, PS and PVC spectra, it is possible to observe a higher concentration of chemical groups up to 1800 cm−1. When polymeric materials undergo a thermochemical process, it is possible to observe that these chemical groups are no longer evident.
Except for B300-L and B350-A, it was possible to observe the presence of a peak at 3400 cm−1 that corresponded to the vibration of -OH elongation of the hydroxyl groups [52]. In biochars produced at temperatures of 350 and 400 °C, as the biochar underwent treatment and drying processes, the intensity of the peak decreased. According to Preston and Schmidt [53], the aromatic ring structure should be progressively formed with the increasing temperature. The high intensity and pronounced peak that we could observe at 2350–2340 cm−1 might occur due to the existence of atmospheric C02 and also due to the existence of some groups due to O = C = O stretching [54]. Another prominent intensity peak was 1600 cm−1, which corresponds to the C = C stretching vibrations in aromatic compounds [55], and it was possible to verify a higher incidence as the biochar production temperature increased. In biochars B350-A and B400-A, it was possible to observe that a peak intensity appeared corresponding to the functional group and stretching C = C, which indicated that the projection of aromatic structures occurred [56]. The peak of 700–600 cm−1 corresponded to the C–Cl stretching vibration, and when washing and activation occurred, chlorine was absorbed or adsorbed in the case of activation [57].

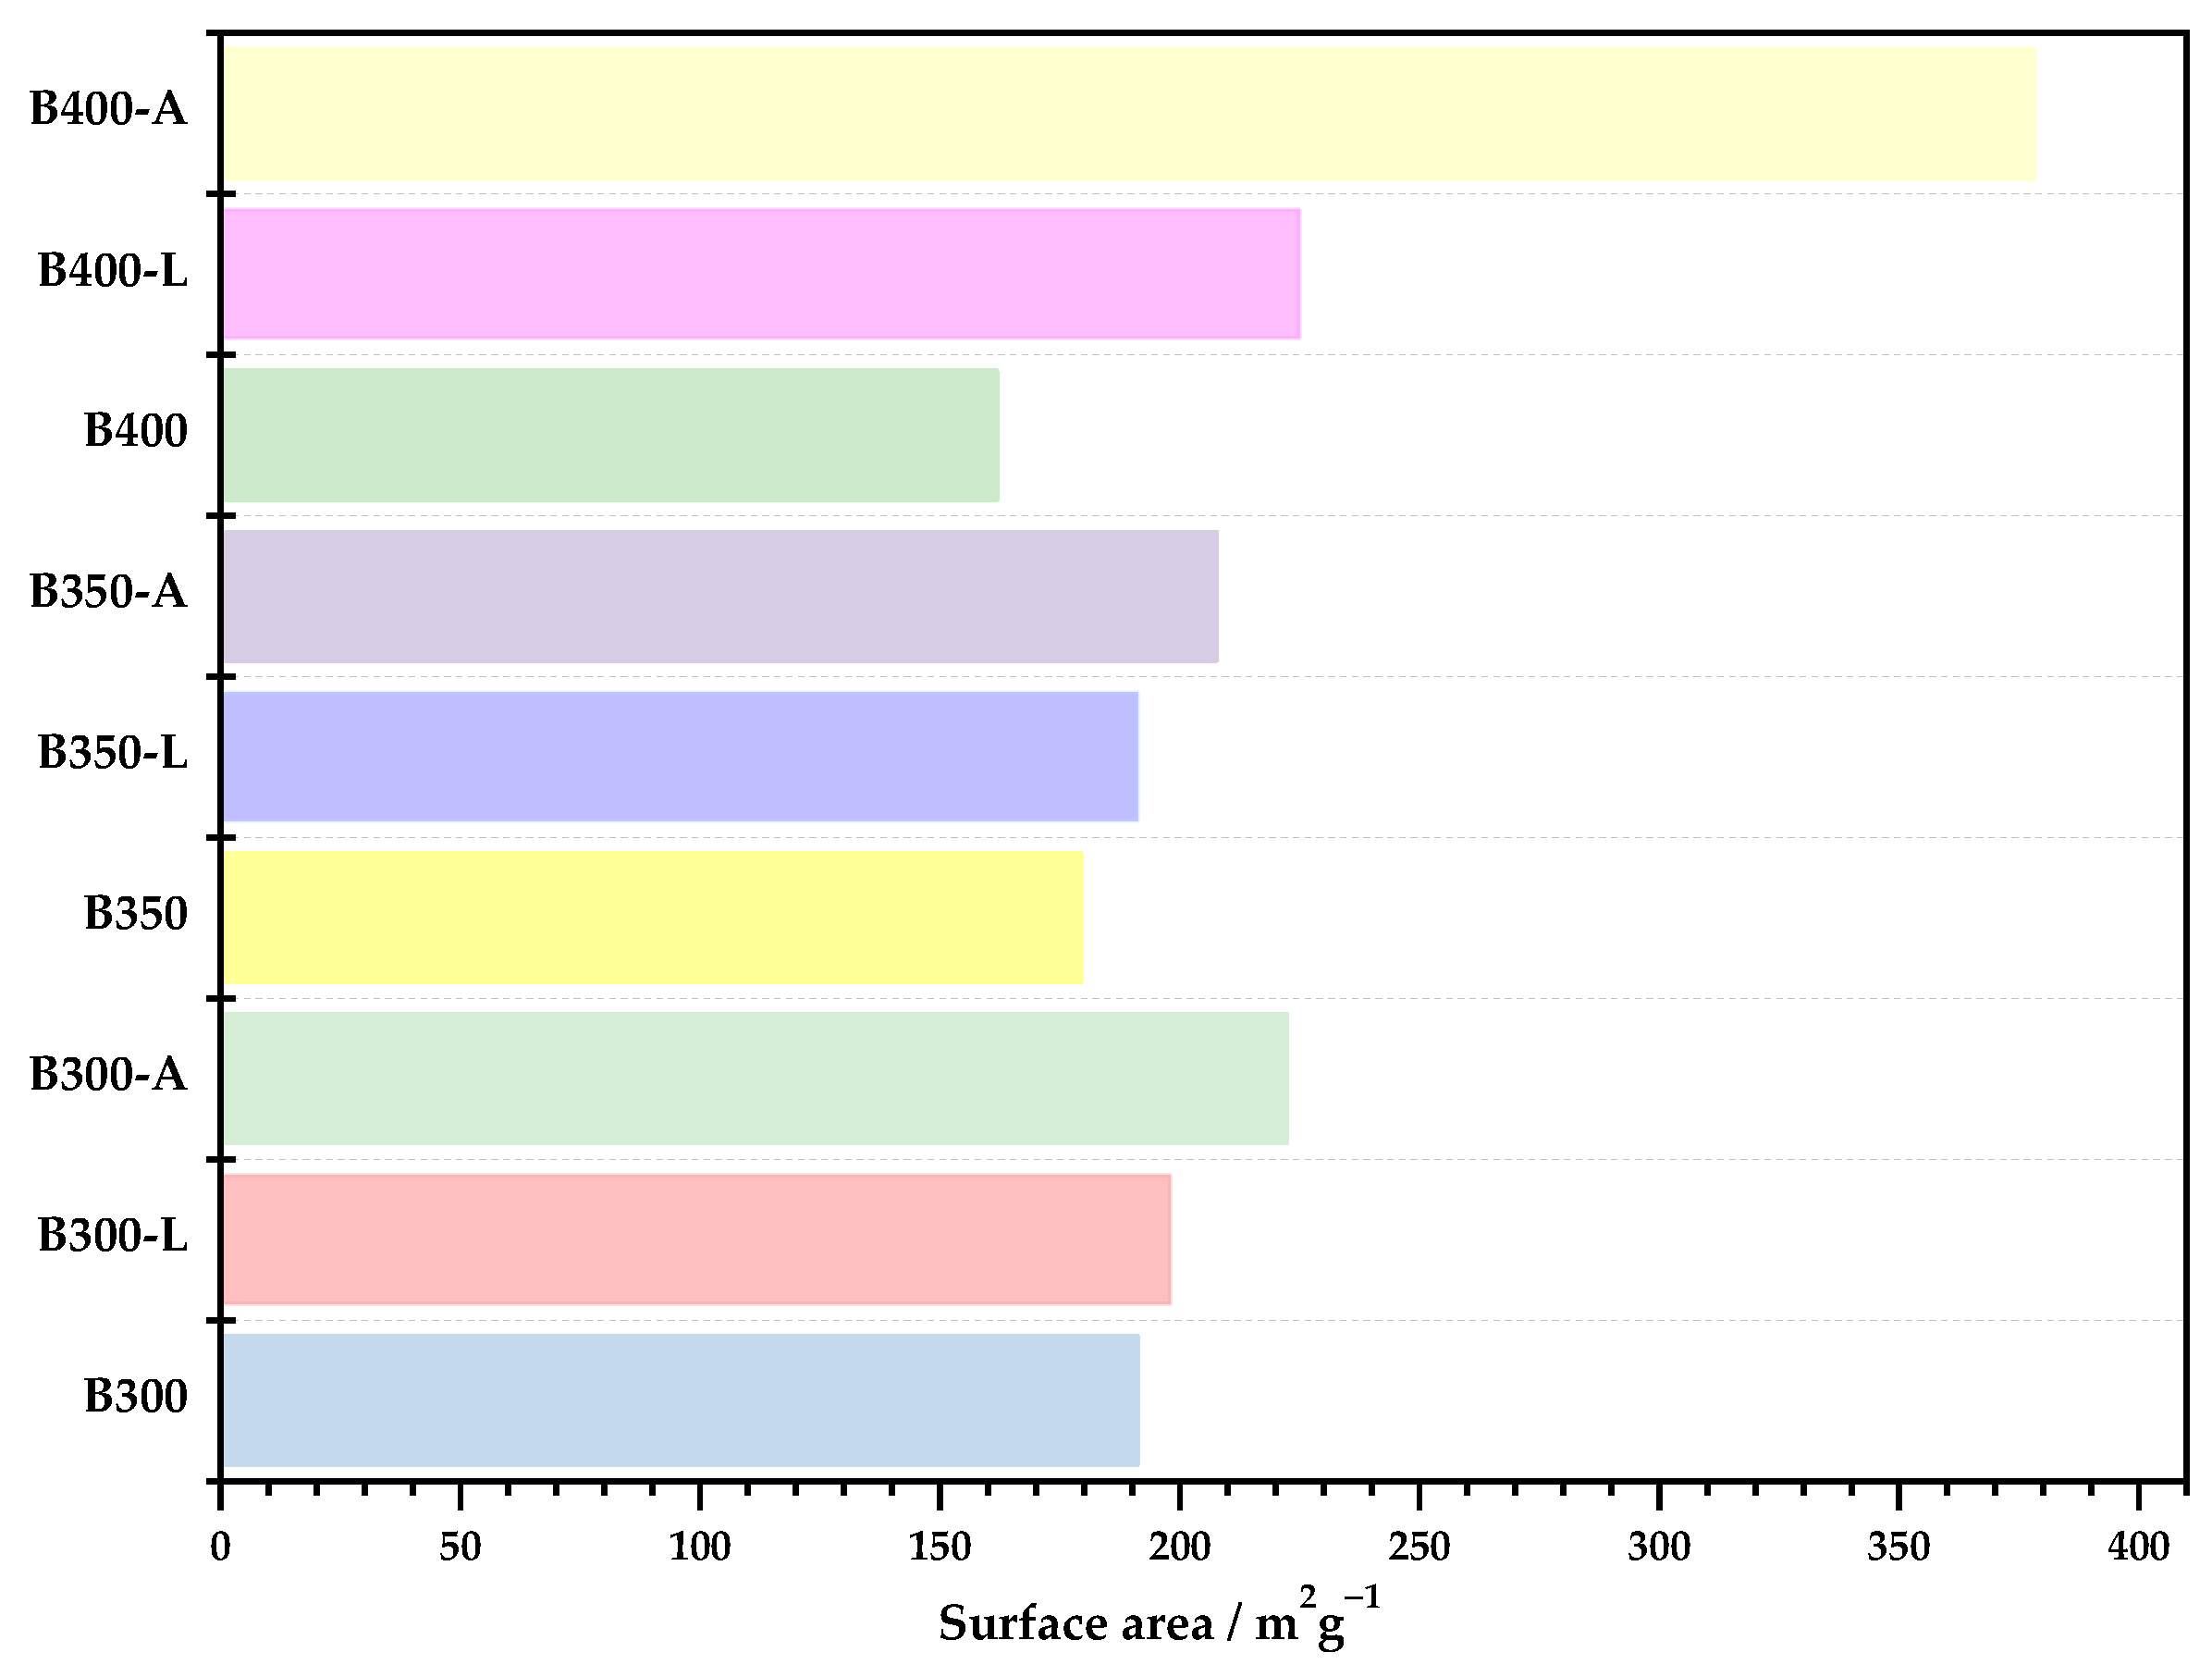
3.2.6. Nitrogen Adsorption at 77 K

The removal of volatile matter produces a void within the biochar that leads to a large surface area, which is also dependent on the properties of the raw material used to produce the biochar. Biochar production based on a biomass develops pores and has been found to be very useful in land application, effluent purification and the removal of heavy metals and different chemicals [58,59,60]. A biochar with a high carbon content and a large surface area is also considered a potential electrode [61]. Figure 9 shows the results obtained for the surface area analysis of the produced biochars.
Temperature is one of the main factors that affects the structure and physicochemical properties of biochar. Temperature affects the decomposition, formation and transformation of biomass and thus differs from the surface functionality of biochar [27].
In the tests carried out and presented in Figure 9, the increase in temperature did not significantly increase the surface area of biochars B300, B350 and B400. As the temperature increased, the surface area increased; however, it was possible to observe that, in the biochars produced without any type of treatment, there was a reduction in the surface area associated with a greater production of tars that were embedded on the biochar surface, and when they were washed, they increased the area due to the removal of the tars. When the biochars underwent the hot water washing process, the results showed an increase in surface area from 198 m2g−1 to 226 m2g−1 when the temperature was raised from 300 to 400 °C, respectively. Biochar samples B300-A and B350-A, when compared to the biochars without treatment, showed that the activation process did not significantly improve the area, with an increase corresponding to approximately 16%. Sample B400-A was the biochar that obtained the best surface area; when compared to sample B400, it had a 133% increase in surface area. These results indicated that the greater the removal of volatile matter, the better the surface area.

4. Conclusions

The characteristics of the biochars produced at temperatures of 300, 350 and 400 °C are strongly influenced by the production temperature and, subsequently, by washing and activation treatments. This was indicated by the different physicochemical properties that the biochars presented.
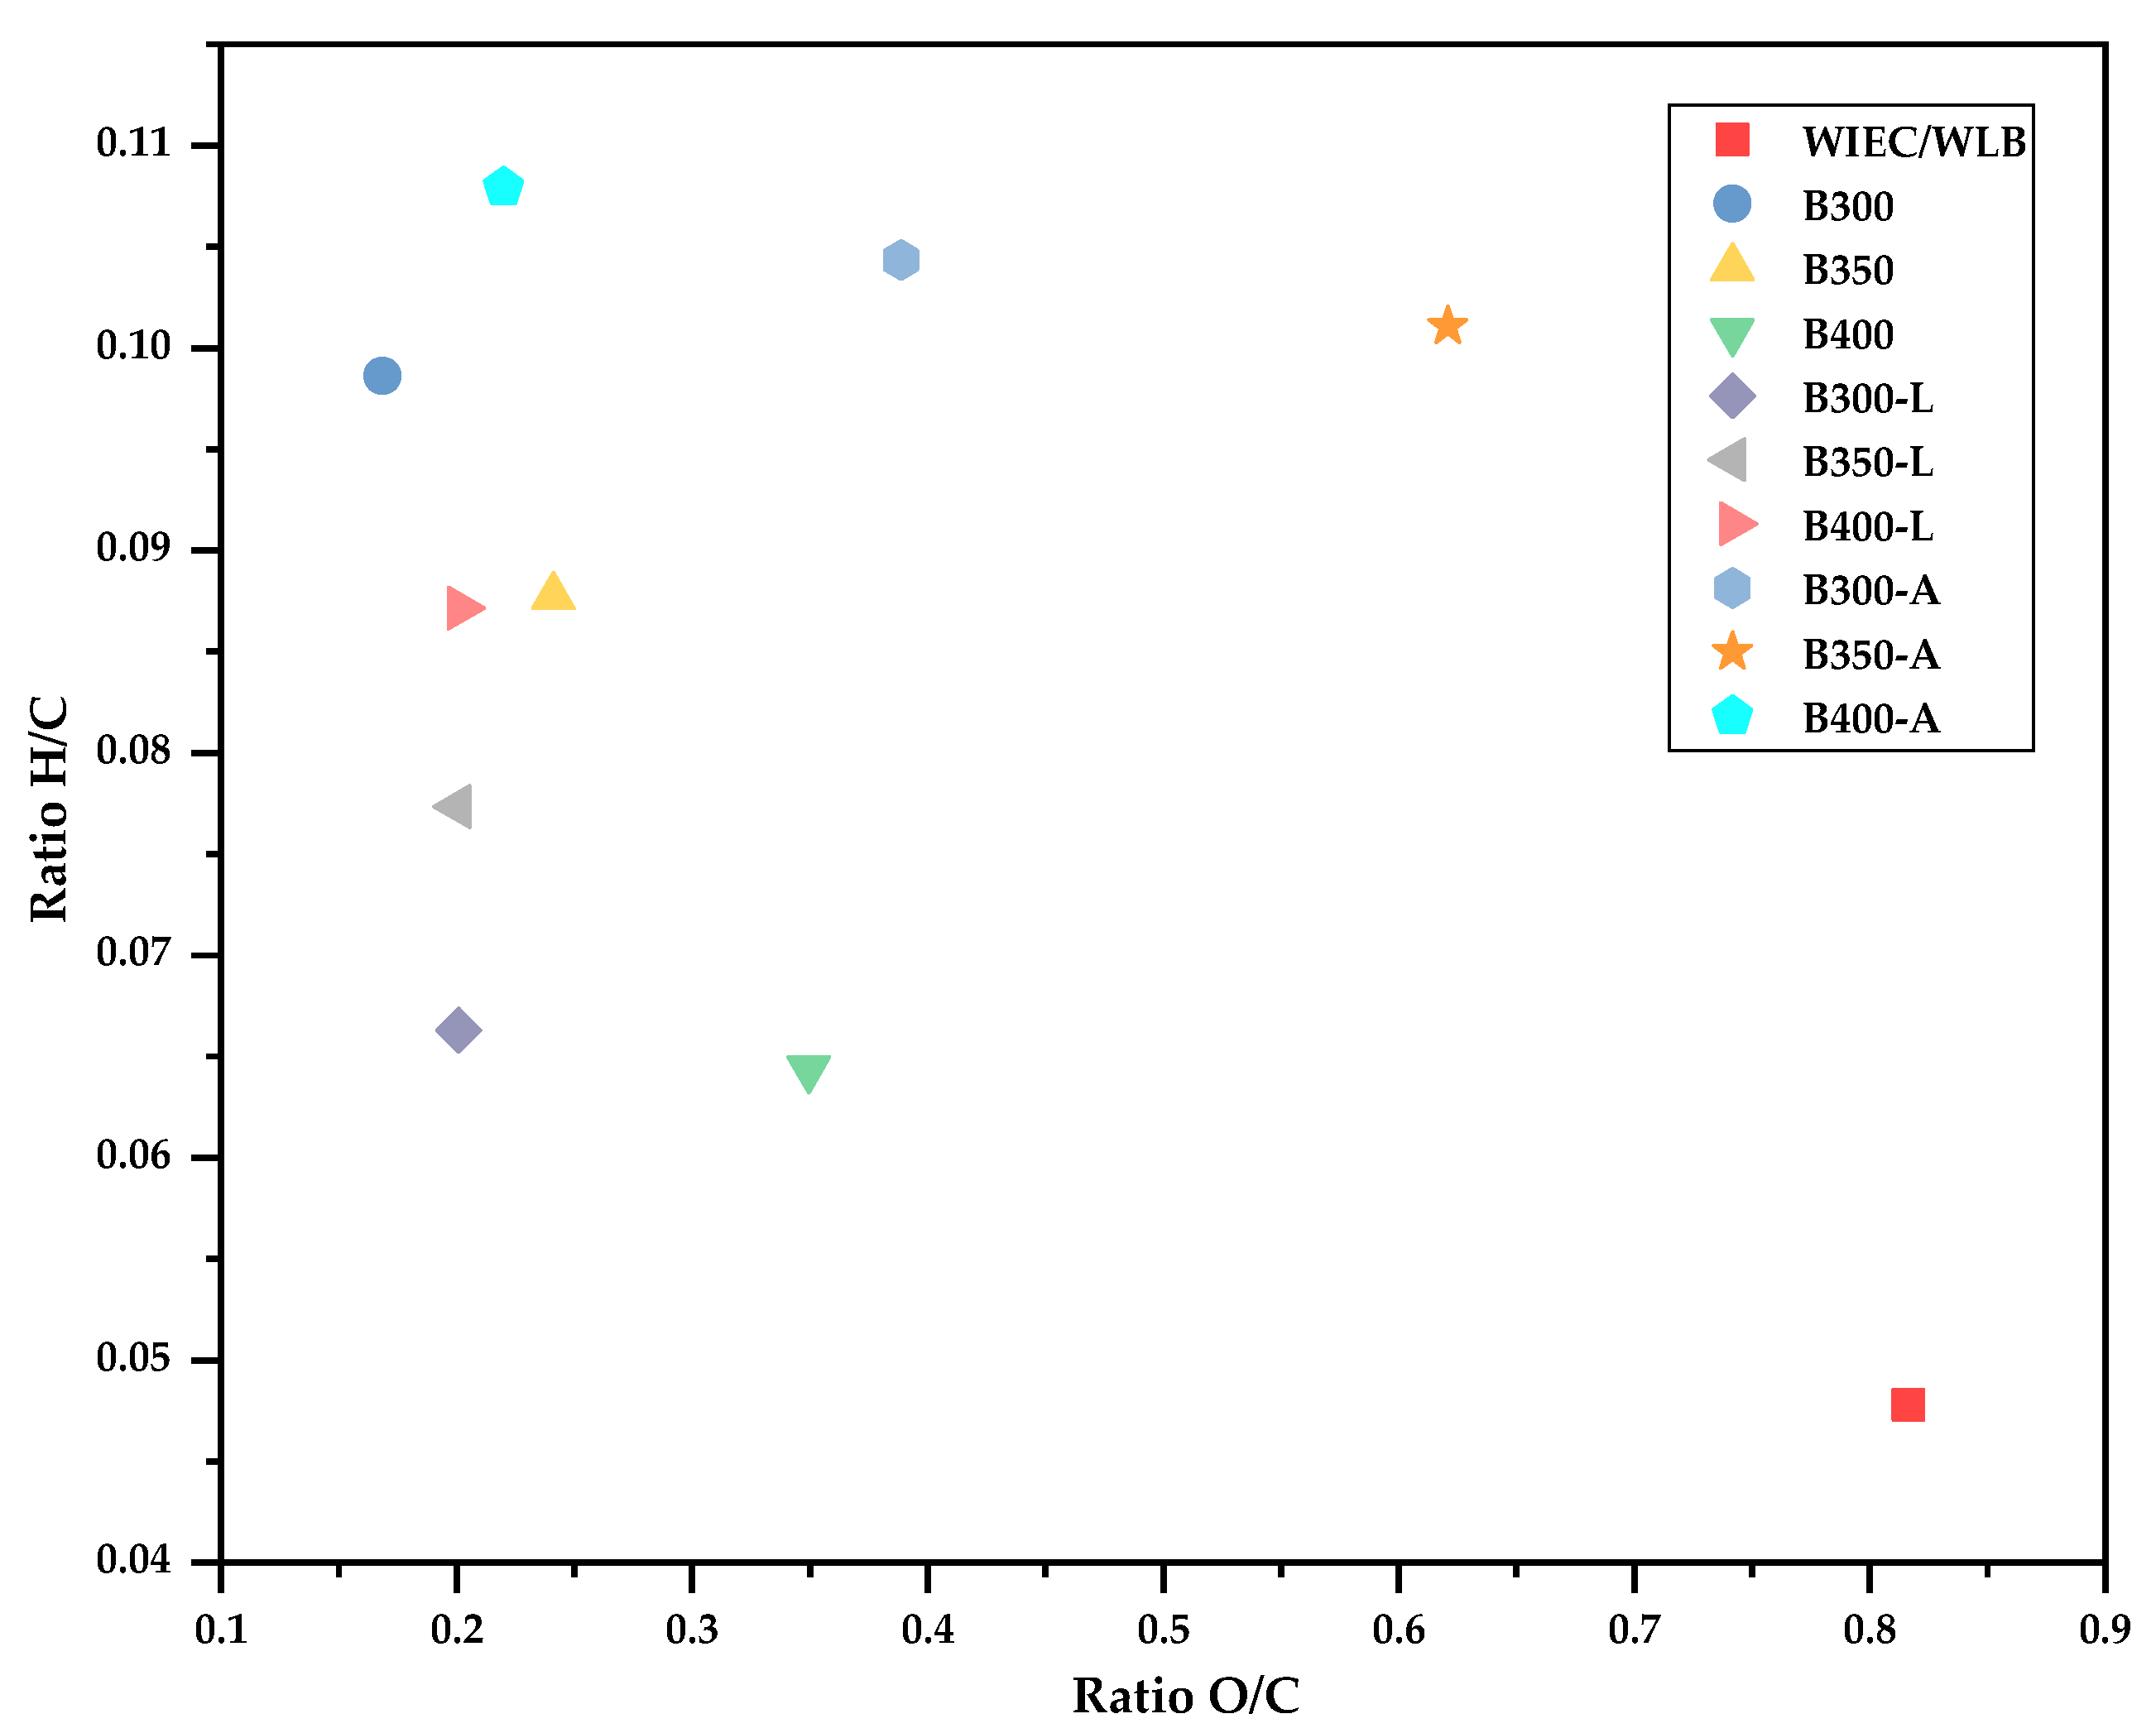
  • The percentage of carbon present in the original feedstock and in the produced biochars were similar, differing mainly in the percentage of oxygen, which was lower, and in the ash, which increased as the temperature increased.
  • The amount of volatile matter in the biochars was lower as the temperature of biochar production increased from 300 to 400 °C.
  • The mass yield of biochars was not influenced by the temperature increase, ranging between 70 and 75%.
  • The chlorine removal potential for biochars that were washed and activated was above 80%, demonstrating the efficiency of carbonization as a pretreatment for thermochemical processes to remove chlorinated compounds.
  • In the FTIR analysis, it was possible to observe that there was a great difference between the spectra of the untreated biochars and the washed biochars, indicating the removal of compounds that were on the surface, such as chlorine. Biochar produced at 400 °C showed the lowest peaks after washing.
  • In the analysis of the surfaces of the biochar samples, the differences between temperatures were more noticeable when the biochars were washed. When the activation process was carried out, the biochar samples produced at 300 and 350 °C were very similar, with the biochar produced at 400 °C having a higher surface area.
  • Some results for the 350 °C biochars were not similar to the behaviors of the biochars produced at 300 and 400 °C, indicating that, when making the feedstock mixture, the amount of plastic and small metals may have been higher, thus making the carbonization process more difficult.

Author Contributions

Conceptualization, R.M.-P., M.M.G., P.B. and J.S.; Formal analysis, R.M.-P., A.A. and A.L.; Investigation, C.N.; Methodology, R.M.-P., A.A. and L.C.-C.; Project administration, P.B.; Resources, M.M.G., P.B. and J.S.; Supervision, J.S., M.M.G. and P.B.; Visualization, R.M.-P. and A.A.; Writing—original draft, R.M.-P. and C.N. and Writing—review and editing, R.M.-P., A.A., C.N., J.S., M.M.G. and P.B. All authors have read and agreed to the published version of the manuscript.

Funding

This work was supported by national funds through the FCT—Fundação para a Ciência e a Tecnologia within the R&D Units VALORIZA (UIDB/05064/2020) and MEtRICs (UIDB/04077/2020-2023) and project ALT20-03-0145-FEDER-039485 - SynDiesel: Fuels for diesel engines from dedicated waste and crop thermal gasification, co-financed by the ERDF through the Regional Operational Program of Alentejo.

Data Availability Statement

The data presented in this study are available on request from the corresponding author.

Conflicts of Interest

The authors declare no conflict of interest.

References

  1. Liu, C.; Wang, H.; Karim, A.M.; Sun, J.; Wang, Y. Catalytic Fast Pyrolysis of Lignocellulosic Biomass. Chem. Soc. Rev. 2014, 43, 7594–7623. [Google Scholar] [CrossRef]
  2. Reen, S.; Chyuan, H.; Wayne, K.; Loke, P.; Phang, S.; Chuan, T.; Nagarajan, D.; Lee, D. Sustainable Approaches for Algae Utilisation in Bioenergy Production. Renew. Energy 2018, 129, 838–852. [Google Scholar] [CrossRef]
  3. Hoang, A.T.; Nizetic, S.; Ong, H.C.; Mofijur, M.; Ahmed, S.F.; Ashok, B.; Bui, V.T.V.; Chau, M.Q. Insight into the Recent Advances of Microwave Pretreatment Technologies for the Conversion of Lignocellulosic Biomass into Sustainable Biofuel. Chemosphere 2021, 281, 130878. [Google Scholar] [CrossRef] [PubMed]
  4. Bhutto, A.W.; Qureshi, K.; Abro, R.; Harijan, K.; Zhao, Z.; Bazmi, A.A.; Abbas, T.; Yu, G. Progress in Production of Biomass-to-Liquid Biofuels to Decarbonize Transport Sector-Prospectus and Challenges. RSC Adv. 2016, 6, 32140–32170. [Google Scholar] [CrossRef]
  5. Tuan, A.; Pham, V.V. 2-Methylfuran (MF) as a Potential Biofuel: A Thorough Review on the Production Pathway from Biomass, Combustion Progress, and Application in Engines. Renew. Sustain. Energy Rev. 2021, 148, 111265. [Google Scholar] [CrossRef]
  6. Forti, V.; Balde, C.P.; Kuehr, R.; Bel, G. The Global E-Waste Monitor 2020: Quantities, Flows and the Circular Economy Potential; United Nations University/United Nations Institute for Training and Research, International Telecommunication Union, and International Solid Waste Association: Geneva, Switzerland, 2020; Volume 3, pp. 1–120. [Google Scholar]
  7. Bhaskar, K.; Kumar, B. Electronic Waste Management and Sustainable Development Goals: Is There a Business Case for Linking the Two? J. Indian Bus. Res. 2019, 11, 120–137. [Google Scholar] [CrossRef]
  8. Khetriwal, D.S.; Kraeuchi, P.; Widmer, R. Producer Responsibility for E-Waste Management: Key Issues for Consideration—Learning from the Swiss Experience. J. Environ. Manag. 2009, 90, 153–165. [Google Scholar] [CrossRef]
  9. Widmer, R.; Oswald-Krapf, H.; Sinha-Khetriwal, D.; Schnellmann, M.; Böni, H. Global Perspectives on E-Waste. Environ. Impact Assess. Rev. 2005, 25, 436–458. [Google Scholar] [CrossRef]
  10. Andrade, D.F.; Castro, J.P.; Garcia, J.A.; Machado, R.C.; Pereira-Filho, E.R.; Amarasiriwardena, D. Analytical and Reclamation Technologies for Identification and Recycling of Precious Materials from Waste Computer and Mobile Phones. Chemosphere 2022, 286, 131739. [Google Scholar] [CrossRef]
  11. Perkins, D.N.; Brune Drisse, M.N.; Nxele, T.; Sly, P.D. E-Waste: A Global Hazard. Ann. Glob. Health 2014, 80, 286–295. [Google Scholar] [CrossRef]
  12. Forti, V.; Baldé, K.; Kuehr, R. E-Waste Statistics: Guidelines on Classifications, Reporting and Indicators; United Nations University: Bonn, Germany, 2018; ISBN 9789280890662. [Google Scholar]
  13. Ilankoon, I.M.S.K.; Ghorbani, Y.; Nan, M.; Herath, G.; Moyo, T. E-Waste in the International Context—A Review of Trade Flows, Regulations, Hazards, Waste Management Strategies and Technologies for Value Recovery. Waste Manag. 2018, 82, 258–275. [Google Scholar] [CrossRef] [PubMed]
  14. Zeng, X.; Ali, S.H.; Tian, J.; Li, J. Mapping Anthropogenic Mineral Generation in China and Its Implications for a Circular Economy. Nat. Commun. 2020, 11, 1544. [Google Scholar] [CrossRef]
  15. Wu, X.; Li, J.; Yao, L.; Xu, Z. Auto-Sorting Commonly Recovered Plastics from Waste Household Appliances and Electronics Using near-Infrared Spectroscopy. J. Clean. Prod. 2020, 246, 118732. [Google Scholar] [CrossRef]
  16. Martinho, G.; Pires, A.; Saraiva, L.; Ribeiro, R. Composition of Plastics from Waste Electrical and Electronic Equipment (WEEE) by Direct Sampling. Waste Manag. 2012, 32, 1213–1217. [Google Scholar] [CrossRef] [PubMed]
  17. Liu, X.; Lu, X.; Feng, Y.; Zhang, L.; Yuan, Z. Recycled WEEE Plastics in China: Generation Trend and Environmental Impacts. Resour. Conserv. Recycl. 2022, 177, 105978. [Google Scholar] [CrossRef]
  18. Kumar, G.; Dharmaraja, J.; Arvindnarayan, S.; Shoban, S. A Comprehensive Review on Thermochemical, Biological, Biochemical and Hybrid Conversion Methods of Bio-Derived Lignocellulosic Molecules into Renewable Fuels. Fuel 2019, 251, 352–367. [Google Scholar] [CrossRef]
  19. Chatterjee, C.; Pong, F.; Sen, A. Chemical Conversion Pathways for Carbohydrates. Green Chem. 2015, 17, 40–71. [Google Scholar] [CrossRef]
  20. Gong, J.; Chen, X.; Tang, T. Recent Progress in Controlled Carbonization of (Waste) Polymers. Prog. Polym. Sci. 2019, 94, 1–32. [Google Scholar] [CrossRef]
  21. Taherymoosavi, S.; Verheyen, V.; Munroe, P.; Joseph, S.; Reynolds, A. Characterization of Organic Compounds in Biochars Derived from Municipal Solid Waste. Waste Manag. 2017, 67, 131–142. [Google Scholar] [CrossRef]
  22. Huang, J.; Qiao, Y.; Wei, X.; Zhou, J.; Yu, Y.; Xu, M. Effect of Torrefaction on Steam Gasification of Starchy Food Waste. Fuel 2019, 253, 1556–1564. [Google Scholar] [CrossRef]
  23. Zheng, A.; Fan, Y.; Wei, G.; Zhao, K.; Huang, Z.; Zhao, Z.; Li, H. Chemical Looping Gasification of Torrefied Biomass Using NiFe2O4 as an Oxygen Carrier for Syngas Production and Tar Removal. Energy Fuels 2020, 34, 6008–6019. [Google Scholar] [CrossRef]
  24. Laird, D.A. The Charcoal Vision: A Win-Win-Win Scenario for Simultaneously Producing Bioenergy, Permanently Sequestering Carbon, While Improving Soil and Water Quality. Agron. J. 2008, 100, 178–181. [Google Scholar] [CrossRef]
  25. Brown, R.C.; Amonette, J.E.; National, N. Review of the Pyrolysis Platform for Coproducing Bio-Oil and Biochar. Biofuels Bioprod. Biorefining 2009, 3, 547–562. [Google Scholar]
  26. Brewer, C.E.; Unger, R.; Schmidt-rohr, K.; Brown, R.C. Criteria to Select Biochars for Field Studies Based on Biochar Chemical Properties. BioEnergy Res. 2011, 4, 312–323. [Google Scholar] [CrossRef]
  27. Kumar, A.; Saini, K.; Bhaskar, T. Bioresource Technology Hydochar and Biochar: Production, Physicochemical Properties and Techno- Economic Analysis. Bioresour. Technol. 2020, 310, 123442. [Google Scholar] [CrossRef]
  28. Guo, S.; Dong, X.; Wu, T.; Zhu, C. Influence of Reaction Conditions and Feedstock on Hydrochar Properties. Energy Convers. Manag. 2016, 123, 95–103. [Google Scholar] [CrossRef]
  29. Leng, L.; Huang, H. An Overview of the Effect of Pyrolysis Process Parameters on Biochar Stability. Bioresour. Technol. 2018, 270, 627–642. [Google Scholar] [CrossRef]
  30. Dai, L.; Wang, Y.; Liu, Y.; He, C.; Ruan, R.; Yu, Z.; Jiang, L. A Review on Selective Production of Value-Added Chemicals via Catalytic Pyrolysis of Lignocellulosic Biomass. Sci. Total Environ. 2020, 749, 142386. [Google Scholar] [CrossRef]
  31. Atienza-martínez, M.; Gea, G.; Plaza, D.; Lu, F. Pyrolysis of Cashew Nutshells: Characterization of Products and Energy Balance. Energy 2018, 158, 72–80. [Google Scholar] [CrossRef]
  32. Mota-Panizio, R.; Hermoso-Orzáez, M.J.; Carmo-Calado, L.; Calado, H.; Goncalves, M.M.; Brito, P. Co-Carbonization of a Mixture of Waste Insulation Electric Cables (WIEC) and Lignocellulosic Waste, for the Removal of Chlorine: Biochar Properties and Their Behaviors. Fuel 2022, 320, 123932. [Google Scholar] [CrossRef]
  33. Liu, Z. The Fate of Fluorine and Chlorine during Thermal Treatment of Coals. Environ. Sci. Technol. 2006, 40, 7886–7889. [Google Scholar]
  34. Longo, A.; Nobre, C.; Sen, A.; Panizio, R.; Brito, P.; Gonçalves, M. Torrefaction Upgrading of Heterogenous Wastes Containing Cork and Chlorinated Polymers. Environments 2022, 9, 99. [Google Scholar] [CrossRef]
  35. Yang, W.; Wang, H.; Zhang, M.; Zhu, J.; Zhou, J.; Wu, S. Fuel Properties and Combustion Kinetics of Hydrochar Prepared by Hydrothermal Carbonization of Bamboo. Bioresour. Technol. 2016, 205, 199–204. [Google Scholar] [CrossRef] [PubMed]
  36. Xuan, Y.; Hua, Y.; Mubarak, N.M.; Kansedo, J.; Khalid, M.; Lokman, M.; Ghasemi, M. A Review on Biochar Production from Different Biomass Wastes by Recent Carbonization Technologies and Its Sustainable Applications. J. Environ. Chem. Eng. 2022, 10, 107017. [Google Scholar] [CrossRef]
  37. Funke, A.; Ziegler, F.; Berlin, T.U. Hydrothermal Carbonization of Biomass: A Summary and Discussion of Chemical Mechanisms for Process Engineering. Biofuels Bioprod. Biorefining 2010, 4, 160–177. [Google Scholar] [CrossRef]
  38. Zimmerman, A.R.; Hall, W.; Box, P.O. Abiotic and Microbial Oxidation of Laboratory-Produced Black Carbon (Biochar). Environ. Sci. Technol. 2010, 44, 1295–1301. [Google Scholar] [CrossRef]
  39. Manyà, J.J.; Ortigosa, M.A.; Laguarta, S.; Manso, J.A. Experimental Study on the Effect of Pyrolysis Pressure, Peak Temperature, and Particle Size on the Potential Stability of Vine Shoots-Derived Biochar. Fuel 2014, 133, 163–172. [Google Scholar] [CrossRef]
  40. Spokas, K.A. Review of the Stability of Biochar in Soils: Predictability of O: C Molar Ratios Review of the Stability of Biochar in Soils: Predictability of O:C Molar Ratios. Carbon Manag. 2014, 3004, 289–303. [Google Scholar] [CrossRef]
  41. Budai, A.; Calucci, L.; Rasse, D.P.; Tau, L.; Pengerud, A.; Wiedemeier, D.; Abiven, S.; Forte, C. Effects of Pyrolysis Conditions on Miscanthus and Corncob Chars: Characterization by IR, Solid State NMR and BPCA Analysis. J. Anal. Appl. Pyrolysis 2017, 128, 335–345. [Google Scholar] [CrossRef]
  42. Kuhlbusch, T.A.J. Method for Determining Black Carbon in Residues of Vegetation Fires. Environ. Sci. Technol. 1995, 29, 2695–2702. [Google Scholar] [CrossRef]
  43. Yasuhara, A.; Amano, Y.; Shibamoto, T. Investigation of the Self-Heating and Spontaneous Ignition of Refuse-Derived Fuel (RDF) during Storage. Waste Manag. 2010, 30, 1161–1164. [Google Scholar] [CrossRef] [PubMed]
  44. Sajjad, M.; Aamer, M.; Taha, S.; Taqvi, H. Pyrolysis, Kinetics Analysis, Thermodynamics Parameters and Reaction Mechanism of Typha Latifolia to Evaluate Its Bioenergy Potential. Bioresour. Technol. 2017, 245, 491–501. [Google Scholar] [CrossRef]
  45. Zornoza, R.; Moreno-Barriga, F.; Acosta, J.A.; Muñoz, M.A.; Faz, A. Stability, Nutrient Availability and Hydrophobicity of Biochars Derived from Manure, Crop Residues, and Municipal Solid Waste for Their Use as Soil Amendments. Chemosph. J. 2016, 144, 122–130. [Google Scholar] [CrossRef] [PubMed]
  46. Kan, T.; Strezov, V.; Evans, T. Effect of the Heating Rate on the Thermochemical Behavior and Biofuel Properties of Sewage Sludge Pyrolysis. Eenrgy Fuels 2016, 30, 1564–1570. [Google Scholar] [CrossRef]
  47. Folgueras, M.B.; Alonso, M.; Díaz, R.M. Influence of Sewage Sludge Treatment on Pyrolysis and Combustion of Dry Sludge. Energy 2013, 55, 426–435. [Google Scholar] [CrossRef]
  48. López, A.; De Marco, I.; Caballero, B.M.; Laresgoiti, M.F.; Adrados, A. Influence of Time and Temperature on Pyrolysis of Plastic Wastes in a Semi-Batch Reactor. Chem. Eng. J. 2011, 173, 62–71. [Google Scholar] [CrossRef]
  49. Yang, H.; Yan, R.; Chen, H.; Lee, D.H.; Zheng, C. Characteristics of Hemicellulose, Cellulose and Lignin Pyrolysis. Fuel 2007, 86, 1781–1788. [Google Scholar] [CrossRef]
  50. Zaker, A.; Chen, Z.; Zaheer-uddin, M.; Guo, J. Co-Pyrolysis of Sewage Sludge and Low-Density Polyethylene—A Thermogravimetric Study of Thermo-Kinetics and Thermodynamic Parameters. J. Environ. Chem. Eng. 2021, 9, 104554. [Google Scholar] [CrossRef]
  51. Nobre, C.; Vilarinho, C.; Alves, O.; Mendes, B.; Gonçalves, M. Upgrading of Refuse Derived Fuel through Torrefaction and Carbonization: Evaluation of RDF Char Fuel Properties. Energy 2019, 181, 66–76. [Google Scholar] [CrossRef]
  52. Movasaghi, Z.; Rehman, S.; Rehman, I. Fourier Transform Infrared (FTIR) Spectroscopy of Biological Tissues. Appl. Spectrosc. Rev. 2008, 43, 134–179. [Google Scholar] [CrossRef]
  53. Preston, C.M.; Schmidt, M.W.I. Black (Pyrogenic) Carbon: A Synthesis of Current Knowledge and Uncertainties with Special Consideration of Boreal Regions. Biogeosciences 2006, 3, 397–420. [Google Scholar] [CrossRef]
  54. IR Spectrum Table & Chart. Available online: https://www.sigmaaldrich.com/technical-documents/articles/biology/ir-spectrum-table.html#ir-spectrum-table-by-range (accessed on 5 May 2023).
  55. Destainville, A.; Champion, E.; Laborde, E. Synthesis, Characterization and Thermal Behavior of Apatitic Tricalcium Phosphate. Mater. Chem. Phys. 2003, 80, 269–277. [Google Scholar] [CrossRef]
  56. Tehreem, S.; Yousra, M.; Alamer, K.H.; Alsudays, I.M.; Sarwar, S.; Kamal, A.; Naeem, S. Analysis of the Role of Various Biochar in the Remediation of Heavy Metals in Contaminated Water and Its Kinetics Study. J. Saudi Chem. Soc. 2022, 26, 101518. [Google Scholar] [CrossRef]
  57. Kakuta, Y. Study on Chlorine Removal from Mixture of Waste Plastics. Waste Manag. 2008, 28, 615–621. [Google Scholar] [CrossRef] [PubMed]
  58. Galinato, S.P.; Yoder, J.K.; Granatstein, D. The Economic Value of Biochar in Crop Production and Carbon Sequestration. Energy Policy 2011, 39, 6344–6350. [Google Scholar] [CrossRef]
  59. Di Natale, F.; Erto, A.; Lancia, A. Desorption of Arsenic from Exhaust Activated Carbons Used for Water Purification. J. Hazard. Mater. 2013, 260, 451–458. [Google Scholar] [CrossRef]
  60. Mubarak, N.M.; Alicia, R.F.; Abdullah, E.C.; Sahu, J.N.; Haslija, A.B.A.; Tan, J. Statistical Optimization and Kinetic Studies on Removal of Zn 2 + Using Functionalized Carbon Nanotubes and Magnetic Biochar. J. Environ. Chem. Eng. 2013, 1, 486–495. [Google Scholar] [CrossRef]
  61. Bernard, B.; He, X.; Wang, S.; Abomohra, A.E.; Hu, Y.; Wang, Q. Co-Pyrolysis of Biomass and Waste Plastics as a Thermochemical Conversion Technology for High-Grade Biofuel Production: Recent Progress and Future Directions Elsewhere Worldwide. Energy Convers. Manag. 2018, 163, 468–492. [Google Scholar] [CrossRef]
Figure 1. Mixture of WIEC and WLB used for the carbonization tests on a pilot scale.
Carbon 09 00049 g001
Figure 2. Schematic representation of the carbonization system on a pilot scale.
Carbon 09 00049 g002
Figure 3. Evaluation parameters of the biochar production process.
Carbon 09 00049 g003
Figure 4. The van Krevelen diagram of the produced biochars.
Carbon 09 00049 g004
Figure 5. Thermogravimetric profiles. (a) TGA—raw biochars, (b) DTG—raw biochars, (c) TGA—washed biochars, (d) DTG—washed biochars, (e) TGA—activated biochars and (f) DTG—activated biochars.
Carbon 09 00049 g005aCarbon 09 00049 g005bCarbon 09 00049 g005c
Figure 6. Mass yield, ash content, chlorine removal potential and bulk density for different biochars.
Carbon 09 00049 g006
Figure 7. Mineral compositions of the produced biochars expressed in mg/kg of ash.
Carbon 09 00049 g007
Figure 8. FTIR spectra: (a) biochars produced at 300 °C, (b) biochars produced at 350 °C and (c) biochars produced at 400 °C.
Carbon 09 00049 g008aCarbon 09 00049 g008b
Figure 9. Surface area of all the biochar samples produced in this work.
Carbon 09 00049 g009
Table 1. Processing conditions for each biochar sample.
SampleTemperatureFeatures
B300300Biochars were produced at different temperatures.
B350350
B400400
B300-L300Biochars were washed in hot water, filtered and dried.
B350-L350
B400-L400
B300-A300Biochars were washed in hot water, filtered and dried and were submitted to an activation process with KOH 2 N.
B350-A350
B400-A400
Table 2. Elemental analysis, HHV and LHV of the original mixture and the different biochar samples.
ParametersWIEC/WLBB300B350B400B300-LB350-LB400-LB300-AB350-AB400-A
C (wt.%, db)52.340.7742.6443.9542.3843.0643.1441.5935.2247.44
H (wt.%, db)2.54.023.742.832.813.333.764.343.565.12
N (wt.%, db)0.25.084.244.0112.911.3810.410.90.850.51
S (wt.%, db)<d.l.<d.l.<d.l.<d.l.<d.l.<d.l.<d.l.<d.l.<d.l.<d.l.
O (wt.%, db)45.050.1349.3849.2141.9142.2342.6953.1760.3746.93
HHV (MJ/kg, db)21.2318.1518.2718.4519.619.6719.71---
LHV (MJ/kg, db)19.8815.9816.2516.9218.0817.8717.68---
Disclaimer/Publisher’s Note: The statements, opinions and data contained in all publications are solely those of the individual author(s) and contributor(s) and not of MDPI and/or the editor(s). MDPI and/or the editor(s) disclaim responsibility for any injury to people or property resulting from any ideas, methods, instructions or products referred to in the content.

