Article

Fabrication of an Electrocatalyst Based on Rare Earth Manganites Incorporated with Carbon Nanofiber Hybrids: An Efficient Electrochemical Biosensor for the Detection of Anti-Inflammatory Drug Mefenamic Acid

by
Saranvignesh Alagarsamy
1,
Ruspika Sundaresan
1,
Shen-Ming Chen
1,*,
J. Meena Devi
2,
Narendhar Chandrasekar
3 and
Balaji Ramachandran
4,*
1
Department of Chemical Engineering and Biotechnology, National Taipei University of Technology, No. 1, Section 3, Chung-Hsiao East Road, Taipei 106, Taiwan
2
Center for Nanotechnology and Advanced Biomaterials (CeNTAB), Department of Physics, School of Electrical and Electronics Engineering (SEEE), SASTRA Deemed University, Thanjavur 613401, Tamil Nadu, India
3
Department of BioNano Technology, Gachon University, Seongnam 13120, Gyeonggi, Republic of Korea
4
Department of Electronics and Communication Engineering, Koneru Lakshmaiah Education Foundation, Vijayawada 522302, Andhra Pradesh, India
*
Authors to whom correspondence should be addressed.
Submission received: 13 February 2023 / Revised: 21 April 2023 / Accepted: 4 May 2023 / Published: 6 May 2023
(This article belongs to the Special Issue Carbon Nanohybrids for Biomedical Applications)

Abstract

:
Pharmaceutical and personal care products are emerging as a new category of environmental pollution. Analytical drug detection from a biological sample for detection is still crucial today. Mefenamic acid (MA) is an anti-inflammatory drug utilized for its antipyretic and analgesic properties, which is harmful to patients at higher dosages and is also recognized as a chemical pollutant that harms the environment. In this view, Dysprosium manganite/carbon nanofiber (DMO/CNF) was prepared by hydrothermal method for the electrochemical detection of MA. DMO/CNF/GCE exhibits high selectivity, excellent anti-interference, good stability, and reproducibility toward the detection of MA. The enhanced electrochemical performance of DMO/CNF/GCE was attributed to their synergetic interaction. Under optimized conditions, DMO/CNF/GCE shows a wide linear range of 0.01–741 μM and a low LOD of 0.009 μM. Satisfactory recoveries were obtained for human blood and tablet samples. Thus, the proposed DMO/CNF nanocomposite emerges as a promising material for the detection of MA.

1. Introduction

Mefenamic acid (MA) is chemically an N-substituted phenylantharanilic acid (N-(2,3-dimethyl phenyl)-2-aminobenzoic acid), and it is a non-steroidal anti-inflammatory drug (NSAID) available in the form of tablets, capsules, and suspensions. MA compound exists as white or light gray crystalline powder and has extremely low solubility in water. MA exhibit antipyretic, anti-inflammatory, and analgesic activities [1]. The pathophysiological functions of MA are implemented by its ability to inhibit the biosynthesis of prostaglandin involved in pathogen diseases. MA is used to treat rheumatoid arthritis, osteoarthritis, autoimmune hemolytic anemia, sports injuries, gastrointestinal disorders, primary dysmenorrhea muscle pain, back pain, and dental pain [2,3,4,5]. As MA works on cyclooxygenase (COX) pathways and suppresses prostaglandin, the sensations of pain are momentarily lessened. Due to its massive production and presence in sewage water, MA is evolving into an environmental pollutant that is found in surface water. MA is quickly absorbed after oral consumption. The intake of overdosage and excessive concentration of MA in the body produces toxic metabolite accumulation, which could lead to clinical symptoms, such as fatigue, diarrhea, acute hepatic gastrointestinal side effects, liver injury, and necrosis, resulting in morbidity and mortality in humans [6]. Therefore, the fast detection and estimation of the concentration of MA at an early stage are crucial in medical and drug research, and in environmental science. The various analytical methods followed for the quantitative determination of mefenamic acid in both pharmaceutical and biological samples are spectrophotometry [7], chromatography [8], chemiluminescence [9], capillary electrophoresis [10], flow injection analysis [11], and high-performance liquid chromatography [12]. However, these techniques require expensive equipment, solvent, a large volume of biological samples, time-consuming, laborious extraction steps, and a lack of portability for on-site and fast detection. Hence, there is a necessity and demand for the development of simple, time-effective, low-cost, and environmentally friendly analytical methods for this biological analyte.
Electrochemical techniques have been employed extensively in recent years to detect and sense the electrochemically active biological molecules and drug molecules in various biological samples [13,14,15,16]. The electrochemical methods have the unique advantage of high sensitivity and selectivity, fast response, cost-effectiveness, robustness, easy installation, simple handling, and portability of the device for on-site detection [17,18]. The electrochemical sensors based on novel nanohybrids are emerging as efficient sensors since the nanostructures offer faster electron transfer and enhanced electro-catalysis. The nanomaterials-modified electrode includes carbon nanotube/gold electrode [19], MWCNT/Chitosan/carbon paste electrode [20], ionic liquid/MWCNT/Chitosan [21], silver-TiO2/carbon paste electrode [22], ruthenium-doped TiO2 nanoparticles loaded into multi-walled carbon nanotubes [23], mesoporous polymeric graphitic-C3N4/polyaniline/CdO [24], NiO-SWCNT and 2,4-dimethyl-N/-[1-(2,3-dihydroxy phenyl) methylidene] aniline [25], and Cu nanoparticles [26].
Recently carbon nanofibers have been widely used as an electrochemical sensing device due to their high metallic conductivity, high mechanical strength, low density, excellent electro-catalytic activity, chemical stability, enormous surface area, and biocompatibility [27,28,29,30]. The combination of nanofibers with Manganites (𝑅Mn2O5) may provide enhanced electrochemical sensing performance for the determination of MA [31]. DyMn2O5 is of particular interest among the RMn2O5 compounds because of its different magnetic structure compared to the other compounds in the same family [32]. Manganites 𝑅Mn2O5 belong to the family of multiferroics (where R = Tb, Ho, Dy), and it accommodates both the 4f and 3d magnetic ions with strong Dy-Mn (4f-3d) couplings [33]. These materials possess complex magnetic structures, and ferroelectric and magnetic properties [33,34,35]. The ferroelectric properties of DyMn2O5 have been well-studied by various international research groups [36,37,38,39,40,41,42]. Khataee et al. [43] have prepared Dysprosium-doped ZnO nanoparticles using the sonochemical method for the photocatalytic degradation of a textile dye under visible light irradiation.
There is no literature reported on the application of Dysprosium Manganese (V) Oxide for the fabrication of electrochemical sensors for quantifying MA. In the present research work, we have developed the nanocomposite of DyMn2O5 (DMO) decorated carbon nanofibers for the ultra-sensitive detection of MA using the electrochemical method. The combination of carbon nanofibers with both ferroelectric and magnetic DMO was optimized to generate excellent electro-catalytic material modified on a glassy carbon electrode. This ferroelectric and magnetic nanocomposite will increase the sensor sensitivity and hence lowers the limit of detection of bioactive molecules. The developed electrochemical nanosensor based on DMO for MA may be used in other biological, pharmaceutical, and environmental samples for the rapid and ultra-sensitive detection of MA.

2. Experiments and Methods

2.1. Chemical Reagents

Dysprosium(III) nitrate hydrate (Dy(NO3)3·H2O, 99.9%), magnesium nitrate hexahydrate (Mn(NO3)2·6H2O,99.9%), sodium phosphate monobasic dihydrate (NaH2PO4·2H2O, ≥99.0%), sodium phosphate dibasic (Na2HPO4, ≥99.0%), potassium ferrocyanide (K4[Fe(CN)6]), potassium ferricyanide (K3[Fe(CN)6]), potassium chloride (KCl, 99.0–100.5%), hydrochloric acid (HCl, 36.5–38%), and mefenamic acid were purchased from Sigma Aldrich and used without further purification. Deionized (DI) water and ethanol were used for solution-making and other washing purposes throughout the experiments.

2.2. Materials Characterization

The morphology of the synthesized material was investigated by various techniques, such as field emission scanning electron microscopy (FESEM, Hitachi S-3000 H) and high-resolution transmission electron microscopy (HRTEM, H-7600, Hitachi, Japan). The chemical composition and the individual elemental percentage were investigated through an energy-dispersive X-ray (EDX, HORIBA EMAX X-ACT, Sensor +24 V = 16 W, resolution at 5.9 k eV) attached to the HRTEM. Powder X-ray diffraction (XRD, XPERT-PRO, PAN analytical B.V., Breda, The Netherlands) and the diffractometer with Cu Kα radiation (k = 1.54 Å) were used to investigate the crystallographic structure of all synthesized materials. The data of the Raman spectrum was collected from the Micro-Raman spectrometer (Raman Dong Woo 500 I, Seoul, Republic of Korea). Electrochemical impedance spectroscopy (EIS) was used to identify the materials and electrochemical measurements were performed in the electrochemical workstation in (5 mM [Fe(CN)6]3−/4−) FC solution and 0.1 M KCl solution, and cyclic voltammetry (CV CHI 1205a) and differential pulse voltammetry (DPV, CHI 900), both made in the United States. These experiments were carried out using a three-electrode system with a glassy carbon electrode (GCE) as the working electrode (electrode surface area = 0.071 cm2), a saturated Ag/AgCl as the reference electrode, and platinum as the counter electrode in the presence of N2 gas saturated 0.1 M PB supporting electrolyte (pH 7.0).

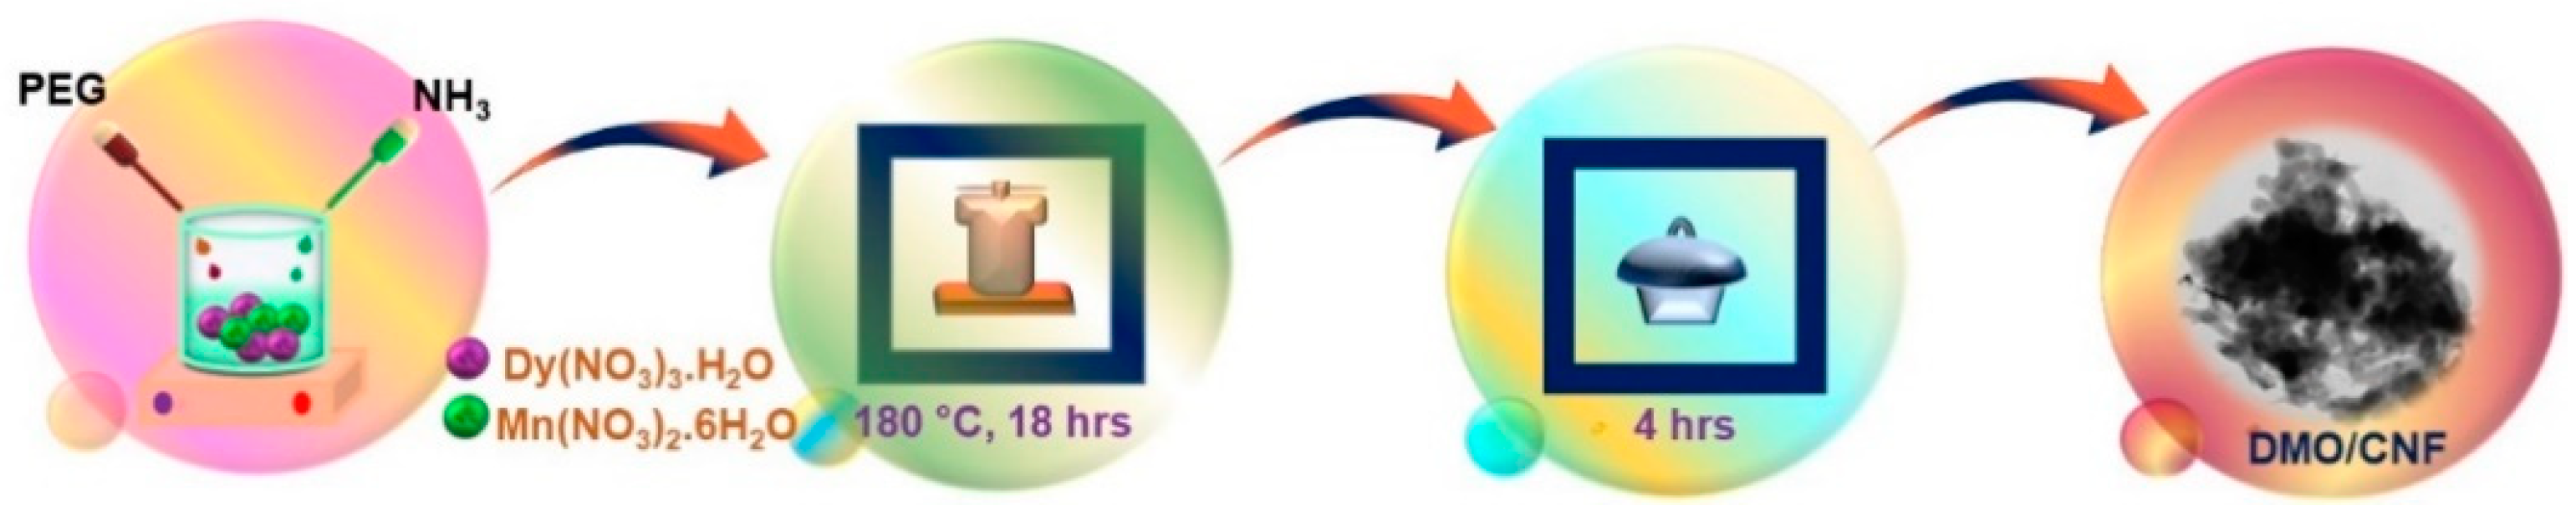
2.3. Synthesis Procedure of DMO/CNF

Initially, distilled water was thoroughly mixed with Dy(NO3)3·H2O and Mn(NO3)2·6H2O were dissolved in a stoichiometric ratio. Then, PEG was added to the aforementioned solution as a capping agent. By combining with NH3, the solution’s ultimate pH was set at 8. The mixture was put in an autoclave lined with Teflon and aged at 180 °C for 18 h. An as-prepared sample was then calcined for 4 h to eliminate the organic component. The prepared DMO sample and CNF were dissolved in 1 mL of DMF and sonicated for 30 min to get a homogeneous mixture of DMO/CNF nanocomposite. The specific synthesis procedure was represented in Scheme 1.

2.4. Fabrication of DMO/f-CNF/GCE

Deionized water is used to clean the carbon surface of the glassy carbon electrode. The prepared DMO/f-CNF/GCE was then dispersed in 1 mL of water and sonicated for 15 min. Following that, 6 × 10⁻⁶ L of DMO/f-CNF/GCE suspension was drop-casted on the carbon surface of GCE and dried in a 50 °C oven. Lastly, the electrochemical characterization was performed on the as-prepared DMO/f-CNF/GCE.

3. Result and Discussion

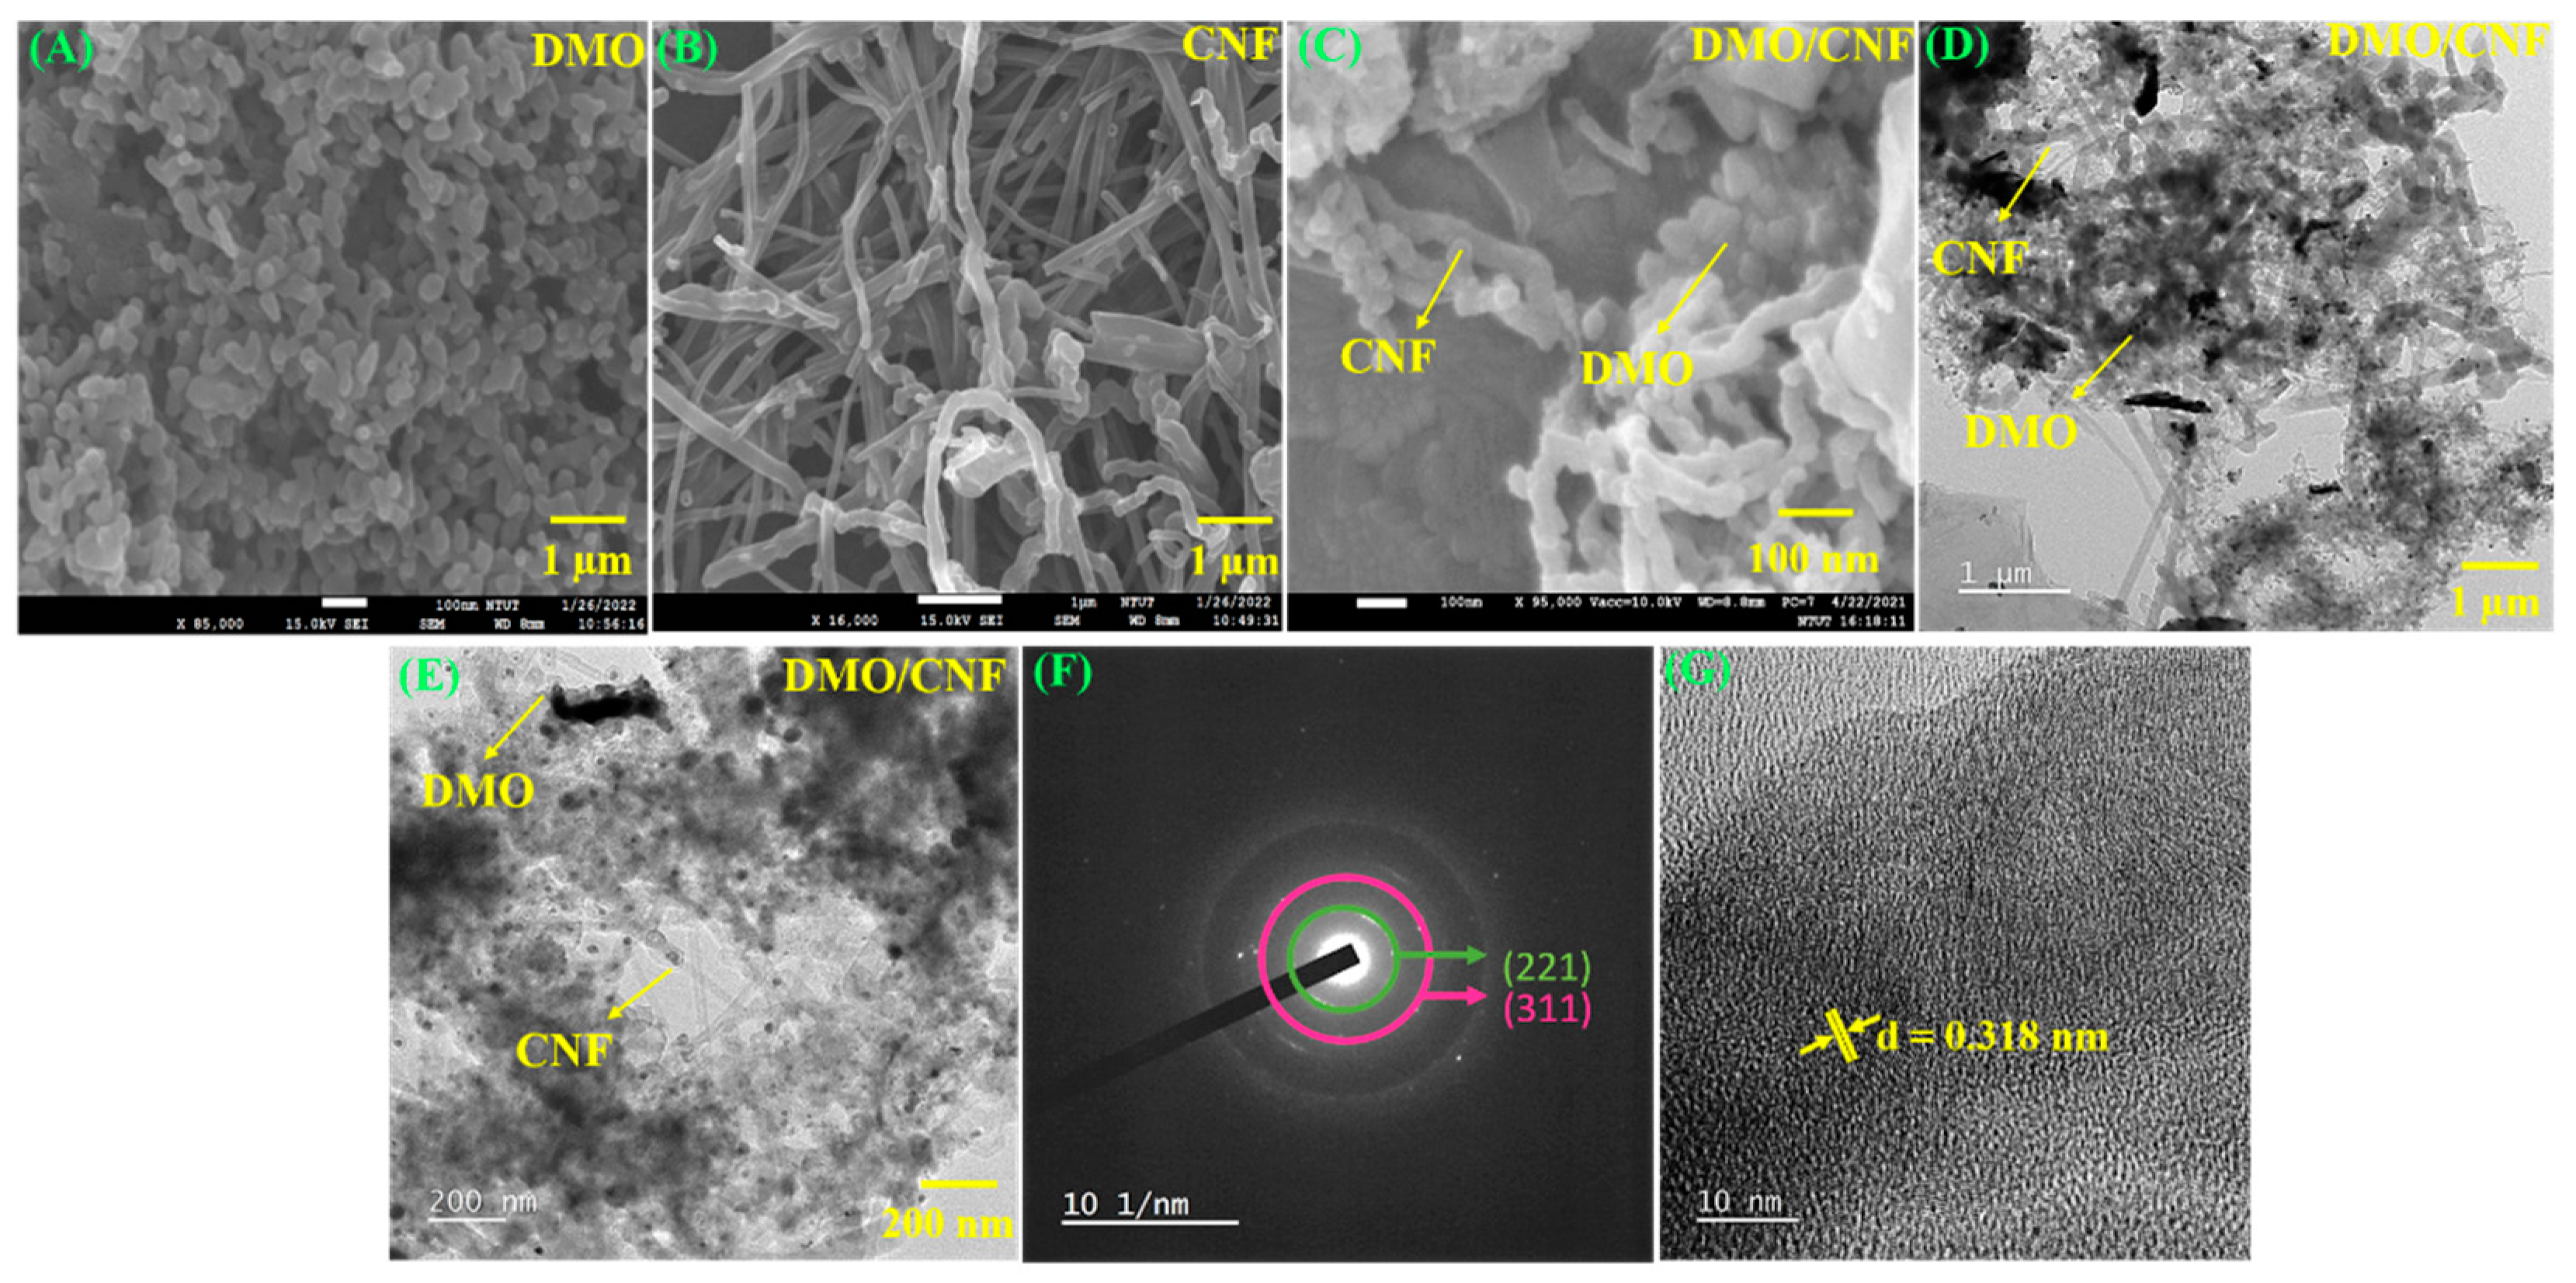
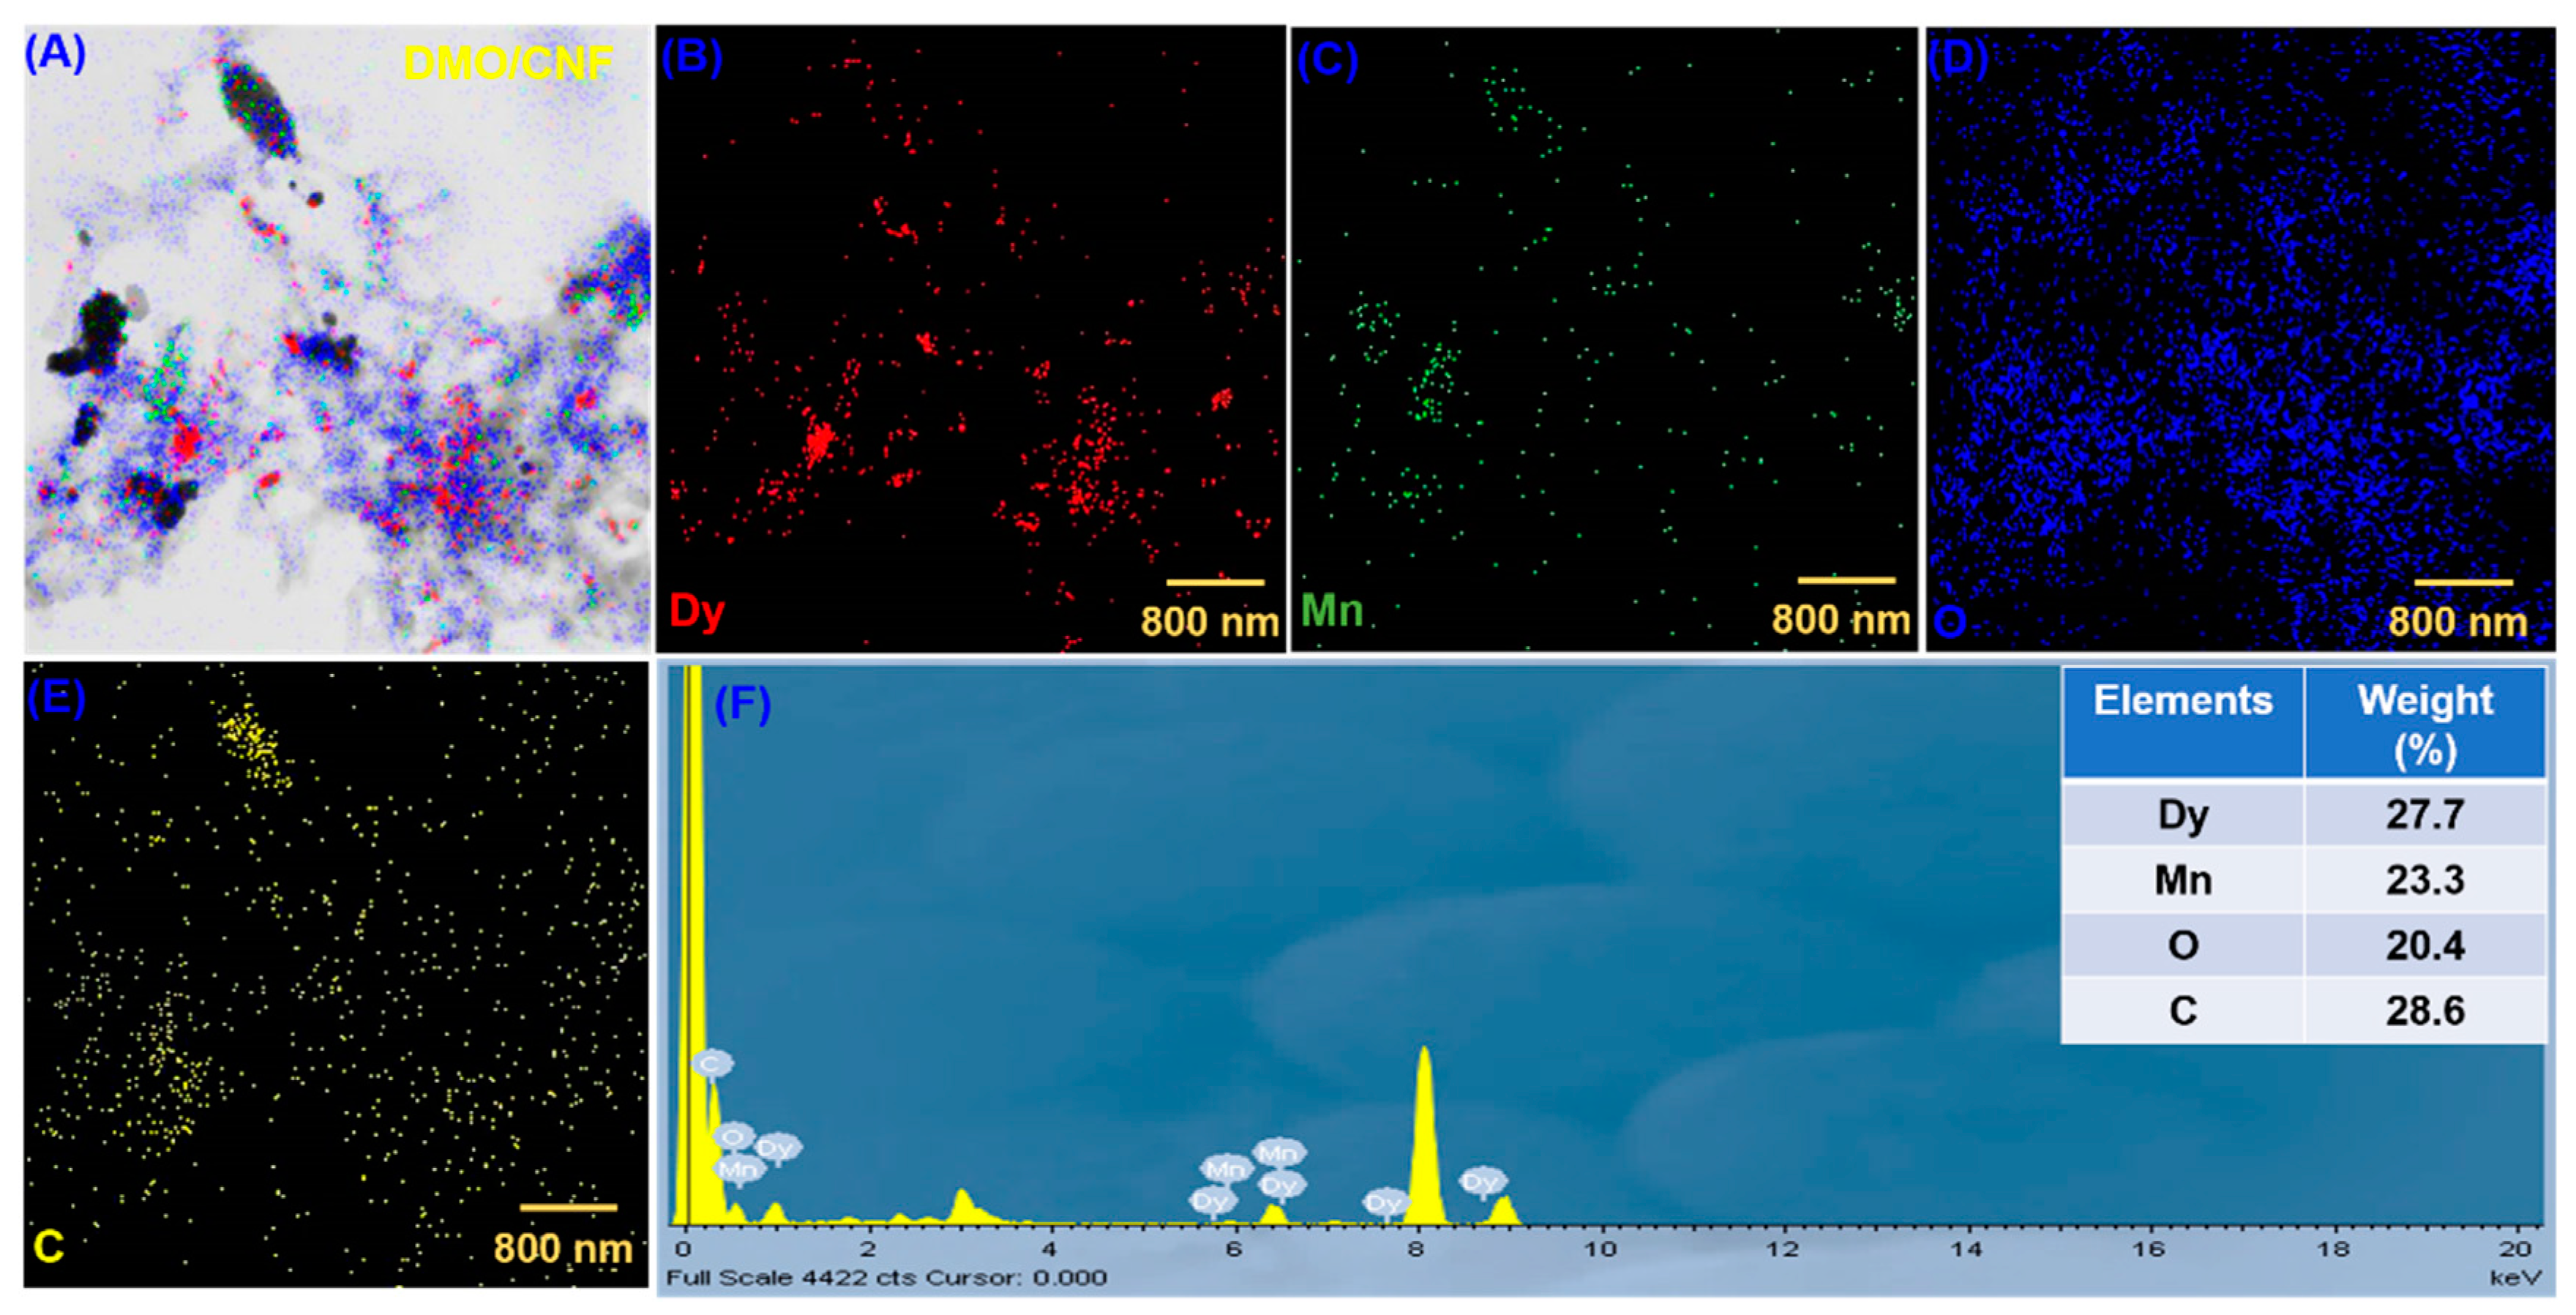
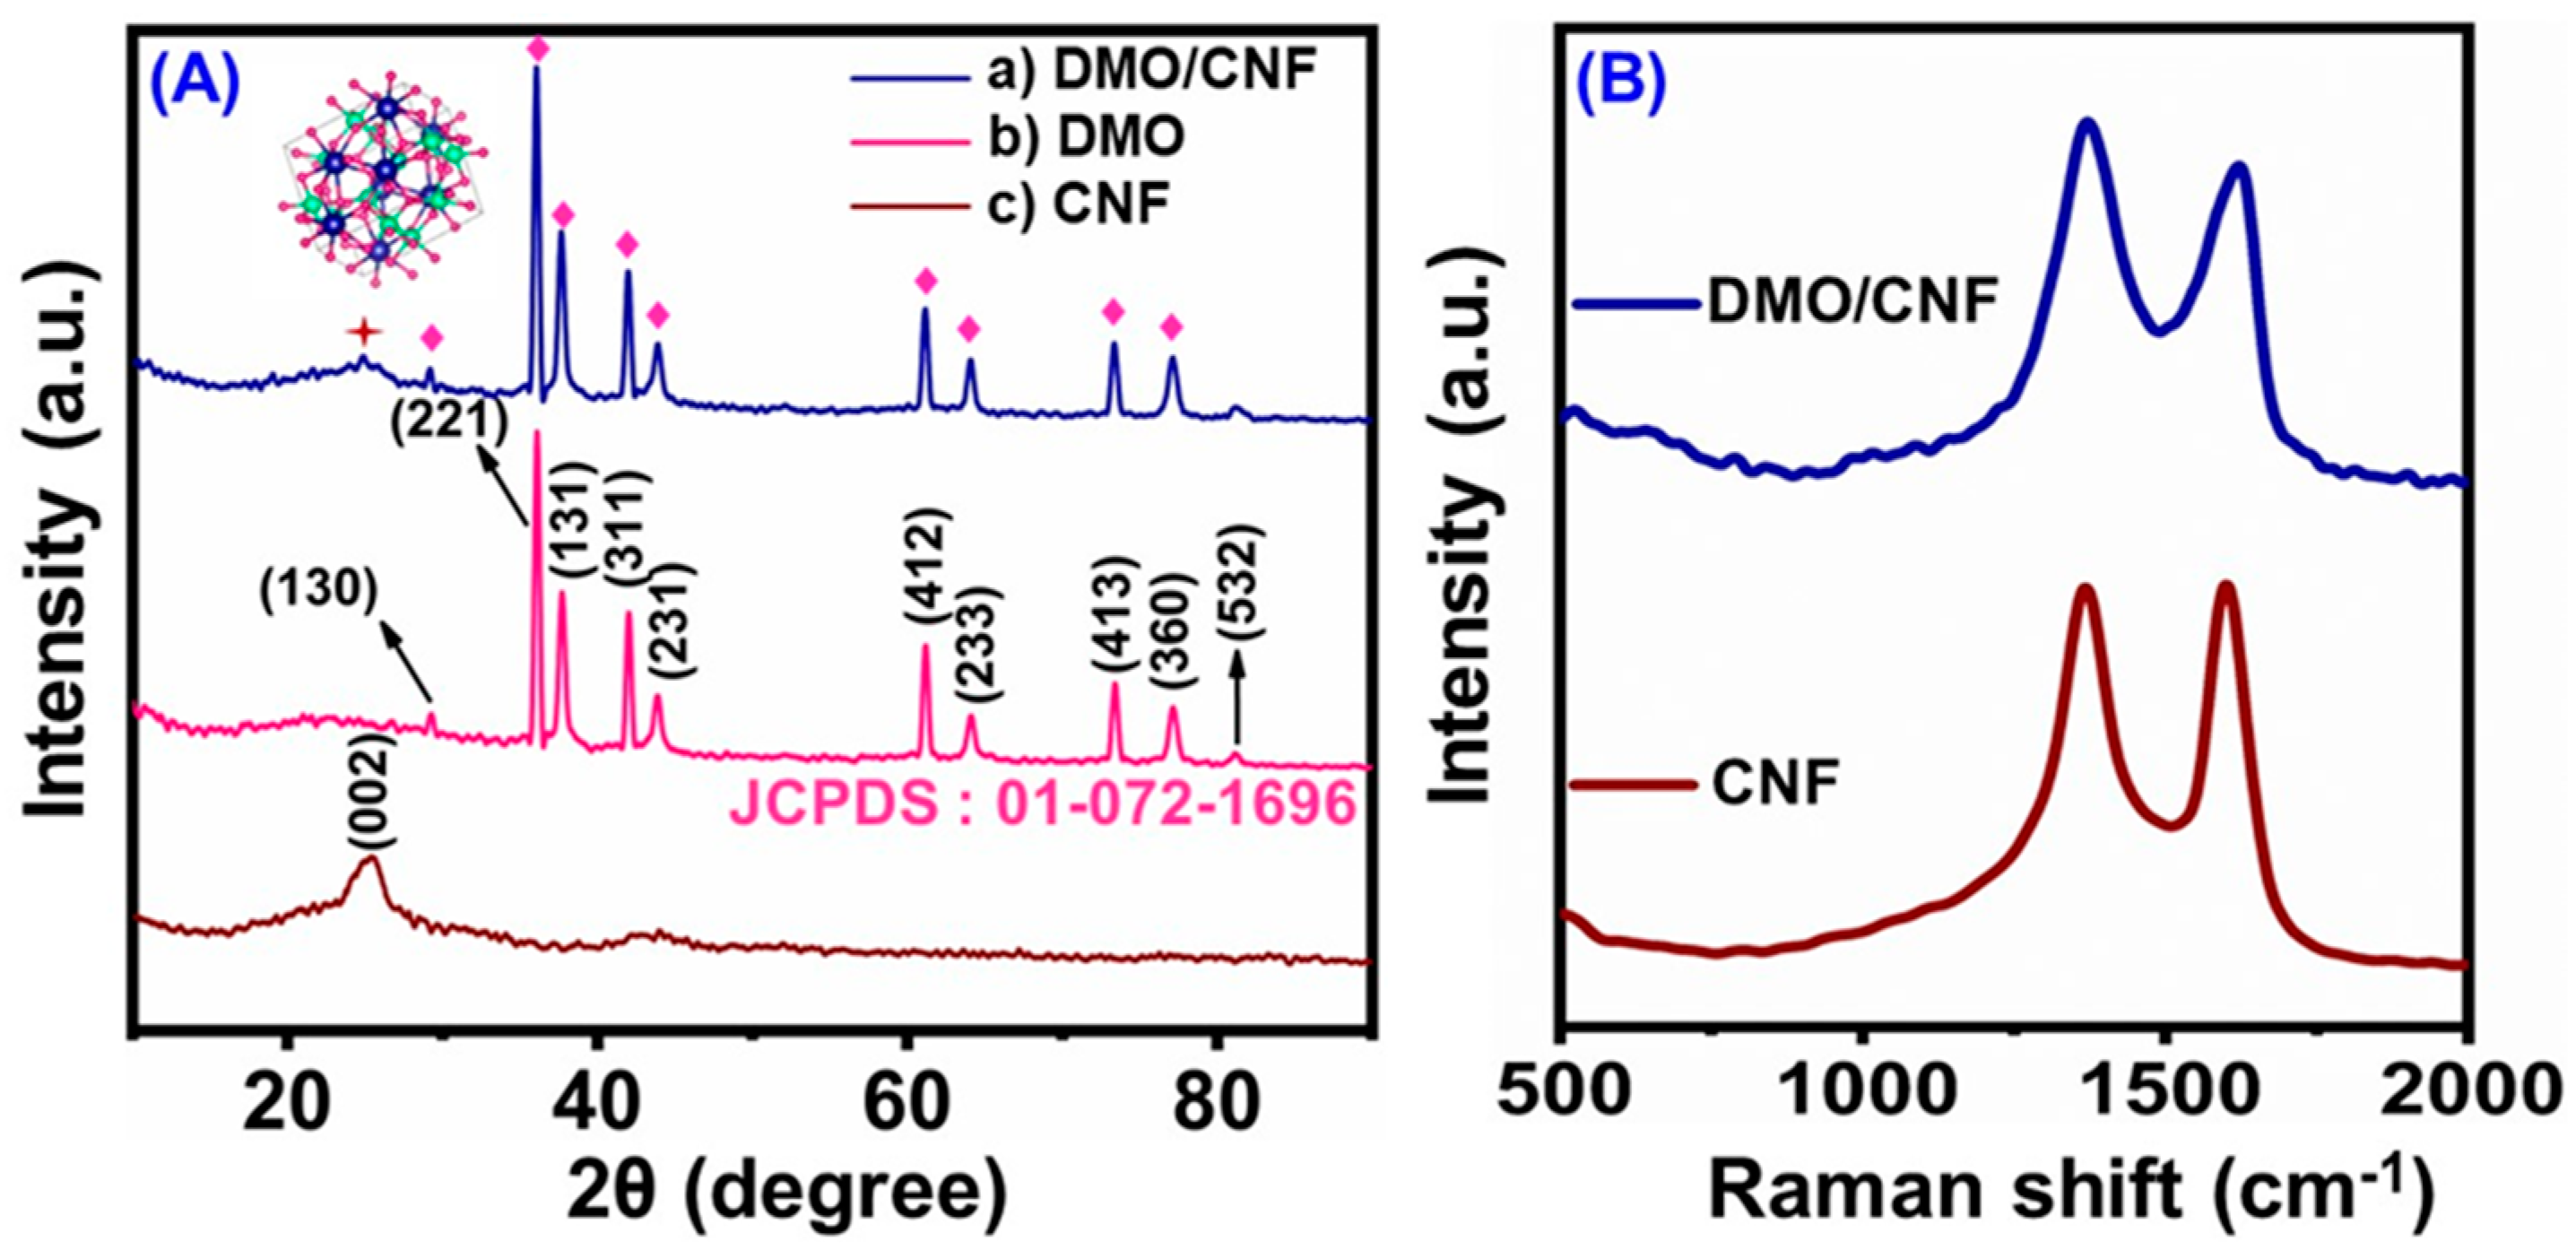
3.1. Morphological and Structural Analysis

The morphology of the synthesized material DMO/CNF was characterized by SEM and HR-TEM, depicted in Figure 1. Figure 1A shows the FESEM image of DMO, which appears to be aggregated nanoparticle with irregular size, randomly oriented. Figure 1B shows the FESEM image of nanofibers aligned partially with a smooth surface. Figure 1C shows the FESEM image DMO/CNF in which the DMO nanoparticle was aligned on the surface of CNF. When DMO is anchored to the surface of CNF, their tight integration creates synergism, which increases the electrocatalytic activity of the prepared nanocomposite. Figure 1D,E shows the TEM images of DMO/CNF at different magnifications, which resemble the topography-like nanoparticle, which resembles the structure as depicted in FESEM, which confirms the structure of DMO/CNF. Figure 1F shows the SAED pattern of DMO/CNF revealing the crystallinity through the appearance of lattice planes (221) and (311) corresponding to the DMO/CNF as confirmed through XRD results. Figure 1G shows the lattice fringes image of DMO/CNF, which reveals the d-spacing value to be 0.318 nm. The spatial distribution of different elements present in the DMO/CNF was found by mapping (Figure 2A–E). The elemental constitution was analyzed by EDX, which reveals the presence of Dy, Mn, O, and C with weight percentages of 27.7%, 23.3%, 20.4%, and 28.6%, respectively.
Figure 3A depicts the XRD pattern of as-prepared DMO, CNF, and DMO/CNF nanocomposite. In the diffraction of CNF (Figure 3A(c)), the peak appears at 25.4, which indicates the graphite-like carbon corresponds to the (002) plane [44]. As in Figure 3A(a), the crystalline nature of the DMO reduces the intense peak of CNF, thus resulting in the exfoliation of the CNF in the composite DMO/CNF. Figure 3A(b,c) remarkably indicates the formation of DMO/CNF nanocomposite. In which the characteristic diffraction peaks were matched with the orthorhombic phase of DyMn2O5 (JCPDS: 01-072-1696) [45] were observed. The strong diffraction peaks at 29.2, 36.1, 37.7, 42, 43.8, 61.1, 64.1, 73.4, 77.1, and 81.2 were attributed to the planes of (130), (221), (131), (311), (231), (412), (233), (412), (233), (413), (360), and (532), respectively, indicating a successful formation of DMO/CNF nanocomposite. The average particle size was calculated to be 10.9 nm from the Debye-Scherrer equation. These results confirm the high purity and crystallinity of the synthesized nanocomposite.
The micro-Raman spectra were evaluated to confirm the presence of CNF in the DMO/CNF nanocomposite, as depicted in Figure 3B. The Raman spectra indicated that the D and G bands were around 1365 cm−1 and 1590 cm−1. Where the ID/IG intensity ratio of CNF and DMO/CNF is 0.99 and 1.03. The ID/IG ratio of DMO/CNF was higher for DMO/CNF. The effective interaction between the CNF and DMO further increases the defects with the ID/IG ratio of DMO/CNF to 1.03.

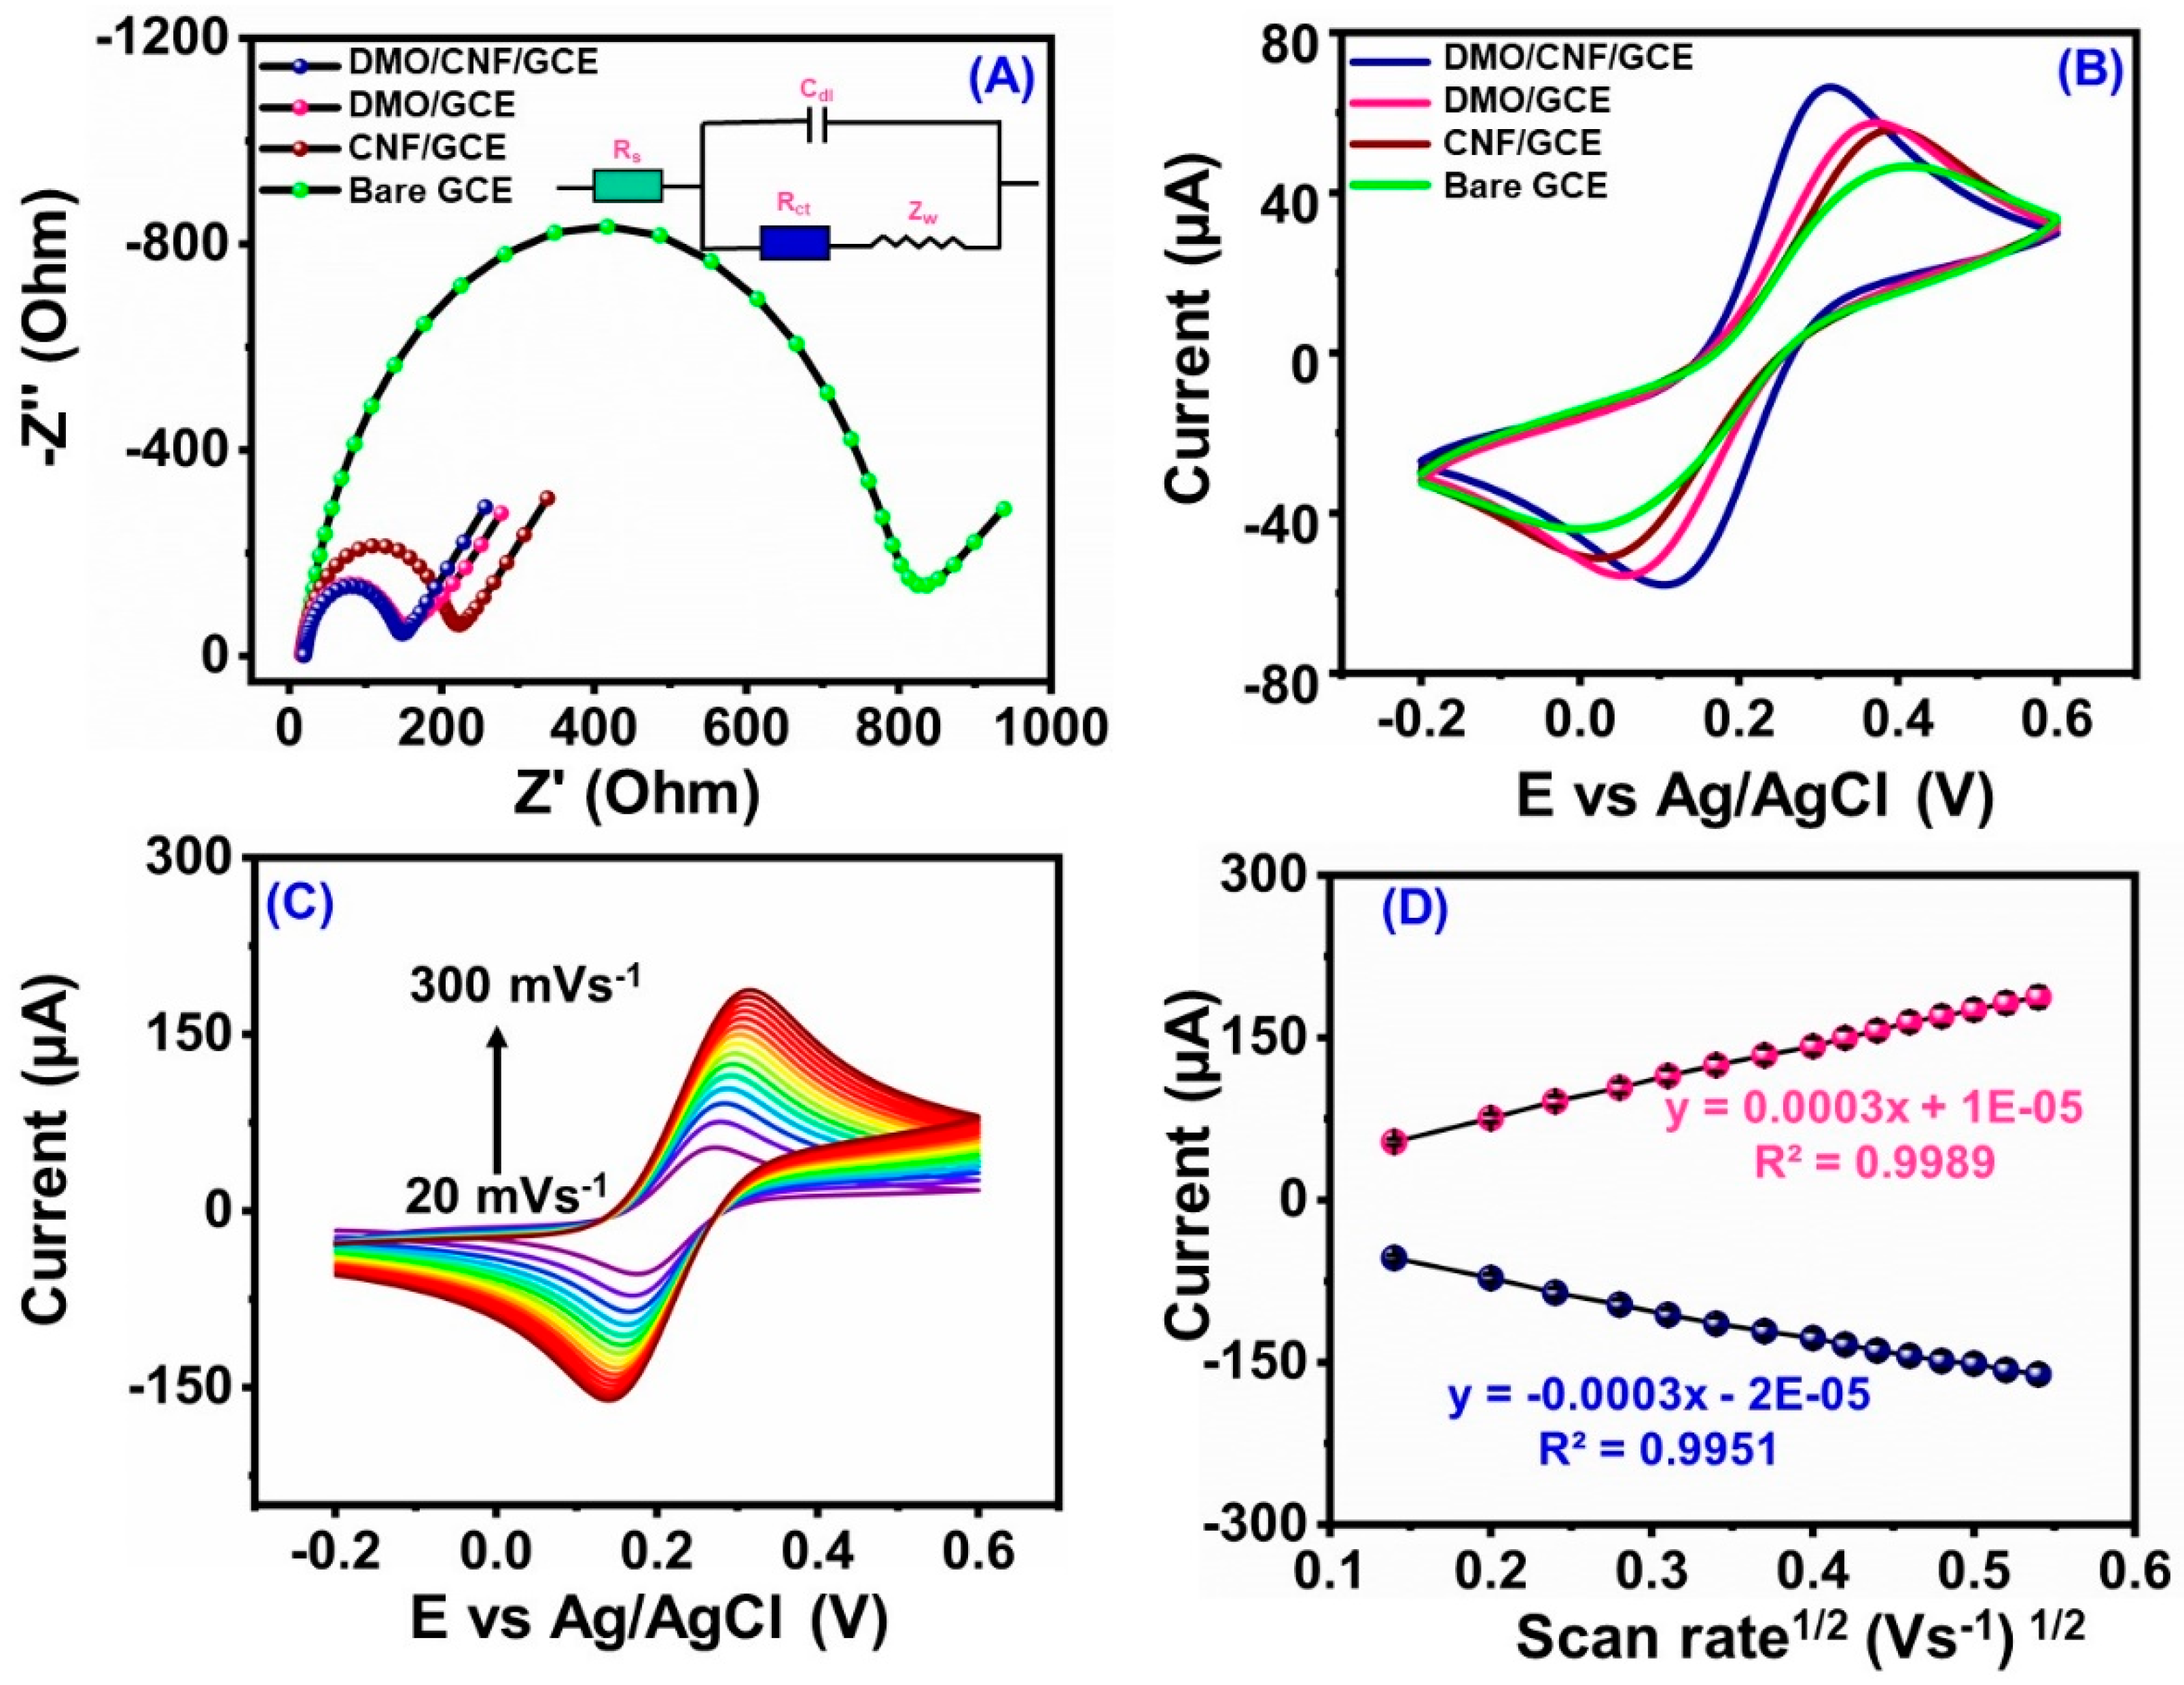
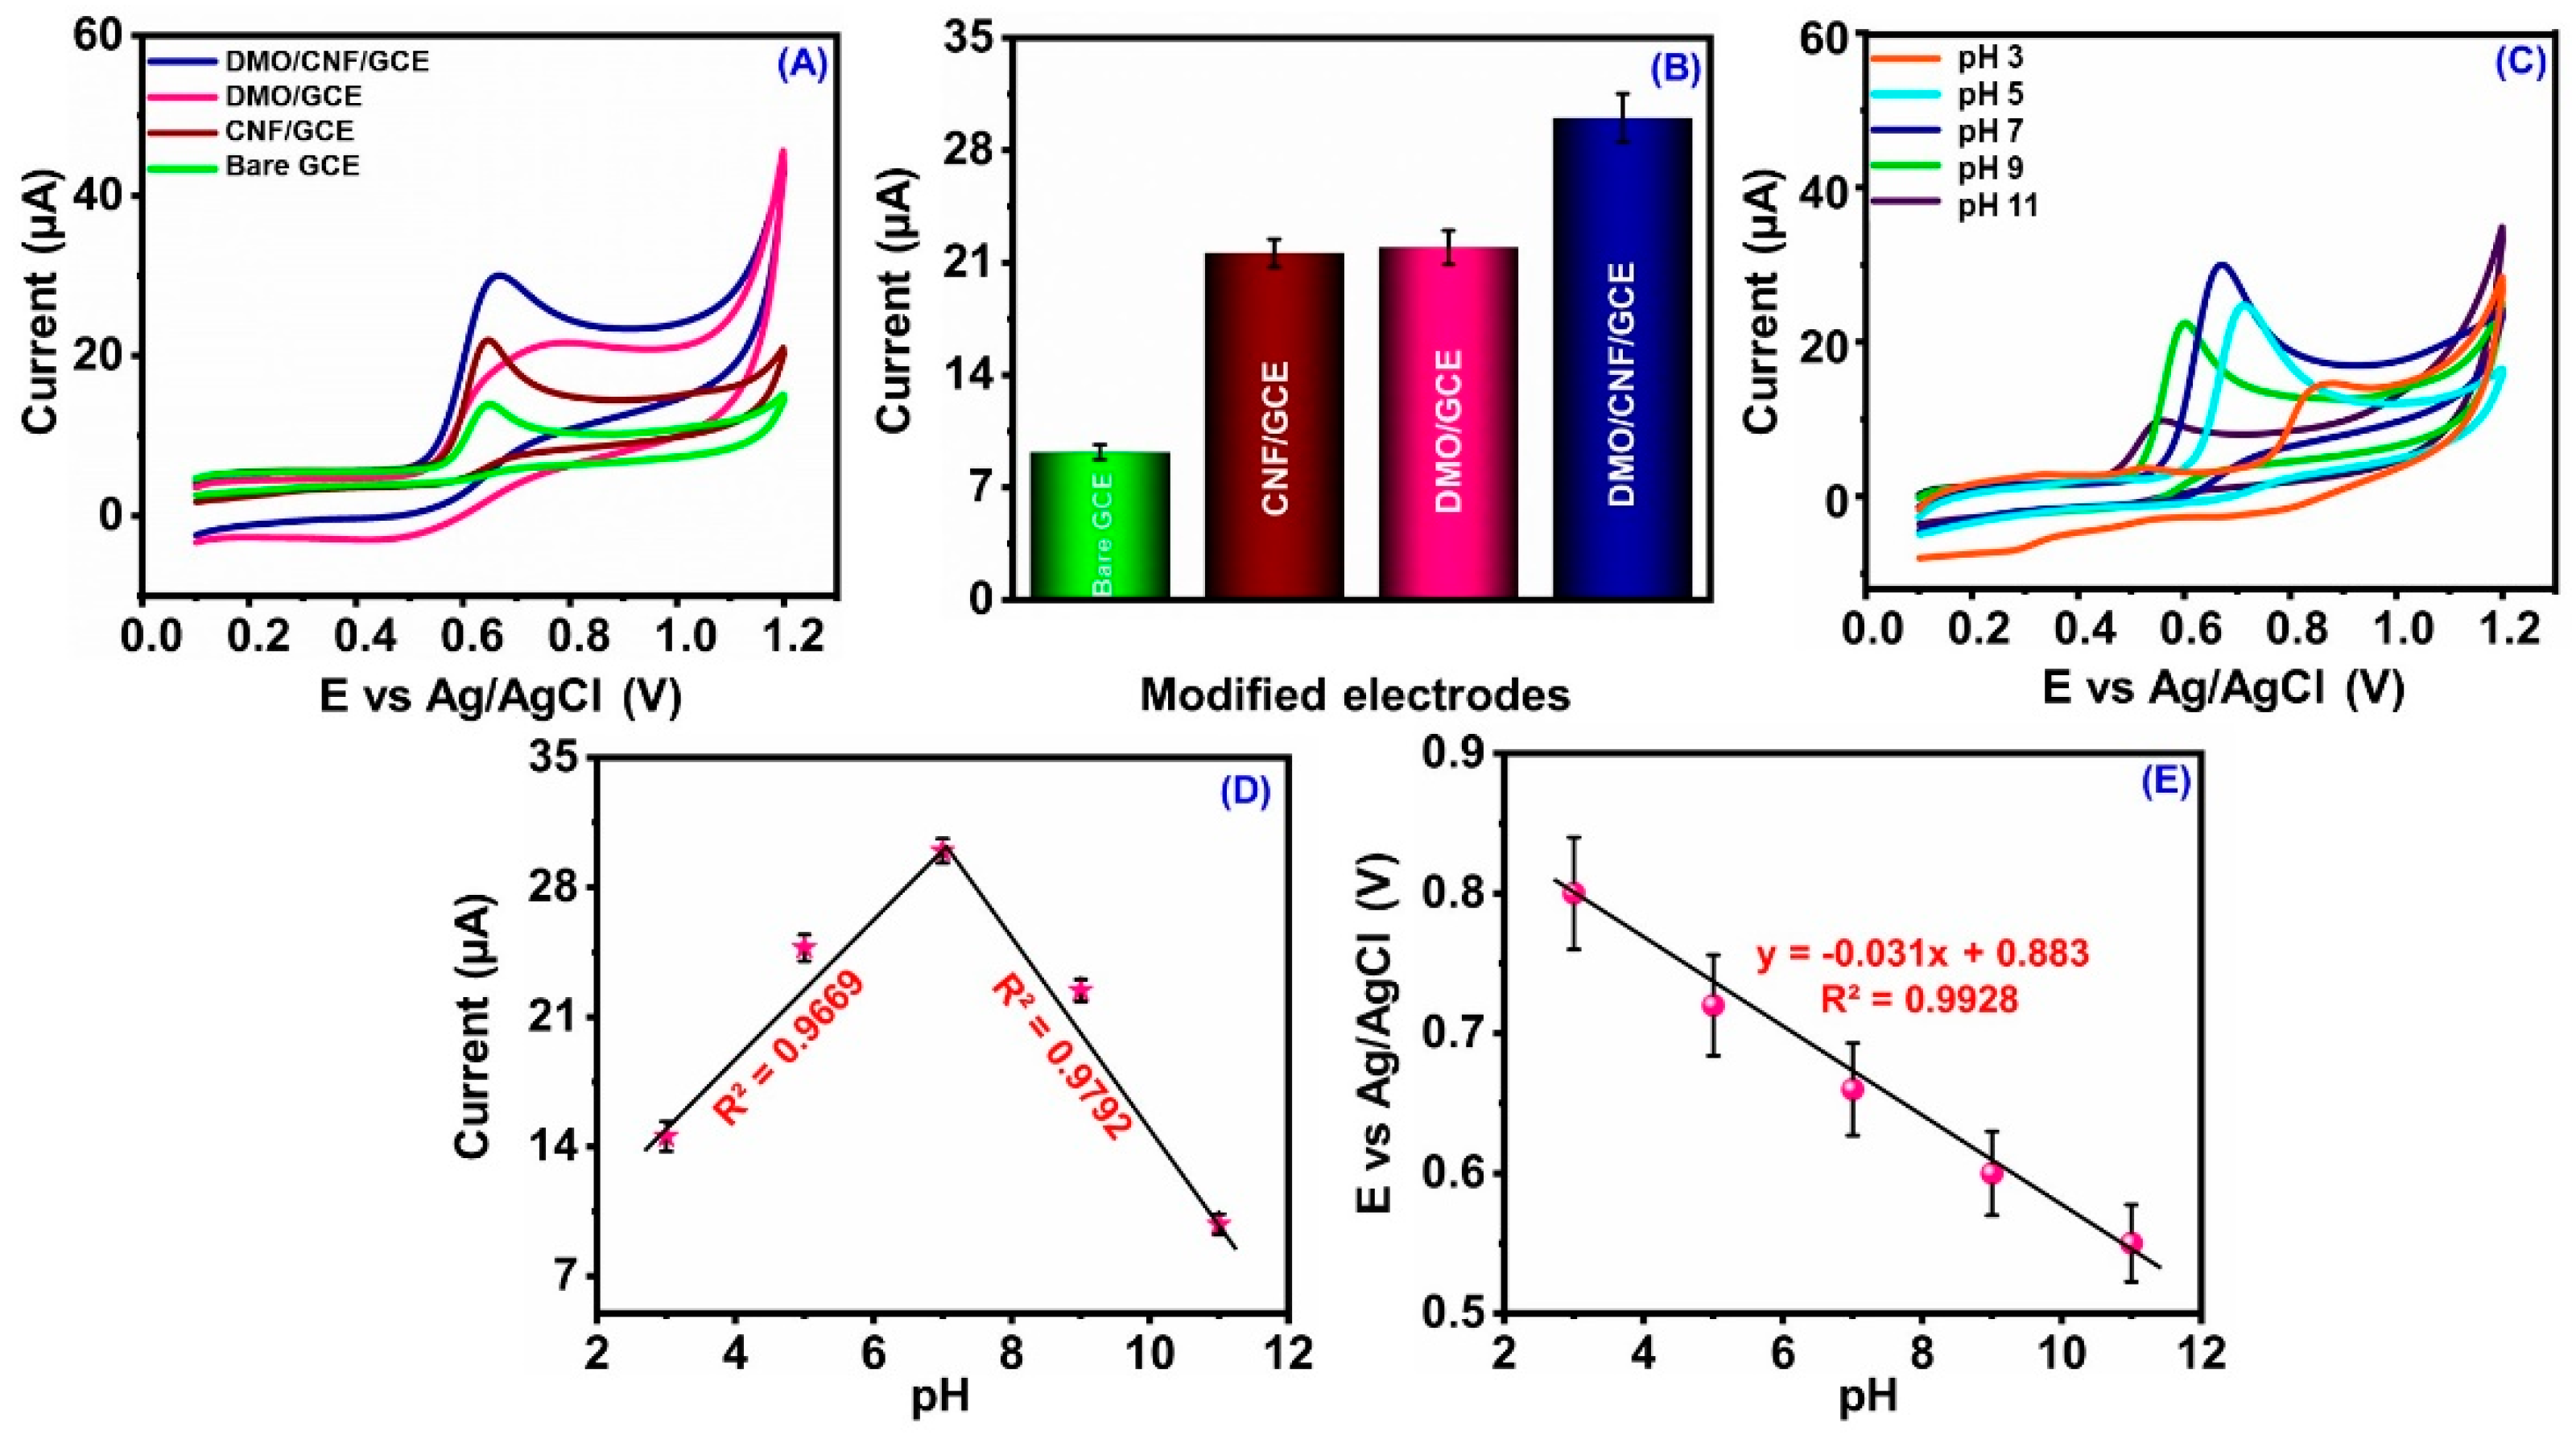
3.2. Electrochemical Behavior of DMO/CNF

The interfacial properties of the electrodes were examined using the EIS study in the FC system, which includes a semicircle at a high frequency and a straight line at a low frequency which relates to the electron transfer limiting process and diffusion process, respectively. Figure 4A depicts the electron transfer ability of bare GCE, CNF/GCE, DMO/GCE, and DMO/CNF/GCE. The charge transfer resistance taking part in the solution interface (Rct) of bare GCE, CNF/GCE, DMO/GCE, and DMO/CNF/GCE was calculated to be 803.9, 207, 132.6, 128.4Ω. DMO/CNF/GCE shows a smaller semi-circle and low Rct value, which means the CNF promotes the mass electron transfer at DMO/CNF/GCE electrode. This confirms that the DMO/CNF/GCE has a better electron transfer ability. As a result, DMO/CNF nanocomposite can make good electrical contact with electrodes and electrolytes, allowing high-speed electrocatalytic detection of target analytes. In a further step, we can use the Rct value to calculate the charge-transfer rate (Kapp) [46].
Kapp = RT/F2RctAC
The equation shows that C represents the concentration of the solution, and A represents the surface of the electrodes transferred. R gas constant, a room temperature, and a reaction faradic constant are represented by R, T, and F, respectively. On the basis of Eq, the Ks values for bare GCE, CNF/GE, DMO/GCE, and DMO/CNF/GCE are 5.55 × 10⁻⁹, 2.16 × 10⁻⁸, 3..37 × 10−8, and 3.48 × 10⁻⁸, respectively. Compared to other electrodes, DMO/CNF/GCE have the highest Kapp value, indicating fast electron transport.
Cyclic voltammetry was utilized to assess the electroanalytical behavior of the bare GCE, CNF/GCE, DMO/GCE, and DMO/CNF/GCE. Utilizing reference redox couple FC system, their performance was observed, displayed in Figure 4B. It revealed a significant improvement in redox peak current and reduced peak separation for DMO/CNF/GCE composite. This could be owing to the increased electrode surface of DMO and CNF, which could act as an electron transfer pathway.
Figure 4C depicts the CV response of DMO/CNF/GCE by various scan rates. As shown in the figure, the CV was performed at varying scan rates of 20 mVs−1–300 mVs−1. A linear relationship was observed between the redox peak current and the square root of the scan rate, which was depicted in Figure 4D. As the scan rate increases, the redox peak current also increases. The active surface area (EASA) was calculated by using Randles–Sevcik equation [47]:
Ip = 2.69 × 10⁵ n 3 / 2 D 1 / 2 A ʋ 1 / 2 C
The EASA of bare GCE, CNF/GCE, DMO/GCE, and DMO/CNF/GCE was calculated to be 0.074, 0.085, 0.098, and 0.117 cm2, respectively. The obtained results revealed that DMO/CNF/GCE had a larger EASA value; therefore, DMO/CNF/GCE will be more advantageous for the electrochemical response towards MA detection.

3.3. Optimization of Analytical Conditions

3.3.1. Modified Electrodes and Different Ph

The electrocatalytic performance of DMO/CNF/GCE was analyzed. Initially, the electrochemical performance of bare GCE, CNF/GCE, DMO/GCE, and DMO/CNF/GCE was measured in the existence of 100 µM of MA in 0.01 M PB supporting electrolyte at 50 mVs−1 depicted in Figure 5A; corresponding bar diagram was shown in Figure 5B. From the results, we observed that the bare GCE has poor catalytic activity compared to all other modified electrodes. The electrocatalytic activity of DMO/GCE was increased after the introduction of CNF, and the DMO/CNF/GCE resulted in a high oxidation current response. However, a better current response towards MA detection was obtained for the DMO/CNF/GCE, which shows the better catalytic activity of the as-synthesized nanocomposite.
The impact of the pH of the PB supporting electrolyte on the electrocatalytic activity of DMO/CNF/GCE of 100 µM of MA in 0.01 M PB supporting electrolyte at 50 mVs−1 was analyzed. The Ipa response of MA in different PB-supporting electrolytes is depicted in Figure 5C. Moreover, the calibration plot representing the relationship between the different pH against potential and current response is shown in Figure 5D. Figure 5E represents the calibration plot of pH against the potential. As the pH rises from 3 to 7, the anodic peak current increases, whereas above 7, the pH is lowered. Therefore, pH 7 was used for the MA detection process. The reaction mechanism of mefenamic acid is shown in Scheme 2. The oxidative reaction of MA is a one-electron, one-proton transfer process resulting in the radical species = N radical dot, which can be outlined as the following expression [6]:

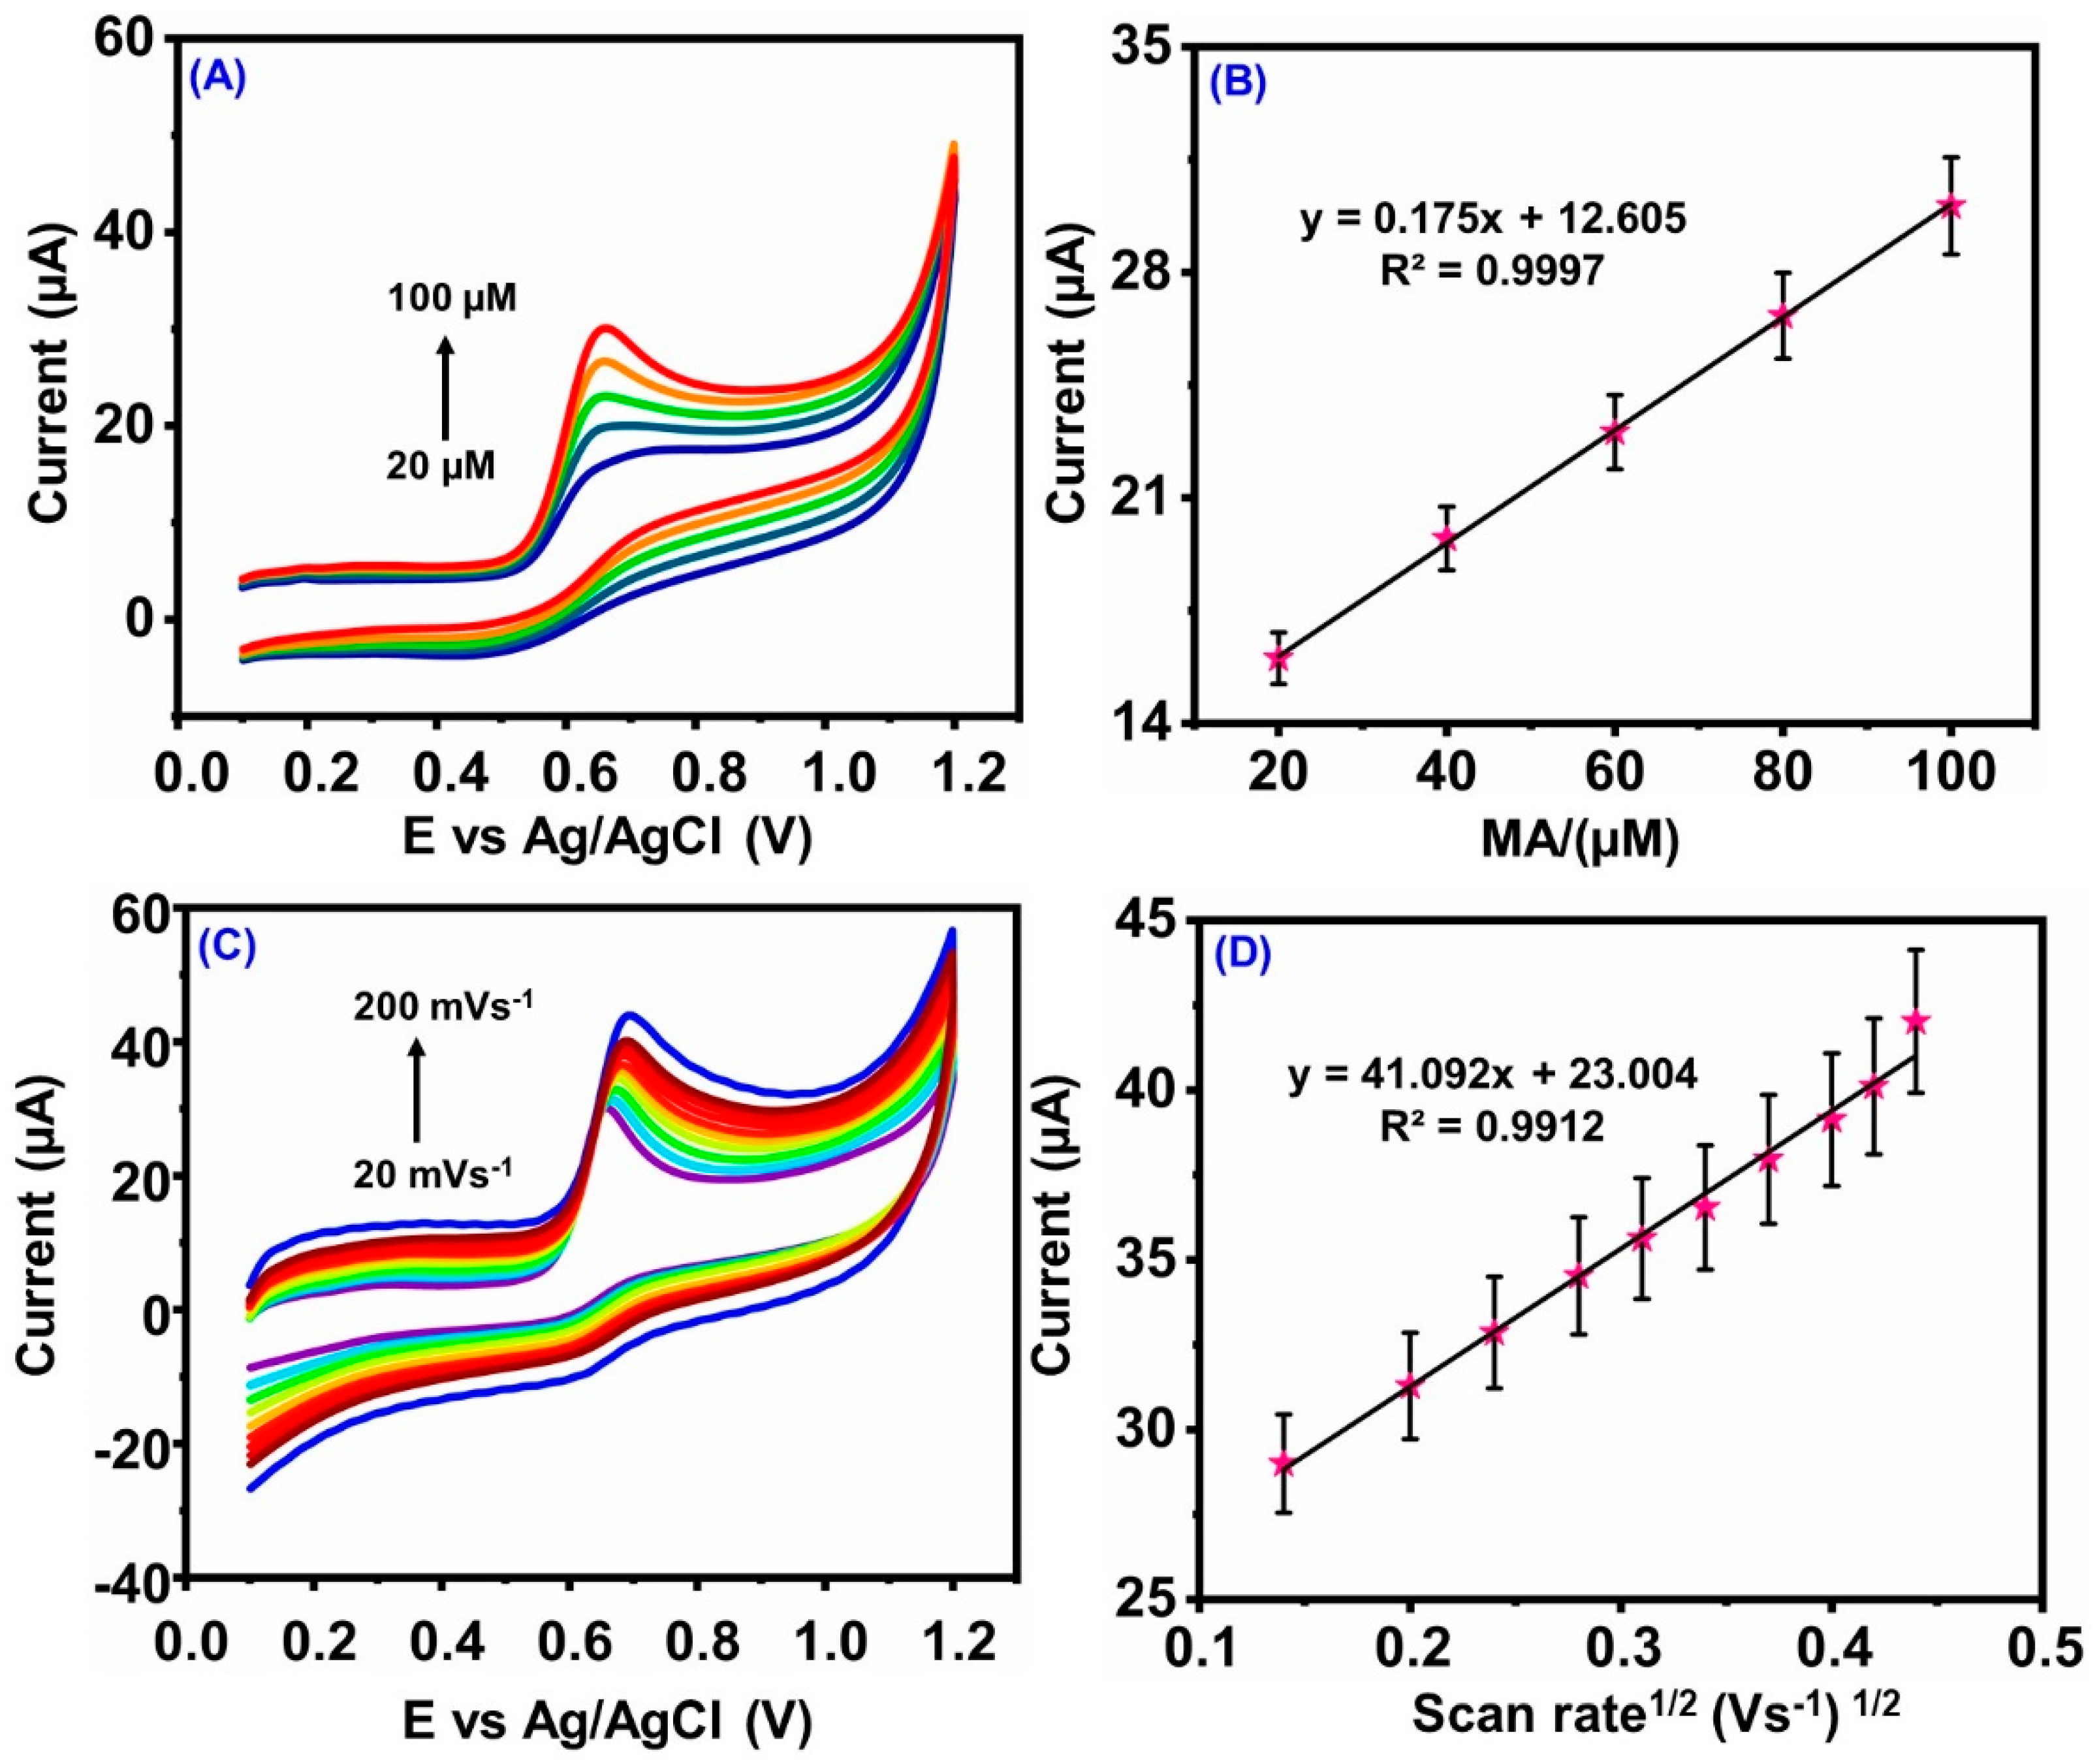
3.3.2. Influence of Concentration and Scan Rate

The effect of the concentration of MA at fabricated DMO/CNF/GCE sensor was analyzed by CV curves, with an increasing MA concentration of 20–100 μM in 0.01 M PB supporting electrolyte. From Figure 6A,B, it was seen that the anodic peak current increases as the MA concentration increases, which shows a linear regression equation of Ipa (μA) = 0.175 (MA) μM + 12.605, R2 = 0.9997. The increasing peak current indicates the fast electron transfer at DMO/CNF/GCE nanocomposite. Figure 6C,D depicts the CV curves of varying scan rates (20 mVs−1–200 mVs−1) at DMO/CNF/GCE in 0.01 M PB supporting electrolyte in the existence of 100 µM of MA. The well-defined oxidation peak current was increased as the scan rate increased from 20 mVs−1–200 mVs−1. There was a good relationship between Ipa and the square root of scan rate with a linear equation of Ipa (µA) = 41.092 (Vs−1) + 23.004, R² = 0.9912, respectively. According to the linear regression graph, the reaction during the electrochemical sensing of MA was a diffusion-controlled process.

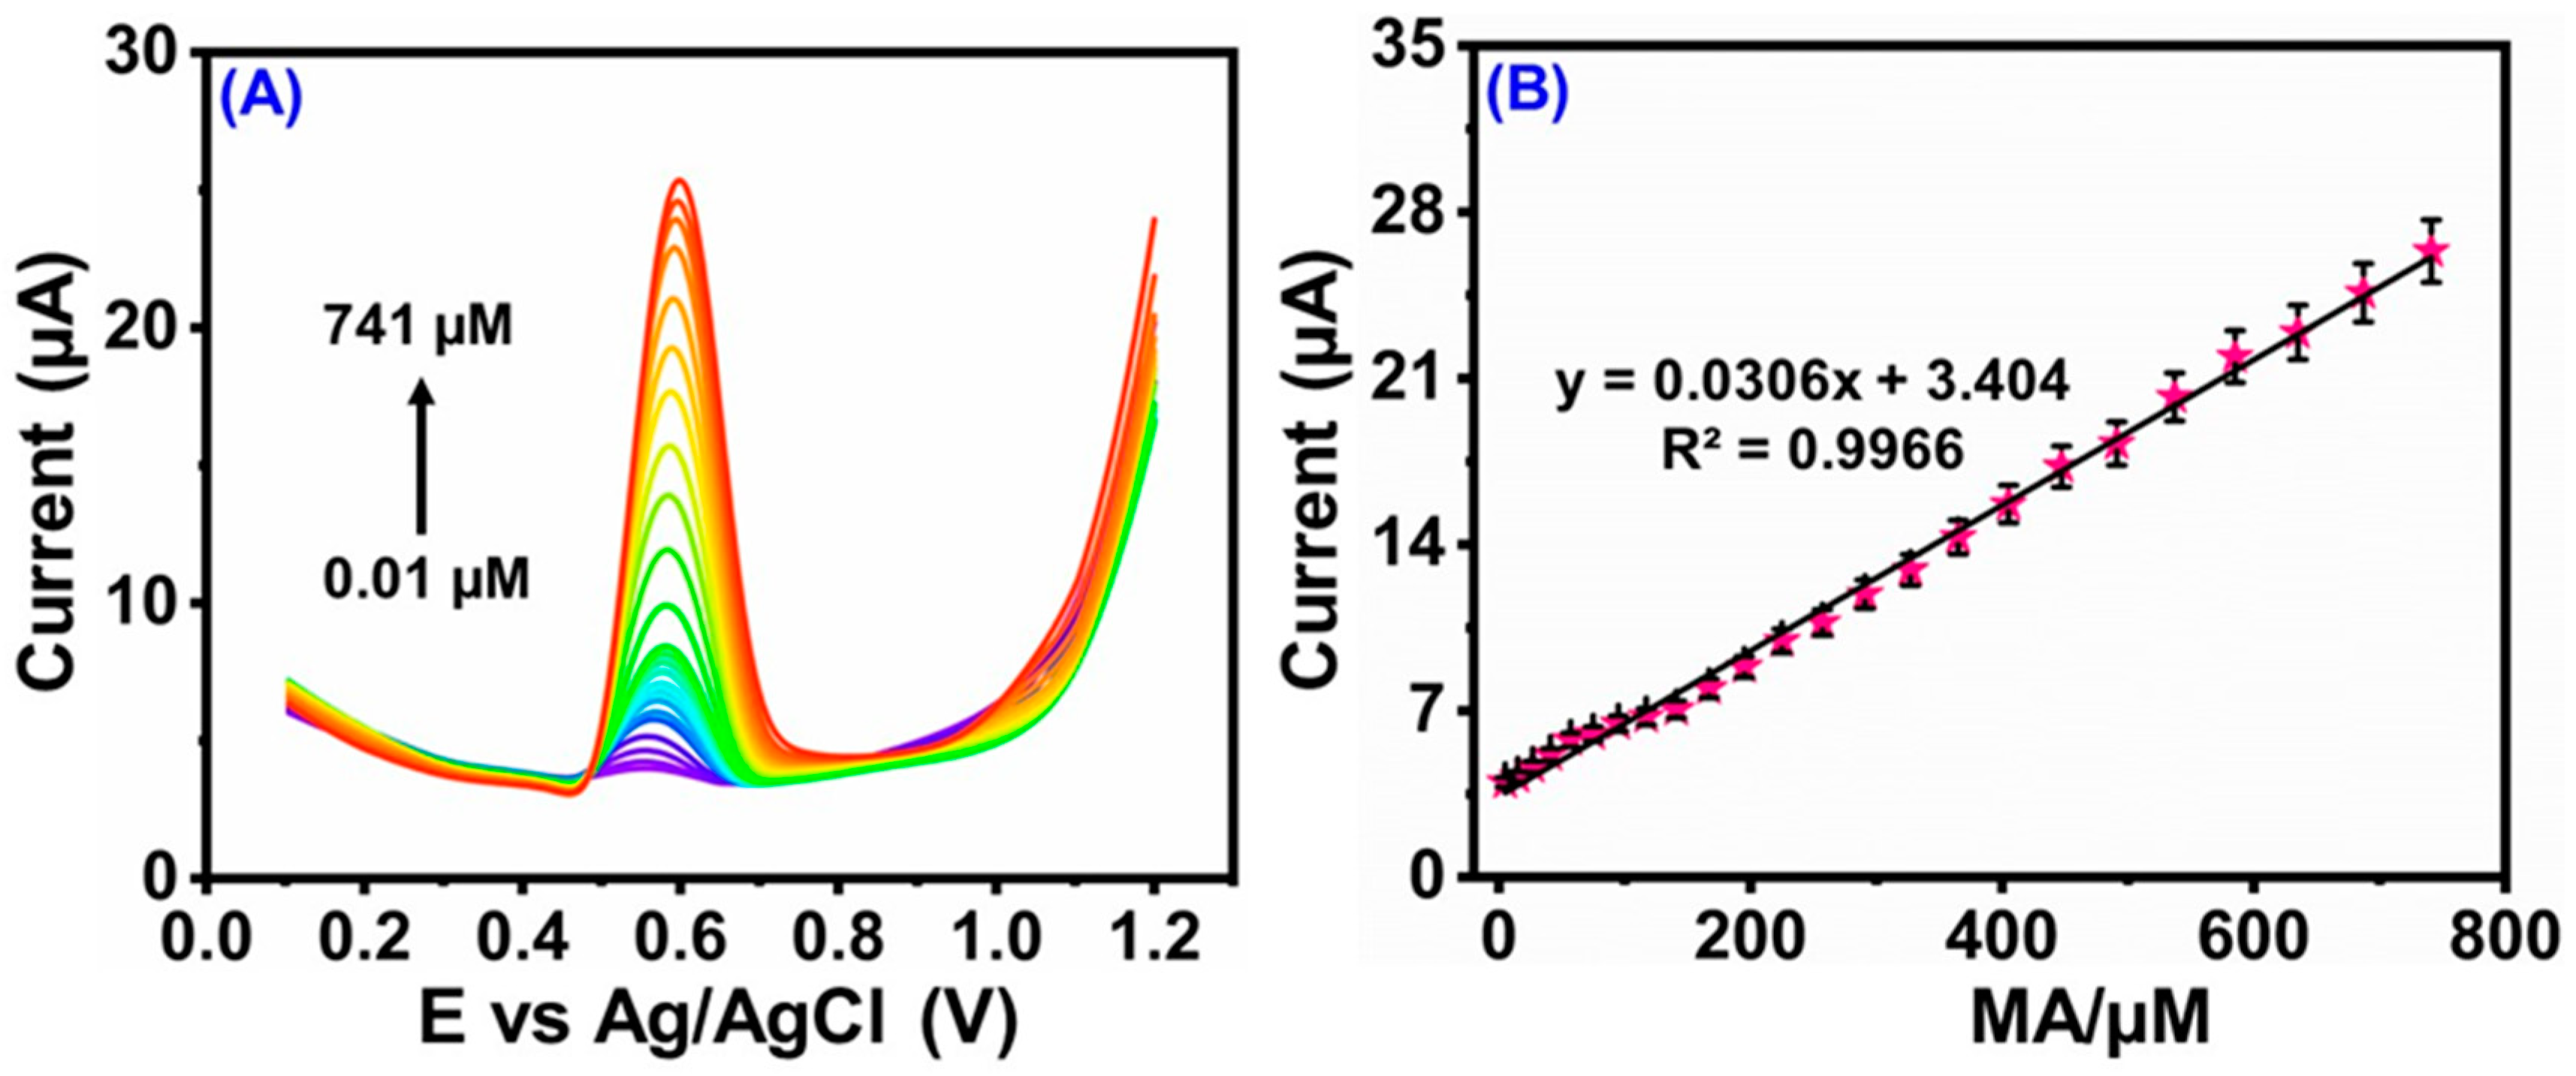
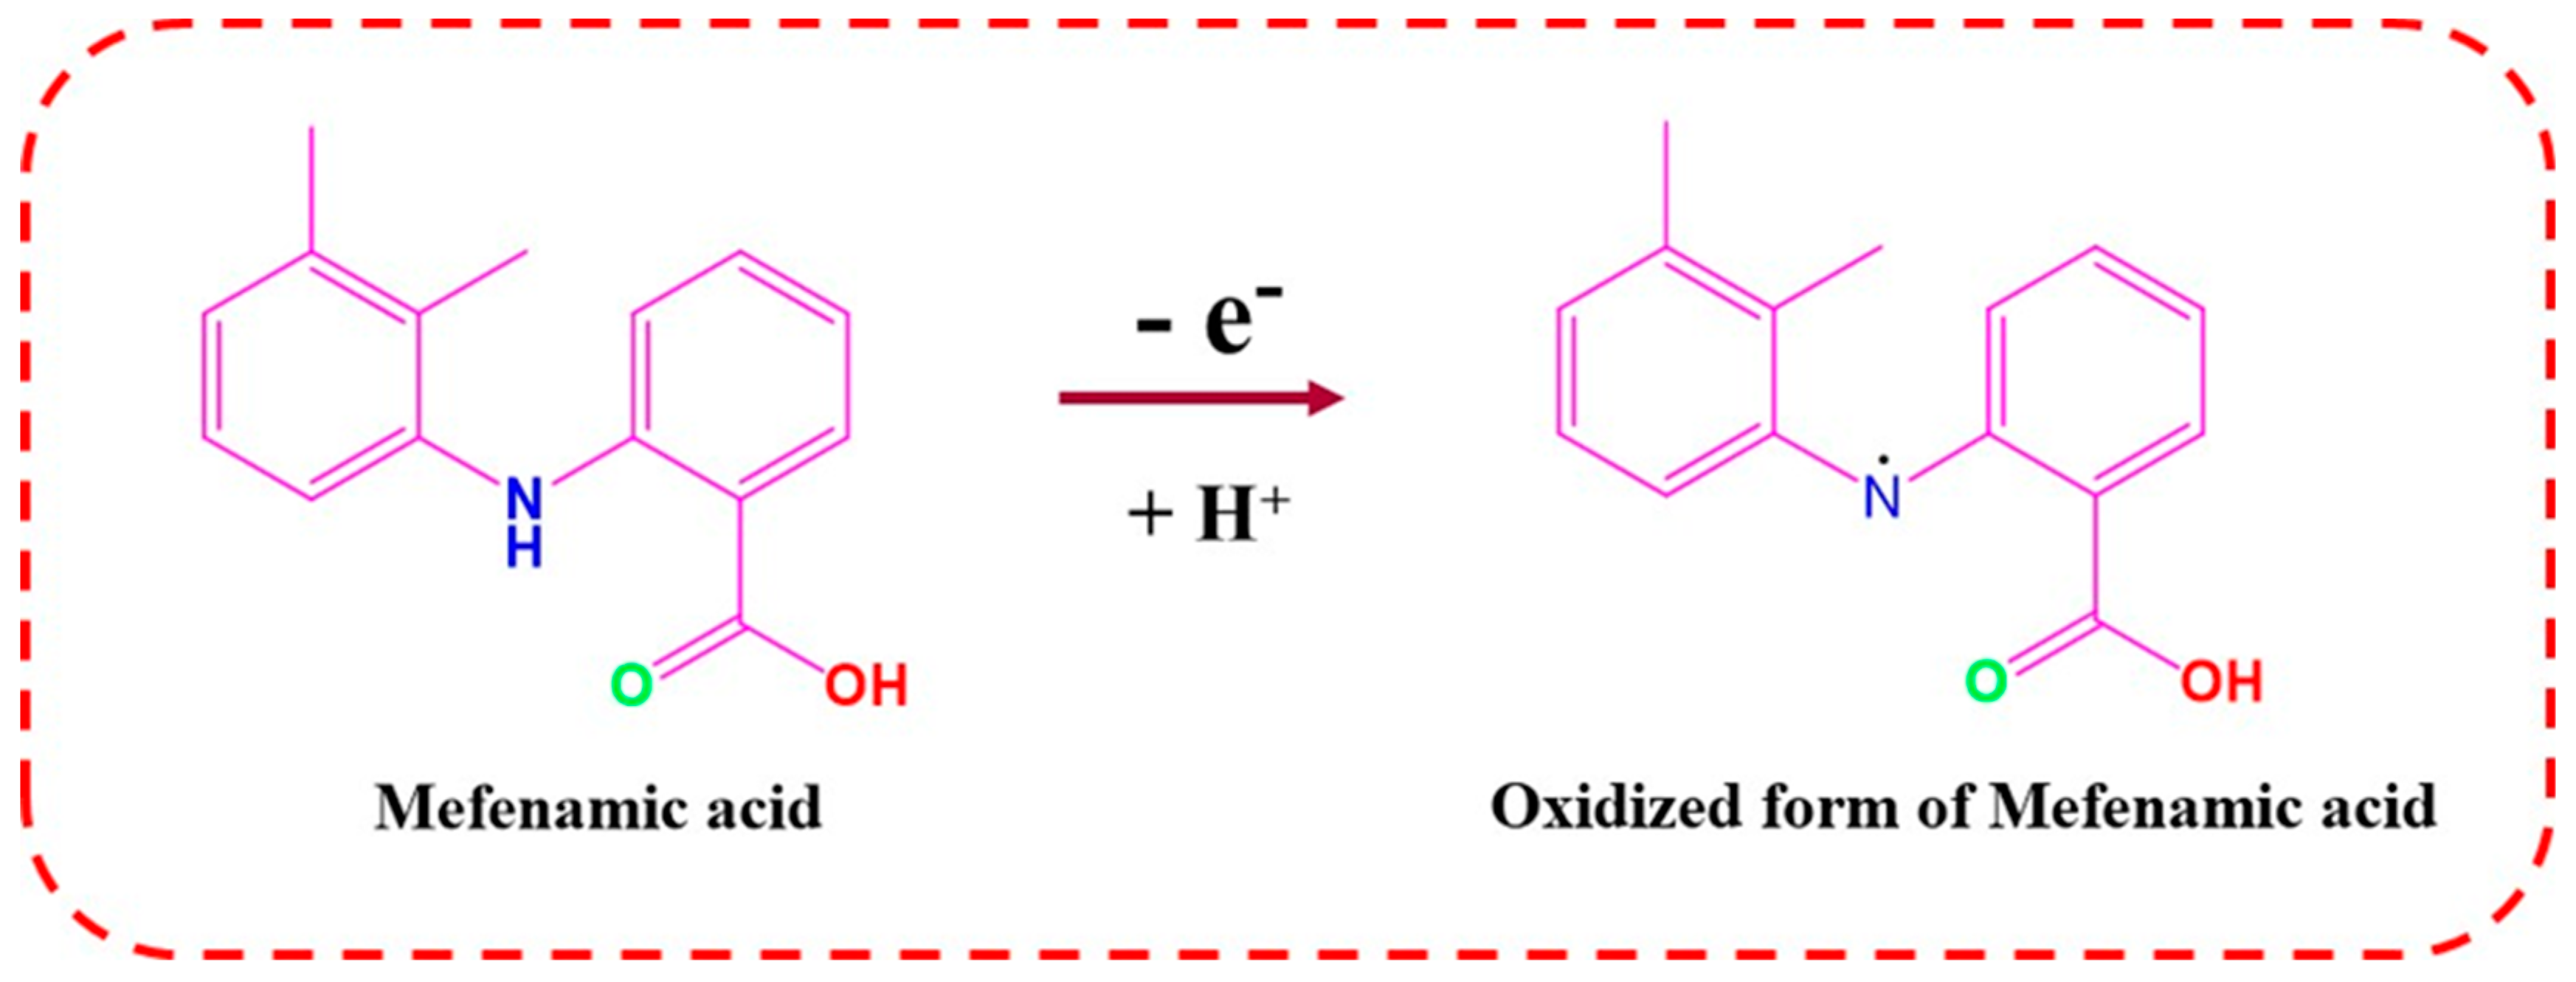
3.3.3. Designation of MA at the Surface of DMO/CNF/GCE

For the electrochemical measurements of DMO/CNF/GCE at MA, the DPV technique was applied. The concentration of MA in 0.01 M PB supporting electrolyte was increased linearly from 0.01–741 µM, as depicted in Figure 7A. Under optimized conditions, MA concentration addition shows a response of increasing current. The linear relationship between the MA concentration and the peak current was represented in Figure 7B, which shows a regression equation of Ipa (µA) = 0.030 (MA) µM + 3.404, R2 = 0.9966 concentration ranging from 0.01 to 741 µM. By using the formula LOD = 3 S/q [48], the LOD was assessed to be 0.009 µm, and the sensitivity of DMO/CNF/GCE to be 0.4309 μA μM−1 cm−2. Table 1 summarizes the electrocatalytic efficiency of different sensing materials for the detection of MA. In comparison with the literature reports, our sensing nanomaterial DMO/CNF/GCE is better in terms of determination, detection limit, and linear range for the detection of MA. As a result, DMO/CNF/GCE shows an acceptable linear range and better LOD in comparison with other methods.

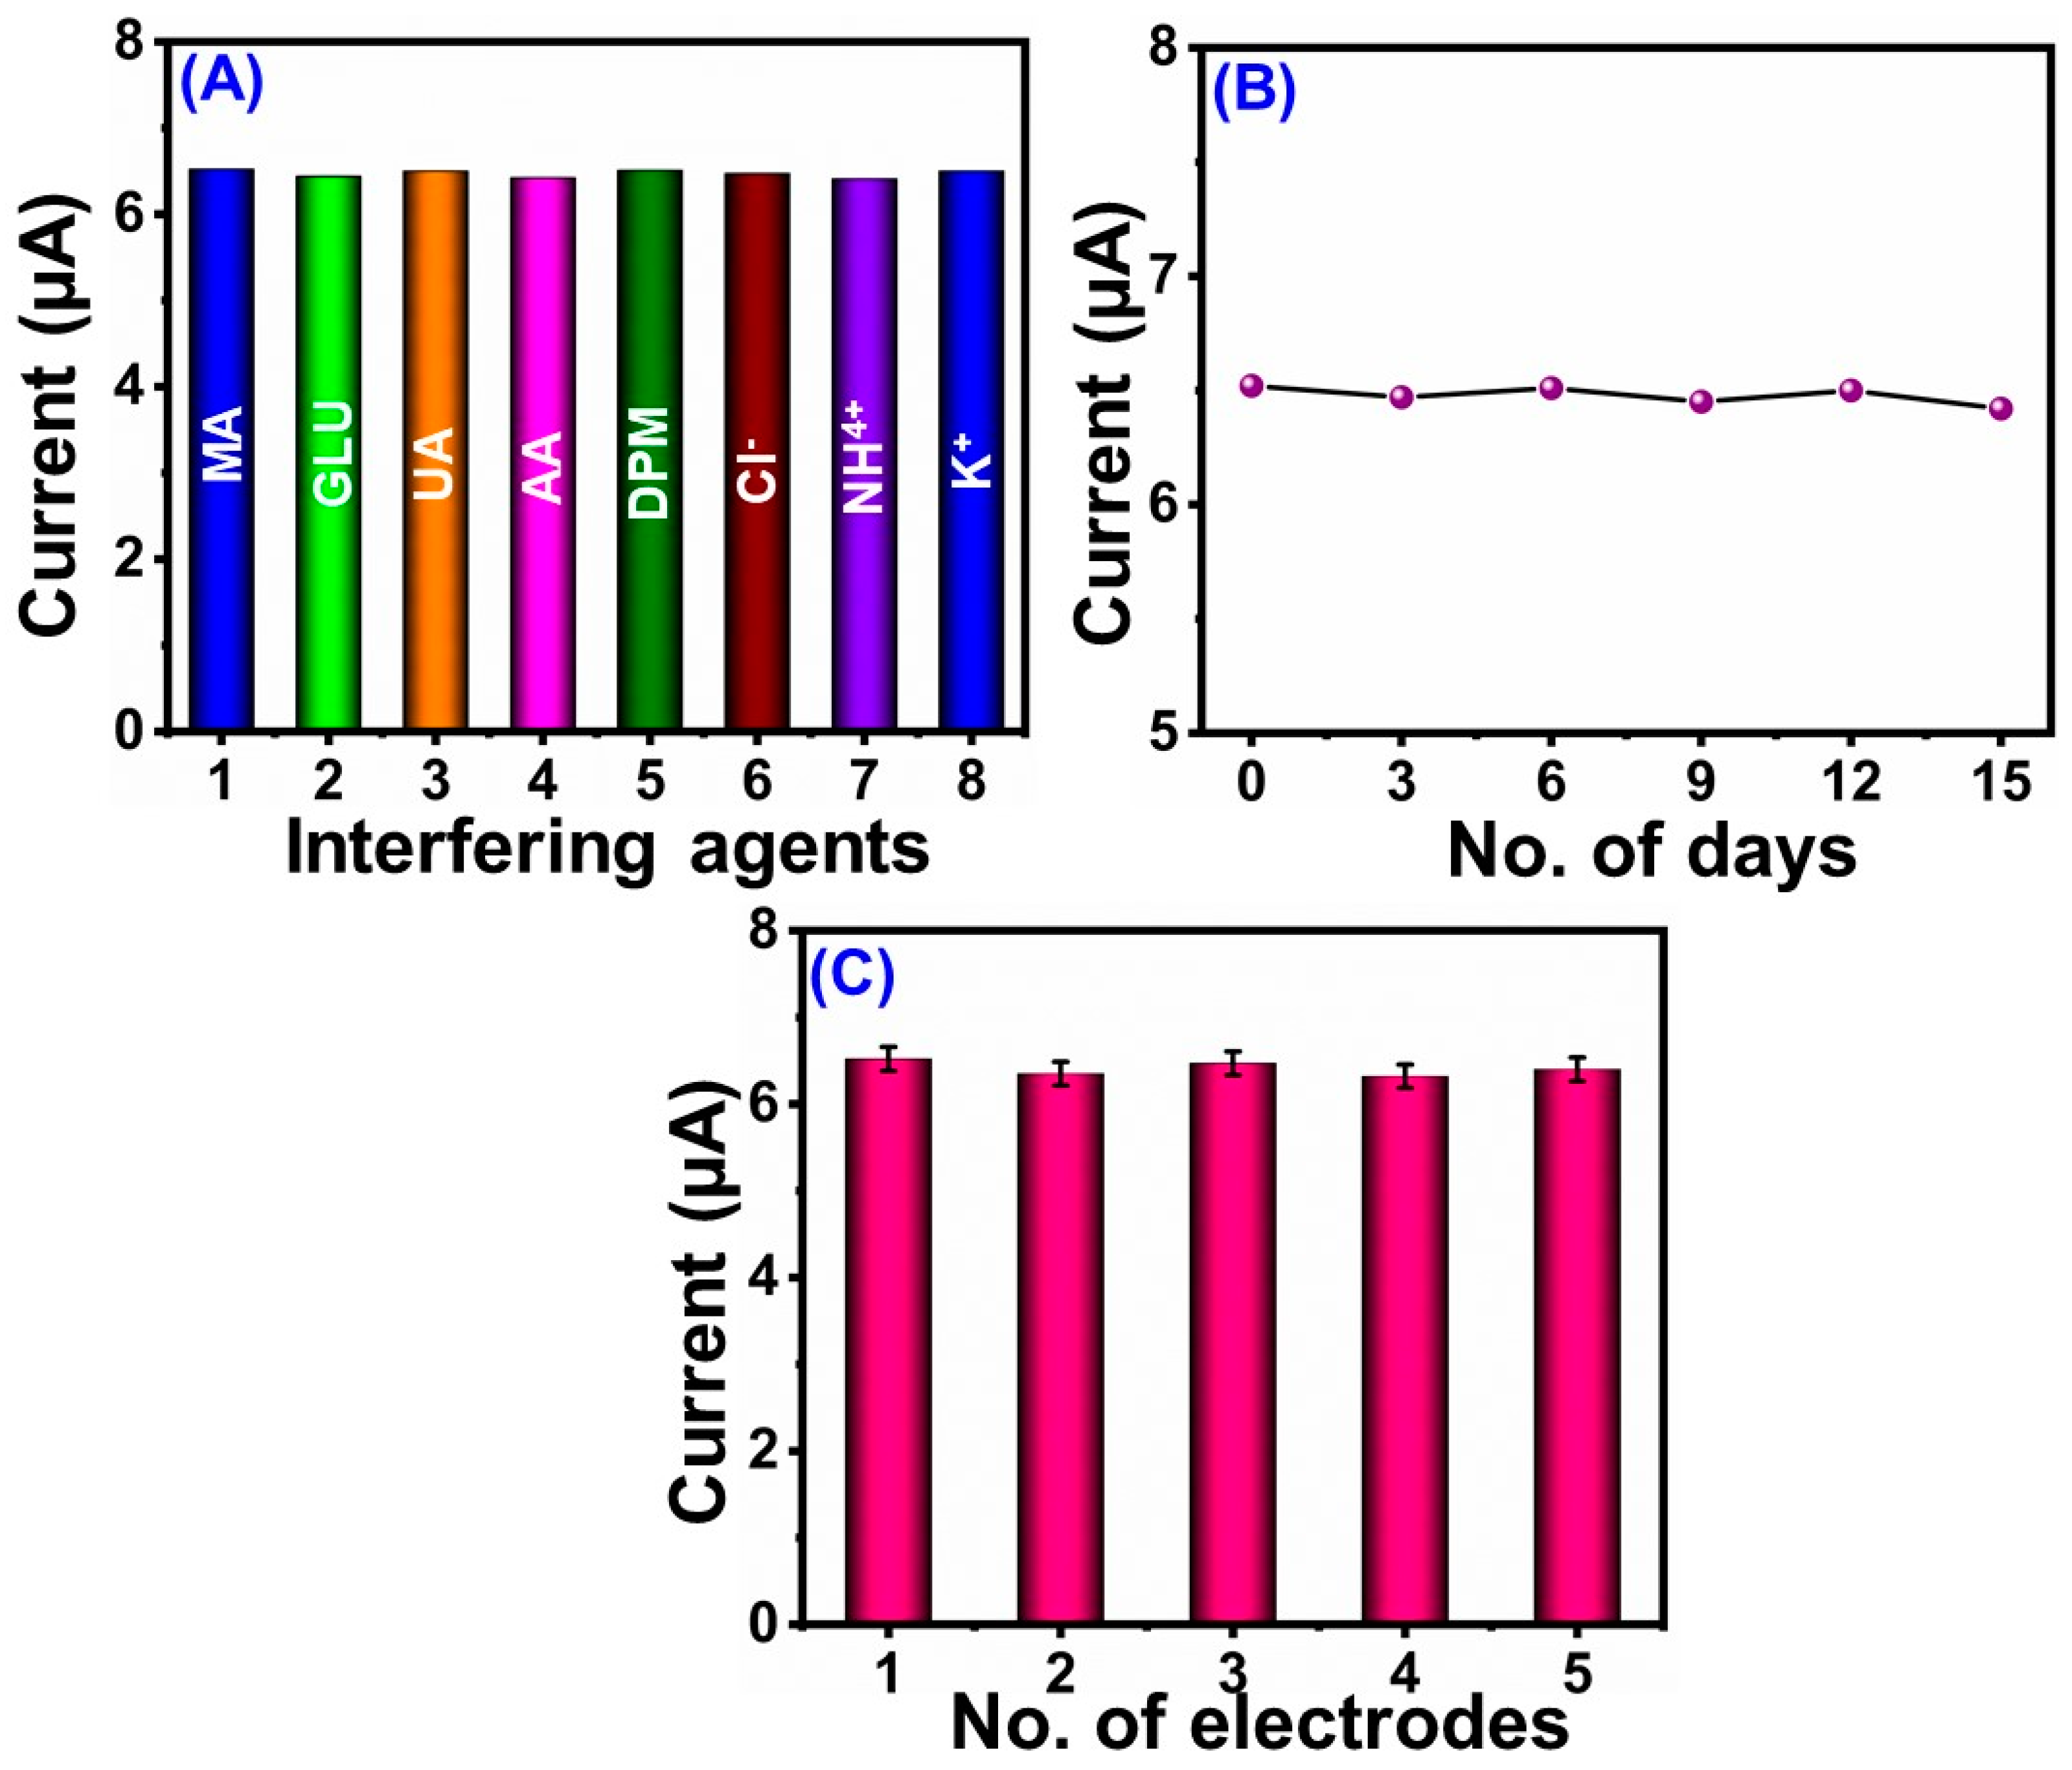
3.3.4. Selectivity Assay

Anti-interfering ability is one of the essential factors in assessing the potential to interfere with the signal generated by a sensor. The interfering agents, such as inorganic ions and organic molecules to MA, such as glucose (GLU), urea (UA), ascorbic acid (AA), Cl-, NH4+, and K+, were analyzed. Figure 8A shows the negligible change in the current of MA upon the addition of interfering reagents to 0.1 M PB supporting electrolyte containing 100 μM of MA. No considering changes were found, even in the presence of some interfering agents. Hence, this proves the selectivity of the proposed sensor DMO/CNF/GCE toward the detection of MA. The stability of the DMO/CNF/GCE is also an important category. The stability of the DMO/CNF/GCE proposed by DPV analysis was evaluated in 0.1 M PB solution at a scan rate of 50 mVs−1 in the presence of 100 μM of MA for about 15 days (Figure 8B). The stability response of DMO/CNF/GCE was tested by storing the electrode at an ambient temperature. Based on the observation, the peak current of DMO/CNF/GCE retained 98.4% of the original current even after 20 days, which proves the stability of the proposed sensor.
To ensure the ability of the proposed DMO/CNF/GCE, reproducibility was assessed by DPV analysis. The DPV response of five different modified electrodes was shown in Figure 8C, which was constructed for monitoring of 100 μM concentration of MA in 0.1 M PB supporting electrolyte at a scan rate of 50 mVs−1. The results of which confirmed the impressive reproducibility of DMO/CNF/GCE. According to the results, our proposed sensor has better reproducibility.

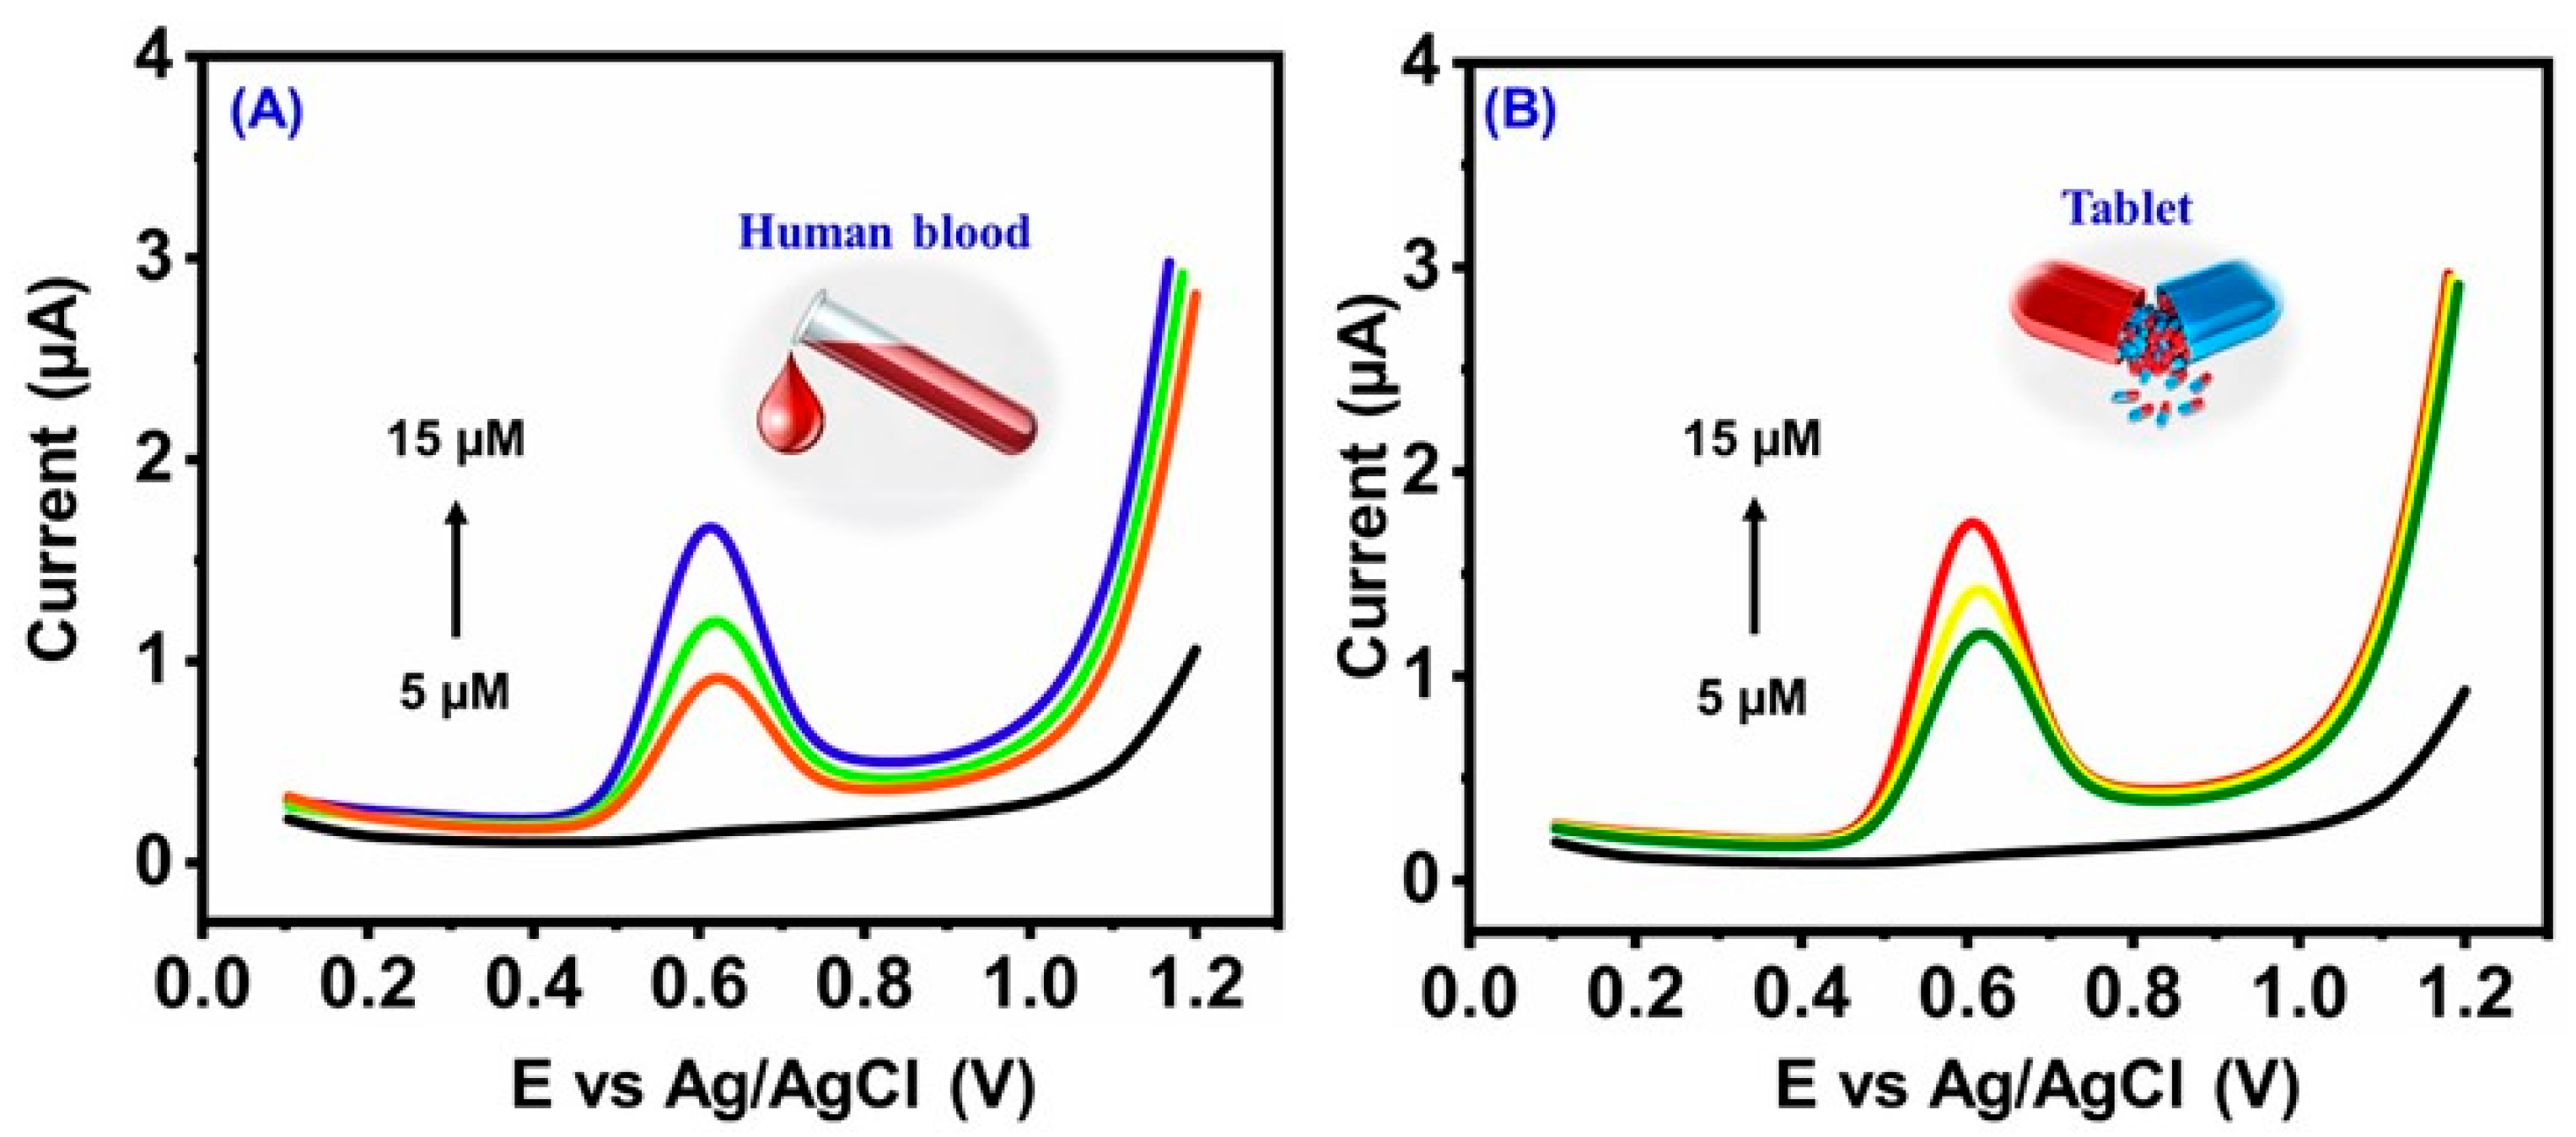
3.3.5. Real Sample Analysis

DPV technique was employed for the real-time analysis of our proposed sensor DMO/CNF/GCE (Figure 9). The prepared nanocomposite was used to determine the existence of MA in human blood and tablet.
The tablets were purchased from a pharma shop in Taipei, Taiwan. The human urine samples were collected from the Chang-Gung memorial hospital in Taiwan. In addition, the institutional review board of Chang-Gung memorial hospital (IRB No.201801660B), Taiwan, approved this study.
For the preparation of pharmaceutical samples, the tablet (5 mg) was manually homogenized to a fine powder. An adequate amount of this powder, equivalent to 1 mM, was weighed and dissolved in pure ethanol. The solution was sonicated for 15 min to achieve complete dissolution. The solution was filtered and stored for preparing working solutions for pharmaceutical formulations by taking suitable aliquots and diluting them with the same solvent and phosphate buffer.The human blood sample was collected from a healthy volunteer. The collected blood samples were centrifuged for 15 min at 1600 rpm. Finally, the supernatant generated was carefully separated using a clean pipette. Now, the blood sample was diluted 100 times with 1.0 × 10⁻¹ M phosphate buffer and stored in a refrigerator for further analysis.
Thus, the prepared sample was taken for DPV analysis, depicted in Figure 9. Table 2 summarizes the recovery results of the human blood and tablet as 99.8–98.4% and 99.8–98.2%. It was clear that the DMO/CNF/GCE was reliable and feasible for real sample analysis.

4. Conclusions

In this present work, DMO/CNF was prepared by the facile hydrothermal method. The crystal structure, composition, and morphology were confirmed by XRD, XPS, FE-SEM, and HR-TEM. Thus, our proposed sensor exhibits excellent electrocatalytic activity and selectivity toward the detection of MA. Added to that, CNF improves the electron transfer property, which results in the enhancement of the electrocatalytic property. The developed sensor shows a low LOD of 0.009 μM with a wide linear range of 0.01–741 μM. Satisfactory results were obtained for the real sample, such as human blood and tablet. Due to the synergetic effect between the DMO and CNF, which provides a higher surface area and effective electron transport, the electrochemical performance for the MA detection was very good. DMO/CNF is, therefore, a promising material for sensitive, inexpensive, and efficient sensors, making it possible for practical applications in anti-inflammatory medication sample monitoring.

Author Contributions

S.A.—conceptualization, investigation, writing—original draft, visualization. R.S.—conceptualization, supervision, methodology, investigation, writing—original draft, review and editing, visualization. S.-M.C.—conceptualization, validation, supervision, project administration, funding acquisition, J.M.D.—writing—original draft, B.R.—conceptualization, supervision writing—original draft, visualization, and N.C.—writing—original draft. All authors have read and agreed to the published version of the manuscript.

Funding

The authors are grateful for the financial support from the Ministry of Science and Technology (MOST), Taiwan, Project no. MOST 111-2113-M-027-002.

Data Availability Statement

All data generated or analyzed during this study are included in this published article.

Conflicts of Interest

The authors declare no conflict of interest.

References

  1. Zarghi, A.; Arfaei, S. Selective COX-2 inhibitors: A review of their structure-activity relationships. Iran. J. Pharm. Res. IJPR 2011, 10, 655. [Google Scholar] [PubMed]
  2. Ashira, T.; Rafeeque, T.M.; Maanvizhi, S.; Kathirvel, S.; Indukala, P.; Safeetha, S. Review for Analytical Methods for the Determination of Mefenamic Acid. J. Pharm. Res. Int. 2021, 33, 426–437. [Google Scholar] [CrossRef]
  3. Cimolai, N. The potential and promise of mefenamic acid. Expert Rev. Clin. Pharmacol. 2013, 6, 289–305. [Google Scholar] [CrossRef] [PubMed]
  4. Rajat, S.; Kumar, M.M.; Kumar, P.A.; Abhishek, S.; Krishna, K. An insight of non-steroidal anti-inflammatory drug mefenamic acid: A review. GSC Biol. Pharm. Sci. 2019, 7, 052–059. [Google Scholar]
  5. Moll, R.; Derry, S.; Moore, R.A.; McQuay, H.J. Single dose oral mefenamic acid for acute postoperative pain in adults. Cochrane Database Syst. Rev. 2011. [Google Scholar] [CrossRef]
  6. Liu, L.; Song, J. Voltammetric determination of mefenamic acid at lanthanum hydroxide nanowires modified carbon paste electrodes. Anal. Biochem. 2006, 354, 22–27. [Google Scholar] [CrossRef] [PubMed]
  7. Ruiz, T.P.; Lozano, C.M.N.; Tomás, V.; Carpena, J. Analysis of binary mixtures of flufenamic, meclofenamic and mefenamic acids by derivative synchronous fluorescence spectrometry. Talanta 1998, 47, 537–545. [Google Scholar] [CrossRef]
  8. Rouini, M.-R.; Asadipour, A.; Ardakani, Y.H.; Aghdasi, F. Liquid chromatography method for determination of mefenamic acid in human serum. J. Chromatogr. B 2004, 800, 189–192. [Google Scholar] [CrossRef] [PubMed]
  9. Aly, F.A.; Al-Tamimi, S.A.; Alwarthan, A.A. Determination of flufenamic acid and mefenamic acid in pharmaceutical preparations and biological fluids using flow injection analysis with tris (2, 2’-bipyridyl) ruthenium (II) chemiluminescence detection. Anal. Chim. Acta 2000, 416, 87–96. [Google Scholar] [CrossRef]
  10. Perez-Ruiz, T.; Martınez-Lozano, C.; Sanz, A.; Bravo, E. Determination of flufenamic, meclofenamic and mefenamic acids by capillary electrophoresis using β-cyclodextrin. J. Chromatogr. B Biomed. Sci. Appl. 1998, 708, 249–256. [Google Scholar] [CrossRef]
  11. García, S.; Sánchez-Pedreño, C.; Albero, I.; García, C. Flow-injection spectrophotometric determination of diclofenac or mefenamic acid in pharmaceuticals. Microchim. Acta 2001, 136, 67–71. [Google Scholar] [CrossRef]
  12. Ibrahim, F.; Sharaf El-Din, M.K.; El-Deen, A.K.; Shimizu, K. Micellar HPLC method for simultaneous determination of ethamsylate and mefenamic acid in presence of their main impurities and degradation products. J. Chromatogr. Sci. 2016, 55, 23–29. [Google Scholar] [CrossRef] [PubMed]
  13. Purohit, B.; Kumar, A.; Mahato, K.; Chandra, P. Novel sensing assembly comprising engineered gold dendrites and MWCNT-AuNPs nanohybrid for acetaminophen detection in human urine. Electroanalysis 2020, 32, 561–570. [Google Scholar] [CrossRef]
  14. Shetti, N.P.; Malode, S.J.; Vernekar, P.R.; Nayak, D.S.; Shetty, N.S.; Reddy, K.R.; Shukla, S.S.; Aminabhavi, T.M. Electro-sensing base for herbicide aclonifen at graphitic carbon nitride modified carbon electrode–Water and soil sample analysis. Microchem. J. 2019, 149, 103976. [Google Scholar] [CrossRef]
  15. Karimi-Maleh, H.; Cellat, K.; Arıkan, K.; Savk, A.; Karimi, F.; Şen, F. Palladium–Nickel nanoparticles decorated on Functionalized-MWCNT for high precision non-enzymatic glucose sensing. Mater. Chem. Phys. 2020, 250, 123042. [Google Scholar] [CrossRef]
  16. Karimi-Maleh, H.; Arotiba, O.A. Simultaneous determination of cholesterol, ascorbic acid and uric acid as three essential biological compounds at a carbon paste electrode modified with copper oxide decorated reduced graphene oxide nanocomposite and ionic liquid. J. Colloid Interface Sci. 2020, 560, 208–212. [Google Scholar] [CrossRef]
  17. Ferrari, A.G.-M.; Carrington, P.; Rowley-Neale, S.J.; Banks, C.E. Recent advances in portable heavy metal electrochemical sensing platforms. Environ. Sci. Water Res. Technol. 2020, 6, 2676–2690. [Google Scholar] [CrossRef]
  18. Kimmel, D.W.; LeBlanc, G.; Meschievitz, M.E.; Cliffel, D.E. Electrochemical sensors and biosensors. Anal. Chem. 2012, 84, 685–707. [Google Scholar] [CrossRef]
  19. Yu, J.; Li, J.; Zhao, F.; Zeng, B. Characterization of carbon nanotubes-gold nanoparticles composite film modified electrode and voltammetric determination of mefenamic acid. J. Braz. Chem. Soc. 2008, 19, 849–855. [Google Scholar] [CrossRef]
  20. Babaei, A.; Afrasiabi, M.; Babazadeh, M. A glassy carbon electrode modified with multiwalled carbon nanotube/chitosan composite as a new sensor for simultaneous determination of acetaminophen and mefenamic acid in pharmaceutical preparations and biological samples. Electroanalysis 2010, 22, 1743–1749. [Google Scholar] [CrossRef]
  21. Kianipour, S.; Asghari, A. Room temperature ionic liquid/multiwalled carbon nanotube/chitosan-modified glassy carbon electrode as a sensor for simultaneous determination of ascorbic acid, uric acid, acetaminophen, and mefenamic acid. IEEE Sens. J. 2013, 13, 2690–2698. [Google Scholar] [CrossRef]
  22. Malode, S.J.; Shetti, N.P.; Kulkarni, R.M. Voltammetric detection and determination of mefenamic acid at silver-doped TiO2 nanoparticles modified electrode. Mater. Today: Proc. 2019, 18, 671–678. [Google Scholar] [CrossRef]
  23. Shetti, N.P.; Nayak, D.S.; Malode, S.J.; Kakarla, R.R.; Shukla, S.S.; Aminabhavi, T.M. Sensors based on ruthenium-doped TiO2 nanoparticles loaded into multi-walled carbon nanotubes for the detection of flufenamic acid and mefenamic acid. Anal. Chim. Acta 2019, 1051, 58–72. [Google Scholar] [CrossRef]
  24. Bonyadi, S.; Ghanbari, K.; Ghiasi, M. All-electrochemical synthesis of a three-dimensional mesoporous polymeric GC3N4/PANI/CdO nanocomposite and its application as a novel sensor for the simultaneous determination of epinephrine, paracetamol, mefenamic acid, and ciprofloxacin. New J. Chem. 2020, 44, 3412–3424. [Google Scholar] [CrossRef]
  25. Akbarian, Y.; Shabani-Nooshabadi, M.; Karimi-Maleh, H. Fabrication of a new electrocatalytic sensor for determination of diclofenac, morphine and mefenamic acid using synergic effect of NiO-SWCNT and 2, 4-dimethyl-N/-[1-(2,3-dihydroxy phenyl) methylidene] aniline. Sens. Actuators B Chem. 2018, 273, 228–233. [Google Scholar] [CrossRef]
  26. Farshchi, F.; Hasanzadeh, M.; Feyziazar, M.; Saadati, A.; Hassanpour, S. Electropolymerization of chitosan in the presence of CuNPs on the surface of a copper electrode: An advanced nanocomposite for the determination of mefenamic acid and indomethacin in human plasma samples and prevention of drug poisoning. Anal. Methods 2020, 12, 1212–1217. [Google Scholar] [CrossRef]
  27. Wang, J.; Lin, Y. Functionalized carbon nanotubes and nanofibers for biosensing applications. TrAC Trends Anal. Chem. 2008, 27, 619–626. [Google Scholar] [CrossRef]
  28. Feng, L.; Xie, N.; Zhong, J. Carbon nanofibers and their composites: A review of synthesizing, properties and applications. Materials 2014, 7, 3919–3945. [Google Scholar] [CrossRef]
  29. Klein, K.L.; Melechko, A.V.; McKnight, T.E.; Retterer, S.T.; Rack, P.D.; Fowlkes, J.D.; Joy, D.C.; Simpson, M.L. Surface characterization and functionalization of carbon nanofibers. J. Appl. Phys. 2008, 103, 3. [Google Scholar] [CrossRef]
  30. Thamer, B.M.; Aldalbahi, A.; Moydeen, A.M.; Al-Enizi, A.M.; El-Hamshary, H.; El-Newehy, M.H. Fabrication of functionalized electrospun carbon nanofibers for enhancing lead-ion adsorption from aqueous solutions. Sci. Rep. 2019, 9, 19467. [Google Scholar] [CrossRef]
  31. Durmus, Z.; Durmus, A.; Bektay, M.Y.; Kavas, H.; Unver, I.S.; Aktas, B. Quantifying structural and electromagnetic interference (EMI) shielding properties of thermoplastic polyurethane–carbon nanofiber/magnetite nanocomposites. J. Mater. Sci. 2016, 51, 8005–8017. [Google Scholar] [CrossRef]
  32. Ahmad, J.; Bukhari, S.H.; Jamil, M.T.; Rehmani, M.K.; Ahmad, H.; Sultan, T. Lattice dynamics and transport properties of multiferroic DyMn2O5. Adv. Condens. Matter Phys. 2017, 2017, 5389573. [Google Scholar] [CrossRef]
  33. Kaddar, Y.; Zaari, H.; Rachadi, A.; Benyoussef, A.; El Kenz, A.; Balli, M. Theoretical study of the electronic structure, magnetic and magnetocaloric properties of the DyMn2O5 multiferroic. J. Magn. Magn. Mater. 2021, 530, 167890. [Google Scholar] [CrossRef]
  34. Wilkinson, C.; Sinclair, F.; Gardner, P.; Forsyth, J.; Wanklyn, B. The antiferromagnetic structure of DyMn2O5 at 4.2 K. J. Phys. C Solid State Phys. 1981, 14, 1671. [Google Scholar] [CrossRef]
  35. Balli, M.; Jandl, S.; Fournier, P.; Kedous-Lebouc, A. Advanced materials for magnetic cooling: Fundamentals and practical aspects. Appl. Phys. Rev. 2017, 4, 021305. [Google Scholar] [CrossRef]
  36. Wu, S.; Mei, Y. Hydrothermal synthesis of DyMn2O5 nanorods and their magnetic properties. J. Alloy. Compd. 2014, 583, 309–312. [Google Scholar] [CrossRef]
  37. Higashiyama, D.; Miyasaka, S.; Kida, N.; Arima, T.; Tokura, Y. Control of the ferroelectric properties of Dy Mn2O5 by magnetic fields. Phys. Rev. B 2004, 70, 174405. [Google Scholar] [CrossRef]
  38. Tung, Y.-H.; Yang, C.-C.; Hsu, T.-W.; Kao, C.-W.; Chen, Y.Y. Size effects on magnetic property of multiferroic DyMn2O5 nanorods. AIP Adv. 2017, 7, 055830. [Google Scholar] [CrossRef]
  39. Bukhari, S.H.; Ahmad, J. Evidence for magnetic correlation in the paramagnetic phase of DyMn2O5. Phys. B Condens. Matter 2016, 503, 179–182. [Google Scholar] [CrossRef]
  40. Zhao, Z.; Liu, M.; Li, X.; Wang, J.; Yan, Z.; Wang, K.; Liu, J.-M. Reversing ferroelectric polarization in multiferroic DyMn2O5 by nonmagnetic Al substitution of Mn. J. Appl. Phys. 2014, 116, 054104. [Google Scholar] [CrossRef]
  41. García-Flores, A.; Granado, E.; Martinho, H.; Urbano, R.; Rettori, C.; Golovenchits, E.; Sanina, V.; Oseroff, S.; Park, S.; Cheong, S.-W. Anomalous phonon shifts in the paramagnetic phase of multiferroic R Mn2O5 (R= Bi, Eu, Dy): Possible manifestations of unconventional magnetic correlations. Phys. Rev. B 2006, 73, 104411. [Google Scholar] [CrossRef]
  42. Tajiri, T.; Deguchi, H.; Mito, M.; Konishi, K.; Miyahara, S.; Kohno, A. Effect of size on the magnetic properties and crystal structure of magnetically frustrated DyMn2O5 nanoparticles. Phys. Rev. B 2018, 98, 064409. [Google Scholar] [CrossRef]
  43. Khataee, A.; Darvishi Cheshmeh Soltani, R.; Hanifehpour, Y.; Safarpour, M.; Gholipour Ranjbar, H.; Joo, S.W. Synthesis and characterization of dysprosium-doped ZnO nanoparticles for photocatalysis of a textile dye under visible light irradiation. Ind. Eng. Chem. Res. 2014, 53, 1924–1932. [Google Scholar] [CrossRef]
  44. El-Deen, A.G.; Barakat, N.A.; Khalil, K.A.; Kim, H.Y. Hollow carbon nanofibers as an effective electrode for brackish water desalination using the capacitive deionization process. New J. Chem. 2014, 38, 198–205. [Google Scholar] [CrossRef]
  45. Yousefi, S.R.; Masjedi-Arani, M.; Morassaei, M.S.; Salavati-Niasari, M.; Moayedi, H. Hydrothermal synthesis of DyMn2O5/Ba3Mn2O8 nanocomposite as a potential hydrogen storage material. Int. J. Hydrog. Energy 2019, 44, 24005–24016. [Google Scholar] [CrossRef]
  46. Brown, A.P.; Anson, F.C. Electron transfer kinetics with both reactant and product attached to the electrode surface. J. Electroanal. Chem. Interfacial Electrochem. 1978, 92, 133–145. [Google Scholar] [CrossRef]
  47. Sundaresan, R.; Mariyappan, V.; Chen, S.-M.; Ramachandran, B.; Paulsamy, R.; Rasu, R. Construction of an electrochemical sensor towards environmental hazardous 4-nitrophenol based on Nd(OH)3-embedded VSe2 nanocomposite. Environ. Sci. Pollut. Res. 2023, 1–14. [Google Scholar] [CrossRef]
  48. Sundaresan, R.; Mariyappan, V.; Chen, T.-W.; Chen, S.-M.; Akilarasan, M.; Liu, X.; Yu, J. One-dimensional rare-earth tungstate nanostructure encapsulated reduced graphene oxide electrocatalyst-based electrochemical sensor for the detection of organophosphorus pesticide. J. Nanostructure Chem. 2023, 1–14. [Google Scholar] [CrossRef]
  49. Tarlekar, P.; Chatterjee, S. Enhancement in sensitivity of non-steroidal anti-inflammatory drug mefenamic acid at carbon nanostructured sensor. J. Electroanal. Chem. 2017, 803, 51–57. [Google Scholar] [CrossRef]
  50. Babaei, A.; Khalilzadeh, B.; Afrasiabi, M. A new sensor for the simultaneous determination of paracetamol and mefenamic acid in a pharmaceutical preparation and biological samples using copper (II) doped zeolite modified carbon paste electrode. J. Appl. Electrochem. 2010, 40, 1537–1543. [Google Scholar] [CrossRef]
  51. Hasanzadeh, M.; Shadjou, N.; Saghatforoush, L.; Dolatabadi, J.E.N. Preparation of a new electrochemical sensor based on iron (III) complexes modified carbon paste electrode for simultaneous determination of mefenamic acid and indomethacin. Colloids Surf. B Biointerfaces 2012, 92, 91–97. [Google Scholar] [CrossRef] [PubMed]
  52. Bukkitgar, S.D.; Shetti, N.P.; Nayak, D.S.; Bagehalli, G.B.; Nandibewoor, S.T. Electrochemical sensor for the detection of mefenamic acid in pharmaceutical sample and human urine at glassy carbon electrode. Der Pharma Chem. 2014, 6, 258–268. [Google Scholar]
  53. Petković, B.B.; Ognjanović, M.; Krstić, M.; Stanković, V.; Babincev, L.; Pergal, M.; Stanković, D.M. Boron-doped diamond electrode as efficient sensing platform for simultaneous quantification of mefenamic acid and indomethacin. Diam. Relat. Mater. 2020, 105, 107785. [Google Scholar] [CrossRef]
  54. Babaei, A.; Rezaei, E.; Sohrabi, M.; Hasani, O.K. A Sensitive Simultaneous Determination of Epinephrine, Mefenamic Acid and Acetaminophen Using a Nickel Hydroxide Nanoparticles/Multiwalled Carbon Nanotubes Modified electrode. Anal. Bioanal. Electrochem. 2015, 7, 302–317. [Google Scholar]
Scheme 1. Schematic representation of the synthesis of DMO/CNF.
Carbon 09 00047 sch001
Figure 1. FESEM images of (A) DMO, (B) CNF, (C) DMO/CNF, and TEM images of (D,E) DMO/CNF, (F,G) HR-TEM images of SAED pattern and lattice fringes of DMO/CNF nanocomposite.
Carbon 09 00047 g001
Figure 2. (A) The survey mixed elemental mapping. (BE) shows the confirmed elemental of Dy, Mn, O, and C, (F) EDX spectrum of DMO/CNF nanocomposite.
Carbon 09 00047 g002
Figure 3. (A,B) XRD of DMO, CNF, and DMO/CNF and Raman spectrum of CNF and DMO/CNF.
Carbon 09 00047 g003
Figure 4. (A) Nyquist plot and (B) CV current response of different modified electrodes, (C) CV current response of DMO/CNF/GCE at different scan rates, (D) corresponding linear graph of DMO/CNF/GCE. In electrolyte 5 mM [Fe (CN)6]3−/4− containing 0.1 M KCl (FC system).
Carbon 09 00047 g004
Figure 5. (A) CV response of different modified electrodes, (B) corresponding bar diagram of modified electrodes, (C) CV response of different pH for DMO/CNF/GCE, (D) corresponding calibration plot for pH vs. current, and (E) corresponding plot for pH vs. potential.
Carbon 09 00047 g005
Scheme 2. Schematic representation of oxidation mechanism of mefenamic acid.
Carbon 09 00047 sch002
Figure 6. (A) CV current response of various concentrations for DMO/CNF/GCE, (B) corresponding calibration plot for current vs. MA concentration, (C) CV current response of increasing scan rate for DMO/CNF/GCE, (D) corresponding linear plot for current against square root of scan rate.
Carbon 09 00047 g006
Figure 7. (A) DPV current response of DMO/CNF/GCE in increasing concentration, (B) corresponding calibration plot for current vs. concentration of MA.
Carbon 09 00047 g007
Figure 8. (A) The selectivity of DMO/CNF/GCE contains 100 μM of MA in the presence of some interfering reagents, (B) the stability of the DMO/CNF/GCE, and (C) Reproducibility of current response bar diagram towards 100 µM of MA by five different electrodes DMO/f-CNF/GCE.
Carbon 09 00047 g008
Figure 9. DPV response of real sample analysis in spiked MA in (A) Human blood and (B) tablet sample.
Carbon 09 00047 g009
Table 1. Comparison of a feature of electrochemical sensor for detection of MA.
Working ElectrodeLOD (μM)Linear Range (μM)MethodReference
a SWNT/b GCE0.01340.1–35f SWV[49]
Cu2+Y/ZMCPE0.0400.3–100g DPV[50]
Fe (III)-SBMCPE0.0200.02–150DPV[51]
GCE0.151.00–1000DPV[52]
CdO/PANI/c mpg-C3N4/GCE0.0450.20–400DPV[24]
BDDE0.0780.50–100DPV[53]
NiO-SWCNTs/DDPM/d CPE0.501.00–600SWV[25]
e MWCNTs–NHNPs/GCE0.0400.10–85.0DPV[54]
MWCNTs-CHT/GCE0.664–200DPV[20]
DMO/CNF/GCE0.0090.01–741DPVThis work
a SWNT: single-walled carbon nanotube; b GCE: glassy carbon electrode; mpg-c C3N4: mesoporous polymeric graphitic carbon nitrite; d CPE: carbon paste electrode; e MWCNT: multi-walled carbon nanotubes; f SWV: square wave voltammetry; g DPV: differential pulse voltammetry.
Table 2. Detection of MA in biological samples by DMO/f-CNF/GCE.
SampleMA
Added (μM)
Found (μM)Recovery (%)
Human blood5
10
4.97
9.95
99.4
99.5
1514.9899.8
Tablet5
10
4.91
9.96
98.2
99.6
1514.9799.8
Disclaimer/Publisher’s Note: The statements, opinions and data contained in all publications are solely those of the individual author(s) and contributor(s) and not of MDPI and/or the editor(s). MDPI and/or the editor(s) disclaim responsibility for any injury to people or property resulting from any ideas, methods, instructions or products referred to in the content.

