Article

Underwater Shock Wave-Enhanced Cavitation to Induce Morphological Changes and Cell Permeabilization in Microscopic Fungi

by
Miguel A. Martínez-Maldonado
1,
Blanca E. Millán-Chiu
2,*,
Francisco Fernández
1,
Daniel Larrañaga
3,
Miguel A. Gómez-Lim
4 and
Achim M. Loske
1,*
1
Centro de Física Aplicada y Tecnología Avanzada, Universidad Nacional Autónoma de México, Blvd. Juriquilla 3001, Querétaro 76230, Mexico
2
CONACyT, Centro de Física Aplicada y Tecnología Avanzada, Universidad Nacional Autónoma de México, Blvd. Juriquilla 3001, Querétaro 76230, Mexico
3
Posgrado en Ciencia e Ingeniería de los Materiales, Centro de Física Aplicada y Tecnología Avanzada, Universidad Nacional Autónoma de México, Blvd. Juriquilla 3001, Querétaro 76230, Mexico
4
Centro de Investigación y Estudios Avanzados del Instituto Politécnico Nacional, Unidad Irapuato, Km 9.6 Libramiento Norte Carretera Irapuato-León, Irapuato 36824, Mexico
*
Authors to whom correspondence should be addressed.
Fluids 2024, 9(4), 81; https://doi.org/10.3390/fluids9040081
Submission received: 31 January 2024 / Revised: 6 March 2024 / Accepted: 21 March 2024 / Published: 22 March 2024
(This article belongs to the Special Issue Cavitation and Bubble Dynamics)

Abstract

:
Since the discovery of extracorporeal lithotripsy, there has been an increased interest in studying shock wave-induced cavitation, both to improve this technique and to explore novel biotechnological applications. As shock waves propagate through fluids, pre-existing microbubbles undergo expansion and collapse, emitting high-speed microjets. These microjets play a crucial role in the pulverization of urinary stones during lithotripsy and have been utilized in the delivery of drugs and genetic materials into cells. Their intensity can be amplified using tandem shock waves, generated so that the second wave reaches the bubbles, expanded by the first wave, during their collapse. Nevertheless, there is little information regarding the control of microjet emissions. This study aimed to demonstrate that specific effects can be obtained by tuning the delay between the first and second shock waves. Suspensions containing Aspergillus niger, a microscopic fungus that produces metabolites with high commercial value, were exposed to single-pulse and tandem shock waves. Morphological changes were analyzed by scanning and transmission electron microscopy. Proteins released into the medium after shock wave exposure were also studied. Our findings suggest that, with enhanced control over cavitation, the detachment of proteins using conventional methods could be significantly optimized in future studies.

1. Introduction

Acoustic cavitation, initially studied in the early 20th century due to its role in liquid-impact erosion [1], also made a significant breakthrough in medicine in the 1980s with the advent of extracorporeal shock wave lithotripsy (SWL) [2,3]. For over 40 years, SWL has been successfully used for the non-invasive disintegration of urinary stones. Shock waves are generated outside the body in water and focused on the stone, leading to its pulverization after several hundred shock fronts. The theory of underwater shock wave-induced cavitation for medical and biotechnological applications is well-established. Research on this topic has been extensively conducted and documented by several authors since the early 1980s [4,5,6,7,8,9,10].
Cavitation plays a critical role in SWL [11,12,13]. When a shock front reaches a urinary stone and the surrounding fluid, pre-existing microbubbles undergo a forced collapse, followed by a rapid rebound that causes them to grow to volumes much larger than the initial ones. Within hundreds of microseconds, each bubble suffers an asymmetric inertial collapse, partly invaginating and generating a high-speed microjet of liquid, which pierces through the bubble and exits it at the opposite side. According to studies published by Philipp and colleagues [4], the speed of the microjets exceeds 700 m/s. Despite their limited range, microjets emitted by bubbles near the stone significantly contribute to its pulverization. The phenomenon is similar to the erosion experienced by propeller blades or turbines in liquids. The impact between the microjet and the collapsing bubble’s wall is so intense that a secondary shock wave is generated, which can contribute to the observed effects and interact with neighboring bubbles.
During bubble collapse, the local energy density increases enormously. This can generate extremely high temperatures as well as free radicals capable of inactivating enzymes and causing cellular apoptosis [8]. Because the temperature increases are highly localized, they virtually do not contribute to a rise in temperature within the vial.
The two most popular equations for studying the dynamics of bubbles exposed to shock waves of the type mentioned here are the Rayleigh–Plesset equation and the Gilmore equation [9]. An advantage of the Gilmore equation is that it accounts for the compressibility of the fluid, which proves useful for describing inertial collapses.
From the late 20th century to the beginning of the current one, significant efforts were made to enhance the efficiency of extracorporeal lithotripters by adjusting the power of microjets, aiming to shorten treatment times and minimize tissue damage [14,15,16]. A notable innovation in this field is the tandem system [17], which basically involves emitting pairs of successive shock fronts, at a controlled, adjustable delay ranging from 50 to 950 µs. Each emitted pair, known as an “event”, can be repeated at frequencies adjustable from 1/3 to 3 Hz, depending on the application.
In the past, we used different pressure profiles with the aim of controlling bubble collapse and microjet formation [17,18,19] and hypothesized that enhancing bubble collapse and microjet emission is possible when the second shock front in each event arrives during the inertial collapse of the bubbles generated by the first shock wave. This has been demonstrated in both in vitro [17,18] and in vivo [18,19] studies. Cavitation, being a multi-bubble phenomenon with uncontrollable variables like the number, size, and distribution of pre-existing microbubbles, makes it challenging to determine an optimal delay applicable to all treatments. Nevertheless, delays between 250 and 350 µs have been shown to improve stone-phantom fragmentation efficiency, supporting the described hypothesis.
The knowledge that the diameter of a microjet emitted during shock wave-induced bubble collapse is approximately one-tenth of the bubble´s diameter [20,21,22] suggests the possibility of using tandem shock waves to selectively favor the formation of microjets of a specific diameter. These high-energy, short-range microjets may function like microscopic syringes [20], injecting liquid into nearby cells.
The phenomenon has been successfully utilized in biotechnology for the genetic transformation of bacteria and fungi [23,24], as well as for extracting phenolic acids and flavonoids from plants [25]. Bacteria and fungi were subjected to shock waves in a vial containing an aqueous solution and the transformant. The shock wave-induced fluid microjets temporally increased cell membrane permeability, facilitating the internalization of DNA into the cells. For phytochemical extraction, plant samples in powdered form were placed in a vial with water or ethanol as a solvent and exposed to shock waves. The resulting microjets broke down the plant particles, releasing their contents.
The complexity of the described processes arises from the multitude of variables involved. To date, there are no precise methods for controlling microjet emissions. Thus, it is not surprising that, despite careful estimation of the parameters before an experiment, in most cases, replicates are necessary to adjust the number of shock waves, the pressure profile and the delay to continue exploring the biotechnological applications of induced cavitation. Moreover, the dynamics of a bubble exposed to the action of a shock wave in water depend on other factors, such as the content of dissolved gases, the pressure profile, of the impinging shock wave, the vapor pressure, and the presence of cavitation nuclei [26]. Determining an optimal delay is further complicated by the large number of bubbles present in the suspension, all of which are collapsing and interacting with each other.
In cases related to genetic transformation or the extraction of compounds, it is worth highlighting the size of the microjet in relation to the target (on a statistical level). Thus, microjets with a size comparable to the object can disintegrate it, while much smaller microjets have facilitated the genetic transformation of bacteria and microscopic fungi, raising the question about the effects that microjets of more extreme sizes could cause. Some could detach the so-called “ornamentation” of fungal conidia without damaging the overall structure. This is of interest for the extraction of proteins relevant to biotechnology, which are in the outer layers.
Following the aforementioned discussion about the possibility of using tandem shock waves to selectively favor the formation of microjets of a specific diameter, the aim of this study was to analyze cell wall proteins from A. niger conidia (see next Section) using single-pulse (SP) shock waves and tandem shock waves with two different delays (SDT: short-delay tandem and LDT: long-delay tandem), recording the cell wall morphological changes by scanning electron microscopy (SEM) and transmission electron microscopy (TEM), and analyzing the proteins released into the medium after shock wave application by sodium dodecyl sulfate-polyacrylamide gel electrophoresis (SDS-PAGE). Our findings suggest that protein detachment can be optimized by selecting an adequate delay between the first and second shock waves.

2. Materials and Methods

2.1. Biological Subject

In this study, we used the fungus Aspergillus niger as a model microorganism due to its significant relevance in research and industrial applications [27]. It is a filamentous fungus that has been harnessed, modified, and used in the biotechnological industry for over a century. Among the principal features of A. niger is its capability to produce primary and secondary metabolites with high commercial value, such as organic acids, proteins, and enzymes [28]. In addition, its capacity to perform posttranslational modifications and its secretory systems make it a valuable microorganism for use as an expression platform for producing recombinant molecules [29]. A. niger has been called a “cell factory” and classified as “generally regarded as safe” (GRAS) [30,31]. A recent use of this fungus is the postfermentation harvesting of cell wall products to obtain polysaccharides such as chitin and chitosan, which have proven to be useful in medicine, biotechnology, and agriculture [32]. A. niger, like other fungal species, has specific molecular biosynthesis needs, such as the conservation of its osmotic balance, its cellular structure, the morphogenesis process, and protection against environmental factors. These requirements are achieved to a large extent by the cell wall, which undergoes constant and diverse structural changes [32,33]. The cell wall is characterized by a layered structure composed of matrix polymer components such as carbohydrates (α-glucans, β-glucans, chitin, and galactomannan), surface proteins, glycoproteins, hydrophobins, and pigments such as melanin [34,35]. These components, principally proteins, play an essential role in the interaction between cells and their environment, participating in crucial processes such as signal transduction, cell adhesion, cell–cell interactions, molecular transport, and pathogenicity [35]. The content and composition of the cell wall differ among strains and depend on environmental factors, such as nutrients, growth culture medium, mycelial age, and stress [36]. Enhanced entry of plasmids into the cell via shock wave-induced transient pores has been possible despite the barrier of the cell wall [37].

2.2. Fungal Growth and Conidia Harvesting

The A. niger CBS 513.88 strain was used. Fungal inoculation was performed in Petri dishes with minimal medium agar, and the plates were incubated for six days at 30 °C. After that, conidia were collected by adding 5 mL of minimal medium broth over the colony and lightly scratching the colony to harvest it. Three layers of sterile Miracloth (EMD Millipore, MA, USA, catalog number 475855) were used as filters for removing conidiophores in the suspension. Conidia were counted with a Neubauer chamber and adjusted with minimal medium to a final concentration of 2 × 10⁶ conidia/mL.

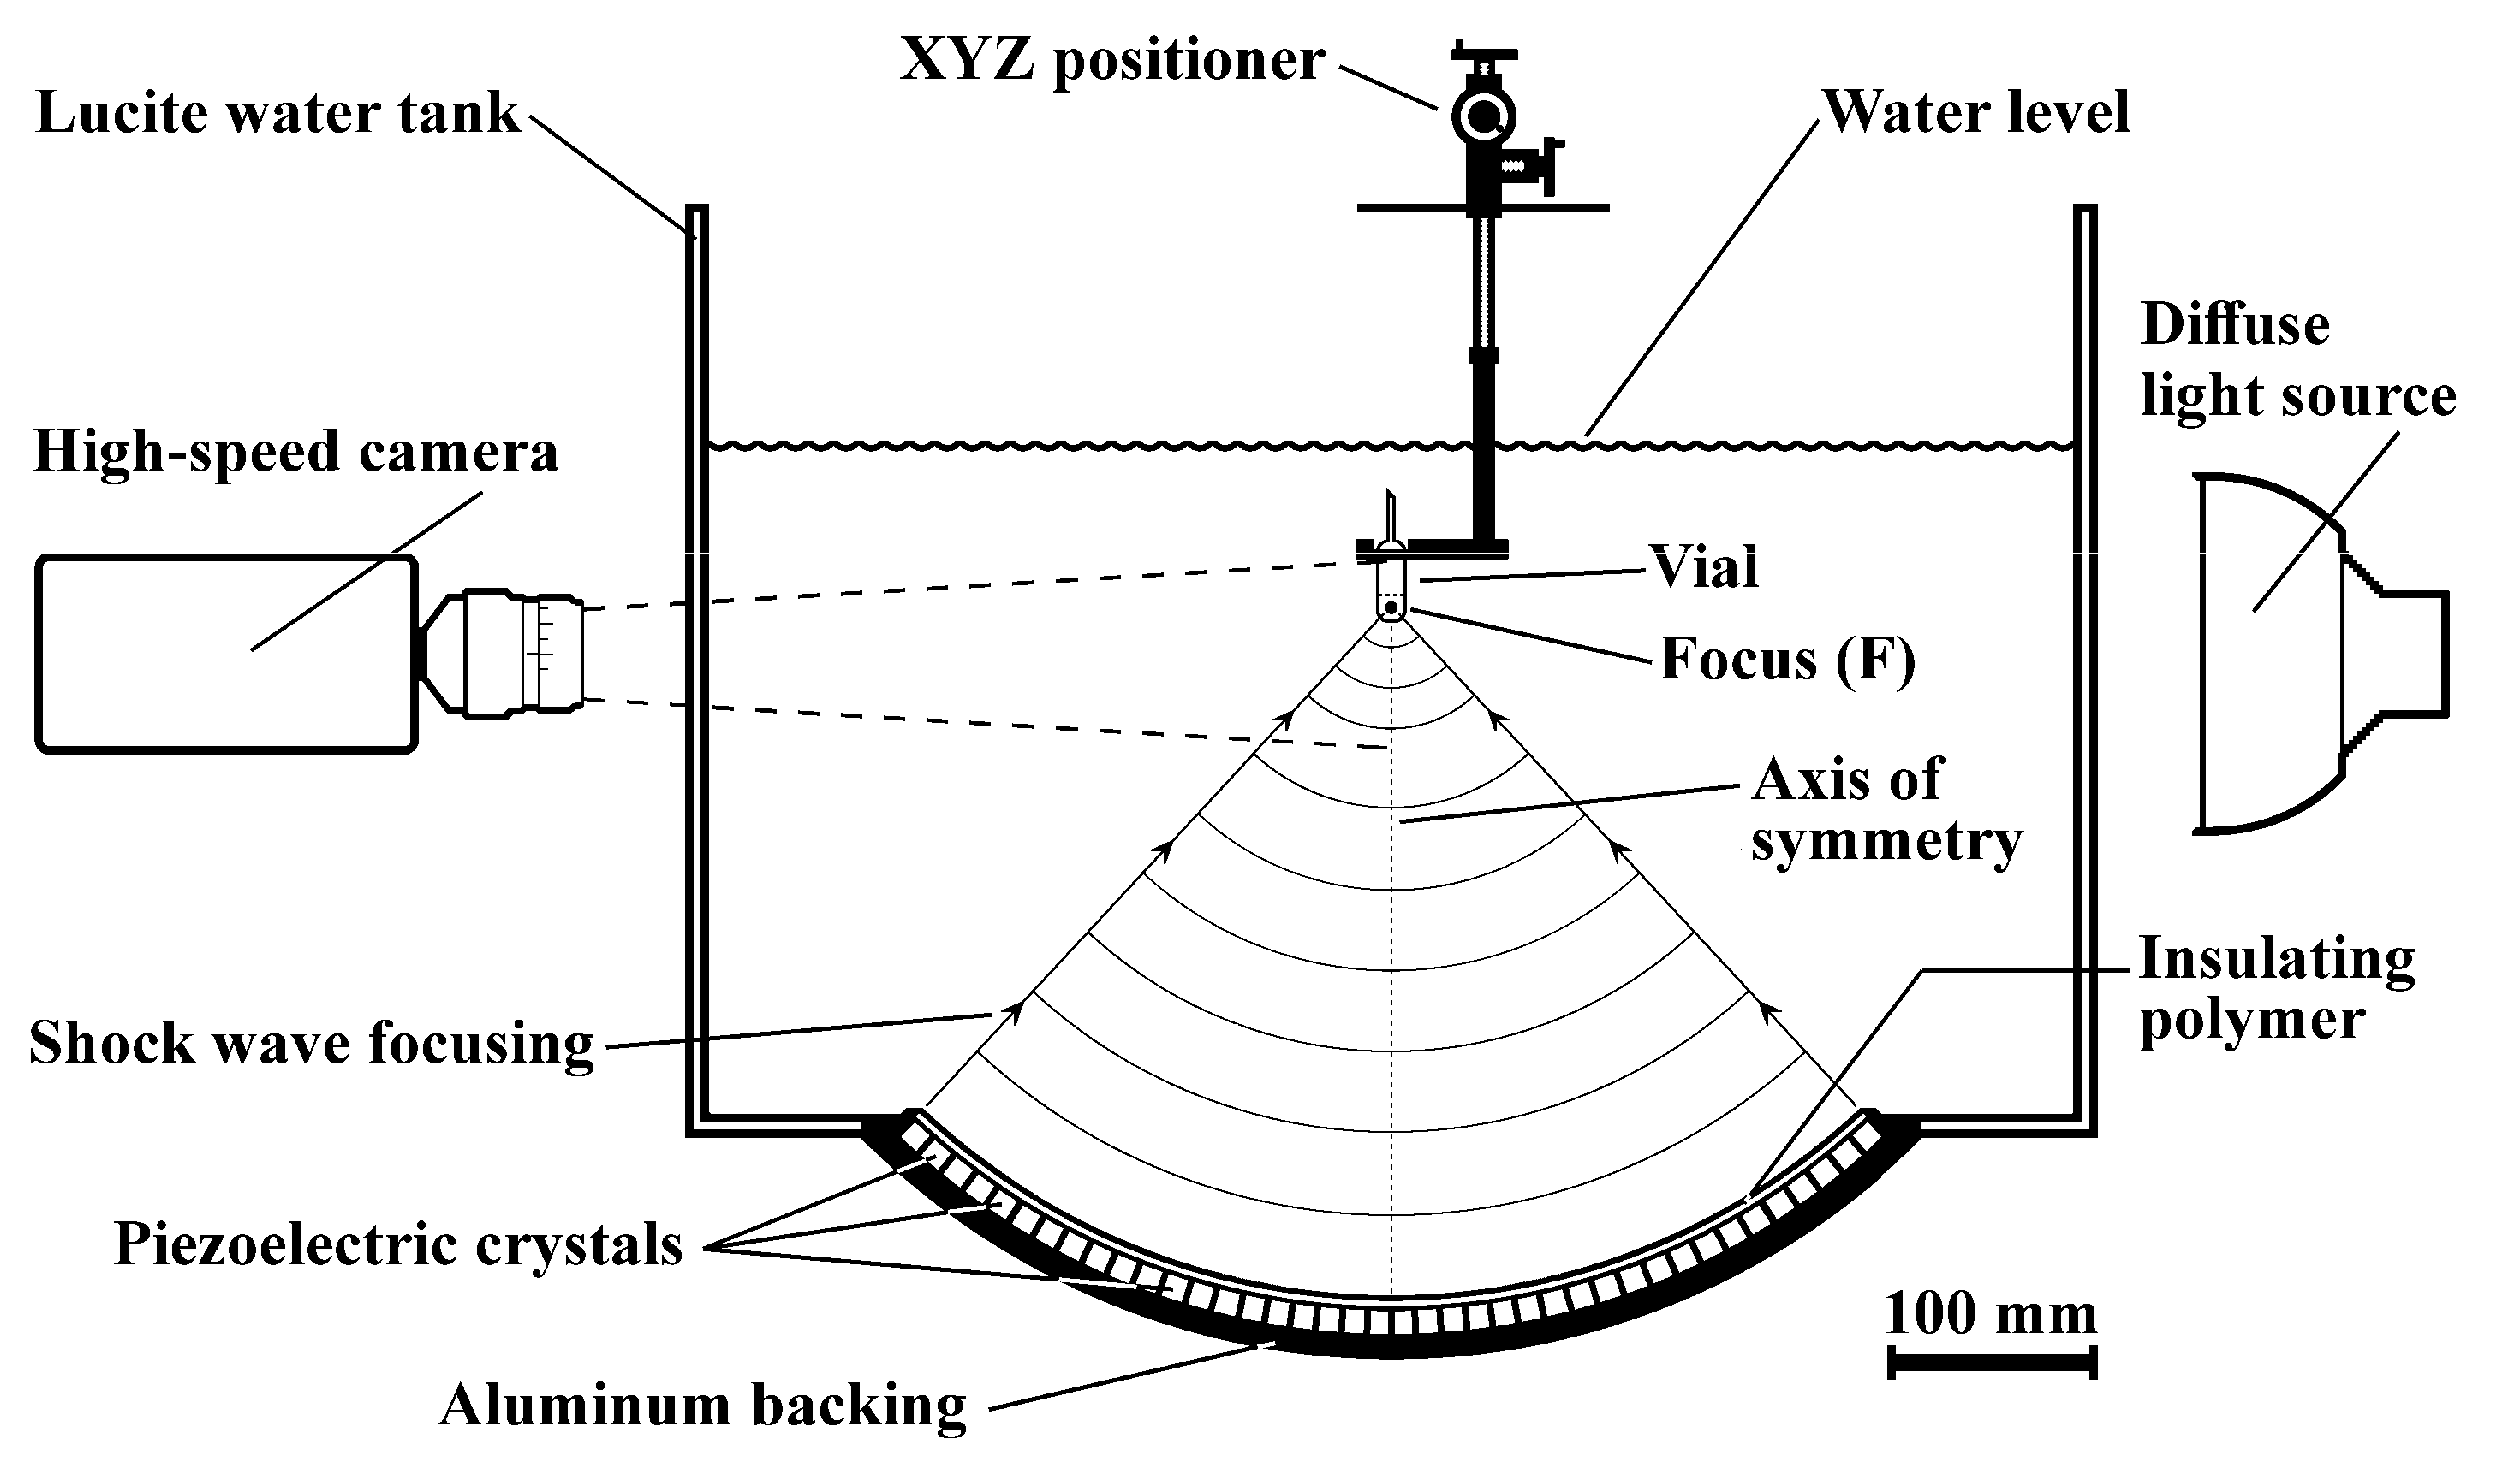
2.3. The Shock Wave Generator

Shock waves were produced with a modified Piezolith 2501 shock wave source (Richard Wolf GmbH, Knittlingen, Germany) consisting of about 3000 piezoelectric elements mounted on the concave side of a hemispherical aluminum backing (radius 345 mm) embedded in an insulating polymer (Figure 1). The shock wave source is placed at the bottom of a 675 × 675 mm Lucite water tank (height 450 mm). To generate a shock wave, a high-voltage (2–6 kV) discharge is applied to the piezoelectric array. Each element produces a pressure pulse that propagates through the water toward the center (focus F) of the system. The superposition of all pulses and nonlinear effects steepen the pressure pulse into a shock wave as it approaches F. Two independent capacitor charging units are used to generate tandem shock waves with a delay of 10 to 100 µs (±2 µs) and 100 to 900 µs (±5 µs) between pulses. The vials to be treated were positioned inside the water tank with an XYZ positioning system (UniSlide Assemblies Velmex, Inc., Bloomfield, NY, USA). The error in positioning each sample was approximately ±0.5 mm.

2.4. Shock Wave Exposure

Sterile 4 mL transfer pipettes (Thermo Fisher Scientific, Waltham, MA, USA) were filled with 1.5 mL conidial suspension (see Section 2.2), heat-sealed, and cut 20 mm above the bulb. For shock wave exposure, each vial was fixed vertically along the axis of symmetry of the shock wave source so that focus F coincided with the center of curvature of the bottom of the pipette (Figure 1). Shock waves were generated using a discharge voltage of 5.5 ± 0.125 kV throughout the whole experiment. The pressure profile is similar to that of several extracorporeal shock wave lithotripters and shock wave sources used for biotechnological applications. At this voltage, the peak positive pressure, recorded with a polyvinylidene difluoride needle hydrophone (Imotec GmbH, Würselen, Germany), had an amplitude of 73.62 ± 1.44 MPa. The measured full width at half maximum (FWHM) of the pressure pulse was 194 ± 8 ns. The −6 dB focal volume had the shape of an ellipsoid with minor and major axes of approximately 2 and 8 mm, respectively. Either single-pulse (SP) or tandem shock waves were emitted at a rate of 0.5 Hz. Due to the similarity in acoustic impedances, the suspension–polyethylene–suspension interfaces did not significantly modify the pressure profile. The tub was filled with 24 °C tap water up to 80 mm above F. A total of 30 vials were divided into 10 groups to receive either sham- or shock-wave-treatment, as indicated in Table 1. Each group consisted of three vials; that is, the experiment was repeated three times. In the tandem mode, an “event” was defined as a pair of shock waves; that is, to equalize the energy delivered to each sample, the number of tandem “events” was halved compared to the number of SP shock waves. Two delays (40 and 160 µs) between the first and second shock waves were used in the tandem mode and defined as the SDT and LDT modes. As explained in the next section, high-speed imaging of acoustic cavitation was used as a tool to select these delays.

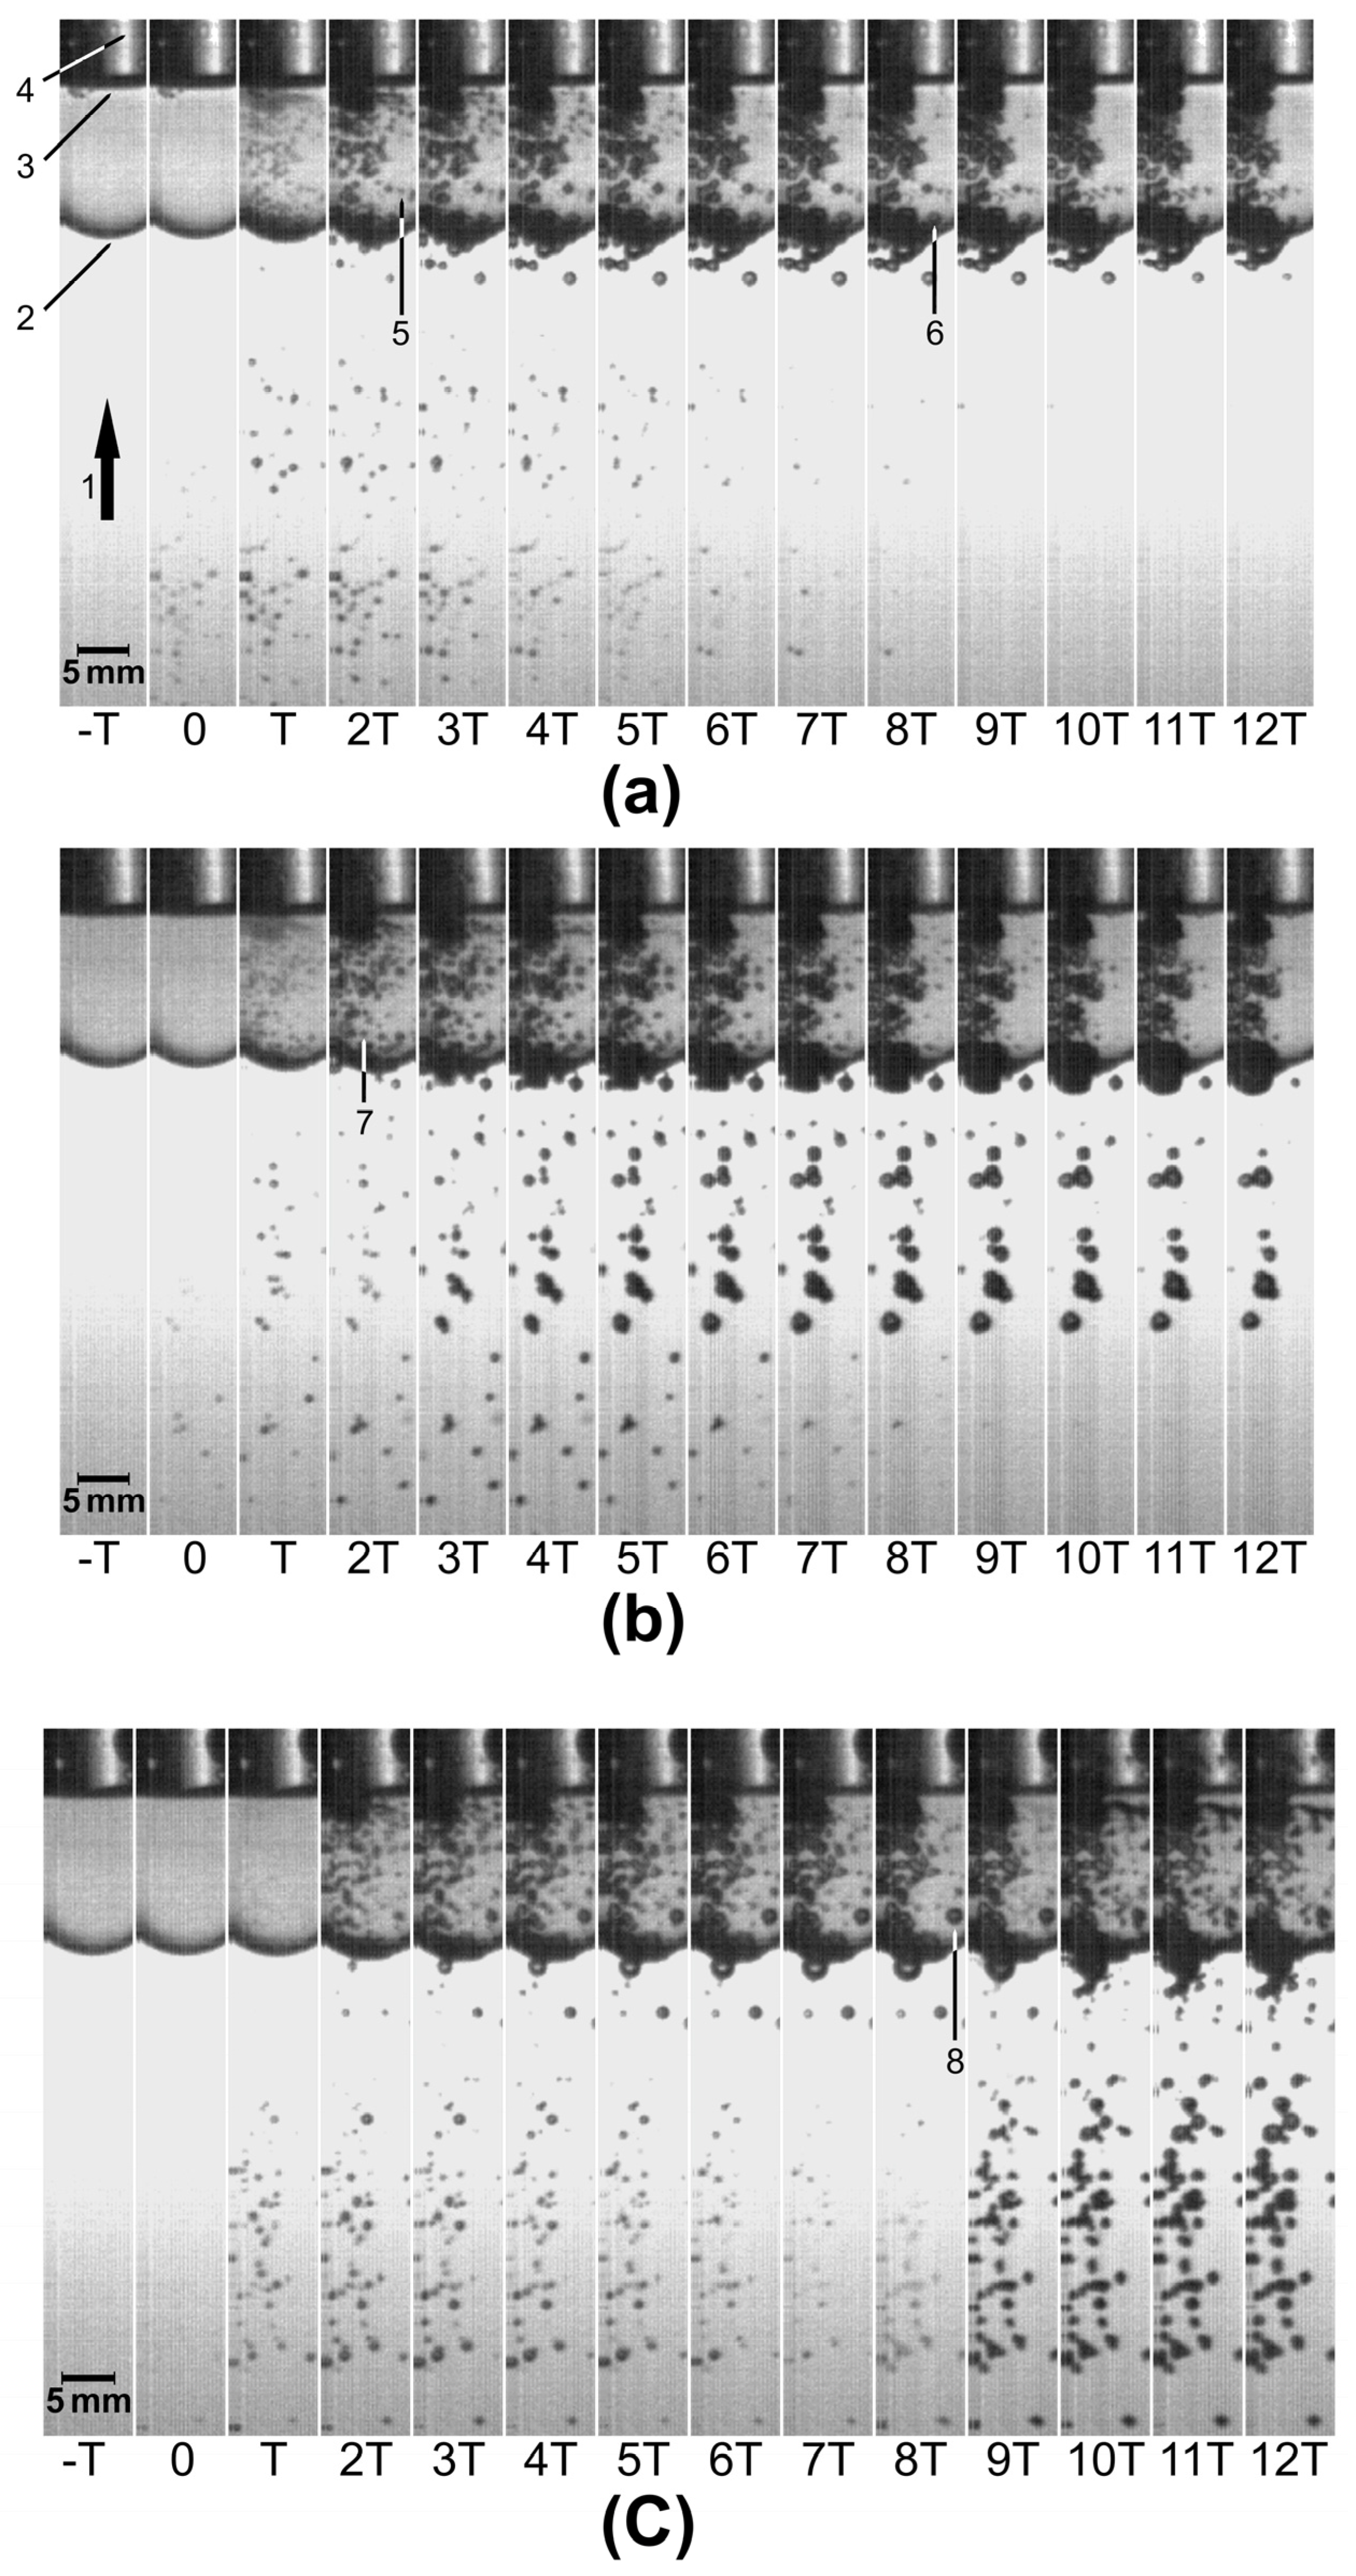
2.5. High-Speed Imaging

Images of the bubble dynamics were captured with a high-speed MotionPro X4 (Integrated Design Tools, Inc., Pasadena, CA, USA) camera equipped with a Mamiya/Sekor sx 1:1.4, f = 55 mm lens (made in Japan) in the SP mode and both tandem modes at a speed of 5 × 10⁴ frames per second (fps). At this speed, each image is composed of 44 × 508 pixels. A vial containing 1.5 mL of a suspension of distilled water and A. niger conidia was placed inside the water tank and illuminated with back-illumination as shown in Figure 1. The camera was triggered 170 μs after the shock wave generator. All recordings were performed in duplicate. Bubbles were seen as dark discs; however, some of them overlapped and were difficult to distinguish from one another.
Figure 2 shows sequences of images recorded after the passage of SP, SDT, and LDT shock waves. The time T between one image and the next was 20 μs. t = 0 was set at the instant when bubbles could be seen through the vial with the naked eye for the first time. The markers labeled 1–8 were added to describe some features (see the Figure caption). In general, it can be noticed that bubbles underwent fast growth, some of them up to a diameter of more than 1 mm, followed by inertial collapse. Images (b) and (c) (tandem mode) show increased bubble density, shortly after the second shock wave passed, both in the SDT (t = 2T) and the LDT (t = 8T) modes.
As already mentioned, the diameter of a microjet emitted during bubble collapse is approximately one-tenth of the bubble´s original diameter [20,21,22], meaning that larger bubbles generate microjets with a larger diameter than smaller bubbles. Normally, in a suspension, there is a distribution of bubbles of many sizes. In this study, we proposed a method by which the diameter of the emitted microjets can be influenced to some extent. This is achieved by generating two shock waves. The first wave produces bubbles of all sizes. If the second wave is sent such that its peak of positive pressure arrives when a bubble of a specific size begins to collapse, this collapse and the microjet emission are significantly reinforced as the pressure from the second wave compresses the collapsing bubble. The collapse of bubbles with sizes different from those selected is not reinforced. In other words, if the arrival of the second shock wave coincides with the instant when small (large) bubbles begin their collapse, the generation of microjets with a small (large) diameter is enhanced. Considering this, the criterion for selecting the short (long) delay in this study was based on the time needed for the smallest (largest) bubbles to begin collapsing after the passage of an SP shock wave. The instant when the smallest bubbles begin their collapse, following the passage of an SP shock wave, was estimated using high-speed recordings. The same was done for the largest bubbles observed in the suspension. If the effects on the cell wall of A. niger conidia depend on the diameter of the microjets, exposing the conidial suspension to tandem shock waves emitted at two significantly different delays, will produce different degrees and types of damage.
As mentioned above, Figure 2a shows a sequence of images obtained after exposing the conidial suspension to an SP shock wave. At t = 2T, that is, 40 µs after the arrival of the shock wave, the smallest bubbles observable with the naked eye acquired their maximum diameter, and their size began to decrease at t = 3T. An example is the bubble marked with the number 5. At t = 8T, 160 µs after the arrival of the shock wave, the largest bubbles observed inside the suspension started to collapse. In this case, a representative bubble is number 6. This bubble appears smaller on each image after t = 8T. Figure 2b shows a sequence recorded after the passage of a tandem shock wave with a delay of 40 µs (SDT shock wave). The second shock wave arrived at t = 2T. Because of this, in the following images, more bubbles are seen both outside and inside the vial. Number 7 is one of the smallest bubbles at its maximum size. Analogously, Figure 2c shows a sequence obtained after the passage of an LDT shock wave. At t = 8T, 160 µs after the passage of the first shock wave, the second shock wave enhanced the collapse of the largest bubbles (see number 8) observed inside the vial. Increased bubble activity appeared after t = 8T.

2.6. Electron Microscopy Sample Preparation

Samples destined for SEM and TEM observation were processed equally until dehydration. Briefly, 1 mL of conidial suspension was fixed for 1 h by adding 1 mL of glutaraldehyde (3%) dissolved in a sodium cacodylate buffer (0.1 M at pH 7.4). After this time, the conidia were washed twice for 10 min with 1 mL of cacodylate buffer, and they were recovered by centrifugation at 7500× g. The last wash was performed for 24 h. Then, the conidia were incubated with osmium tetroxide (1% in 0.1 M sodium cacodylate buffer at pH 7.4) for 1 h. Then, 3 washes in cacodylate buffer were performed: 2 for 10 min and the last for 24 h. Finally, the samples were dehydrated by submerging them in increasing percentages of ethanol (10, 30, 50, 70, 96, and 100%) for 10 min each.
For SEM, samples immersed in 100% ethanol were treated to replace ethanol with liquid CO2 and then desiccated at critical point temperature using a critical point dryer CPD2 (Ted Pella, Inc., Redding, CA, USA), according to the manufacturer’s instructions. Once desiccated, conidia were recovered and coated with a 20 nm gold nanoparticle layer using a sputter coater EMS 550 (Electron Microscopy Sciences, Hatfield, PA, USA) and observed with a JSM-6060LV electron microscope (JEOL, Tokyo, Japan).
For TEM, ethanol (concentration 100%) was withdrawn from the samples by centrifugation at 7500× g; 1 mL of propylene oxide was added to the pellet and incubated for 30 min at 20 °C; the last step was repeated. Then, to infiltrate the cells, 1 mL of resin and propylene oxide (rate 1:1) was added and left to evaporate for 24 h at RT; this step was repeated twice, increasing the resin portion each time (2:1 and 3:1) until it reached honey consistency after evaporation. After infiltration, the samples were placed in pure resin and polymerized at 60 °C for 36 h. Microtome sections with a thickness between 60 and 90 nm were obtained using an ultramicrotome MTX-RMC (Boeckeler Instruments Inc., Tucson, AZ, USA) and collected on 300 mesh copper grids. Then, the samples were counterstained with a 2% uranyl acetate and 2% lead citrate solution. Observations were made at 80 kV with a JM100 electron transmission microscope (JEOL). The images were recorded with a CCD camera (Orious, Gatan, Inc., Pittsburgh, PA, USA) coupled to the microscope.

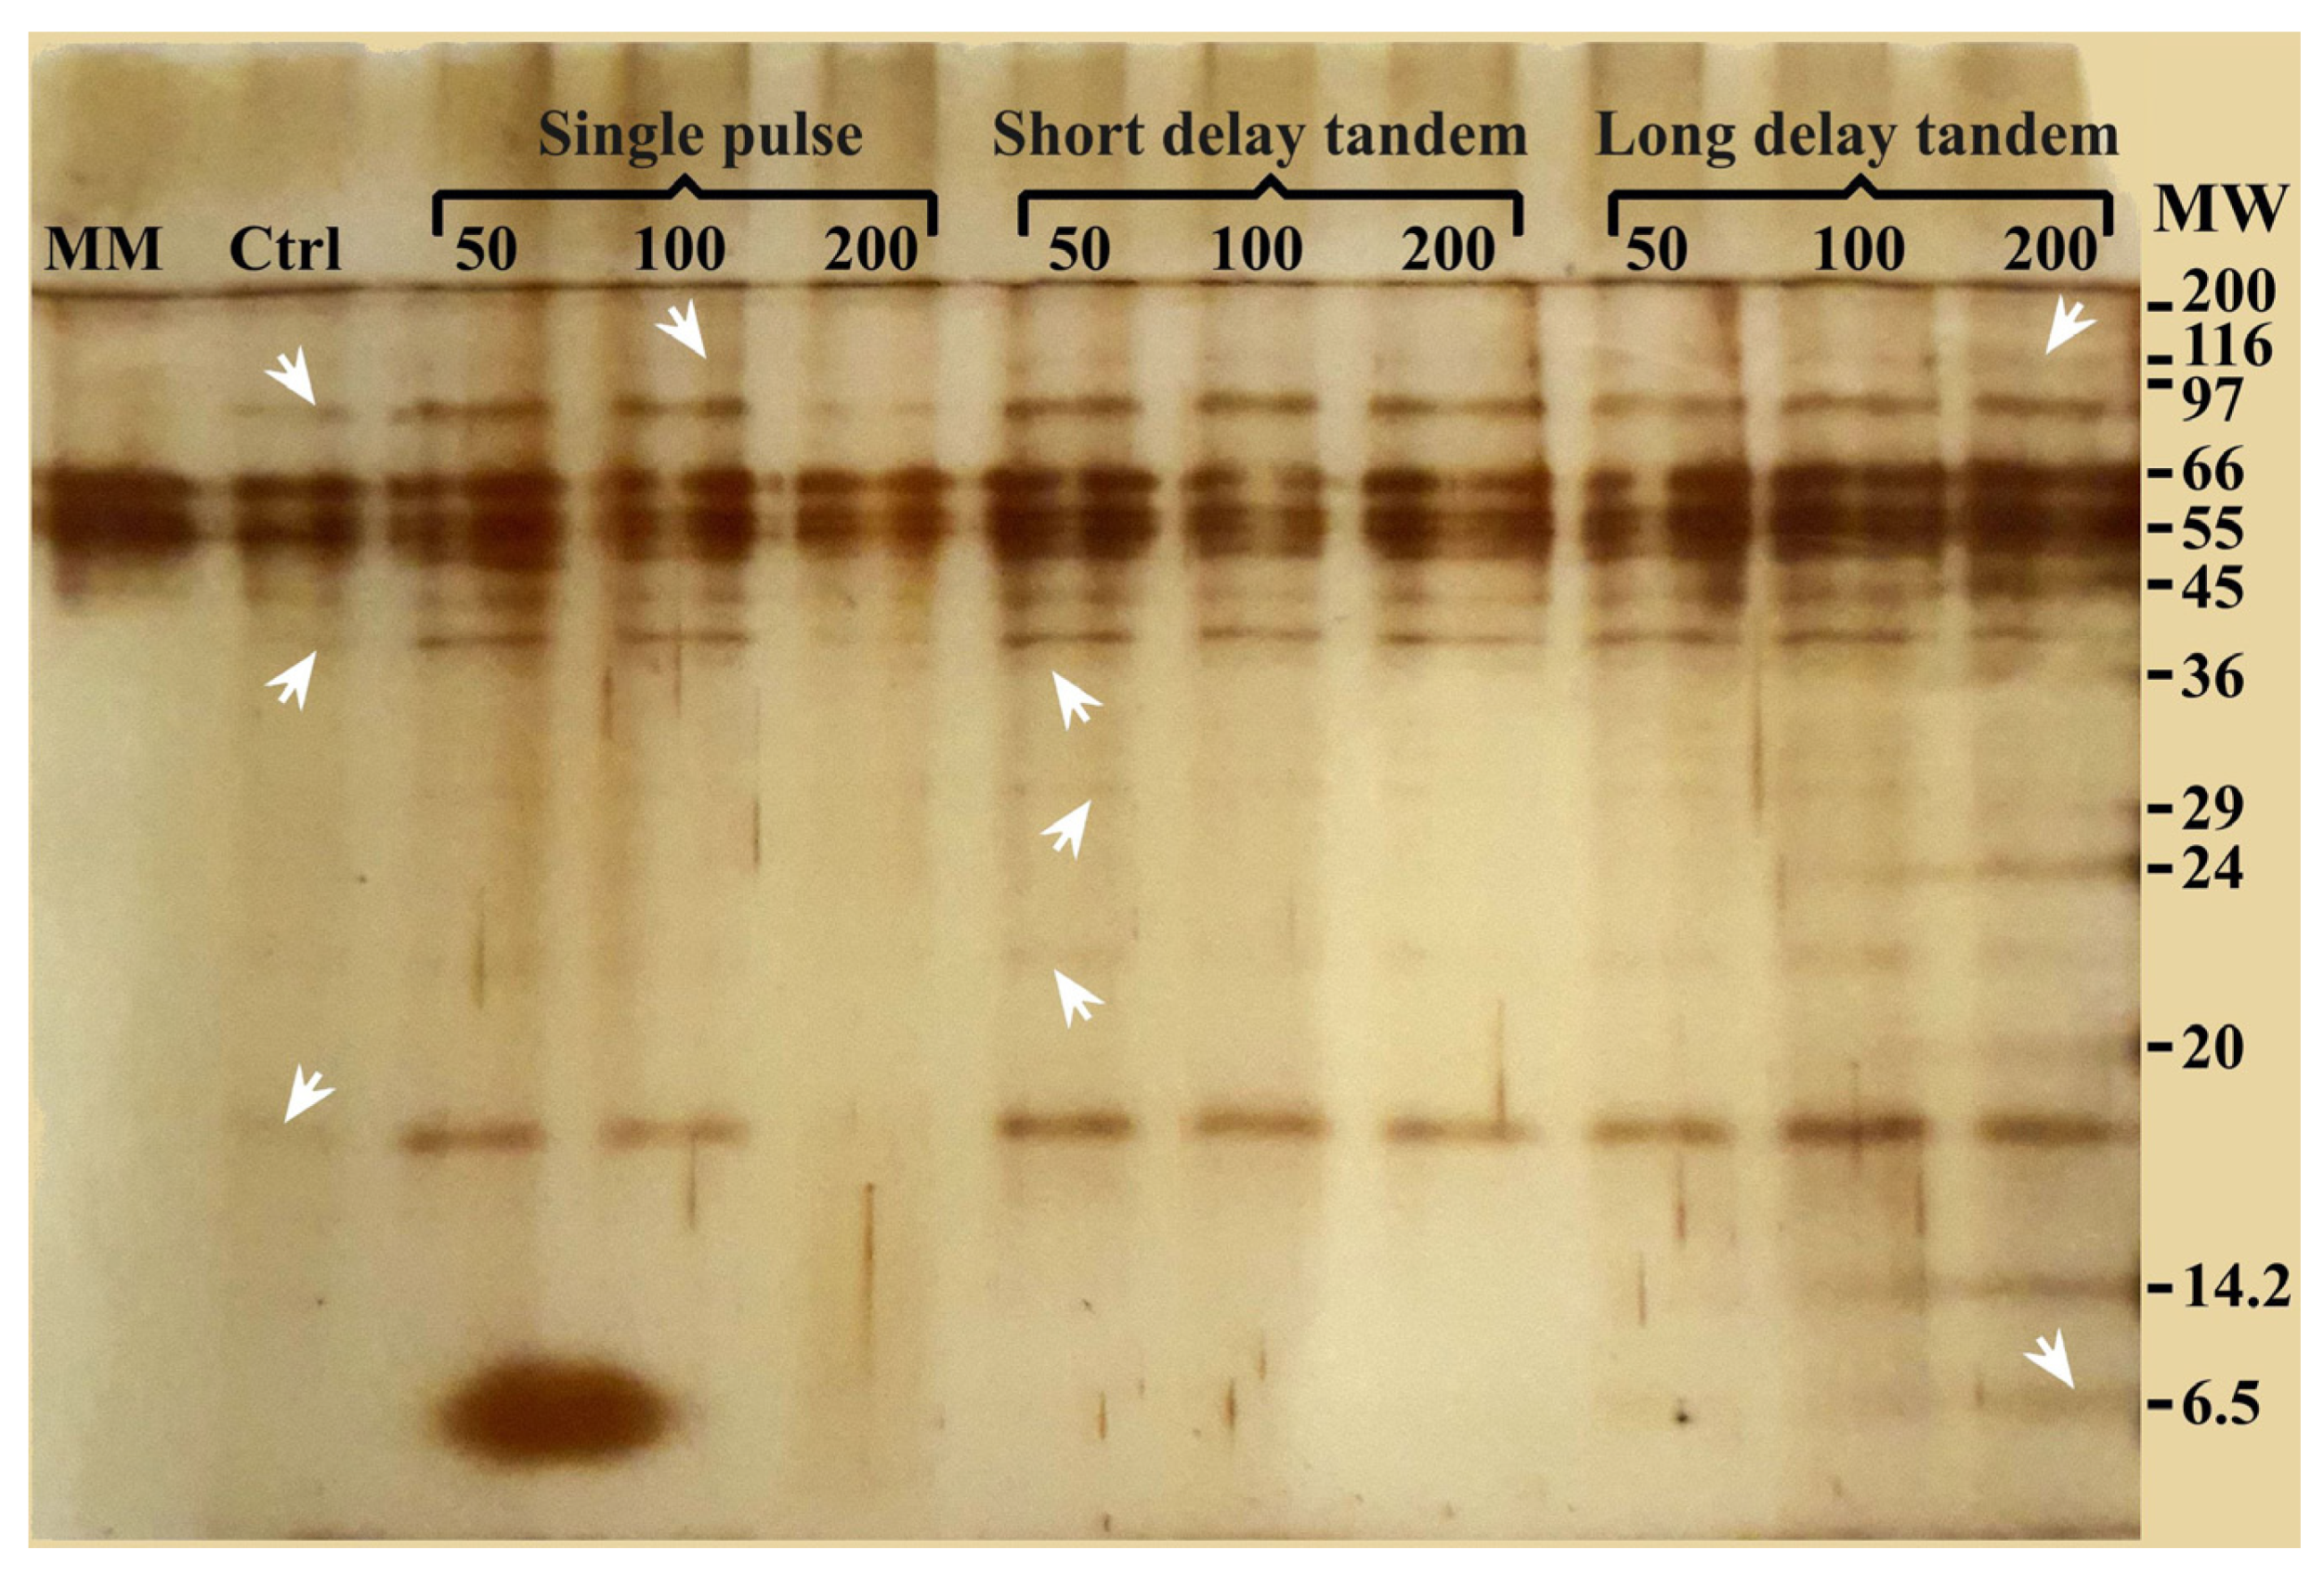
2.7. Protein Release Analysis

Immediately after shock wave exposure, samples in minimal medium broth were centrifuged at 12,000× g; 1.2 mL of the supernatant with the released proteins was carefully separated and collected in a clean tube without disturbing the conidial pellet. Next, the proteins were precipitated by adding 4 volumes of ice-cold acetone and incubation for 15 min on ice; then, samples were centrifuged at 16,600× g, the acetone was dismissed, and the protein pellet was dried at 20 °C. Finally, protein-enriched fractions were resuspended in 200 µL of 7 M urea and analyzed.
A bicinchoninic acid (BCA) protein quantification assay in a 96-well microplate (ABP Biosciences, catalog P011, Beltsville, MD, USA) was employed to quantify proteins released into the medium after shock wave treatments, according to the instructions of the manufacturer. Briefly, 20 µL of each sample was added to 200 µL of working reagent and homogenized. Then, the plate was incubated at 30 °C for 30 min and cooled at 20 °C. Measurements were taken at 562 nm using a Varioskan microplate reader (Thermo Fisher Scientific Inc., Waltham, MA, USA). Bovine serum albumin was used as a standard protein. Each sample was measured in triplicate.
SDS-PAGE was used to analyze the proteins released into the medium by the action of shock wave treatments. For electrophoresis, acrylamide 15% separating gel, 4% stacking gel, 1× Tris/Glycine/SDS buffer, and a molecular weight marker were used (Sigma-Aldrich, St. Louis, MO, USA). Electrophoretic separation was performed for 1.5 h at 100 V. Protein bands were revealed with silver staining. For this, gels were fixed in a solution of acetic acid:methanol:water (5:50:45) for 1 h; subsequently, two 20 min washes with 50% methanol and a 20 min wash with 30% methanol were performed. The gels were immersed in a 0.02% sodium thiosulfate (Na2SO3) solution for 1 min, with two subsequent 20 min washes with water, followed by incubation in a 1% silver nitrate solution for 20 min, after which they were washed 3 times with water. Finally, they were immersed in the developer solution (2% NaCO3; 0.04% formaldehyde) for up to a maximum of 10 min. The gels were visualized using a gel photo documenter system in gel Doc EZ (Bio-Rad Laboratories, Hercules, CA, USA).

2.8. Electrophoretic Light Scattering

Immediately after shock wave application, the conidia were recovered and stored at −20 °C in the culture medium. Subsequently, they were fixed with formaldehyde (2%) in phosphate-buffered saline (PBS pH 7.4) for 15 min. Next, two washes with PBS and three with sterile distilled water were performed, and finally, 1.5 × 10⁴ conidia were suspended in 1 mL of injectable-grade sterile distilled water. Surface charge data were obtained from 1000 conidia using a particle size analyzer (Litesizer 500, Anton Paar México S.A. de C.V., Mexico City). The software (Kalliope version 2.4, 2019) uses the Helmotz-Smoluchowski equation to calculate the Z potential from their electrophoretic mobility values.

3. Results

3.1. Morphological Changes in A. niger Observed through SEM

The shape of all observed control conidia through SEM (see Section 2.6) was quasi-spherical, with an average diameter of approximately 3–5 µm. Figure 3a shows the typical ornamentation of A. niger conidia on the surface of control cells [38]. Its cell wall is rough with folds and grooves due to the presence of structures made up of chitin, glucans, proteins, and pigments [35]. The filter paper that served as support is seen in the background. Shock wave-exposed conidia revealed a kind of shaving on the cell wall surface in addition to the presence of pores. Cells treated with SP shock waves (Figure 3b) showed a rough cell wall but with less ornamentation. Conidia exposed to SDT shock waves also exhibited a smoother cell wall surface (Figure 3c) and evident loss of cell wall material. Most images of conidia subjected to LDT shock waves showed erosion of their cell surface (Figure 3d). Collapsed cell walls, such as the one in Figure 3d, were only seen after using one of the three shock wave modes (SP, SDT, or LDT), not in the control group. Figure 3 is a representative example of a larger group of obtained images. Comparing all SEM images of shock wave-exposed conidia, the effect over the cellular surface was found to be different with every applied treatment, and LDT treatment was the most efficient procedure to shave surfaces. Images at a lower magnification can bee seen in Figure S1.

3.2. Internal Changes of A. niger Observed through TEM

The internal structures of the cells in the control samples were the same as typically reported; they were covered with a cell wall of approximately 200 nm thickness, and an electron-dense outer layer consistent with melanin was embedded in the cell wall components [39,40]. A representative image is shown in Figure 4a. As with SEM, shock-wave-treated conidia revealed different degrees of shaving effect on their outer layer. SP shock waves tended to detach the outer layer of the conidium (Figure 4b). SDT shock waves induced damage to the external structure of the conidia, apparently thickening the cell wall (Figure 4c). Additionally, the formation of vesicle-like structures can be observed, probably attributed to shear forces exerted by the pressure changes after the passage of the shock wave. As for the conidia that received LDT shock waves (Figure 4d), a partial wasting effect on the wall surface was observed. Figure 4d shows a conidium with erosion areas where there is detachment of cell wall components, including melanin. Figure 4e–h are magnifications of Figure 4a–d, respectively. In most of the images obtained, the changes in the cell wall morphologies were more evident when SDT shock waves were applied, while greater wear was observed with the LDT shock wave treatment.

3.3. Analysis of Released Protein

The quantity of protein released from the outer layer of the conidial wall into the medium after shock wave exposure was measured. As shown in Figure 5, the protein concentration ranged from 0.23 to 0.35 mg/mL. The shock wave mode (SP, SDT, or LDT) influenced the quantity of released protein. Compared with nontreated conidia, a significant increase in protein was obtained in most shock wave-treated groups. Exposure to 200 SP shock waves resulted in a 1.44-fold higher value (0.33 mg/mL). Applying 200 LDT shock waves increased the protein concentrations up to 1.52 times (0.35 mg/mL) the value recorded for the control group. The lowest protein concentrations were obtained from samples exposed to 200 SDT shock waves, similar to the control group.
SDS-PAGE was performed to confirm the shock wave-shaving effect on the cell surface, allowing the obtention of non-degraded proteins. In this analysis, the resulting electrophoresis gel allowed for the detection of protein bands with molecular weights between 6.5 and 120 kDa (Figure 6). Lane 1 (MM), corresponding to the protein content in the culture medium, shows bands at 45, 55, and 66 kDa. The control sample (Lane 2) revealed protein bands of 17, 40, and 97 kDa in addition to the bands obtained from the culture medium. Samples treated with 50 and 100 SP shock waves (Lanes 3 and 4) showed a similar banding pattern as the control group, although the bands were slightly more intense. Furthermore, a band corresponding to high-molecular-weight proteins (116 kDa) appeared. This was probably generated by the enrichment of proteins due to shock wave action. Interestingly, 200 SP shock wave treatments seem to have a damaging and possibly degrading effect (Lane 5). In the three SDT shock wave groups (Lanes 6 to 8), only samples treated with 50 shock waves revealed a banding pattern with bands of 23, 30, and 37 kDa. Finally, when analyzing the proteins obtained with LDT shock waves (Lanes 9 to 11), various molecular weights, from 6.5 kDa to fragments or proteins with molecular weights greater than 100 kDa, were obtained. The effect was more evident as the number of LDT shock waves increased.
The surface electrostatic charge of conidia depends on the molecular interaction between different components of the cell wall. This was assessed by microelectrophoresis, electrophoretic mobility, and the Z potential. As shown in Table 2, both the control and shock wave-treated samples only expressed negative values and increased electrophoretic mobility. All conidia that released proteins and other cell wall compounds because of shock wave exposure, presented significantly more negative values (from −26.98 ± 0.59 mV to −33.34 ± 0.35 mV) than those recorded in the control samples (−20.37 ± 0.94 mV).

4. Discussion

Our SEM and TEM images revealed that conidia exposed to different shock wave conditions suffered a variety of modifications to their cell structure, from pore and vesicle formation to slight wear of the cell wall and deformation to cell wall surface shaving. Representative examples are shown in Figure 3 and Figure 4. Because it is not possible to observe the interaction between a shock wave and the cell surface in real time, other authors [40,41,42] performed simulations in silico, and they concluded that after passage of the positive pressure pulse, the change in membrane permeability is caused by a disturbance of the phospholipid fatty acid chains. It has also been reported that shock waves with a smaller positive pressure amplitude but longer FWHM increased the membrane permeability more than shock waves with higher pressure and a shorter FWHM [42]. According to these authors, shock wave-induced shear stress, tangential to the cell surface, contributed to cell permeability. As mentioned above, shock waves can induce permeabilization in several kinds of cells [42,43,44]. Compression, as well as tensile and shearing stress, may be partially responsible for the changes to the cell wall, principally pore formation, as evidenced in Figure 3b–d; however, the accepted hypothesis is that acoustic cavitation is the main phenomenon responsible for this effect.
Bubble growth and collapse depend not only on the applied shock front but also on the number of suspended microbubbles and impurities, such as solid kernels. The cell wall of A. niger conidia is rough (see Figure 3a) and hydrophobic, owing to the presence of hydrophobins, melanin, α-1,3-glucan, and chitin [31,32]. These physicochemical properties of the cell wall components generate low wettability in A. niger conidia compared with other fungal species [45]. This reduces the adhesion force between the surface of the wall and the surrounding liquid, enhancing the nucleation of microbubbles [46,47,48].
A shortcoming of the methodology described here is that cell shaving and sonoporation are difficult to control. Using tandem shock waves with specific delays can exert a certain influence on the impact on the cells, such as the pore size, cell deformation, or modification of the cell wall. Nevertheless, because cavitation is a multibubble phenomenon and depends on several factors, such as the properties of the fluid, the bubble size distribution, the existence of cavitation nuclei, and the pressure profile [49], the most appropriate delay for a specific application is difficult to determine. Moreover, several phenomena act synergistically, complicating the scenario.
A useful tool to estimate the size of bubbles immersed in a liquid versus the time after their interaction with a shock wave is the Gilmore–Akulichev equation [50]. By obtaining the maximum diameter of shock wave-exposed bubbles using high-speed imaging, it is possible to calculate their initial size, the approximate diameter of the microjets emitted after collapse, and the delay to enhance the collapse energy of these specific bubbles. This method could allow relative control over acoustic cavitation and microjet formation, influencing possible effects on the cells.
Deformation of the cell wall and cell membrane can also be produced by direct shock wave-induced stress; this is without the presence of cavitation and solely dependent on the pressure profile of the shock wave [51]. On the other hand, if a microbubble smaller than a cell is compressed close enough to its surface, it causes a vacuum effect, pulling part of the outer layer of the cell surface. During expansion, the bubble hits the cell surface [51,52,53]. Both effects (suctioning and hitting) alternate at high speed, resulting in cell surface deformation. These effects are caused by harmonic waves that reach megahertz frequencies, such as those generated by ultrasound devices [52,53,54]. Furthermore, shear stress produced by cavitation after sonoporation of conidia has been reported to cause changes in cell permeability. Consequently, if cells are in the vicinity of cavitating bubbles, transient pores derived from the viscoelastic shear forces of these microstreams may appear on their surface [55,56,57]. During shock wave treatment, bubbles normally do not oscillate; however, both bubble expansion and compression have much higher energy, and strong shear stress can be expected.
In this study, SDT shock waves generated significantly more cell wall deformations than SP shock waves, but with less protein release. This may occur because the SDT mode favors small microjets but inhibits larger ones, as generated in the SP mode. Inferences can be drawn from the number of cellular pores appearing in the foreground of our SEM images. Even though TEM revealed greater changes in the cell wall with SDT, the formation of diverticulum-like agglomerates was also evident, which perhaps accumulated the proteins instead of releasing them. Undoubtedly, more tests are required to confirm or correct such a hypothesis.
LDT shock waves were more effective in shaving the outer layer with diminished cell deformation, releasing proteins of different sizes (Figure 6). Moreover, the quantity of protein released into the medium was higher after exposure to LDT shock waves. SDS-PAGE revealed that the recovery of proteins of variable size was achieved with this treatment. Other authors reported detaching effects during the sonication of A. nidulans conidia suspended in sterile deionized water. That method generated streams that peeled off the hydrophobin layers without deforming the morphology of the cells [58].
In recent years, the study of surface proteins has stood out for its importance in understanding many cellular interaction processes with the environment, as well as its importance in plant, animal, and human pathogenicity. Few methods to perform the shaving of superficial proteins have been reported [59,60]. Some of them use enzymes or chemicals for the treatment of samples to obtain proteins and proceed to analysis and characterization [61,62,63]. As demonstrated in this study, shock waves can be considered a new approach for detaching proteins from the conidial surface. With standardized protocols for fungi, shock waves could constitute an alternative method to study cell wall proteins, avoiding subcellular fractionation. The advantages of shock wave treatments are that the procedure is relatively fast and that there is no need for special sample preparations. Moreover, using tandem shock waves, the same number of shock waves can be applied in half the time as with SP treatments.
The Z potential value is associated with the cell surface charge, which is dictated by its physicochemical characteristics. Fungal cell walls are negatively charged because of molecules such as β-1,3-glucans and melanin. As reported by Pihet et al. [40] and Wargenau et al. [39], the presence of melanin forms a negatively charged shell. In the control group, the Z potential was −20 mV. This agrees with the values reported by Wang et al. [64] for fungal cells dispersed in deionized water. For conidia exposed to any of the three shock wave treatment modes (SP, SDT, and LDT), the Z potential values decreased, indicating the detachment of proteins, such as hydrophobins, from the conidial outer layers.

5. Conclusions

Single-pulse and both SDT and LDT shock waves induced various modifications on the cell wall surface of A. niger conidia, from a superficial shaving effect releasing proteins attached to the cell wall to the disruption of the fungal cell wall layers. Our results support the hypothesis that acoustic cavitation is one of the most important phenomena of shock wave treatments, not only for cell permeabilization but also for modifying or extracting components from the surface of cells covered by a cell wall. This shaving effect may be relevant in biomedicine as a method to obtain antigenic biomolecules from the surface of pathogenic fungi, such as Cryptococcus neoformans, Candida spp., and Sporothrix schenckii. To the best of our knowledge, this is the first article reporting shock wave-induced changes to the conidial cell wall. Furthermore, our results may be useful for establishing the physical parameters and experimental conditions of shock waves in new fields of application.

Supplementary Materials

The following supporting information can be downloaded at: https://www.mdpi.com/article/10.3390/fluids9040081/s1, Figure S1: SEM images at a lower magnification (×10,000) compared to Figure 3, providing a wider field of view. The shock wave treatment type (Control, SP, SDT, LDT) is indicated in the upper right corner of each image. Samples for SP, SDT, and LDT were subjected to 50 shock waves.

Author Contributions

Conceptualization, B.E.M.-C., F.F. and A.M.L.; methodology, M.A.M.-M., B.E.M.-C., F.F., D.L. and A.M.L.; validation, M.A.G.-L.; formal analysis, B.E.M.-C., F.F., M.A.G.-L. and A.M.L.; investigation, M.A.M.-M., B.E.M.-C., F.F., D.L. and A.M.L.; resources, B.E.M.-C., M.A.G.-L. and A.M.L.; writing—original draft preparation, M.A.M.-M., B.E.M.-C., D.L. and A.M.L.; writing—review and editing, B.E.M.-C., F.F. and A.M.L.; visualization, B.E.M.-C., F.F., M.A.G.-L. and A.M.L.; supervision, B.E.M.-C., F.F. and A.M.L.; project administration, B.E.M.-C., F.F. and A.M.L.; funding acquisition, M.A.G.-L. and A.M.L. All authors have read and agreed to the published version of the manuscript.

Funding

This research was funded by the “Consejo Nacional de Ciencia y Tecnología” (CONACYT), grants number 372 and CB-2017-2018-A1-S-21130, and a scholarship from the Postgraduate Studies Support Program (PAEP) of the “Universidad Nacional Autónoma de México” (UNAM).

Data Availability Statement

Data are contained within the article.

Acknowledgments

The authors would like to thank Manuel Aguilar Franco, Paula Bernardino, Gerardo Fonseca, Lourdes Palma Tirado, René Preza, Ana Lucía Tovar and Guillermo Vázquez for technical assistance.

Conflicts of Interest

The authors declare no conflicts of interest.

References

  1. Field, J.E. The physics of liquid impact, shock wave interactions with cavities, and the implications to shock wave lithotripsy. Phys. Med. Biol. 1991, 36, 1475–1484. [Google Scholar] [CrossRef]
  2. Chaussy, C.; Brendel, W.; Schmiedt, E. Extracorporeally induced destruction of kidney stones by shock waves. Lancet 1980, 316, 1265–1268. [Google Scholar] [CrossRef]
  3. Chaussy, C.; Schmiedt, E.; Jocham, B.; Brendel, W.; Forssmann, B.; Walther, V. First clinical experience with extracorporeally induced destruction of kidney stones by shock waves. J. Urol. 1982, 127, 417–420. [Google Scholar] [CrossRef]
  4. Philipp, A.; Delius, M.; Scheffczyk, C.; Vogel, A.; Lauterborn, W. Interaction of lithotripter-generated shock waves with air bubbles. J. Acoust. Soc. Am. 1993, 93, 2496–2509. [Google Scholar] [CrossRef]
  5. Lauterborn, W.; Ohl, C.D. The peculiar dynamics of cavitation bubbles. Appl. Sci. Res. 1998, 58, 63–76. [Google Scholar] [CrossRef]
  6. Brujan, E.A.; Ikeda, T.; Matsumoto, Y. On the pressure of cavitation bubbles. Exp. Thermal Fluid Sci. 2008, 32, 1188–1191. [Google Scholar] [CrossRef]
  7. Klaseboer, E.; Fong, S.W.; Turangan, C.K.; Khoo, B.C.; Szeri, A.J.; Calvisi, M.L.; Sankin, G.N.; Zhong, P. Interaction of lithotripter shockwaves with single inertial cavitation bubbles. J. Fluid Mech. 2007, 593, 33–56. [Google Scholar] [CrossRef]
  8. Choi, M.J.; Coleman, A.J.; Saunders, J.E. The influence of fluid properties and pulse amplitude on bubble dynamics in the field of a shock wave lithotripter. J. Phys. Med. Biol. 1993, 38, 1561–1573. [Google Scholar] [CrossRef]
  9. Prosperetti, A.; Lezzi, A. Bubble dynamics in a compressible liquid. Part 1. First-order theory. J. Fluid Mech. 1986, 168, 457–478. [Google Scholar] [CrossRef]
  10. Zhong, P.; Lin, H.; Xi, X.; Zhu, S.; Bhogte, E.S. Shock wave-inertial microbubble interaction: Methodology, physical characterization, and bioeffect study. J. Acoust. Soc. Am. 1999, 105, 1997–2009. [Google Scholar] [CrossRef]
  11. Coleman, A.J.; Saunders, J.E.; Crum, L.A.; Dyson, M. Acoustic cavitation generated by an extracorporeal shock wave lithotripter. Ultrasound Med. Biol. 1987, 13, 69–76. [Google Scholar] [CrossRef]
  12. Crum, L.A. Cavitation microjets as a contributory mechanism for renal calculi disintegration in ESWL. J. Urol. 1988, 140, 1587–1590. [Google Scholar] [CrossRef]
  13. Delacrétaz, G.; Rink, K.; Pittomvils, G.; Lafaut, J.P.; Vandeursen, H.; Boving, R. Importance of the implosion of ESWL-induced cavitation bubbles. Ultrasound Med. Biol. 1995, 21, 97–103. [Google Scholar] [CrossRef]
  14. Zhong, P.; Cocks, F.H.; Cioanta, I.; Preminger, G.M. Controlled, forced collapse of cavitation bubbles for improved stone fragmentation during shock wave lithotripsy. J. Urol. 1997, 158, 2323–2328. [Google Scholar] [CrossRef]
  15. Cathignol, E.; Tavakkoli, J.; Birer, A.; Arefiev, A. Comparison between the effects of cavitation induced by two different pressure-time shock waveform pulses. IEEE Trans. Ultrason. Ferroelectr. Freq. Control 1998, 45, 788–799. [Google Scholar] [CrossRef]
  16. Xi, X.; Zhong, P. Improvement of stone fragmentation during shock-wave lithotripsy using a combined EH/PEAA shock-wave generator-in vitro experiments. Ultrasound Med. Biol. 2000, 26, 457–467. [Google Scholar] [CrossRef]
  17. Loske, A.M.; Prieto, F.E.; Fernández, F.; van Cauwelaert, J. Tandem shock wave cavitation enhancement for extracorporeal lithotripsy. Phys. Med. Biol. 2002, 47, 3945–3957. [Google Scholar] [CrossRef]
  18. Loske, A.M.; Fernández, F.; Zendejas, H.; Paredes, M.; Castaño-Tostado, E. Dual pulse shock wave lithotripsy: In vitro and in vivo study. J. Urol. 2005, 174, 2388–2392. [Google Scholar] [CrossRef]
  19. Fernández, F.; Fernández, G.; Loske, A.M. Treatment time reduction using tandem shockwaves for lithotripsy: An in vivo study. J. Endourol. 2009, 23, 1247–1253. [Google Scholar] [CrossRef]
  20. Ohl, C.D.; Ikink, R. Shock-wave-induced jetting of micron-size bubble. Phys. Rev. Lett. 2003, 90, 214502. [Google Scholar] [CrossRef]
  21. Kodama, T.; Takayama, K. Dynamic behavior of bubbles during extracorporeal shock-wave lithotripsy. Ultrasound Med. Biol. 1998, 24, 723–738. [Google Scholar] [CrossRef]
  22. Tzanakis, I.; Eskin, D.G.; Georgoulas, A.; Fytanidis, D.K. Incubation pit analysis and calculation of the hydrodynamic impact pressure from the implosion of an acoustic cavitation bubble. Ultrason. Sonochem. 2014, 21, 866–878. [Google Scholar] [CrossRef]
  23. Loske, A.M.; Campos-Guillen, J.; Fernández, F.; Castaño-Tostado, E. Enhanced shock wave-assisted transformation of Escherichia coli. Ultrasound Med. Biol. 2011, 37, 502–510. [Google Scholar] [CrossRef]
  24. Magaña-Ortíz, D.; Coconi-Linares, N.; Ortiz-Vazquez, E.; Fernández, F.; Loske, A.M.; Gómez-Lim, M.A. A novel and highly efficient method for genetic transformation of fungi employing shock waves. Fungal Genet. Biol. 2013, 56, 9–16. [Google Scholar] [CrossRef]
  25. Molina, G.A.; González-Fuentes, F.; Loske, A.M.; Fernández, F.; Estevez, M. Shock wave-assisted extraction of phenolic acids and flavonoids from Eysenhardtia polystachya heartwood: A novel method and its comparison with conventional methodologies. Ultrason. Sonochem. 2020, 61, 104809. [Google Scholar] [CrossRef]
  26. Church, C.C. A Theoretical study of cavitation generated by an extracorporeal shock wave lithotripter. J. Acoust. Soc. Am. 1989, 86, 215–227. [Google Scholar] [CrossRef]
  27. Cairns, T.C.; Barthel, L.; Meyer, V. Something old, something new: Challenges and developments in Aspergillus niger biotechnology. Essays Biochem. 2021, 65, 213–224. [Google Scholar] [CrossRef]
  28. Meyer, V.; Wu, B.; Ram, A.F.J. Aspergillus as a multi-purpose cell factory: Current status and perspectives. Biotechnol. Lett. 2011, 33, 469–476. [Google Scholar] [CrossRef]
  29. Rose, S.H.; van Zyl, W.H. Exploitation of Aspergillus niger for the heterologous production of cellulases and hemicellulases. Open Biotechnol. J. 2008, 2, 167–175. [Google Scholar] [CrossRef]
  30. Fleißner, A.; Dersch, P. Expression and export: Recombinant protein production systems for Aspergillus. Appl. Microbiol. Biot. 2010, 87, 1255–1270. [Google Scholar] [CrossRef]
  31. Sun, X.; Wu, H.; Zhao, G.; Li, Z.; Wu, X.; Liu, H.; Zheng, Z. Morphological regulation of Aspergillus niger to improve citric acid production by chsC gene silencing. Bioproc. Biosyst. Eng. 2018, 41, 1029–1038. [Google Scholar] [CrossRef]
  32. van Leeuwe, T.M.; Gerritsen, A.; Arentshorst, M.; Punt, P.J.; Ram, A.F.J. Rab GDP-dissociation inhibitor gdiA is an essential gene required for cell wall chitin deposition in Aspergillus niger. Fungal Genet. Biol. 2020, 136, 103319. [Google Scholar] [CrossRef]
  33. de Groot, P.W.J.; Brandt, B.W.; Horiuchi, H.; Ram, A.F.J.; de Koster, C.G.; Klis, F.M. Comprehensive genomic analysis of cell wall genes in Aspergillus nidulans. Fungal Genet. Biol. 2009, 46, S72–S81. [Google Scholar] [CrossRef]
  34. Gow, N.A.R.; Latge, J.P.; Munro, C.A. The fungal cell wall: Structure, biosynthesis, and function. Microbiol. Spectr. 2017, 5, 1–25. [Google Scholar] [CrossRef]
  35. Ruiz-Herrera, J.; Ortiz-Castellanos, L. Cell wall glucans of fungi. A review. Cell Surface 2019, 5, 100022. [Google Scholar] [CrossRef]
  36. Olaya-Abril, A.; Jiménez-Munguía, I.; Gómez-Gascón, L.; Rodríguez-Ortega, M.J. Surfomics: Shaving live organisms for a fast proteomic identification of surface proteins. J. Proteom. 2014, 97, 164–176. [Google Scholar] [CrossRef]
  37. Lichius, A.; Ruiz, D.M.; Zeilinger, S. Genetic Transformation of Filamentous Fungi: Achievements and Challenges. In Grand Challenges in Biology and Biotechnology; Nevalainen, H., Ed.; Springer: Cham, Switzerland, 2020; Volume Grand Challenges in Fungal Biotechnology, pp. 123–164. [Google Scholar] [CrossRef]
  38. Fang, T.H.; Kang, S.H.; Hong, Z.H.; Wu, C.D. Elasticity and nanomechanical response of Aspergillus niger spores using atomic force microscopy. Micron 2012, 43, 407–411. [Google Scholar] [CrossRef]
  39. Wargenau, A.; Fleißner, A.; Bolten, C.J.; Rohde, M.; Kampen, I.; Kwade, A. On the origin of the electrostatic surface potential of Aspergillus niger spores in acidic environments. Res. Microbiol. 2011, 162, 1011–1017. [Google Scholar] [CrossRef]
  40. Pihet, M.; Vandeputte, P.; Tronchin, G.; Renier, G.; Saulnier, P.; Georgeault, S.; Bouchara, J.P. Melanin is an essential component for the integrity of the cell wall of Aspergillus fumigatus conidia. BMC Microbiol. 2009, 9, 177. [Google Scholar] [CrossRef]
  41. Koshiyama, K.; Kodama, T.; Yano, T.; Fujikawa, S. Structural change in lipid bilayers and water penetration induced by shock waves: Molecular dynamics simulations. Biophys. J. 2006, 91, 2198–2205. [Google Scholar] [CrossRef]
  42. Kodama, T.; Hamblin, M.R.; Doukas, A.G. Cytoplasmic molecular delivery with shock waves: Importance of impulse. Biophys. J. 2000, 79, 1821–1832. [Google Scholar] [CrossRef]
  43. Kuraya, E.; Miyafuji, Y.; Takemoto, A.; Itoh, S. The effect of underwater shock waves on steam distillation of Alpinia zerumbet leaves. Trans. Mater. Res. Soc. Jpn. 2014, 39, 447–449. [Google Scholar] [CrossRef]
  44. López-Marín, L.M.; Millán-Chiu, B.E.; Castaño-González, K.; Aceves, C.; Fernández, F.; Varela-Echavarría, A.; Loske, A.M. Shock wave-induced damage and poration in eukaryotic cell membranes. J. Membr. Biol. 2017, 250, 41–52. [Google Scholar] [CrossRef]
  45. Liauw, C.M.; Slate, A.J.; Butler, J.A.; Wilson-Nieuwenhuis, J.S.; Deisenroth, T.; Preuss, A.; Whitehead, K.A. The effect of surface hydrophobicity on the attachment of fungal conidia to substrates of polyvinyl acetate and polyvinyl alcohol. J. Polym. Environ. 2020, 28, 1450–1464. [Google Scholar] [CrossRef]
  46. Arora, M.; Ohl, C.D.; Mørch, K.A. Cavitation inception on microparticles: A self-propelled particle accelerator. Phys. Rev. Lett. 2004, 92, 174501. [Google Scholar] [CrossRef] [PubMed]
  47. Newton Harvey, E.; Barnes, D.K.; McElroy, W.D.; Whiteley, A.H.; Pease, D.C.; Cooper, K.W. Bubble formation in animals. I. Physical factors. J. Cell. Comp. Physiol. 1944, 24, 1–22. [Google Scholar] [CrossRef]
  48. Newton Harvey, E.; McElroy, W.D.; Whiteley, A.H. On cavity formation in water. J. Appl. Phys. 1947, 18, 162–172. [Google Scholar] [CrossRef]
  49. Kfoury, R.; Marzban, B.; Makki, E.; Greenfield, M.L.; Yuan, H. Effect of pressure profile of shock waves on lipid membrane deformation. PLoS ONE 2019, 14, e0212566. [Google Scholar] [CrossRef] [PubMed]
  50. de Icaza-Herrera, M.; Fernández, F.; Loske, A.M. Combined short and long-delay tandem shock waves to improve shock wave lithotripsy according to the Gilmore–Akulichev theory. Ultrasonics 2015, 58, 53–59. [Google Scholar] [CrossRef] [PubMed]
  51. Li, D.; Pellegrino, A.; Hallack, A.; Petrinic, N.; Jérusalem, A.; Cleveland, R.O. Response of single cells to shock waves and numerically optimized waveforms for cancer therapy. Biophys. J. 2018, 114, 1433–1439. [Google Scholar] [CrossRef]
  52. Kodama, T.; Tomita, Y. Cavitation bubble behavior and bubble–shock wave interaction near a gelatin surface as a study of in vivo bubble dynamics. Appl. Phys. B 2000, 70, 139–149. [Google Scholar] [CrossRef]
  53. Qin, P.; Han, T.; Alfred, C.; Xu, L. Mechanistic understanding the bioeffects of ultrasound-driven microbubbles to enhance macromolecule delivery. J. Control. Release 2018, 272, 169–181. [Google Scholar] [CrossRef] [PubMed]
  54. van Wamel, A.; Kooiman, K.; Harteveld, M.; Emmer, M.; ten Cate, F.J.; Versluis, M.; de Jong, N. Vibrating microbubbles poking individual cells: Drug transfer into cells via sonoporation. J. Control. Release 2006, 112, 149–155. [Google Scholar] [CrossRef] [PubMed]
  55. Li, W.; Juan, T.; Guo, X.S.; Di, X.; Dong, Z. Microstreaming velocity field and shear stress created by an oscillating encapsulated microbubble near a cell membrane. Chin. Phys. B 2014, 23, 124302. [Google Scholar] [CrossRef]
  56. Le Gac, S.; Zwaan, E.; van den Berg, A.; Ohl, C.D. Sonoporation of suspension cells with a single cavitation bubble in a microfluidic confinement. Lab Chip 2007, 7, 1666–1672. [Google Scholar] [CrossRef]
  57. Marmottant, P.; Hilgenfeldt, S. Controlled vesicle deformation and lysis by single oscillating bubbles. Nature 2003, 423, 153–156. [Google Scholar] [CrossRef]
  58. Zhao, L.; Schaefer, D.; Marten, M.R. Assessment of elasticity and topography of Aspergillus nidulans spores via atomic force microscopy. Appl. Environ. Microb. 2005, 71, 955–960. [Google Scholar] [CrossRef]
  59. Hernáez, M.L.; Ximénez-Embún, P.; Martínez-Gomariz, M.; Gutiérrez-Blázquez, M.D.; Nombela, C.; Gil, C. Identification of Candida albicans exposed surface proteins in vivo by a rapid proteomic approach. J. Proteom. 2010, 73, 1404–1409. [Google Scholar] [CrossRef]
  60. Karkowska-Kuleta, J.; Satala, D.; Bochenska, O.; Rapala-Kozik, M.; Kozik, A. Moonlighting proteins are variably exposed at the cell surfaces of Candida glabrata, Candida parapsilosis and Candida tropicalis under certain growth conditions. BMC Microbiol. 2019, 19, 149. [Google Scholar] [CrossRef] [PubMed]
  61. Gow, N.A.R.; Lenardon, M.D. Architecture of the dynamic fungal cell wall. Nat. Rev. Microbiol. 2023, 21, 248–259. [Google Scholar] [CrossRef] [PubMed]
  62. Gil-Bona, A.; Parra-Giraldo, C.M.; Hernáez, M.L.; Reales-Calderon, J.A.; Solis, N.V.; Filler, S.G.; Gil, C. Candida albicans cell shaving uncovers new proteins involved in cell wall integrity, yeast to hypha transition, stress response and host–pathogen interaction. J. Proteom. 2015, 127, 340–351. [Google Scholar] [CrossRef] [PubMed]
  63. Yin, Q.Y.; de Groot, P.W.; de Koster, C.G.; Klis, F.M. Mass spectrometry-based proteomics of fungal wall glycoproteins. Trends Microbiol. 2008, 16, 20–26. [Google Scholar] [CrossRef] [PubMed]
  64. Wang, H.Y.; Hua, X.W.; Jia, H.R.; Li, C.; Lin, F.; Chen, Z.; Wu, F.G. Universal cell surface imaging for mammalian, fungal, and bacterial cells. ACS Biomater. Sci. Eng. 2016, 2, 987–997. [Google Scholar] [CrossRef] [PubMed]
Figure 1. Sketch of the experimental setup showing a test vial containing conidial suspension centered at the axis of symmetry of the hemispherical shock wave source inside the water tank. The field of view of the camera is shown with dotted lines.
Fluids 09 00081 g001
Figure 2. Sequence of images (T = 20 µs) showing acoustic cavitation outside and inside a sealed vial containing distilled water and A. niger conidia, exposed to (a) an SP, (b) an SDT, and (c) an LDT shock wave. In the SDT mode, the second shock wave arrived at t = 2T (delay = 40 µs), and in the LDT mode, the second shock wave reached the vial at t = 8T (delay = 160 µs). Markers refer to: 1. Shock wave direction as it propagates toward the vial. 2. Vial. 3. Suspension–air interface inside the vial. 4. Undesirable diffraction of light (not relevant for this study) from the back side of the vial. 5. and 7. Examples of the smallest visible bubbles at the instant of their maximum expansion. 6. and 8. Examples of the largest bubbles at the instant of their maximum expansion.
Fluids 09 00081 g002
Figure 3. SEM images of (a) nontreated conidia (control) and conidia exposed to (b) 200 SP shock waves, (c) 200 SDT shock waves, and (d) 200 LDT shock waves. White arrowheads indicate foreground cell pores.
Fluids 09 00081 g003
Figure 4. TEM images of (a) a nontreated conidium (control) and a conidium exposed to (b) 200 SP shock waves, (c) 200 SDT shock waves, and (d) 200 LDT shock waves. (eh) are magnifications of the images shown above. CW means cell wall. Rectangles enclose evidence of a detached outer layer. The ellipse in (f) shows cell wall morphology changes, such as depressions. Arrows show the formation of diverticula-like structures. Arrowheads indicate detachments resembling shavings of the outer cell wall.
Fluids 09 00081 g004
Figure 5. BCA protein quantification of control and shock wave-treated samples. The length of each bar is the average of three results. * Significant differences between shock wave groups and the control group. ** Significant differences between groups. (p > 0.001).
Fluids 09 00081 g005
Figure 6. SDS-PAGE gel electrophoresis of different shock wave treatments and the control group. Arrowheads point to some of the new, more intense bands observed in the lanes of treated samples. Minimal medium (MM); control sample (Ctrl); molecular weight marker (MW) in kDa.
Fluids 09 00081 g006
Table 1. Experimental design.
GroupModeTandem EventsNumber
of SWs 1
Control--0
1SP 2-50
2SP-100
3SP-200
4SDT 32550
5SDT50100
6SDT100200
7LDT 42550
8LDT50100
9LDT100200
1 Shock waves. 2 Single pulse. 3 Short-delay tandem (delay = 40 µs). 4 Long-delay tandem (delay = 160 µs).
Table 2. Zeta potential and electrophoretic mobility of Aspergillus niger.
SampleMean Z Potential
(mV) ± SD 1
Electrophoretic Mobility
(µm × cm/Vs)
Control without SWs 2−20.37 ± 0.94−1.44
SP 3 50 SWs−28.85 ± 0.82−2.04
SP 100 SWs−26.98 ± 0.59−1.91
SP 200 SWs−30.09 ± 0.74−2.13
SDT 4 50 SWs−33.34 ±0.35−2.36
SDT 100 SWs−29.56 ± 1.33−2.09
SDT 200 SWs−32.66 ± 0.81−2.31
LDT 5 50 SWs−27.3 ± 1.0−1.93
LDT 100 SWs−29.57 ± 1.22−2.09
LDT 200 SWs−30.36 ± 0.04−2.15
1 Standard deviation. 2 Shock waves. 3 Single pulse. 4 Short-delay tandem (delay = 40 µs). 5 Long-delay tandem (delay = 160 µs).
Disclaimer/Publisher’s Note: The statements, opinions and data contained in all publications are solely those of the individual author(s) and contributor(s) and not of MDPI and/or the editor(s). MDPI and/or the editor(s) disclaim responsibility for any injury to people or property resulting from any ideas, methods, instructions or products referred to in the content.

