
Evaluating the Impact of Domain Boundaries on Hemodynamics in Intracranial Aneurysms within the Circle of Willis
 ,
,
Abstract
:1. Introduction
2. Materials and Methods
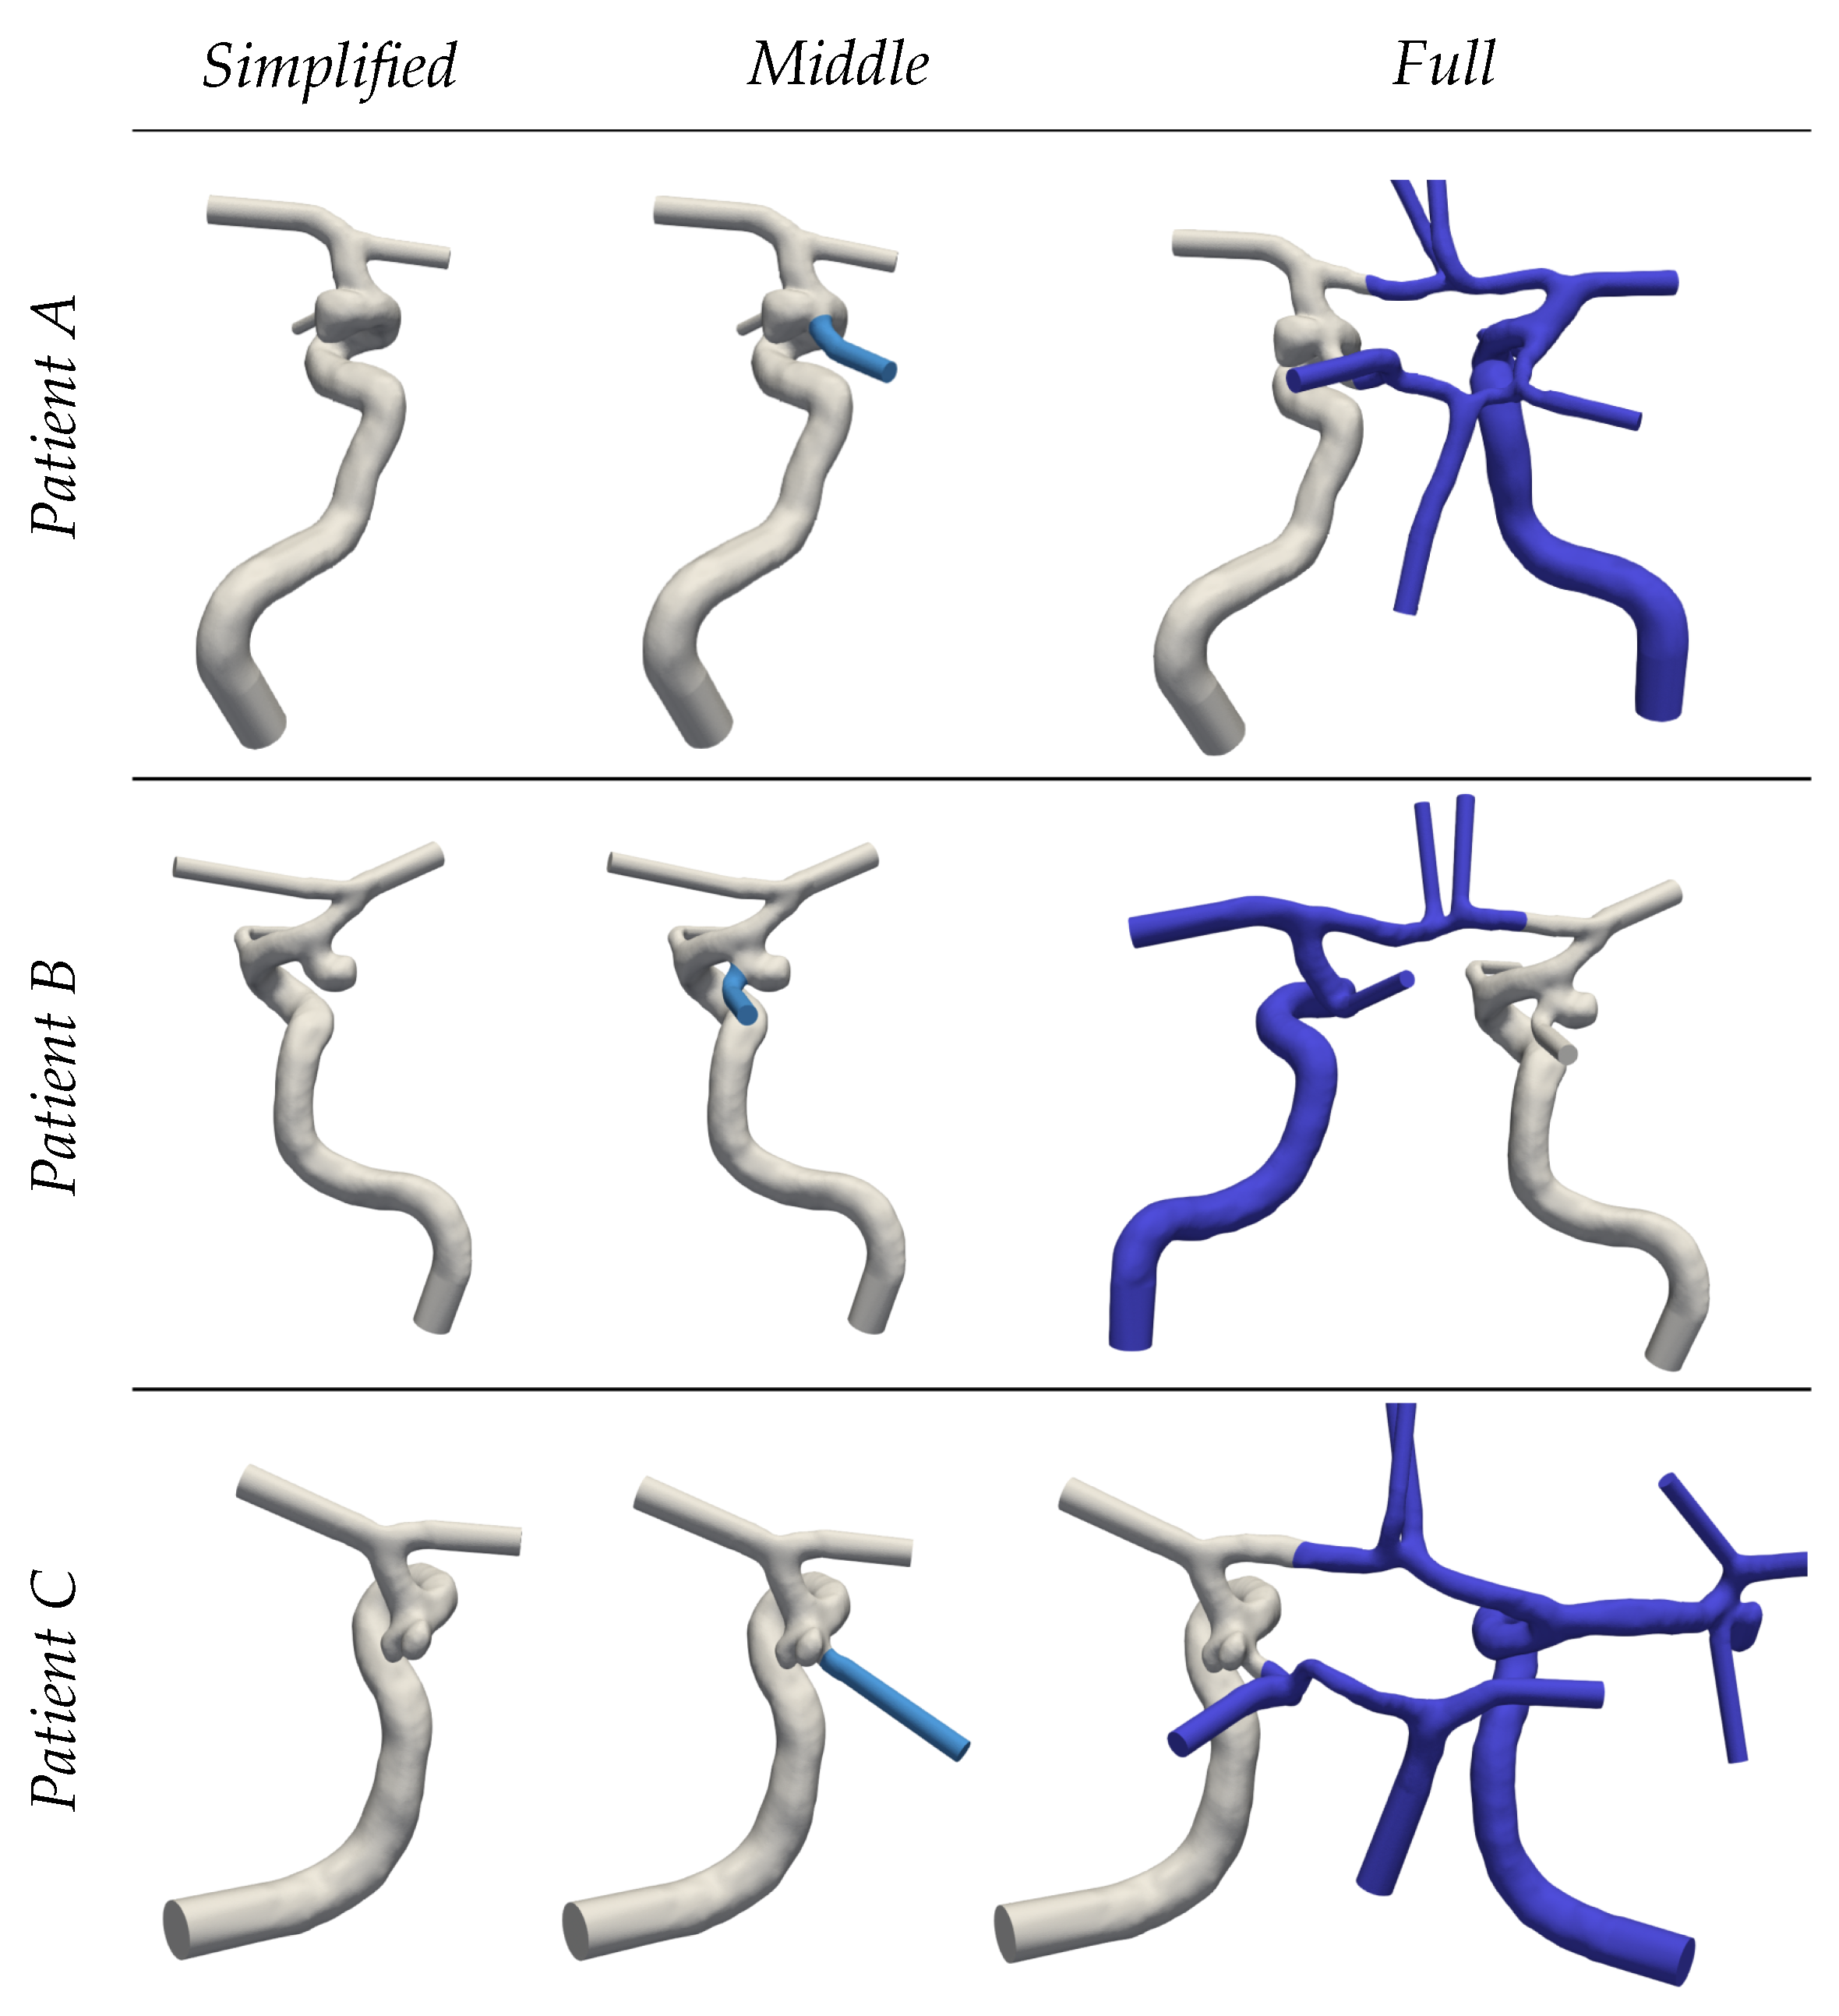
2.1. Medical Imaging and Segmentation
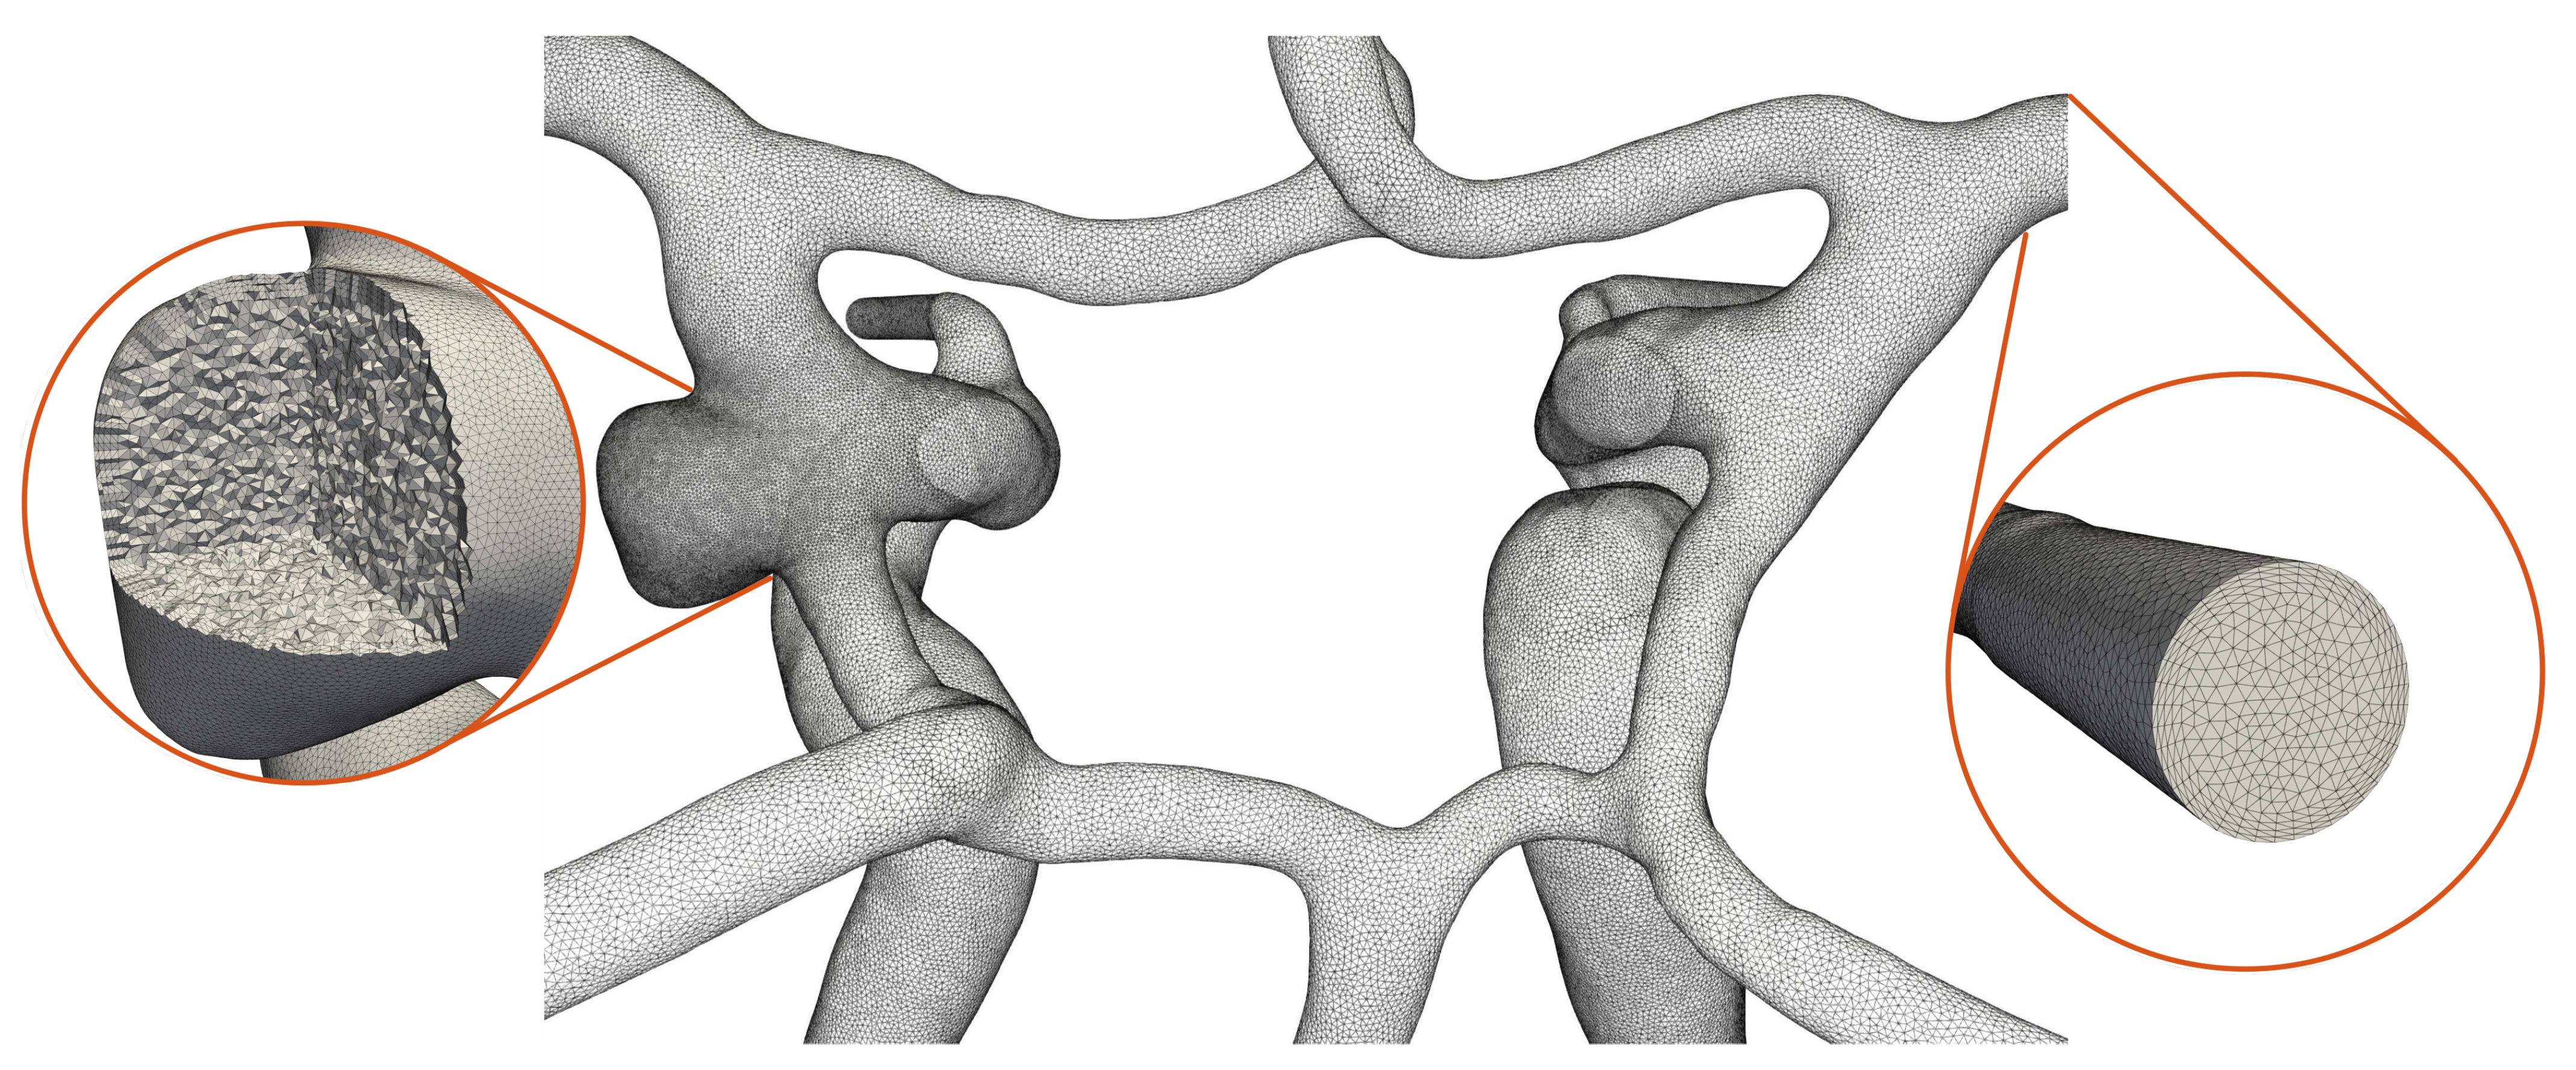
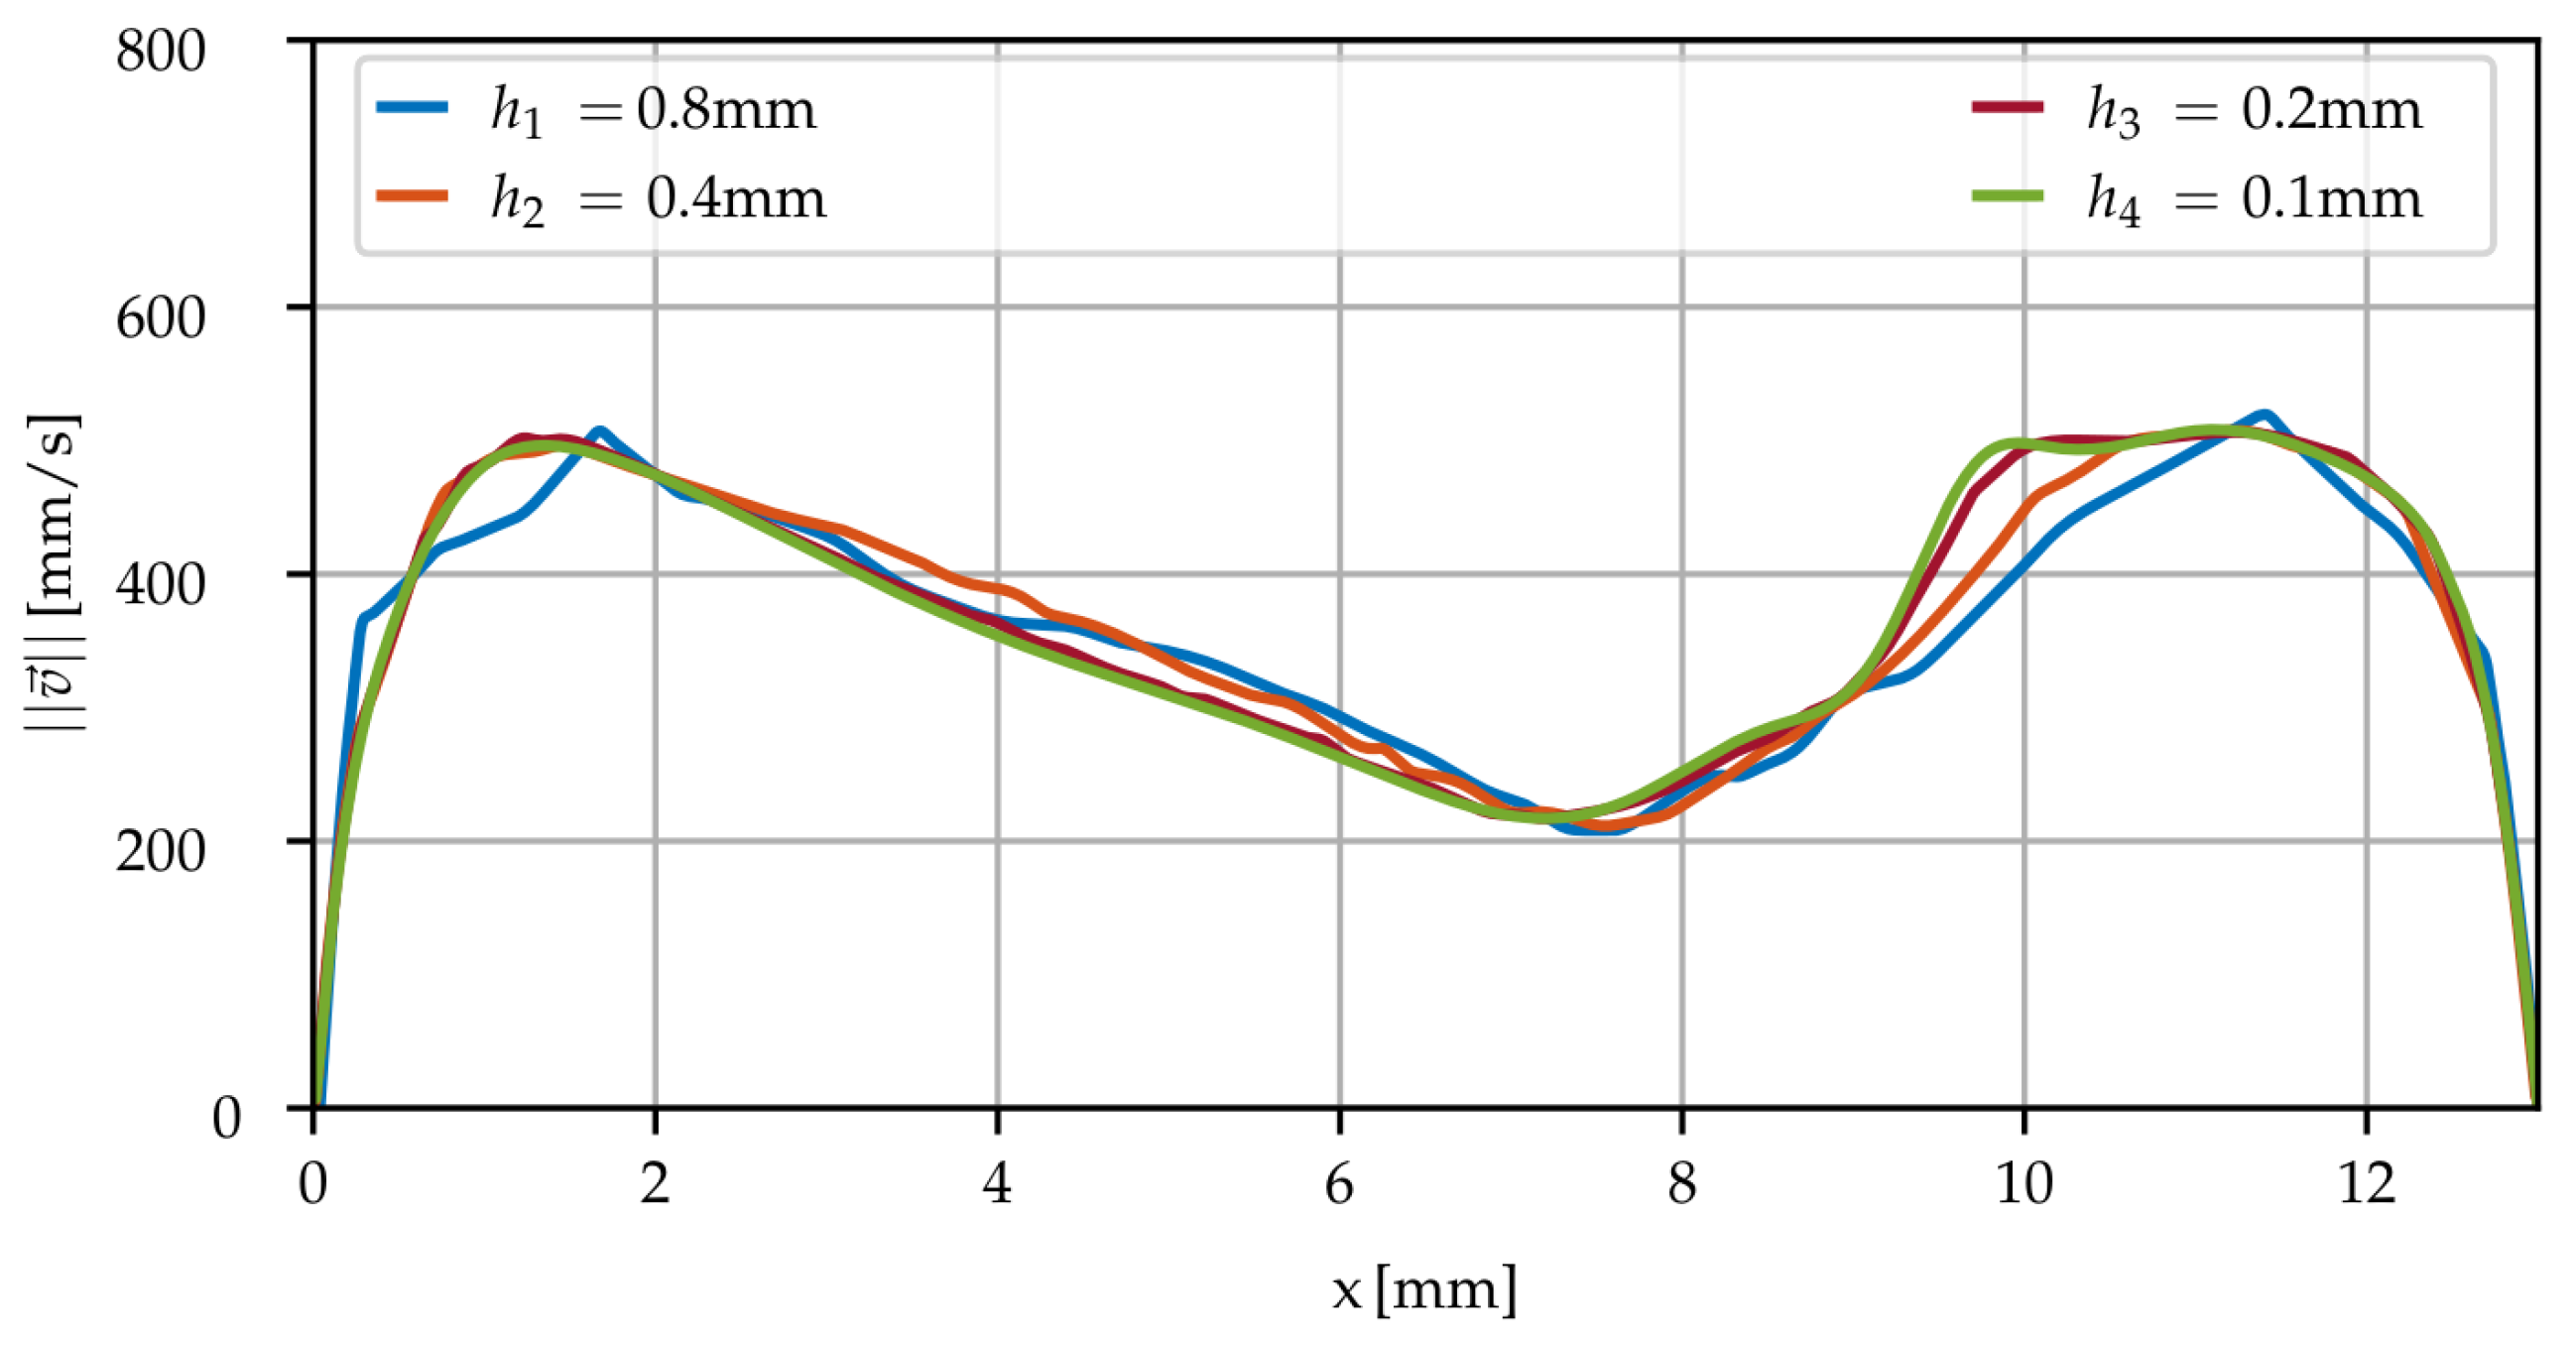
2.2. Spatial Discretization
2.3. Hemodynamics Simulations
2.3.1. Navier–Stokes
2.3.2. Rheology
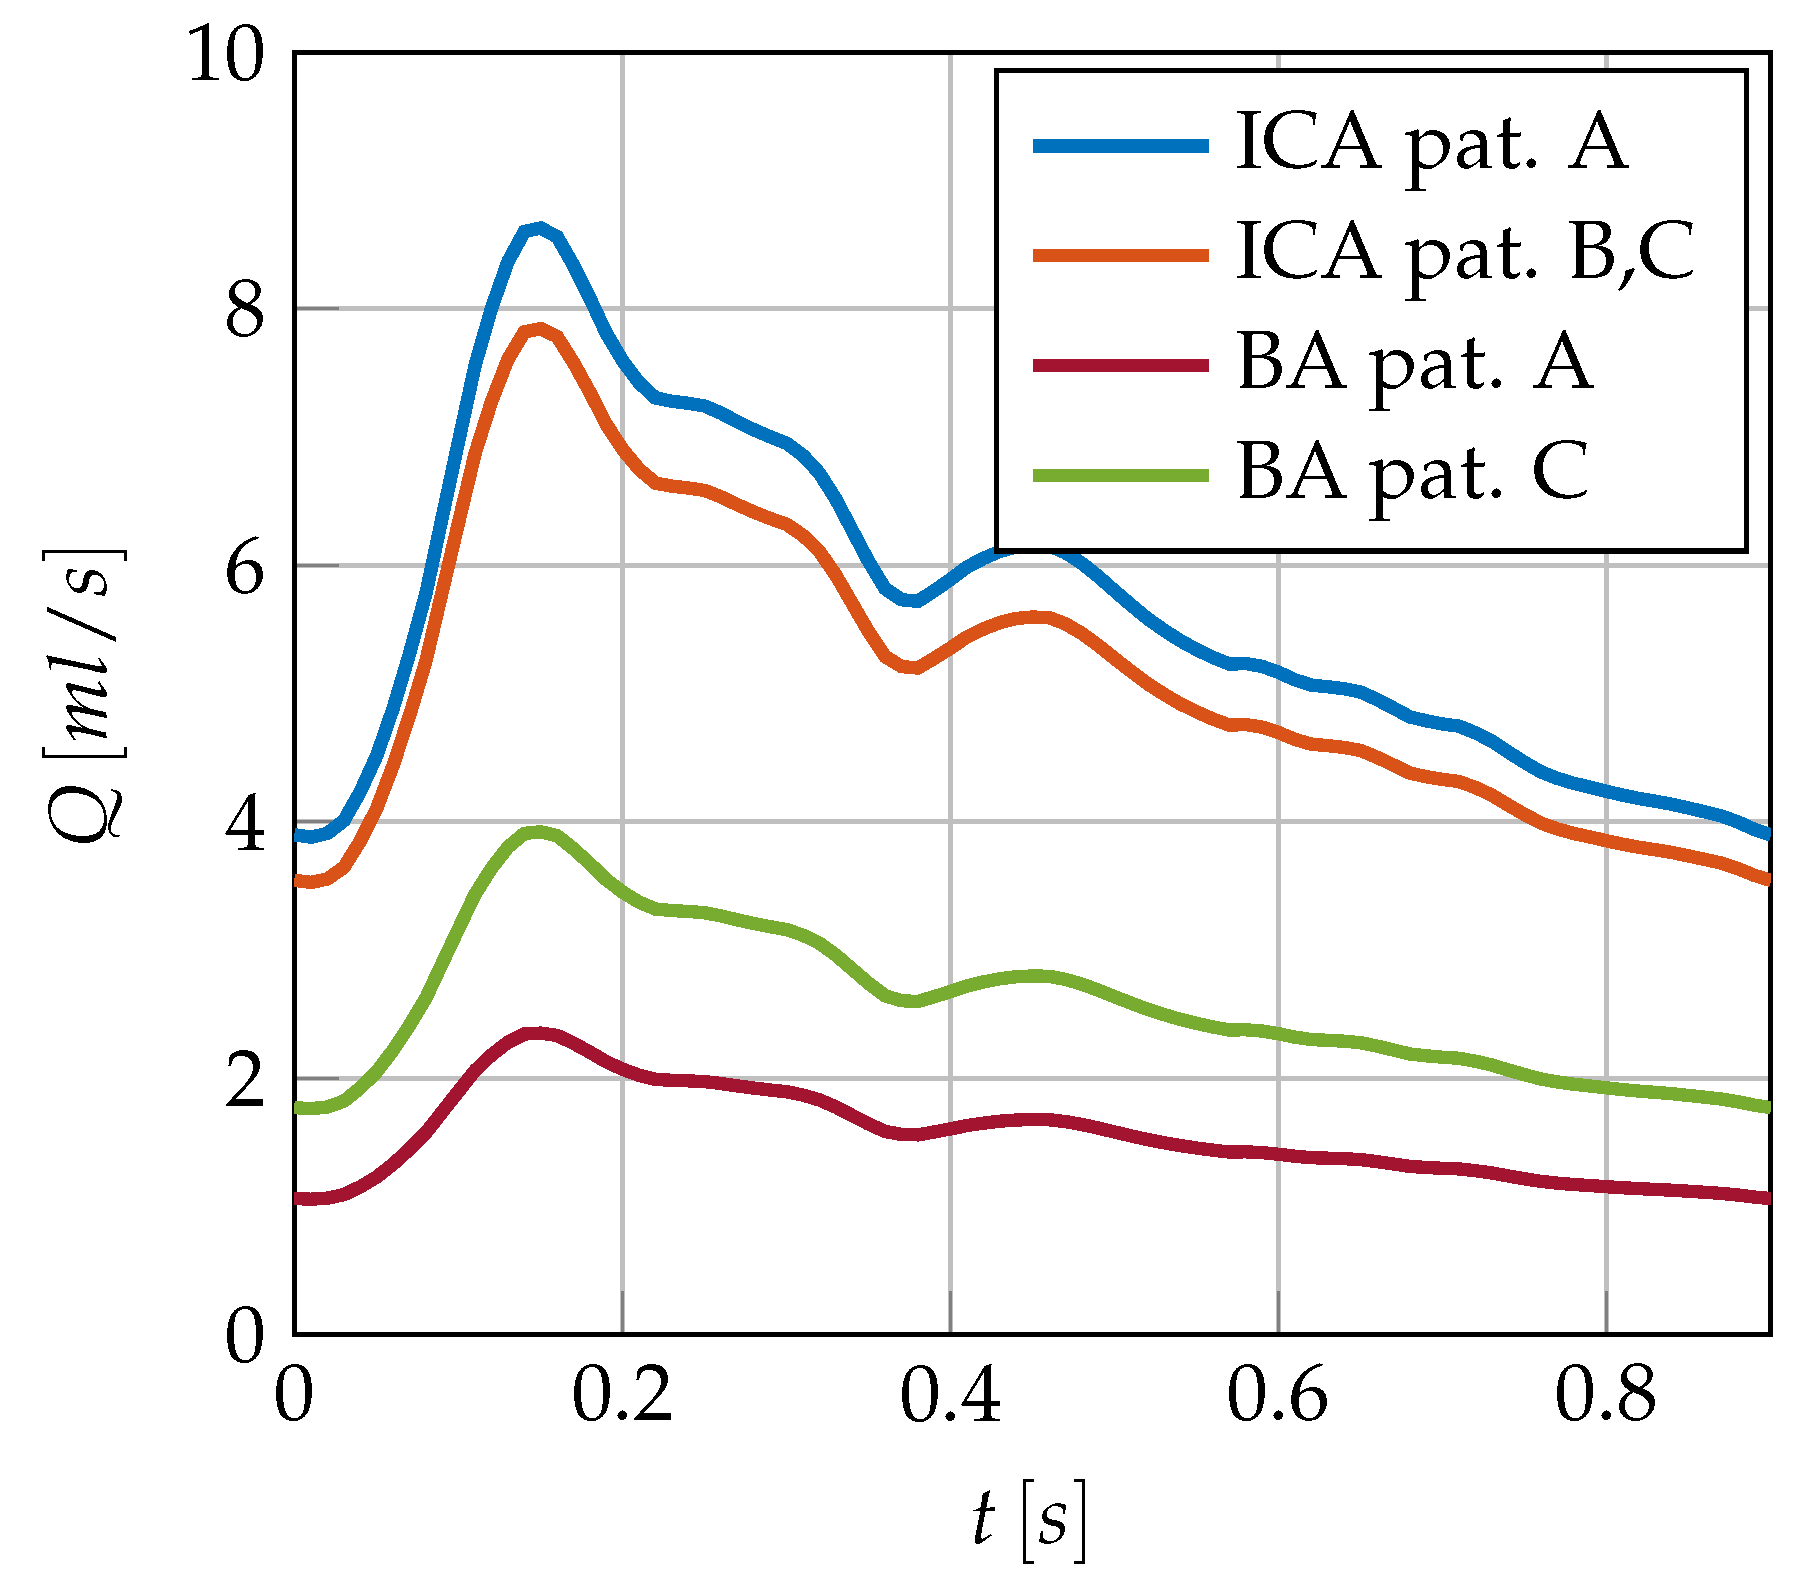
2.3.3. Boundary Conditions
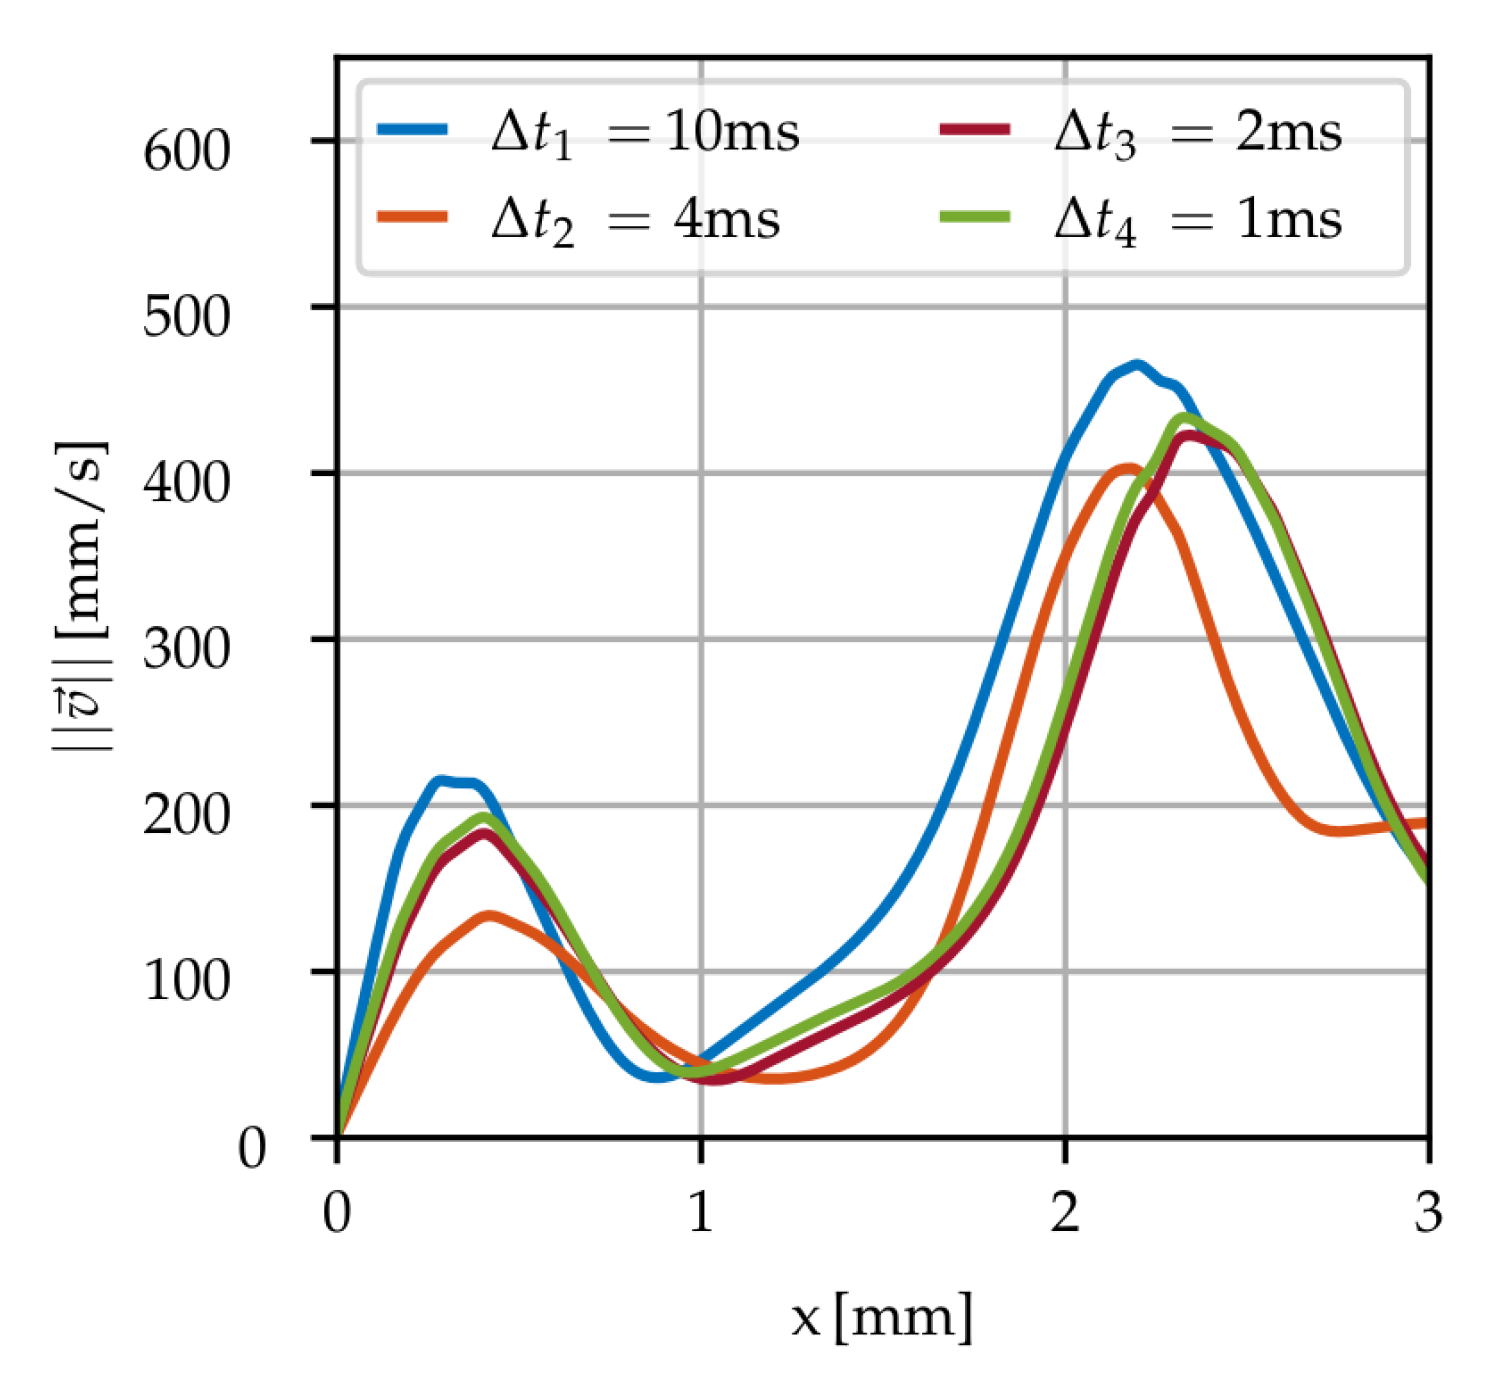
2.3.4. Computation Details
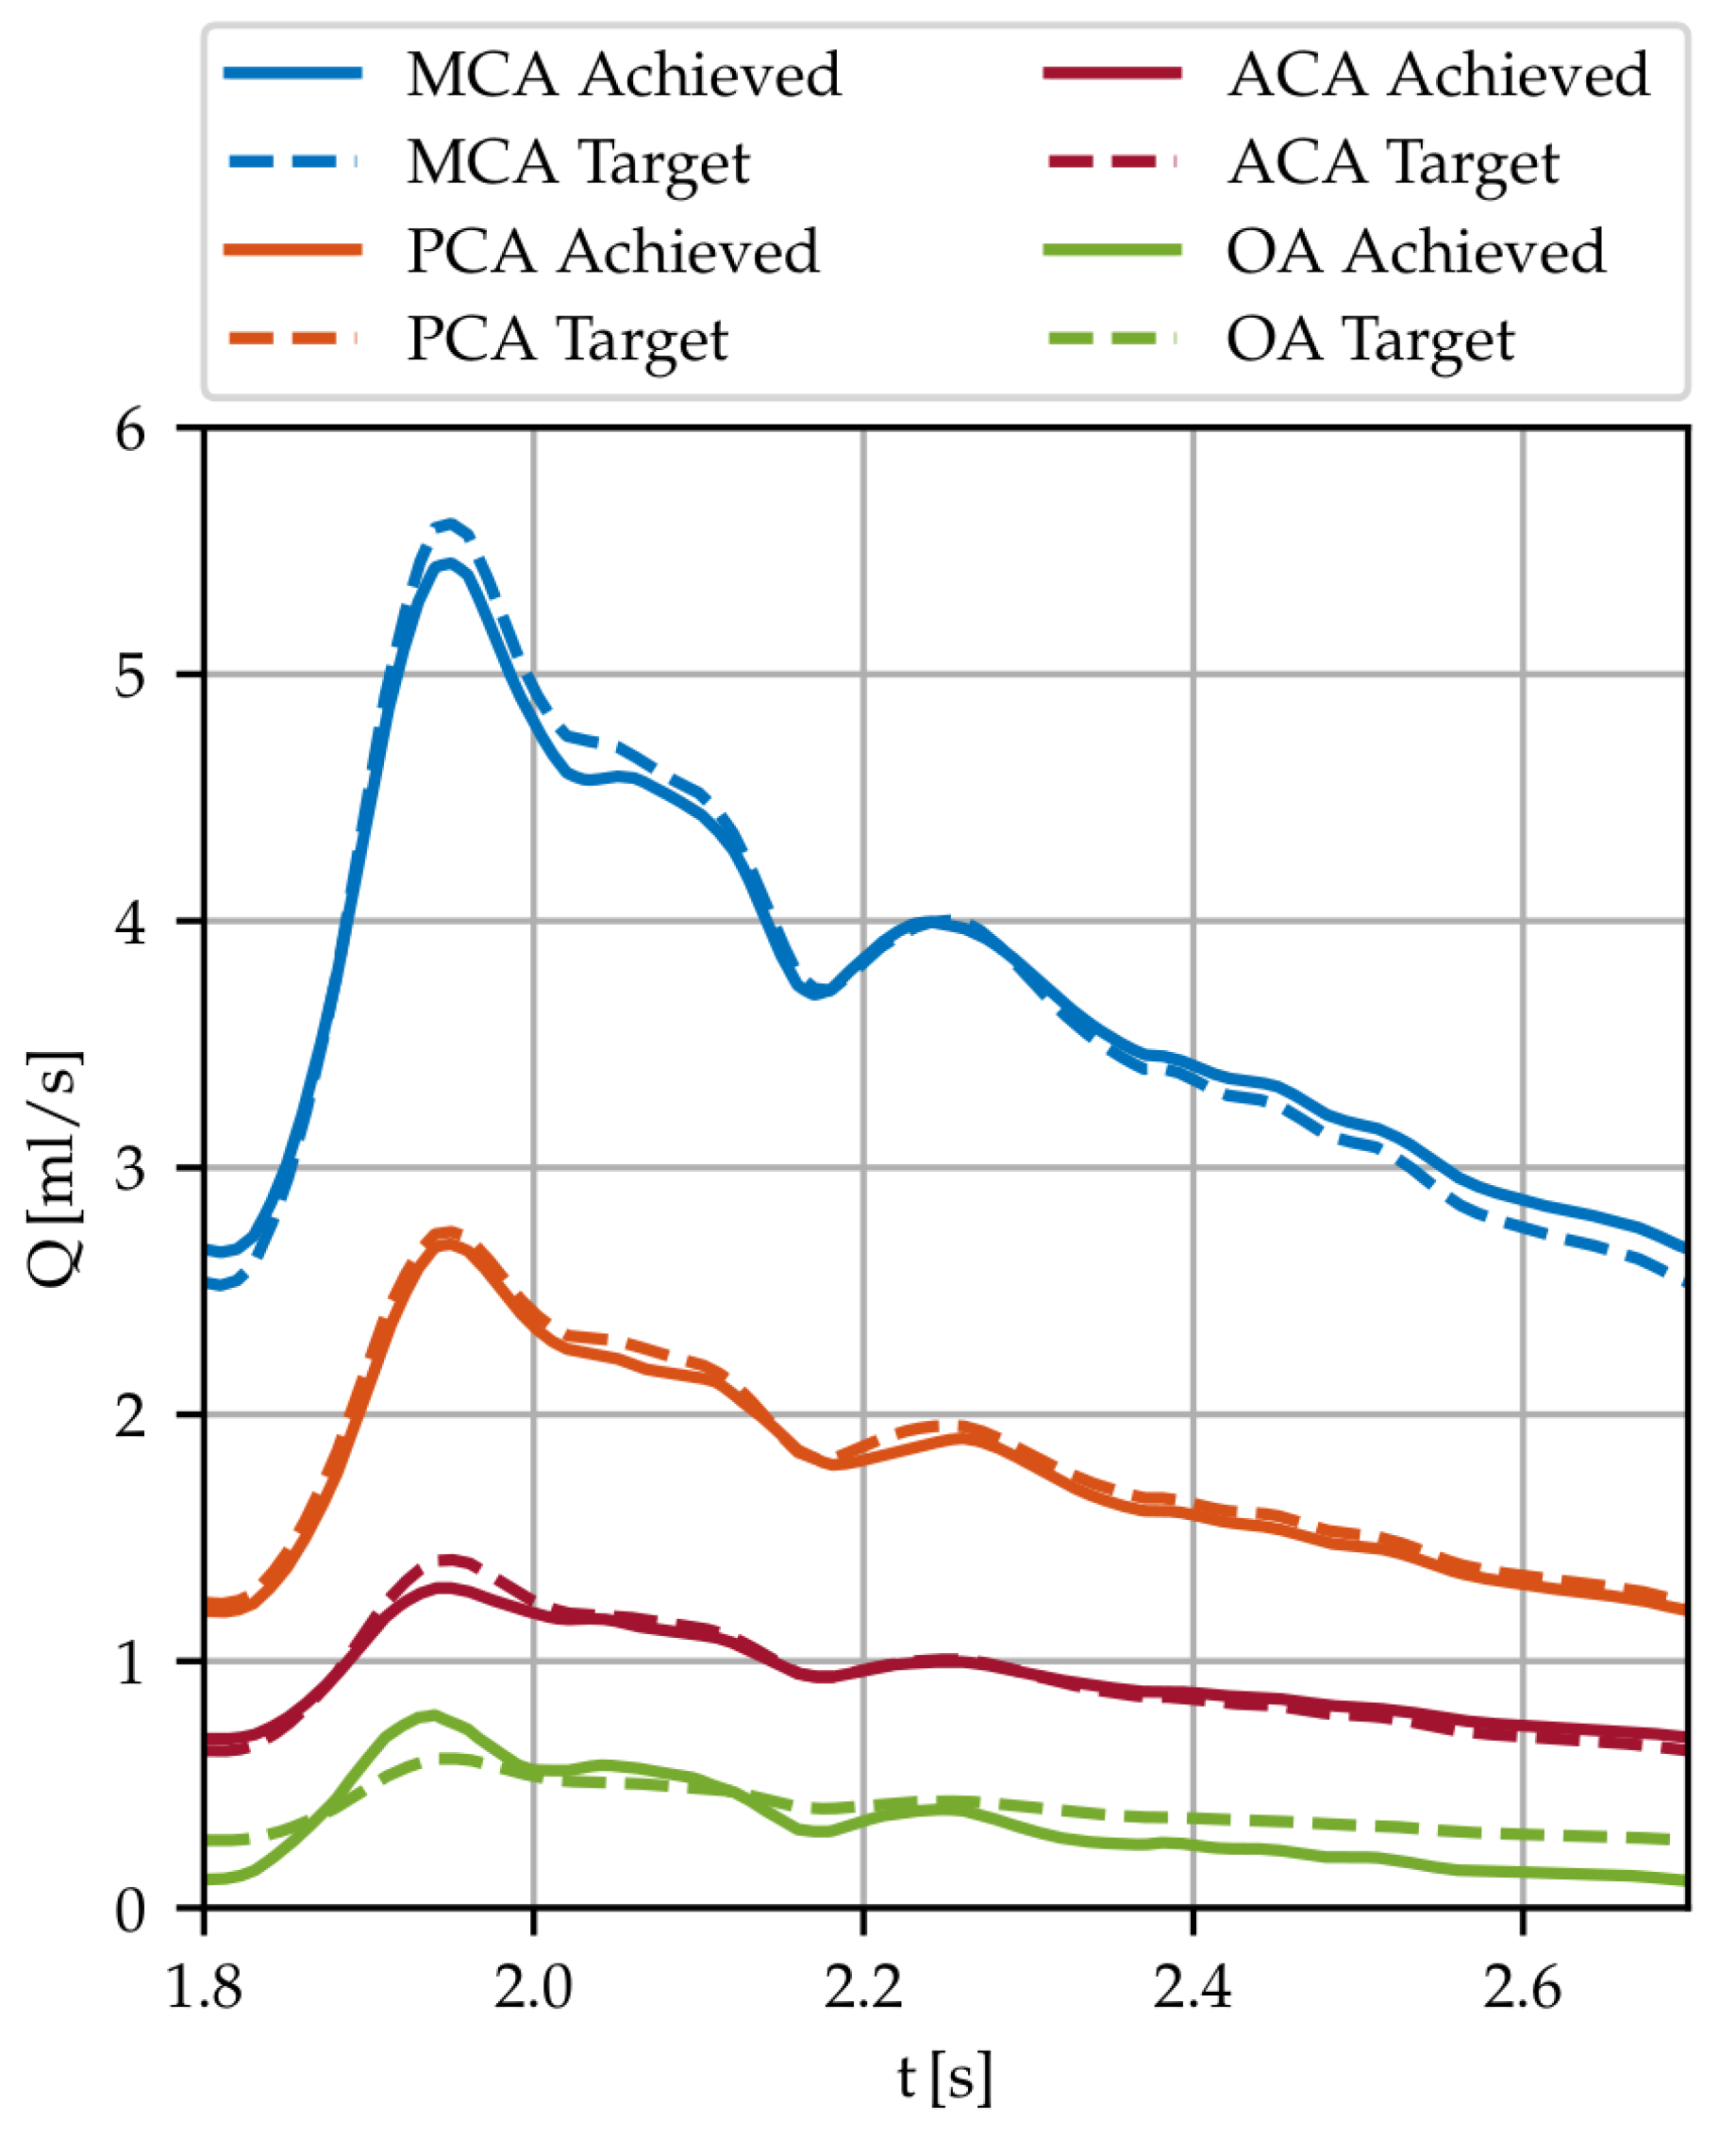
2.4. Hemodynamic Descriptors
3. Results
3.1. Simulations
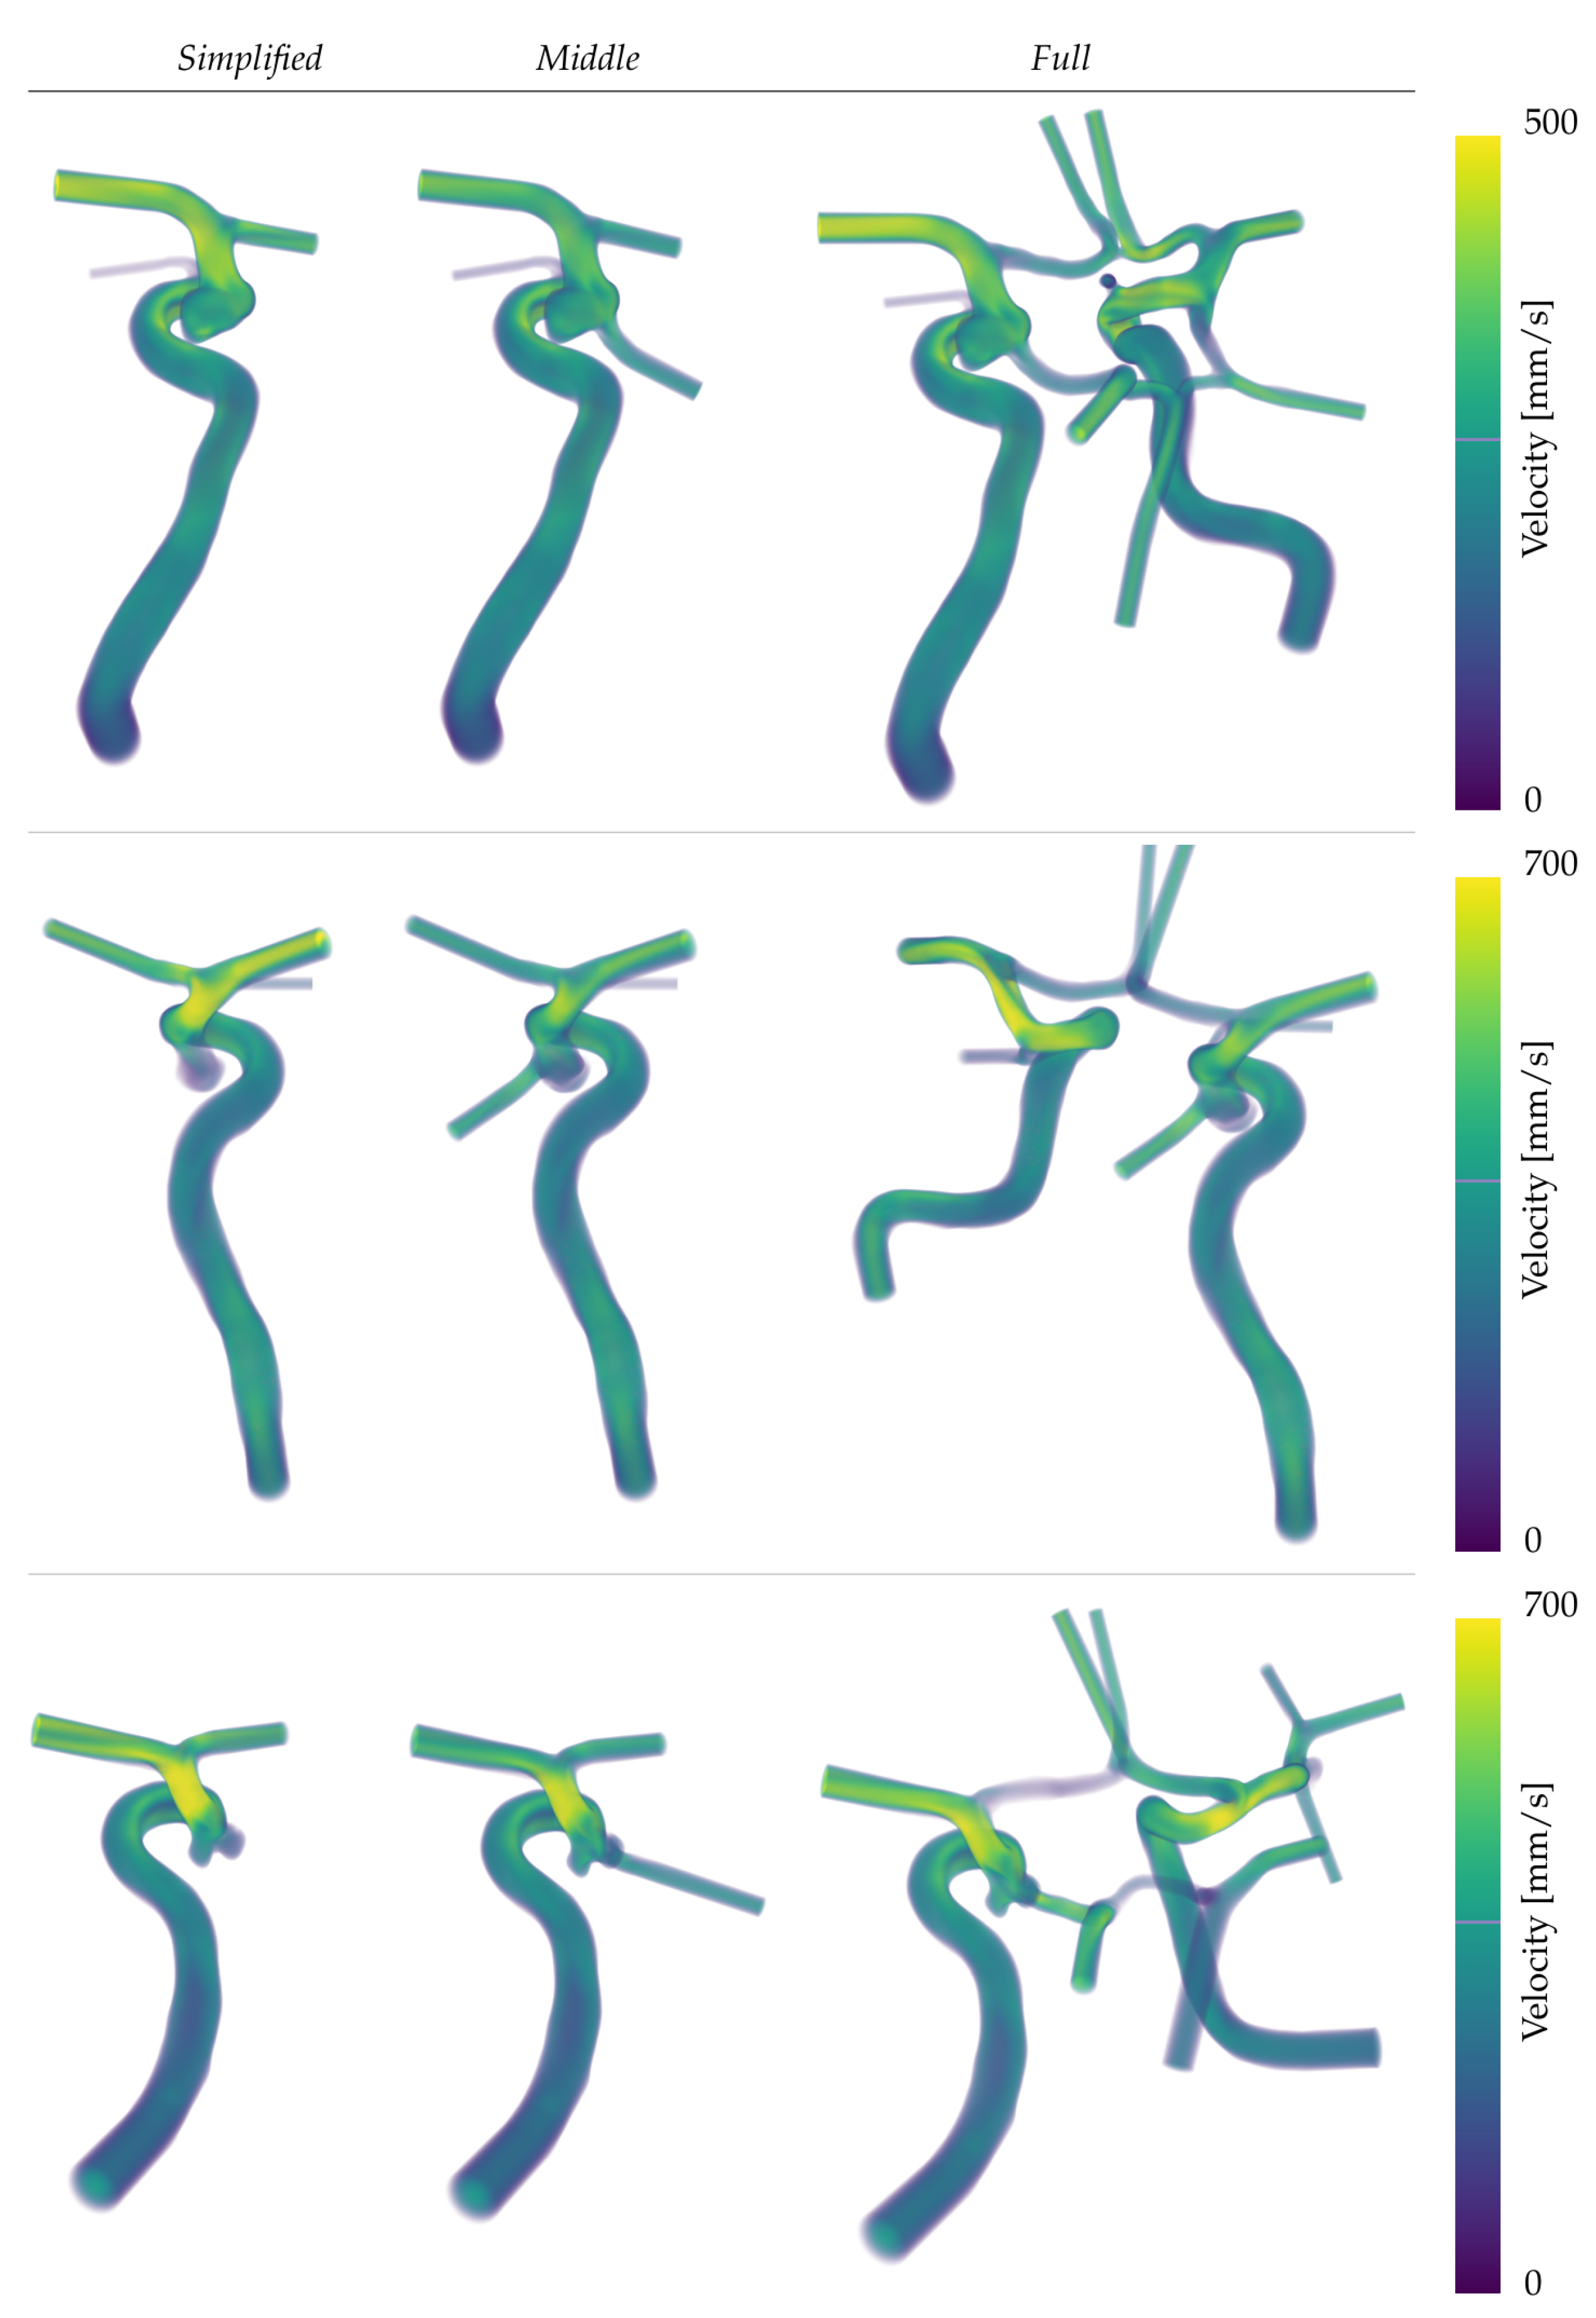
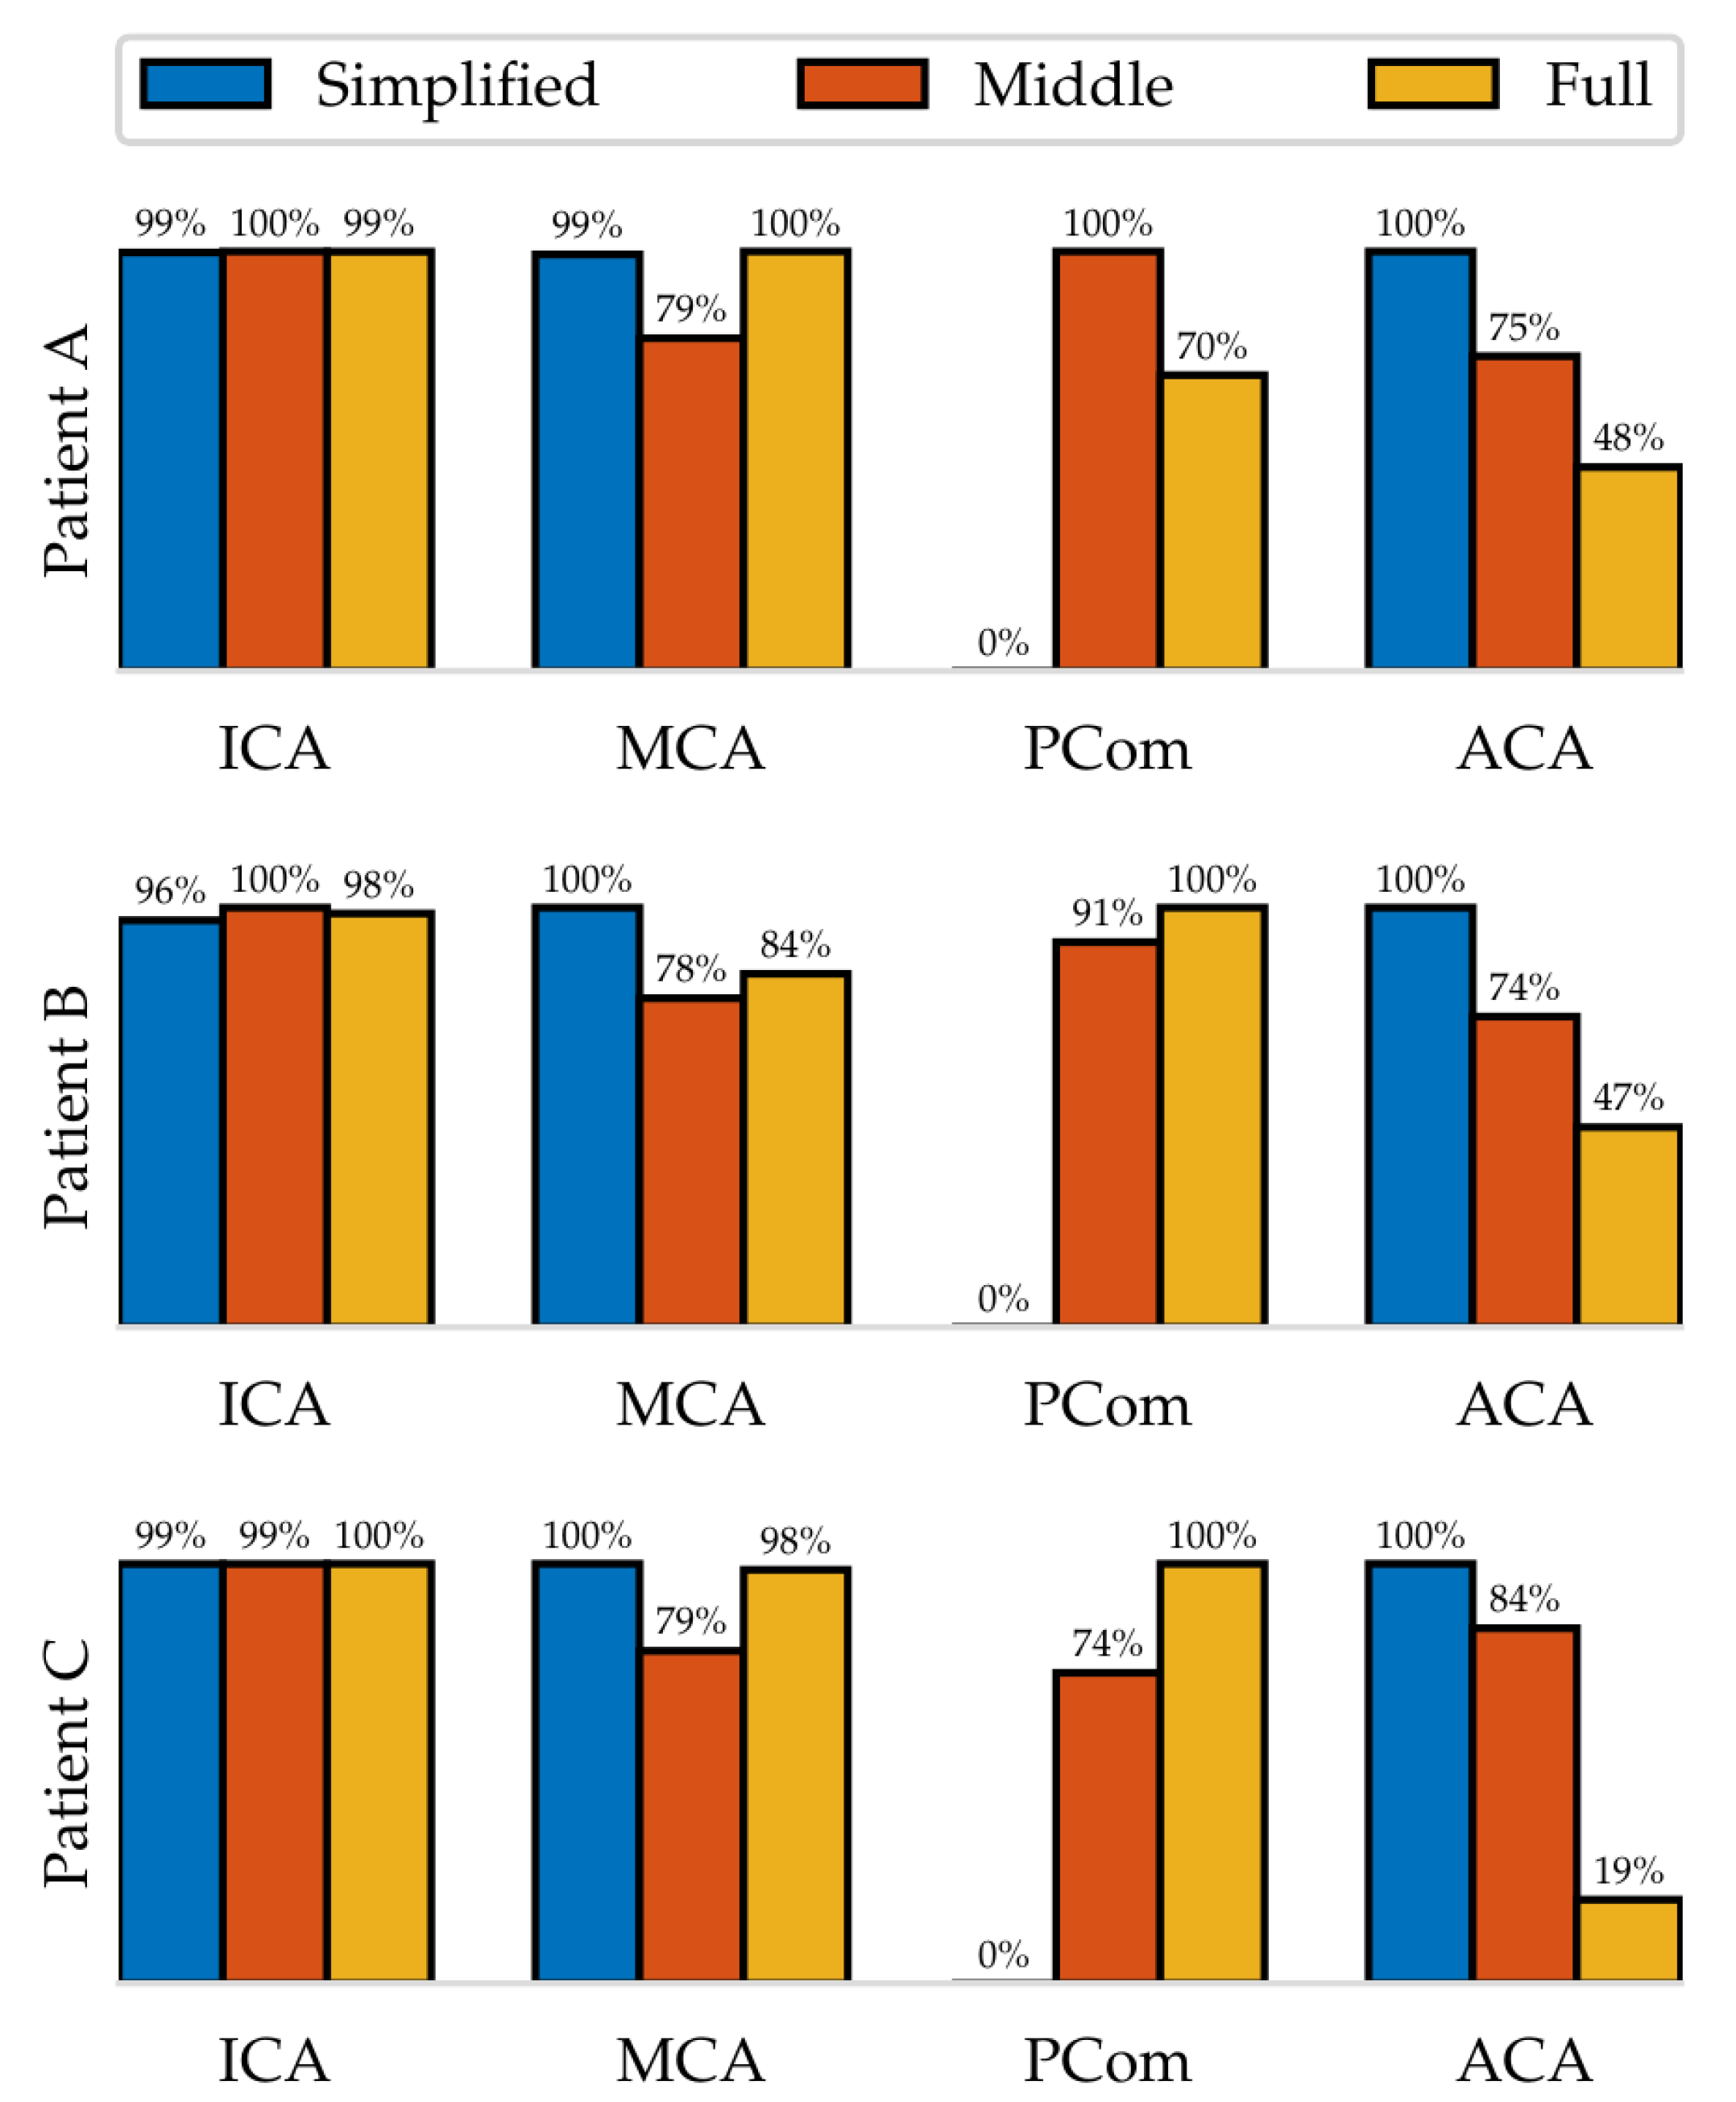
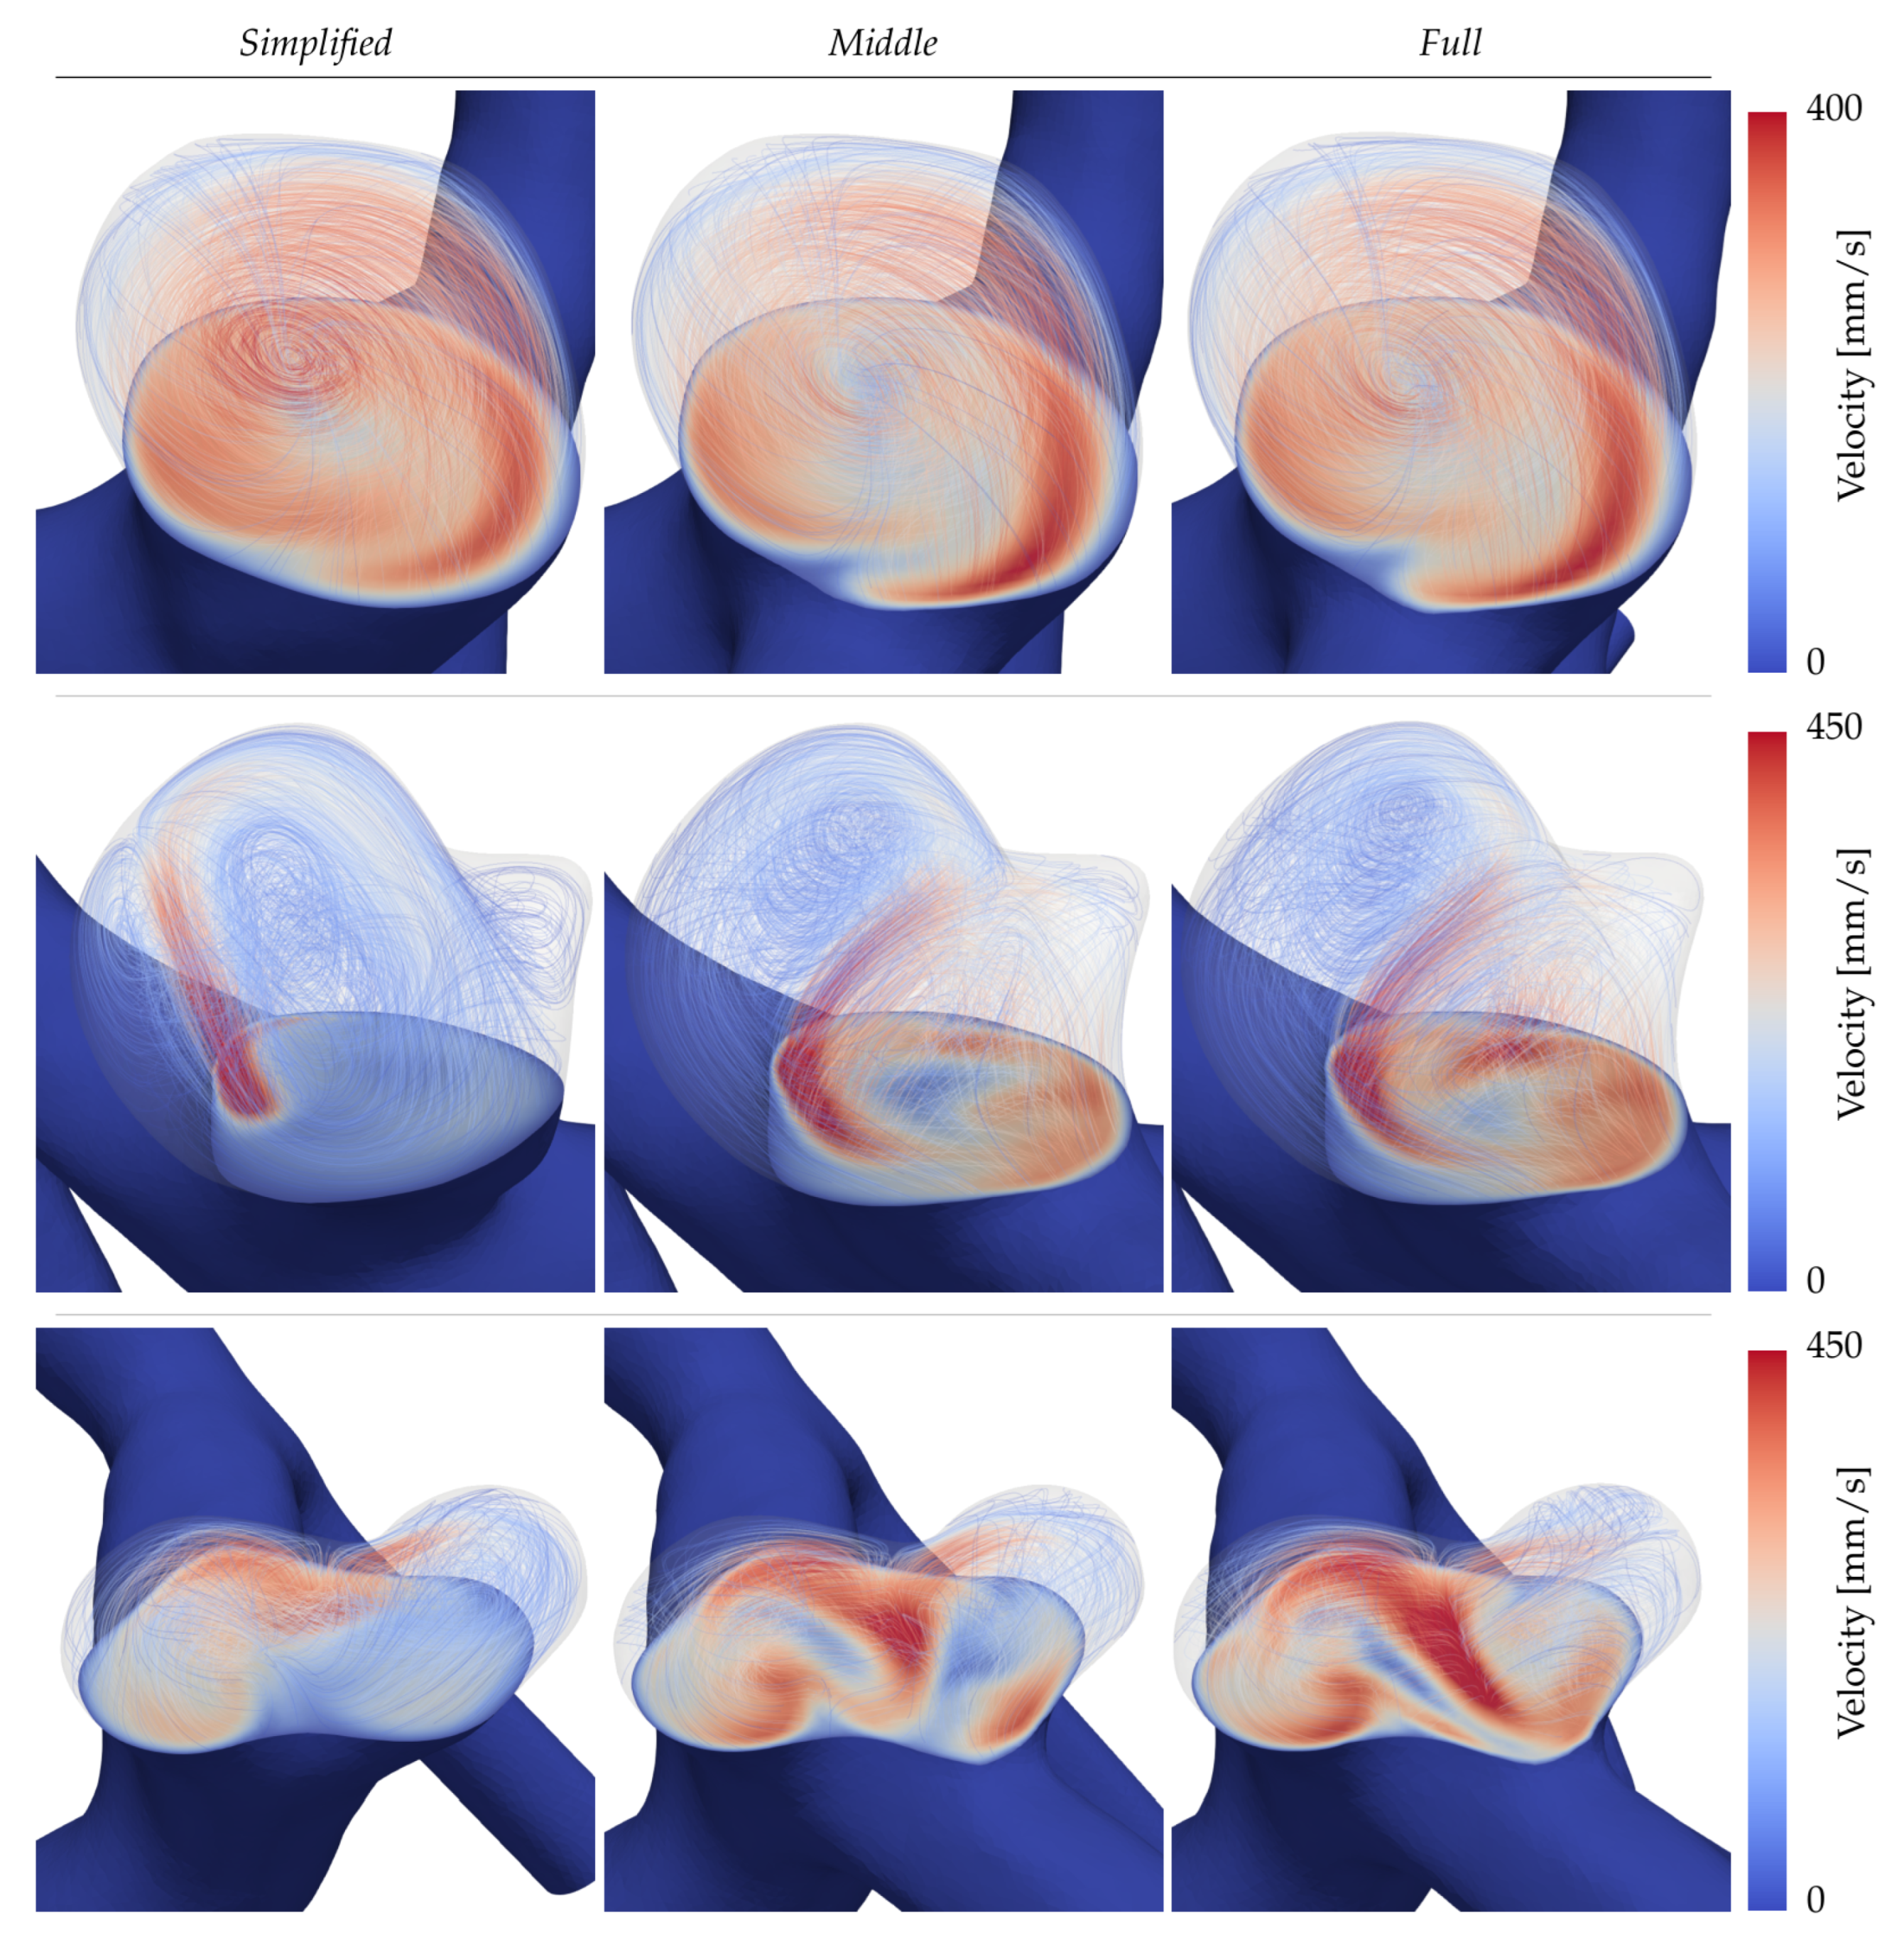
3.2. Intra-Aneurysmal Dynamics
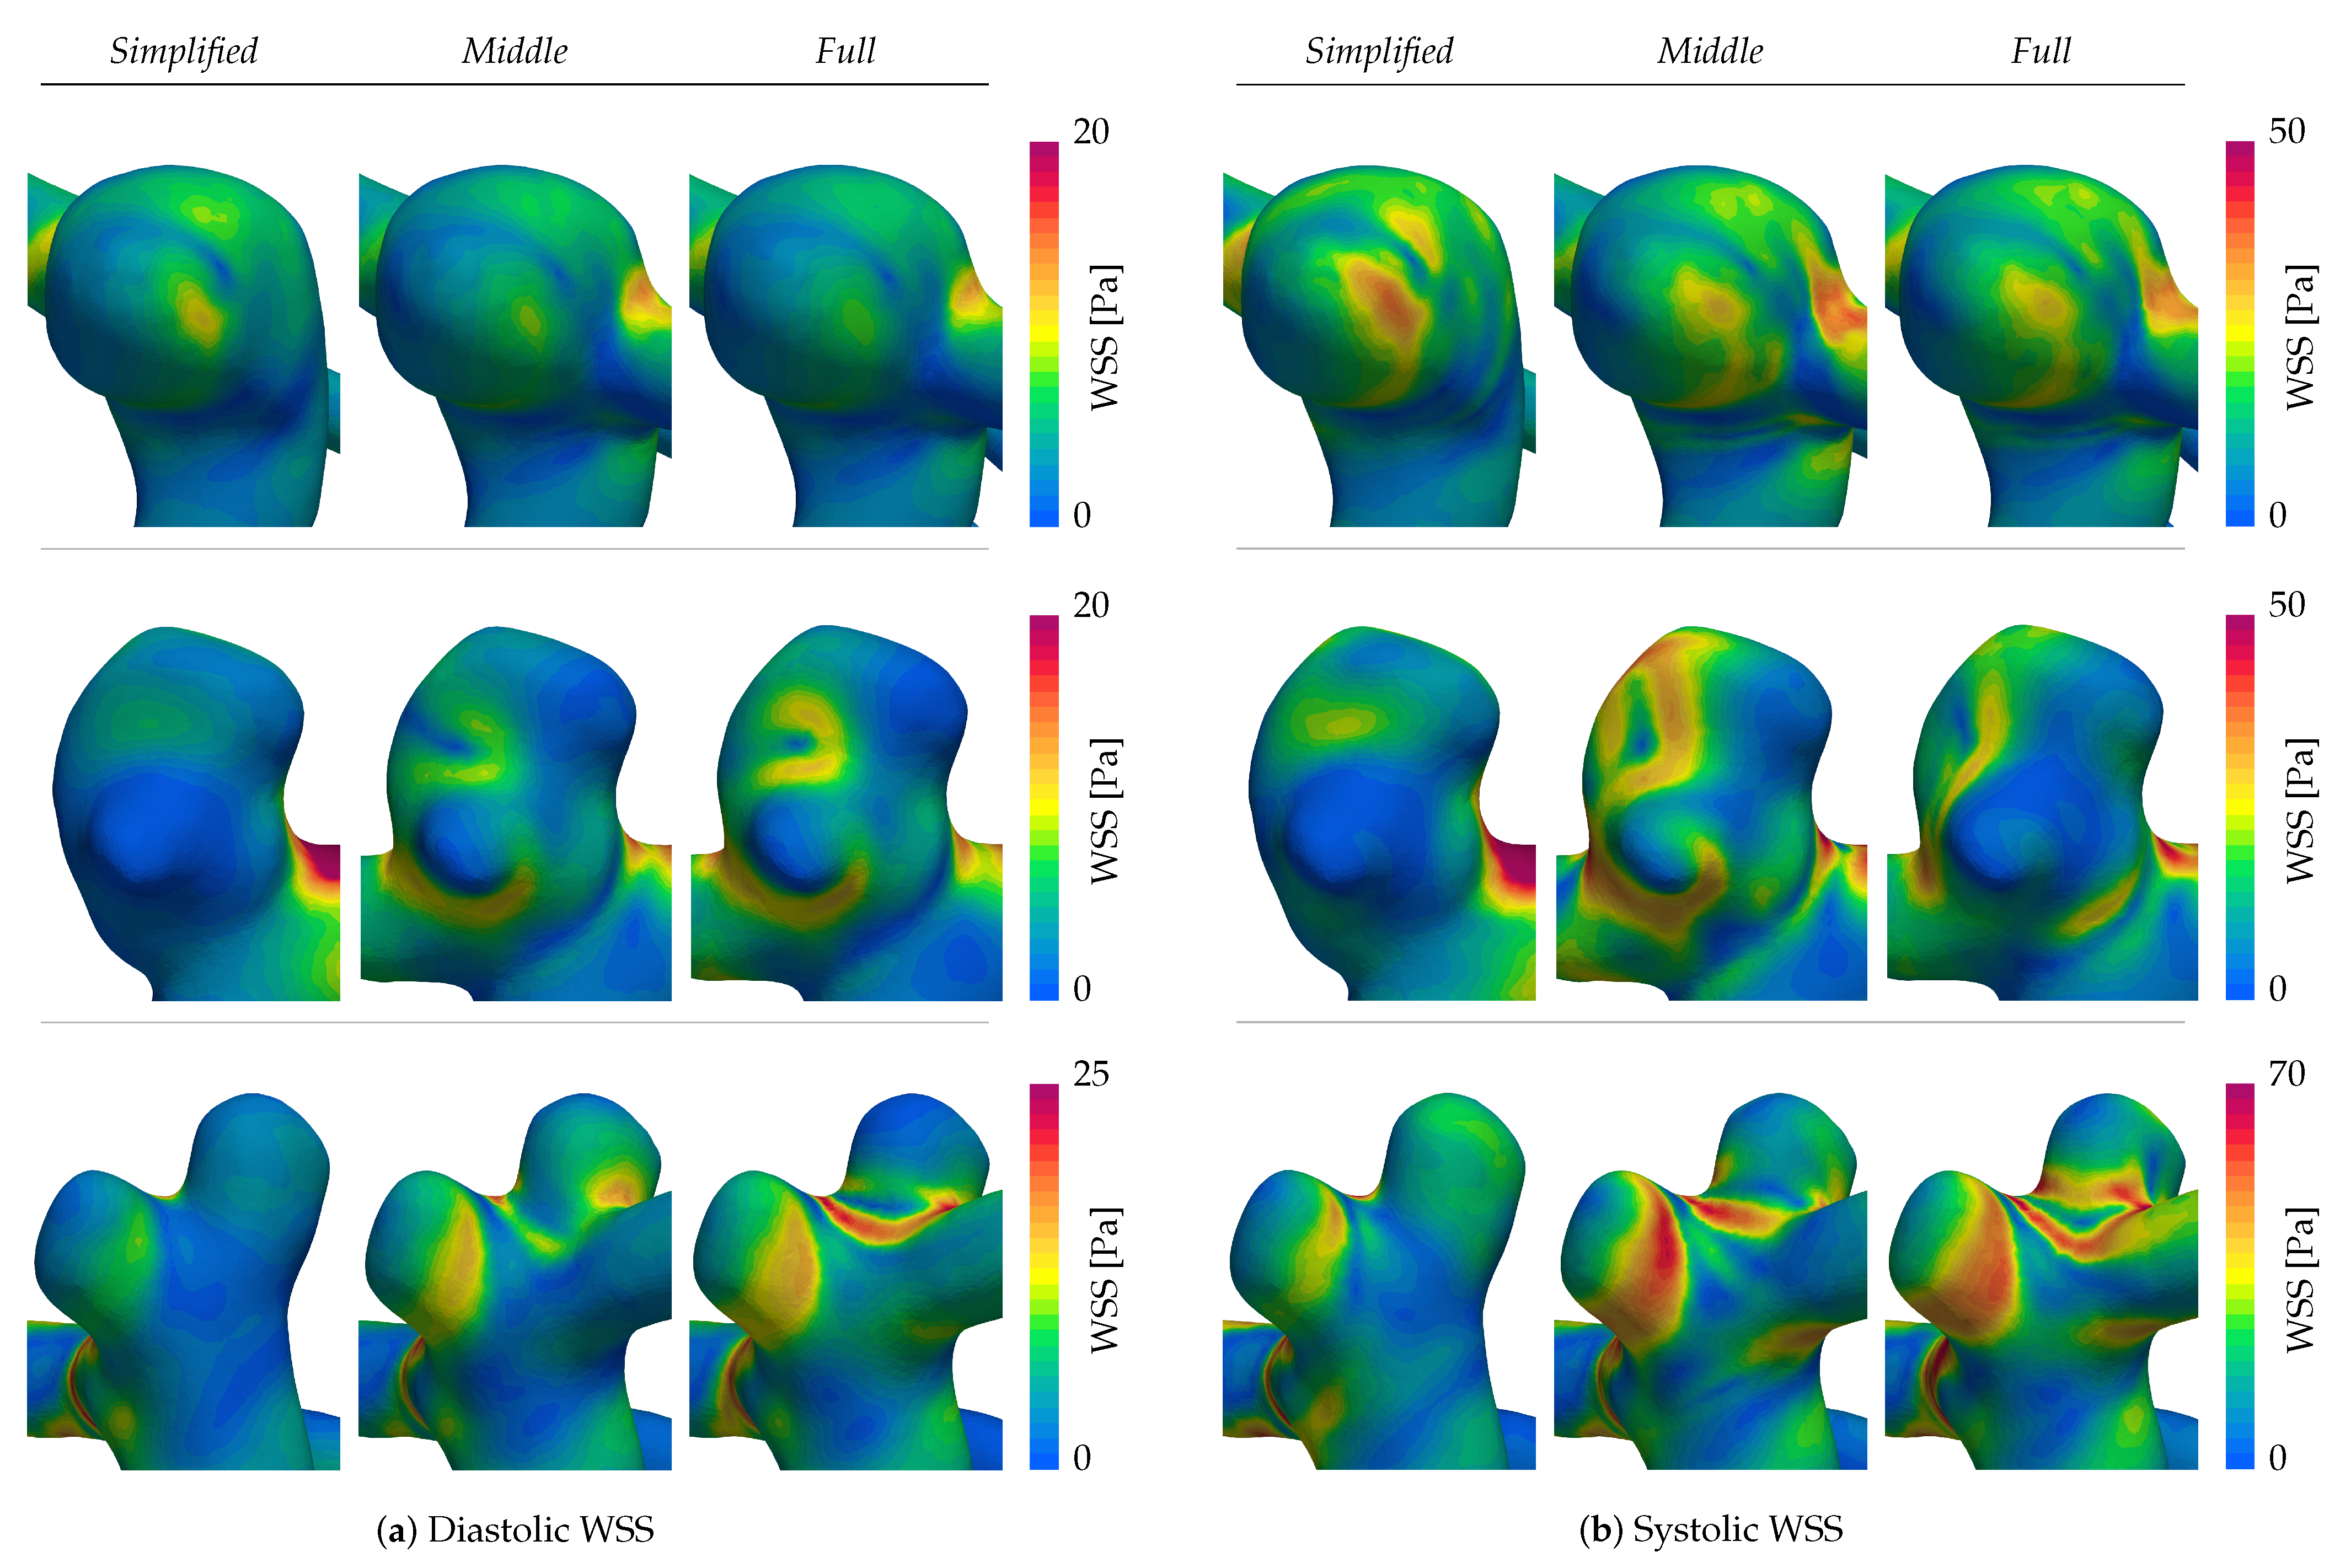
3.3. Wall Shear Stress
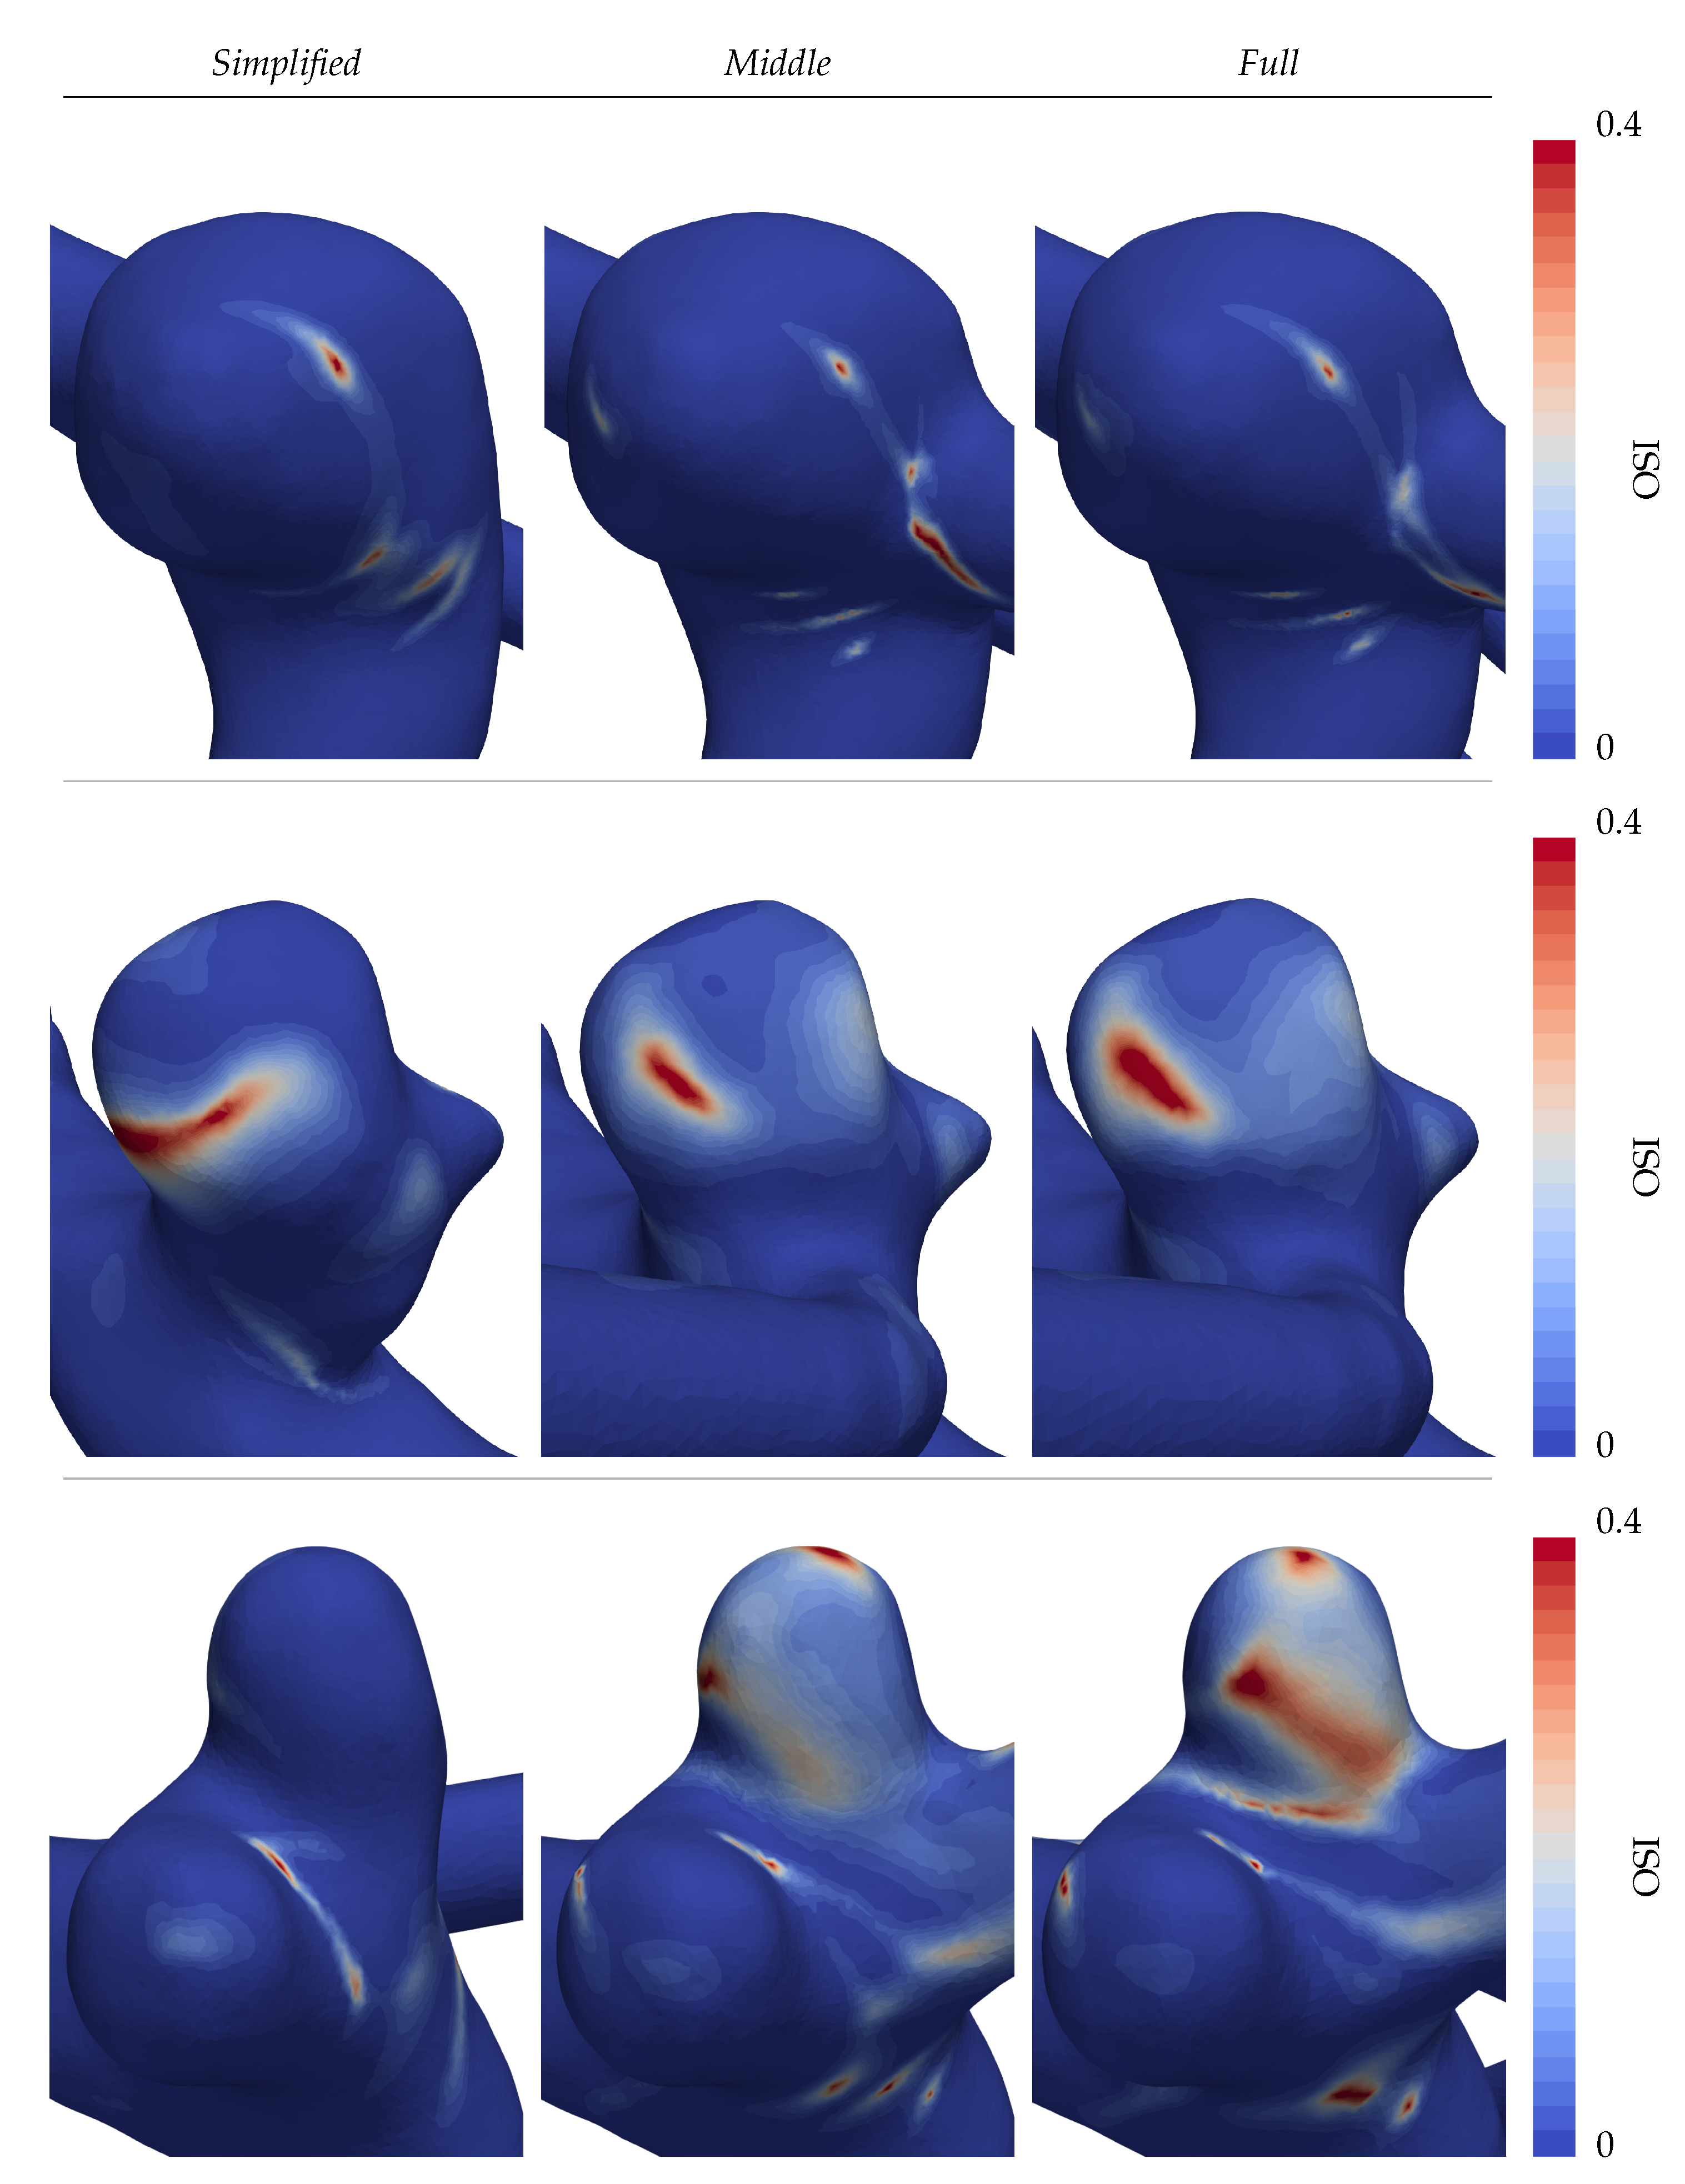
3.4. Oscillatory Shearing
4. Discussion
5. Conclusions
Author Contributions
Funding
Informed Consent Statement
Data Availability Statement
Conflicts of Interest
Abbreviations
| IA | Intracranial Aneurysm |
| CFD | Computational Fluid Dynamics |
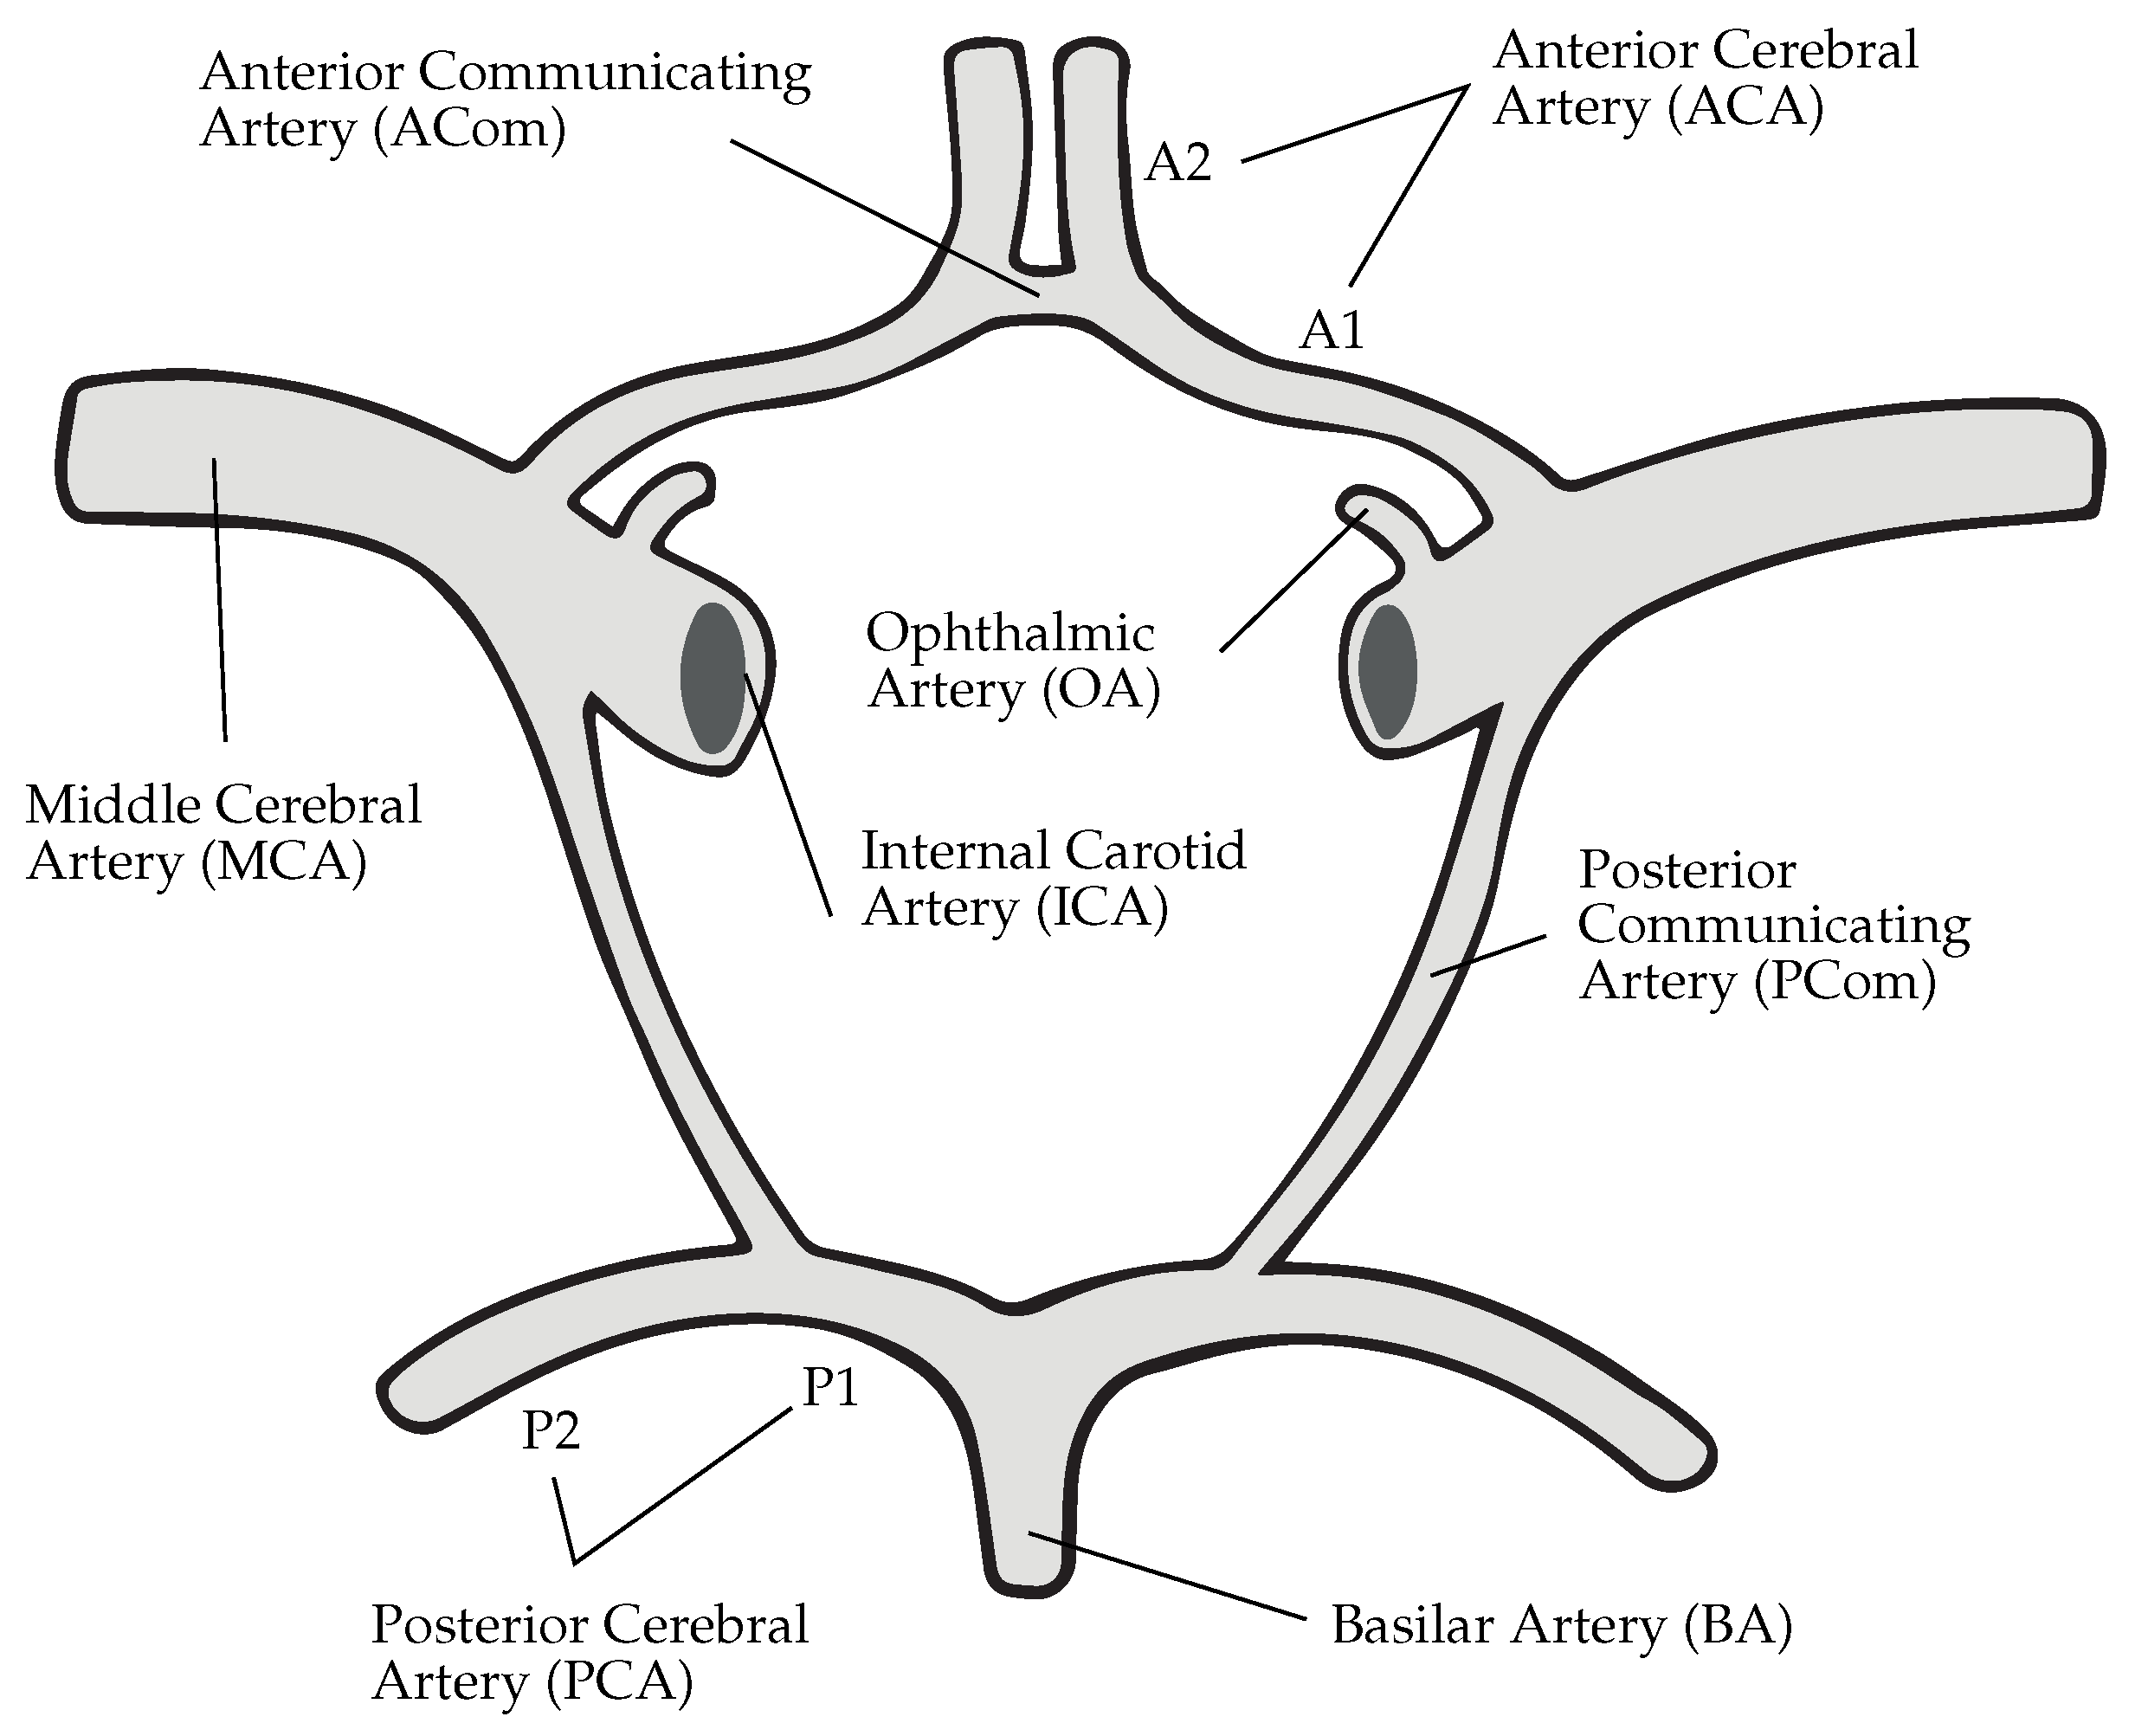
| CoW | Circle of Willis |
| WSS | Wall Shear Stress |
| OSI | Oscillatory Shear Index |
| ICA | Internal Carotid Artery |
| MCA | Middle Cerebral Artery |
| PCA | Posterior Cerebral Artery |
| ACA | Anterior Cerebral Artery |
| ACom | Anterior Communicating Artery |
| PCom | Posterior Communicating Artery |
References
- Wójtowicz, K.; Przepiorka, L.; Kujawski, S.; Marchel, A.; Kunert, P. Unruptured Anterior Communicating Artery Aneurysms: Management Strategy and Results of a Single-Center Experience. J. Clin. Med. 2023, 12, 4619. [Google Scholar] [CrossRef] [PubMed]
- Juvela, S. Outcome of Patients with Multiple Intracranial Aneurysms after Subarachnoid Hemorrhage and Future Risk of Rupture of Unruptured Aneurysm. J. Clin. Med. 2021, 10, 1712. [Google Scholar] [CrossRef] [PubMed]
- Pagiola, I.; Mihalea, C.; Caroff, J.; Ikka, L.; Chalumeau, V.; Iacobucci, M.; Ozanne, A.; Gallas, S.; Marques, M.; Nalli, D.; et al. The PHASES score: To treat or not to treat? Retrospective evaluation of the risk of rupture of intracranial aneurysms in patients with aneurysmal subarachnoid hemorrhage. J. Neuroradiol. 2020, 47, 349–352. [Google Scholar] [CrossRef]
- Cebral, J.R.; Mut, F.; Raschi, M.; Scrivano, E.; Ceratto, R.; Lylyk, P.; Putman, C.M. Aneurysm rupture following treatment with flow-diverting stents: Computational hemodynamics analysis of treatment. Am. J. Neuroradiol. 2011, 32, 27–33. [Google Scholar] [CrossRef] [PubMed]
- Janiga, G.; Berg, P.; Sugiyama, S.; Kono, K.; Steinman, D.A. The computational fluid dynamics rupture challenge 2013—Phase I: Prediction of rupture status in intracranial aneurysms. Am. J. Neuroradiol. 2015, 36, 530–536. [Google Scholar] [CrossRef] [PubMed]
- Berg, P.; Roloff, C.; Beuing, O.; Voß, S.; Sugiyama, S.; Aristokleous, N.; Anayiotos, A.S.; Ashton, N.; Revell, A.; Bressloff, N.W.; et al. The Computational Fluid Dynamics Rupture Challenge 2013—Phase II: Variability of Hemodynamic Simulations in Two Intracranial Aneurysms. J. Biomech. Eng. 2015, 137, 121008. [Google Scholar] [CrossRef] [PubMed]
- Valen-Sendstad, K.; Bergersen, A.W.; Shimogonya, Y.; Goubergrits, L.; Bruening, J.; Pallares, J.; Cito, S.; Piskin, S.; Pekkan, K.; Geers, A.J.; et al. Real-World Variability in the Prediction of Intracranial Aneurysm Wall Shear Stress: The 2015 International Aneurysm CFD Challenge. Cardiovasc. Eng. Technol. 2018, 9, 544–564. [Google Scholar] [CrossRef]
- Berg, P.; Voß, S.; Saalfeld, S.; Janiga, G.; Bergersen, A.; Valen-Sendstad, K.; Bruening, J.; Goubergrits, L.; Spuler, A.; Cancelliere, N.; et al. Multiple Aneurysms AnaTomy CHallenge 2018 (MATCH): Phase I: Segmentation. Cardiovasc. Eng. Technol. 2018, 9, 565–581. [Google Scholar] [CrossRef]
- Voß, S.; Beuing, O.; Janiga, G.; Berg, P. Multiple Aneurysms AnaTomy CHallenge 2018 (MATCH)-Phase Ib: Effect of morphology on hemodynamics. PLoS ONE 2019, 14, e0216813. [Google Scholar] [CrossRef]
- Berg, P.; Voß, S.; Janiga, G.; Saalfeld, S.; Bergersen, A.W.; Valen-Sendstad, K.; Bruening, J.; Goubergrits, L.; Spuler, A.; Chiu, T.L.; et al. Multiple Aneurysms AnaTomy CHallenge 2018 (MATCH)—phase II: Rupture risk assessment. Int. J. Comput. Assist. Radiol. Surg. 2019, 14, 1795–1804. [Google Scholar] [CrossRef]
- Berg, P.; Saalfeld, S.; Voß, S.; Beuing, O.; Janiga, G. A review on the reliability of hemodynamic modeling in intracranial aneurysms: Why computational fluid dynamics alone cannot solve the equation. Neurosurg. Focus 2019, 47, E15. [Google Scholar] [CrossRef] [PubMed]
- Marsden, A.L.; Feinstein, J.A.; Taylor, C.A. A computational framework for derivative-free optimization of cardiovascular geometries. Comput. Methods Appl. Mech. Eng. 2008, 197, 1890–1905. [Google Scholar] [CrossRef]
- Helthuis, J.H.; van Doormaal, T.P.; Hillen, B.; Bleys, R.L.; Harteveld, A.A.; Hendrikse, J.; van der Toorn, A.; Brozici, M.; Zwanenburg, J.J.; van der Zwan, A. Branching Pattern of the Cerebral Arterial Tree. Anat. Rec. 2019, 302, 1434–1446. [Google Scholar] [CrossRef] [PubMed]
- Chnafa, C.; Valen-Sendstad, K.; Brina, O.; Pereira, V.M.; Steinman, D.A. Improved reduced-order modelling of cerebrovascular flow distribution by accounting for arterial bifurcation pressure drops. J. Biomech. 2017, 51, 83–88. [Google Scholar] [CrossRef] [PubMed]
- Saalfeld, S.; Voß, S.; Beuing, O.; Preim, B.; Berg, P. Flow-splitting-based computation of outlet boundary conditions for improved cerebrovascular simulation in multiple intracranial aneurysms. Int. J. Comput. Assist. Radiol. Surg. 2019, 14, 1805–1813. [Google Scholar] [CrossRef] [PubMed]
- Rosner, J.; Reddy, V.; Lui, F. Neuroanatomy, Circle of Willis, 1st ed.; StatPearls Publishing: St. Petersburg, FL, USA, 2022. [Google Scholar]
- Devault, K.; Gremaud, P.A.; Novak, V.; Olufsen, M.S.; Vernières, G.; Peng, Z. Blood Flow in the Circle of Willis: Modelling and Calibration. Multiscale Model. Simul. 2008, 7, 888–909. [Google Scholar] [CrossRef] [PubMed]
- Malm, J.; Birnefeld, J.; Zarrinkoob, L.; Wåhlin, A.; Eklund, A. Hemodynamic Disturbances in Posterior Circulation Stroke: 4D Flow Magnetic Resonance Imaging Added to Computed Tomography Angiography. Front. Neurosci. 2021, 15, 656769. [Google Scholar] [CrossRef]
- Hindenes, L.B.; Håberg, A.K.; Johnsen, L.H.; Mathiesen, E.B.; Robben, D.; Vangberg, T.R. Variations in the circle of willis in a large population sample using 3D TOF angiography: The tromsø study. PLoS ONE 2020, 15, e0241373. [Google Scholar] [CrossRef]
- Chnafa, C.; Brina, O.; Pereira, V.M.; Steinman, D.A. Better Than Nothing: A Rational Approach for Minimizing the Impact of Outflow Strategy on Cerebrovascular Simulations. Am. J. Neuroradiol. 2018, 39, 337–343. [Google Scholar] [CrossRef]
- Castro, M.; Putman, C.; Cebral, J. Computational Fluid Dynamics Modeling of Intracranial Aneurysms: Effects of Parent Artery Segmentation on Intra-Aneurysmal Hemodynamics. Am. J. Neuroradiol. 2006, 27, 1703–1709. [Google Scholar]
- Dennis, K.D.; Kallmes, D.F.; Dragomir-Daescu, D. Cerebral aneurysm blood flow simulations are sensitive to basic solver settings. J. Biomech. 2017, 57, 46–53. [Google Scholar] [CrossRef] [PubMed]
- Britz, G.; Golshani, K.; Ferrell, A.; Zomorodi, A.; Smith, T. A review of the management of posterior communicating artery aneurysms in the modern era. Surg. Neurol. Int. 2010, 1, 88. [Google Scholar] [CrossRef] [PubMed]
- Geuzaine, C.; Remacle, J.F. Gmsh: A 3-D Finite Element Mesh Generator with built-in Pre- and Post-Processing Facilities. Int. J. Numer. Methods Eng. 2009, 79, 1309–1331. [Google Scholar] [CrossRef]
- Hachem, E.; Rivaux, B.; Kloczko, T.; Digonnet, H.; Coupez, T. Stabilized finite element method for incompressible flows with high Reynolds number. J. Comput. Phys. 2010, 229, 8643–8665. [Google Scholar] [CrossRef]
- Coupez, T.; Hachem, E. Solution of high-Reynolds incompressible flow with stabilized finite element and adaptive anisotropic meshing. Comput. Methods Appl. Mech. Eng. 2013, 267, 65–85. [Google Scholar] [CrossRef]
- Meliga, P.; Hachem, E. Time-accurate calculation and bifurcation analysis of the incompressible flow over a square cavity using variational multiscale modeling. J. Comput. Phys. 2019, 376, 952–972. [Google Scholar] [CrossRef]
- Valen-Sendstad, K.; Steinman, D.A. Mind the gap: Impact of computational fluid dynamics solution strategy on prediction of intracranial aneurysm hemodynamics and rupture status indicators. Am. J. Neuroradiol. 2014, 35, 536–543. [Google Scholar] [CrossRef] [PubMed]
- Goetz, A.; Rico, P.J.; Chau, Y.; Sédat, J.; Larcher, A.; Hachem, E. Proposal for Numerical Benchmarking of Fluid-Structure Interaction in Cerebral Aneurysms. arXiv 2023, arXiv:2308.08301. [Google Scholar]
- Hodis, S.; Uthamaraj, S.; Smith, A.L.; Dennis, K.D.; Kallmes, D.F.; Dragomir-Daescu, D. Grid convergence errors in hemodynamic solution of patient-specific cerebral aneurysms. J. Biomech. 2012, 45, 2907–2913. [Google Scholar] [CrossRef]
- Abraham, F.; Behr, M.; Heinkenschloss, M. Shape optimization in unsteady blood flow: A numerical study of non-Newtonian effects. Comput. Methods Biomech. Biomed. Eng. 2005, 8, 201–212. [Google Scholar] [CrossRef]
- Xiang, J.; Tremmel, M.; Kolega, J.; Levy, E.I.; Natarajan, S.K.; Meng, H. Newtonian viscosity model could overestimate wall shear stress in intracranial aneurysm domes and underestimate rupture risk. J. Neurointerv. Surg. 2012, 4, 351–357. [Google Scholar] [CrossRef] [PubMed]
- Gambaruto, A.M.; Janela, J.; Moura, A.; Sequeira, A. Sensitivity of hemodynamics in a patient specific cerebral aneurysm to vascular geometry and blood rheology. Math. Biosci. Eng. 2011, 8, 409–423. [Google Scholar] [PubMed]
- Tanaka, H.; Fujita, N.; Enoki, T.; Matsumoto, K.; Watanabe, Y.; Murase, K.; Nakamura, H. Relationship between Variations in the Circle of Willis and Flow Rates in Internal Carotid and Basilar Arteries Determined by Means of Magnetic Resonance Imaging with Semiautomated Lumen Segmentation: Reference Data from 125 Healthy Volunteers. AJNR Am. J. Neuroradiol. 2006, 27, 1770–1775. [Google Scholar] [PubMed]
- Vignon-Clementel, I.E.; Alberto Figueroa, C.; Jansen, K.E.; Taylor, C.A. Outflow boundary conditions for three-dimensional finite element modeling of blood flow and pressure in arteries. Comput. Methods Appl. Mech. Eng. 2006, 195, 3776–3796. [Google Scholar] [CrossRef]
- Janiga, G.; Berg, P.; Beuing, O.; Neugebauer, M.; Gasteiger, R.; Preim, B.; Rose, G.; Skalej, M.; Thevenin, D. Recommendations for accurate numerical blood flow simulations of stented intracranial aneurysms. Biomed. Tech. 2013, 58, 303–314. [Google Scholar] [CrossRef]
- Boussel, L.; Rayz, V.L.; McCulloch, C.; Martin, A.; Acevedo-Bolton, G.; Lawton, M.; Higashida, R.; Smith, W.S.; Young, W.L.; Saloner, D. Aneurysm growth occurs at region of low wall shear stress: Patient-specific correlation of hemodynamics and growth in a longitudinal study. Stroke 2008, 39, 2997–3002. [Google Scholar] [CrossRef]
- Urschel, K.; Tauchi, M.; Achenbach, S.; Dietel, B. Investigation of wall shear stress in cardiovascular research and in clinical practice—From bench to bedside. Int. J. Mol. Sci. 2021, 22, 5635. [Google Scholar] [CrossRef]
- Cebral, J.; Detmer, F.; Chung, B.; Choque-Velasquez, J.; Rezai Jahromi, B.; Lehto, H.; Tulamo, R.; Hernesniemi, J.; Niemela, M.; Yu, A.; et al. Local Hemodynamic Conditions Associated with Focal Changes in the Intracranial Aneurysm Wall. AJNR Am. J. Neuroradiol. 2019, 40, 510–516. [Google Scholar]
- Meng, H.; Tutino, V.M.; Xiang, J.; Siddiqui, A. High WSS or Low WSS? Complex interactions of hemodynamics with intracranial aneurysm initiation, growth, and rupture: Toward a unifying hypothesis. Am. J. Neuroradiol. 2014, 35, 1254–1262. [Google Scholar] [CrossRef]
- Malek, A. Hemodynamic Shear Stress and Its Role in Atherosclerosis. JAMA 1999, 282, 2035. [Google Scholar] [CrossRef]
- Furukawa, K.; Ishida, F.; Tsuji, M.; Miura, Y.; Kishimoto, T.; Shiba, M.; Tanemura, H.; Umeda, Y.; Sano, T.; Yasuda, R.; et al. Hemodynamic characteristics of hyperplastic remodeling lesions in cerebral aneurysms. PLoS ONE 2018, 13, e0191287. [Google Scholar] [CrossRef] [PubMed]
- Mazzi, V.; Gallo, D.; Calò, K.; Najafi, M.; Khan, M.O.; De Nisco, G.; Steinman, D.A.; Morbiducci, U. A Eulerian method to analyze wall shear stress fixed points and manifolds in cardiovascular flows. Biomech. Model. Mechanobiol. 2020, 19, 1403–1423. [Google Scholar] [CrossRef] [PubMed]
- Sheikh, M.A.A.; Shuib, A.S.; Mohyi, M.H.H. A review of hemodynamic parameters in cerebral aneurysm. Interdiscip. Neurosurg. Adv. Tech. Case Manag. 2020, 22, 100716. [Google Scholar] [CrossRef]
- Jongen, J.C.; Franke, C.L.; Ramos, L.M.; Wilmink, J.T.; Van Gijn, J. Direction of Flow in Posterior Communicating Artery on Magnetic Resonance Angiography in Patients with Occipital Lobe Infarcts. Stroke 2004, 35, 104–108. [Google Scholar] [CrossRef] [PubMed]
- Zarrinkoob, L.; Ambarki, K.; Wåhlin, A.; Birgander, R.; Eklund, A.; Malm, J. Blood flow distribution in cerebral arteries. J. Cereb. Blood Flow Metab. 2015, 35, 648–654. [Google Scholar] [CrossRef]
- Mynard, J.P.; Valen-Sendstad, K. A unified method for estimating pressure losses at vascular. Int. J. Numer. Methods Biomed. Eng. 2015, 31. [Google Scholar] [CrossRef]
- Hacein-Bey, L.; Provenzale, J.M. Current Imaging Assessment and Treatment of Intracranial Aneurysms. Am. J. Roentgenol. 2011, 196, 32–44. [Google Scholar] [CrossRef]
- Chen, J.; Li, M.; Zhu, X.; Chen, Y.; Zhang, C.; Shi, W.; Chen, Q.; Wang, Y. Anterior Communicating Artery Aneurysms: Anatomical Considerations and Microsurgical Strategies. Front. Neurol. 2020, 11, 1020. [Google Scholar] [CrossRef]
- Zhang, H.; Fujiwara, N.; Kobayashi, M.; Yamada, S.; Liang, F.; Takagi, S.; Oshima, M. Development of a Numerical Method for Patient-Specific Cerebral Circulation Using 1D–0D Simulation of the Entire Cardiovascular System with SPECT Data. Ann. Biomed. Eng. 2016, 44, 2351–2363. [Google Scholar] [CrossRef]
- Hindenes, L.B.; Ingebrigtsen, T.; Isaksen, J.G.; Håberg, A.K.; Johnsen, L.H.; Herder, M.; Mathiesen, E.B.; Vangberg, T.R. Anatomical variations in the circle of Willis are associated with increased odds of intracranial aneurysms: The Tromsø study. J. Neurol. Sci. 2023, 452, 120740. [Google Scholar] [CrossRef]
- Feng, L.; Mao, H.J.; Zhang, D.D.; Zhu, Y.C.; Han, F. Anatomical variations in the Circle of Willis and the formation and rupture of intracranial aneurysms: A systematic review and meta-analysis. Front. Neurol. 2023, 13, 1098950. [Google Scholar] [CrossRef] [PubMed]


| Patient | Simplified | Middle | Full | |
|---|---|---|---|---|
| A | 3.4 | 3.8 | 7.1 | |
| 9:20 h | 10:12 h | 22:10 h | ||
| B | 2.0 | 2.1 | 3.6 | |
| 4:41 h | 5:19 h | 8:23 h | ||
| C | 1.6 | 1.7 | 4.7 | |
| 5:07 h | 5:46 h | 8:30 h | ||
| Case | Complexity | MCA | PCA | ACA | OA | ||||
|---|---|---|---|---|---|---|---|---|---|
| Left | Right | Left | Right | Left | Right | Left | Right | ||
| A | Full | 28.8% | 25.7% | 14.0% | 7.7% | 7.2% | 9.3% | 3.1% | 4.2% |
| Middle | 21.8% | - | 10.6% | - | 9.2% | - | 2.4% | - | |
| Simplified | 28.8% | - | - | - | 12.1% | - | 3.1% | - | |
| B | Full | 29.3% | 21.6% | 4.9% | 9.6% | 4.3% | 7.0% | - | 3.1% |
| Middle | - | 20.9% | - | 9.3% | - | 6.8% | - | 3.1% | |
| Simplified | - | 27.2% | - | - | - | 8.8% | - | 4.0% | |
| C | Full | 27.1% | 35.9% | 12.0% | 12.4% | 4.0% | 8.5% | - | - |
| Middle | 22.1% | - | 7.5% | - | 10.3% | - | - | - | |
| Simplified | 27.3% | - | - | - | 12.7% | - | - | - | |
Disclaimer/Publisher’s Note: The statements, opinions and data contained in all publications are solely those of the individual author(s) and contributor(s) and not of MDPI and/or the editor(s). MDPI and/or the editor(s) disclaim responsibility for any injury to people or property resulting from any ideas, methods, instructions or products referred to in the content. |
© 2023 by the authors. Licensee MDPI, Basel, Switzerland. This article is an open access article distributed under the terms and conditions of the Creative Commons Attribution (CC BY) license (https://creativecommons.org/licenses/by/4.0/).
Share and Cite
Jeken-Rico, P.; Goetz, A.; Meliga, P.; Larcher, A.; Özpeynirci, Y.; Hachem, E. Evaluating the Impact of Domain Boundaries on Hemodynamics in Intracranial Aneurysms within the Circle of Willis. Fluids 2024, 9, 1. https://doi.org/10.3390/fluids9010001
Jeken-Rico P, Goetz A, Meliga P, Larcher A, Özpeynirci Y, Hachem E. Evaluating the Impact of Domain Boundaries on Hemodynamics in Intracranial Aneurysms within the Circle of Willis. Fluids. 2024; 9(1):1. https://doi.org/10.3390/fluids9010001
Chicago/Turabian StyleJeken-Rico, Pablo, Aurèle Goetz, Philippe Meliga, Aurélien Larcher, Yigit Özpeynirci, and Elie Hachem. 2024. "Evaluating the Impact of Domain Boundaries on Hemodynamics in Intracranial Aneurysms within the Circle of Willis" Fluids 9, no. 1: 1. https://doi.org/10.3390/fluids9010001