Article

Highlighting Hemodynamic Risks for Bioresorbable Stents in Coronary Arteries

School of Mechanical and Aerospace Engineering, Queen’s University Belfast, Belfast BT7 1NN, UK
*
Author to whom correspondence should be addressed.
Fluids 2023, 8(9), 241; https://doi.org/10.3390/fluids8090241
Submission received: 6 July 2023 / Revised: 21 August 2023 / Accepted: 22 August 2023 / Published: 25 August 2023
(This article belongs to the Special Issue Biological Fluid Dynamics)

Abstract

:
A three-dimensional, transient computational fluid dynamics analysis was conducted on an idealised geometry of a coronary artery fitted with representative geometries of an Absorb bioresorbable vascular scaffold (BVS) or a Xience drug-eluting stent (DES) in order to identify and compare areas of disturbed flow and potential risk sites. A non-Newtonian viscosity model was used with a transient velocity boundary condition programmed with user-defined functions. At-risk areas were quantified in terms of several parameters linked to restenosis: wall shear stress, time-averaged wall shear stress, oscillatory shear index, particle residence time, and shear rate. Results indicated that 71% of the BVS stented surface area had time-averaged wall shear stress values under 0.4 Pa compared to 45% of the DES area. Additionally, high particle residence times were present in 23% and 8% of the BVS and DES areas, respectively, with risk areas identified as being more prominent in close proximity to crowns and link struts. These results suggest an increased risk for thrombosis and neointimal hyperplasia for the BVS compared to the DES, which is in agreement with the outcomes of clinical trials. It is intended that the results of this study may be used as a pre-clinical tool to aid in the design of bioresorbable coronary stents.

1. Introduction

Atherosclerosis, the main cause of coronary artery disease [1], is most commonly treated by percutaneous coronary intervention (PCI), with approximately 100,000 being performed in 2019/20 alone in the UK [2], the majority of which involve the implantation of a stent to restore luminal diameter. However, the implantation of stents can come with complications such as acute/late thrombosis or neointimal hyperplasia. While modern drug-eluting stents (DES) have reduced acute stent thrombosis rates when compared to bare metal stents [3], there remains the issue of late and very late stent thrombosis, concerning thrombus formation over a longer period [4]. More recently, bioresorbable vascular scaffolds (BVS) were developed [5], theoretically eliminating these instances of late restenosis as the scaffold is dissolved and excreted after an intended period of time [6] as it provides no benefits after six months [7]. Although BVS also delivers an anti-proliferative drug, the term DES has traditionally been used to refer to a metal stent with a drug-eluting coating.
The first BVS to receive a Conformité Européenne (CE) mark (in 2015) and US Food and Drug Administration (FDA) approval (in 2016) for the treatment of coronary artery disease was the Absorb (Abbot Vascular, Santa Clara, CA, USA) and it is consequently the focus of the largest number of clinical trials [8]. These trials focused on the comparison in performance to equivalent cobalt chromium Xience DES (Abbot Vascular, Santa Clara, CA, USA), with results showing that the occurrence of target lesion failure (TLF) after three years was 3.6 percentage points higher for the Absorb BVS [9]. Given the limited information available on the performance of BVS after three years, Capodanno et al. [10] designed a decision-analytic Markov model to predict clinical outcomes of BVS compared to DES, which showed an incremental benefit in quality-adjusted life expectancy of BVS over DES after 19 years. They concluded BVS may still provide a benefit to patients, but that device refinements that translate into better thrombosis rates at three years are crucial.
Bangalore et al. [11] emphasise that the clinical need for BVS technology remains. They suggest that the poor outcomes of the Absorb BVS could be due to its design (strut geometry and/or mechanical properties), patient selection, implantation technique, or a combination of factors. Taking encouragement from the development of the DES after concerns about the safety of early generation versions, they advocate a blended approach for the BVS, involving refining its design and optimising the procedure by making use of intravascular imaging and avoiding vessels that are too small or too large, for example. Serruys et al. [12] advise that the introduction of new technology in this field is a long journey over at least one decade. They are optimistic that BVS can be enhanced through thin struts and new technologies and materials.
One focus of research concerns the polymer microstructure of the BVS. Unlike metal stents, BVS possess significant localised structural irregularities arising from crimping and expansion during implantation that cause asymmetric degradation; it is suggested that these features have clinical implications [13,14]. Stent dimensions must be a key area for investigation since they were dominant factors for the adverse effects of DES [15]. Lafont and Mennuni [16], in commenting on Capodanno et al. [10], list various aspects of the BVS design that should be adjusted to prevent early, late, and very late thrombosis. To reduce early thrombosis, they refer to optimising the strut geometry amongst other issues.
It is established in the literature that local hemodynamics, such as low oscillating wall shear stresses (WSS) [17,18,19,20,21], high particle residence times [22], and high shear rates [23,24], correlate with increased restenosis via neointimal hyperplasia and/or thrombosis. Stent strut thickness was shown to be the geometric factor that largely dictates areas of low WSS. Thus, it has been suggested that the additional strut thickness of the Absorb BVS is the cause of these unfavourable clinical outcomes [9,25]. However, there is a lack of three-dimensional transient analyses that quantify the at-risk areas of a BVS geometry relative to industry-standard DES in coronary arteries. Given that the Absorb BVS was taken off the market in 2017, and with design refinements to improve early outcomes being key [10], an investigation of how strut thickness and strut width affect hemodynamic flow in this new generation of BVS is particularly essential. The aim of this study is to use computational fluid dynamics (CFD) to quantify relative risks between the BVS and DES designs with respect to various hemodynamic metrics as a tool to assess design effectiveness. The study does not consider the resorption of the BVS, which occurs relatively slowly over about two years. Rather, it is concerned with the short-term response of the artery to the introduction of the stent as early risk factors, while the stent is exposed, have been theorised as leading causes for cases of thrombosis long after the endothelium has covered the stent, especially in small vessels [9].

2. Methods

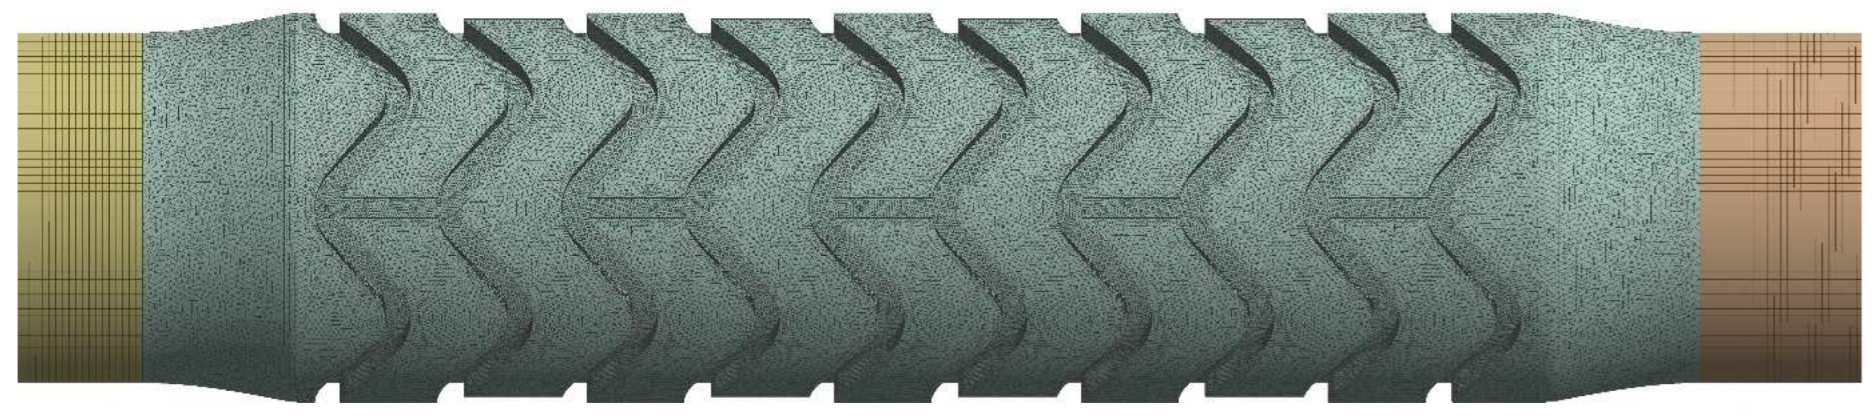
2.1. Fluid Domain Geometry

An idealised straight vessel of luminal diameter 2.7 mm was modelled with an expanded stent of diameter 3 mm and length 8 mm. Dimensions for vessel deformation and length were taken from a virtual stent expansion performed by Chiastra et al. [26] on a straight coronary artery, and the diameter specifications are with reference to the 8 mm Absorb BVS [27]. The geometry of the stent patterns was determined from scaled photographs and reported values in the literature [28] and was modelled in SolidWorks (Dassault Systemes, Vélizy-Villacoublay, France). The Absorb BVS has a strut thickness of 150 µm, while the Xience DES has a strut thickness of 81 µm. The number of struts on the DES and BVS models was the same so the distance between DES struts was slightly greater. The difference in link strut shape in the Xience geometry was neglected as wall shear values in the area between stent struts are influenced primarily by strut thickness [29,30,31,32,33]. Since the pattern in the stent geometry repeats around its circumference, with three link struts per revolution (Figure 1), only one-third of the fluid domain was modelled. By using cyclic symmetry boundary conditions, the computational domain and time required for simulations would therefore be greatly reduced.
The entrance length necessary to allow the velocity profile to develop fully on arrival to the stented region at the peak velocity of 0.27 m/s was calculated using the hydrodynamic entrance length equation for laminar flow [34]:
L h 0.05 Re d
where d is the vessel diameter and Re is the Reynolds number:
Re = ρ v d μ
where ρ is the fluid density, v is the average speed and µ is the dynamic viscosity. Assuming a fluid density of 1050 kg/m3 and a constant dynamic viscosity of 0.00345 Pa s, the Reynolds number was calculated to be 222 and L h was calculated as 30 mm. This additional length was added to the inlet section of the fluid domain.

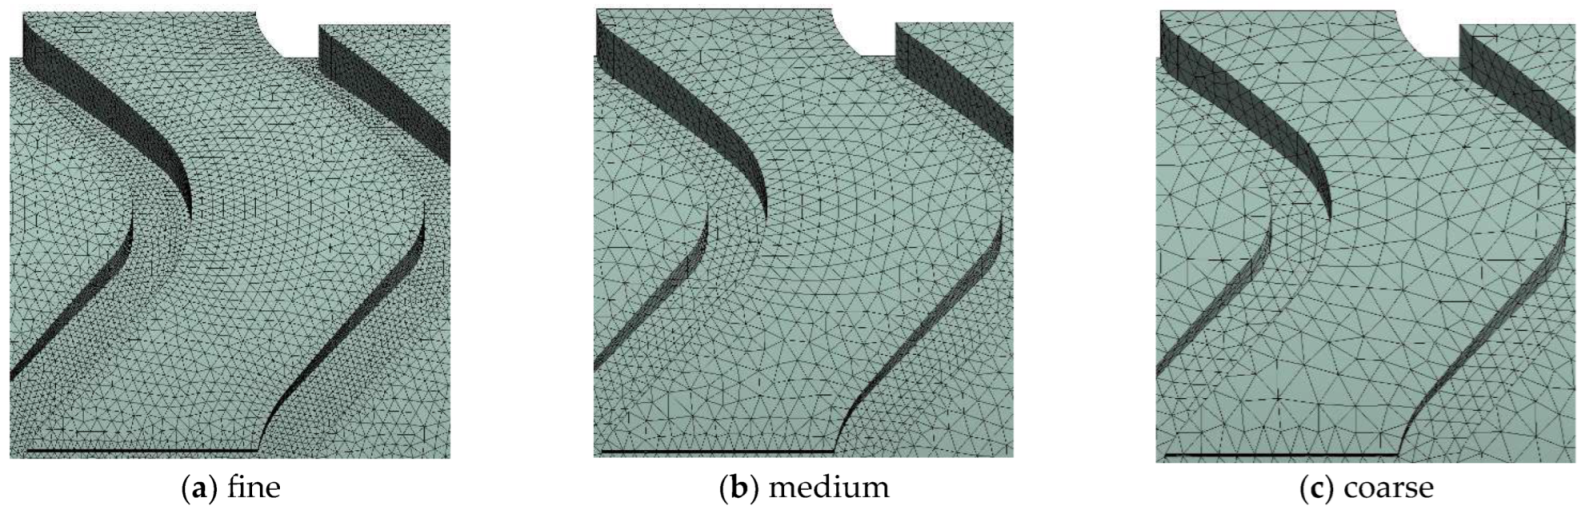
2.2. Mesh Generation

A hybrid tetrahedral/hexahedral meshing approach was used as it was shown that computational effort can be halved compared to a fully tetrahedral mesh [35]. The geometry was partitioned in Ansys DesignModeller and meshed using Ansys Mesh (Ansys Workbench 17.2, Ansys Inc., Canonsburg, PA, USA) in order to generate a uniform hexahedral grid on the inlet, outlet, and internal sections of the fluid domain. For the stented region and areas that are directly in contact with the stent struts, a tetrahedral mesh was used, where elements on the struts were approximately half the size of those in the neighbouring regions (Figure 1 and Figure 2a).

Grid Convergence Analysis

Roache’s grid convergence index (GCI) [36,37] was used to assess grid independence using three progressively finer meshes with a target effective mesh refinement factor [38] (Equation (1)) of 1.5:
r i , i + 1 = N i N i + 1 1 D
where r i , i + 1 is the refinement factor, N i is the number of computational nodes in a finer mesh, N i + 1 is the number of nodes in the mesh to be refined, and D is the dimensionality of the mesh.
The coarse, medium, and fine meshes of the BVS (Figure 2) and DES fluid domains were analysed under identical boundary conditions consisting of a steady state inlet velocity of 0.27 m/s (peak flow) and a zero-pressure outlet, with a convergence criterion for all residuals ≤1 × 10⁻⁶. The area-weighted-average (AWA) WSS was observed to converge in all cases. This quantity was the focus of the mesh independence study due to the importance of WSS, which depends on the velocity gradient at the wall, in assessing the risk of restenosis [17,18,19,20,21]. Table 1 presents mesh sizing parameters and refinement factors.
The results of the grid convergence study are presented in Table 2. The reported GCI values incorporate the recommended safety factor of 1.25 [36] and give an error band for the discretisation error present in a mesh. The observed order of convergence, p, was 1.85 for the BVS and 1.51 for the DES.
If GC I 23 / r p GC I 12 1 , then it can be said that the solutions are within the asymptotic convergence range [38]. This was true for both BVS and DES meshes with values of 1.002 and 0.987, respectively, and hence, grid convergence was achieved with error bands of 0.483% and 1.58% for the BVS and DES fine meshes, respectively.

2.3. Fluid Properties

Blood was modelled as an incompressible fluid of density 1050 kg/m3. Its viscosity was specified by the Carreau viscosity model for pseudoplastics to account for the non-Newtonian (shear thinning) behaviour at shear rates less than 100 s−1 [39]. The Carreau model gives viscosity as a function of shear rate:
μ = μ + μ 0 μ 1 + λ γ ˙ 2 n 1 / 2
where γ ˙ is shear rate, μ is the infinite shear rate viscosity, μ 0 is the zero-shear-rate viscosity, λ is the time constant, n is the power law index, n = 1 indicates Newtonian behaviour, n > 1 indicates shear thickening behaviour, and n < 1 indicates shear thinning behaviour. The constants used were taken from the literature [40] and are defined as μ = 0.00345 Pa s, μ 0 = 0.056 Pa s, λ = 3.313 s, and n = 0.3568.

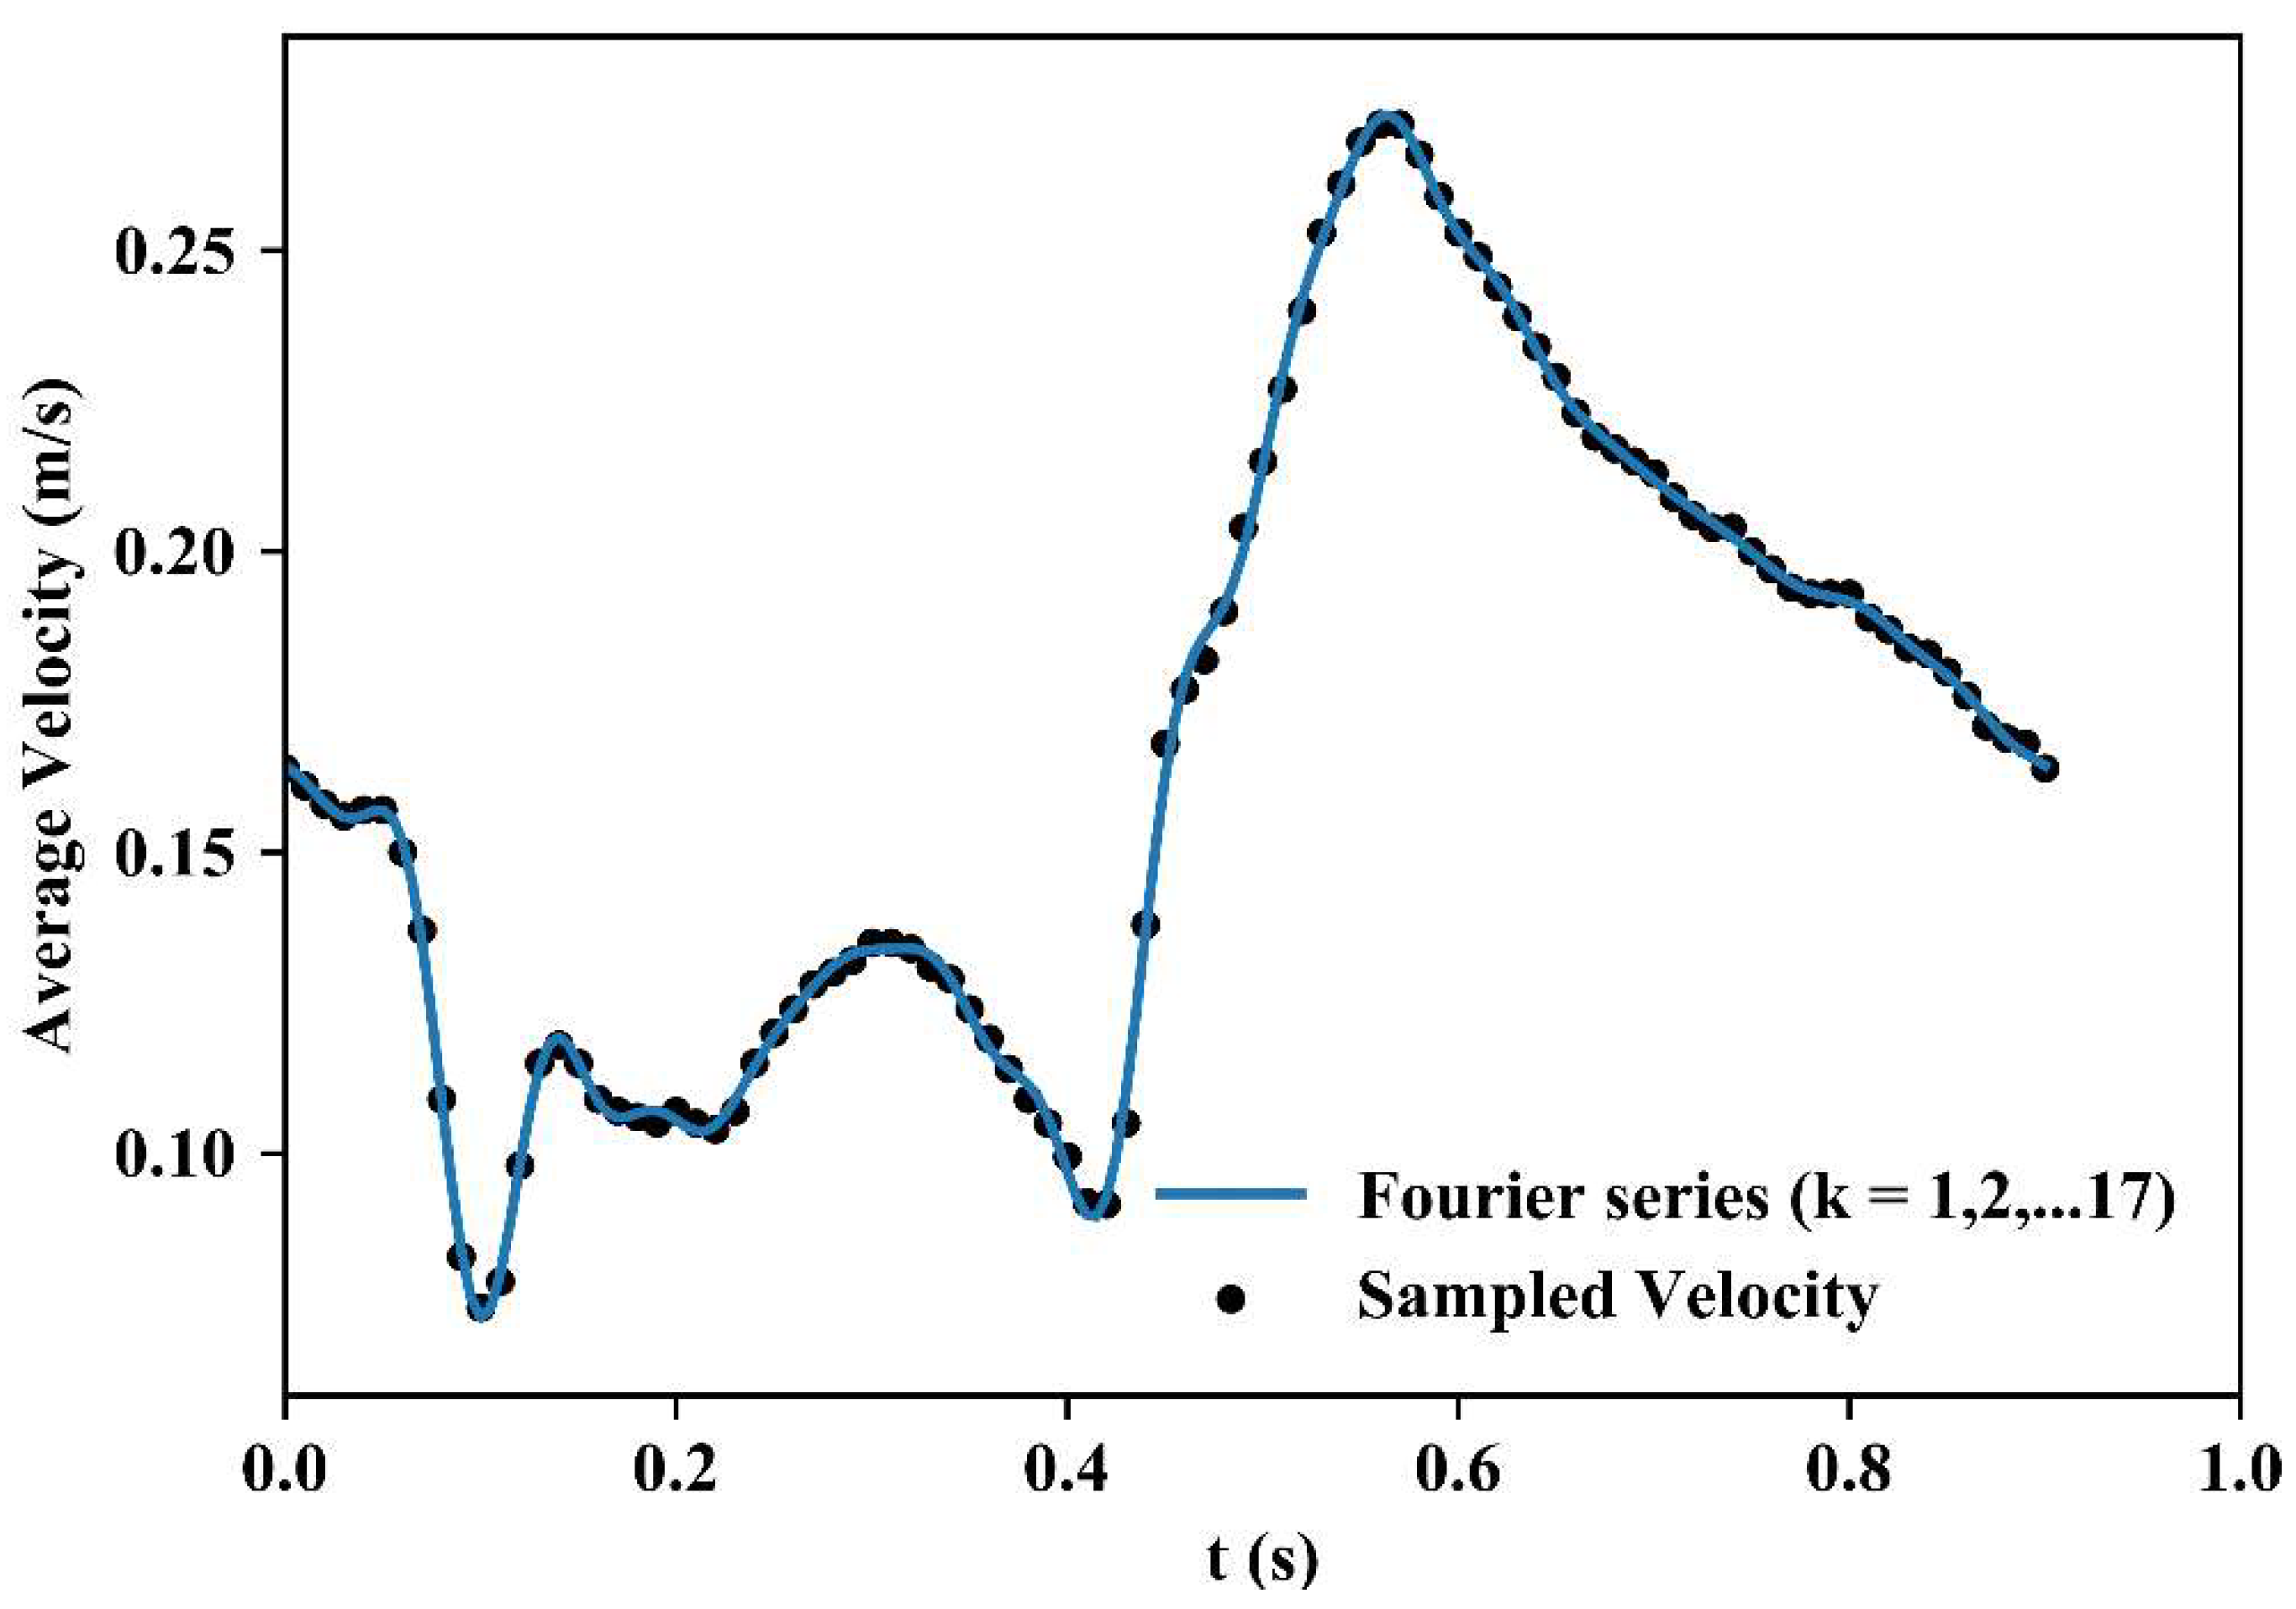
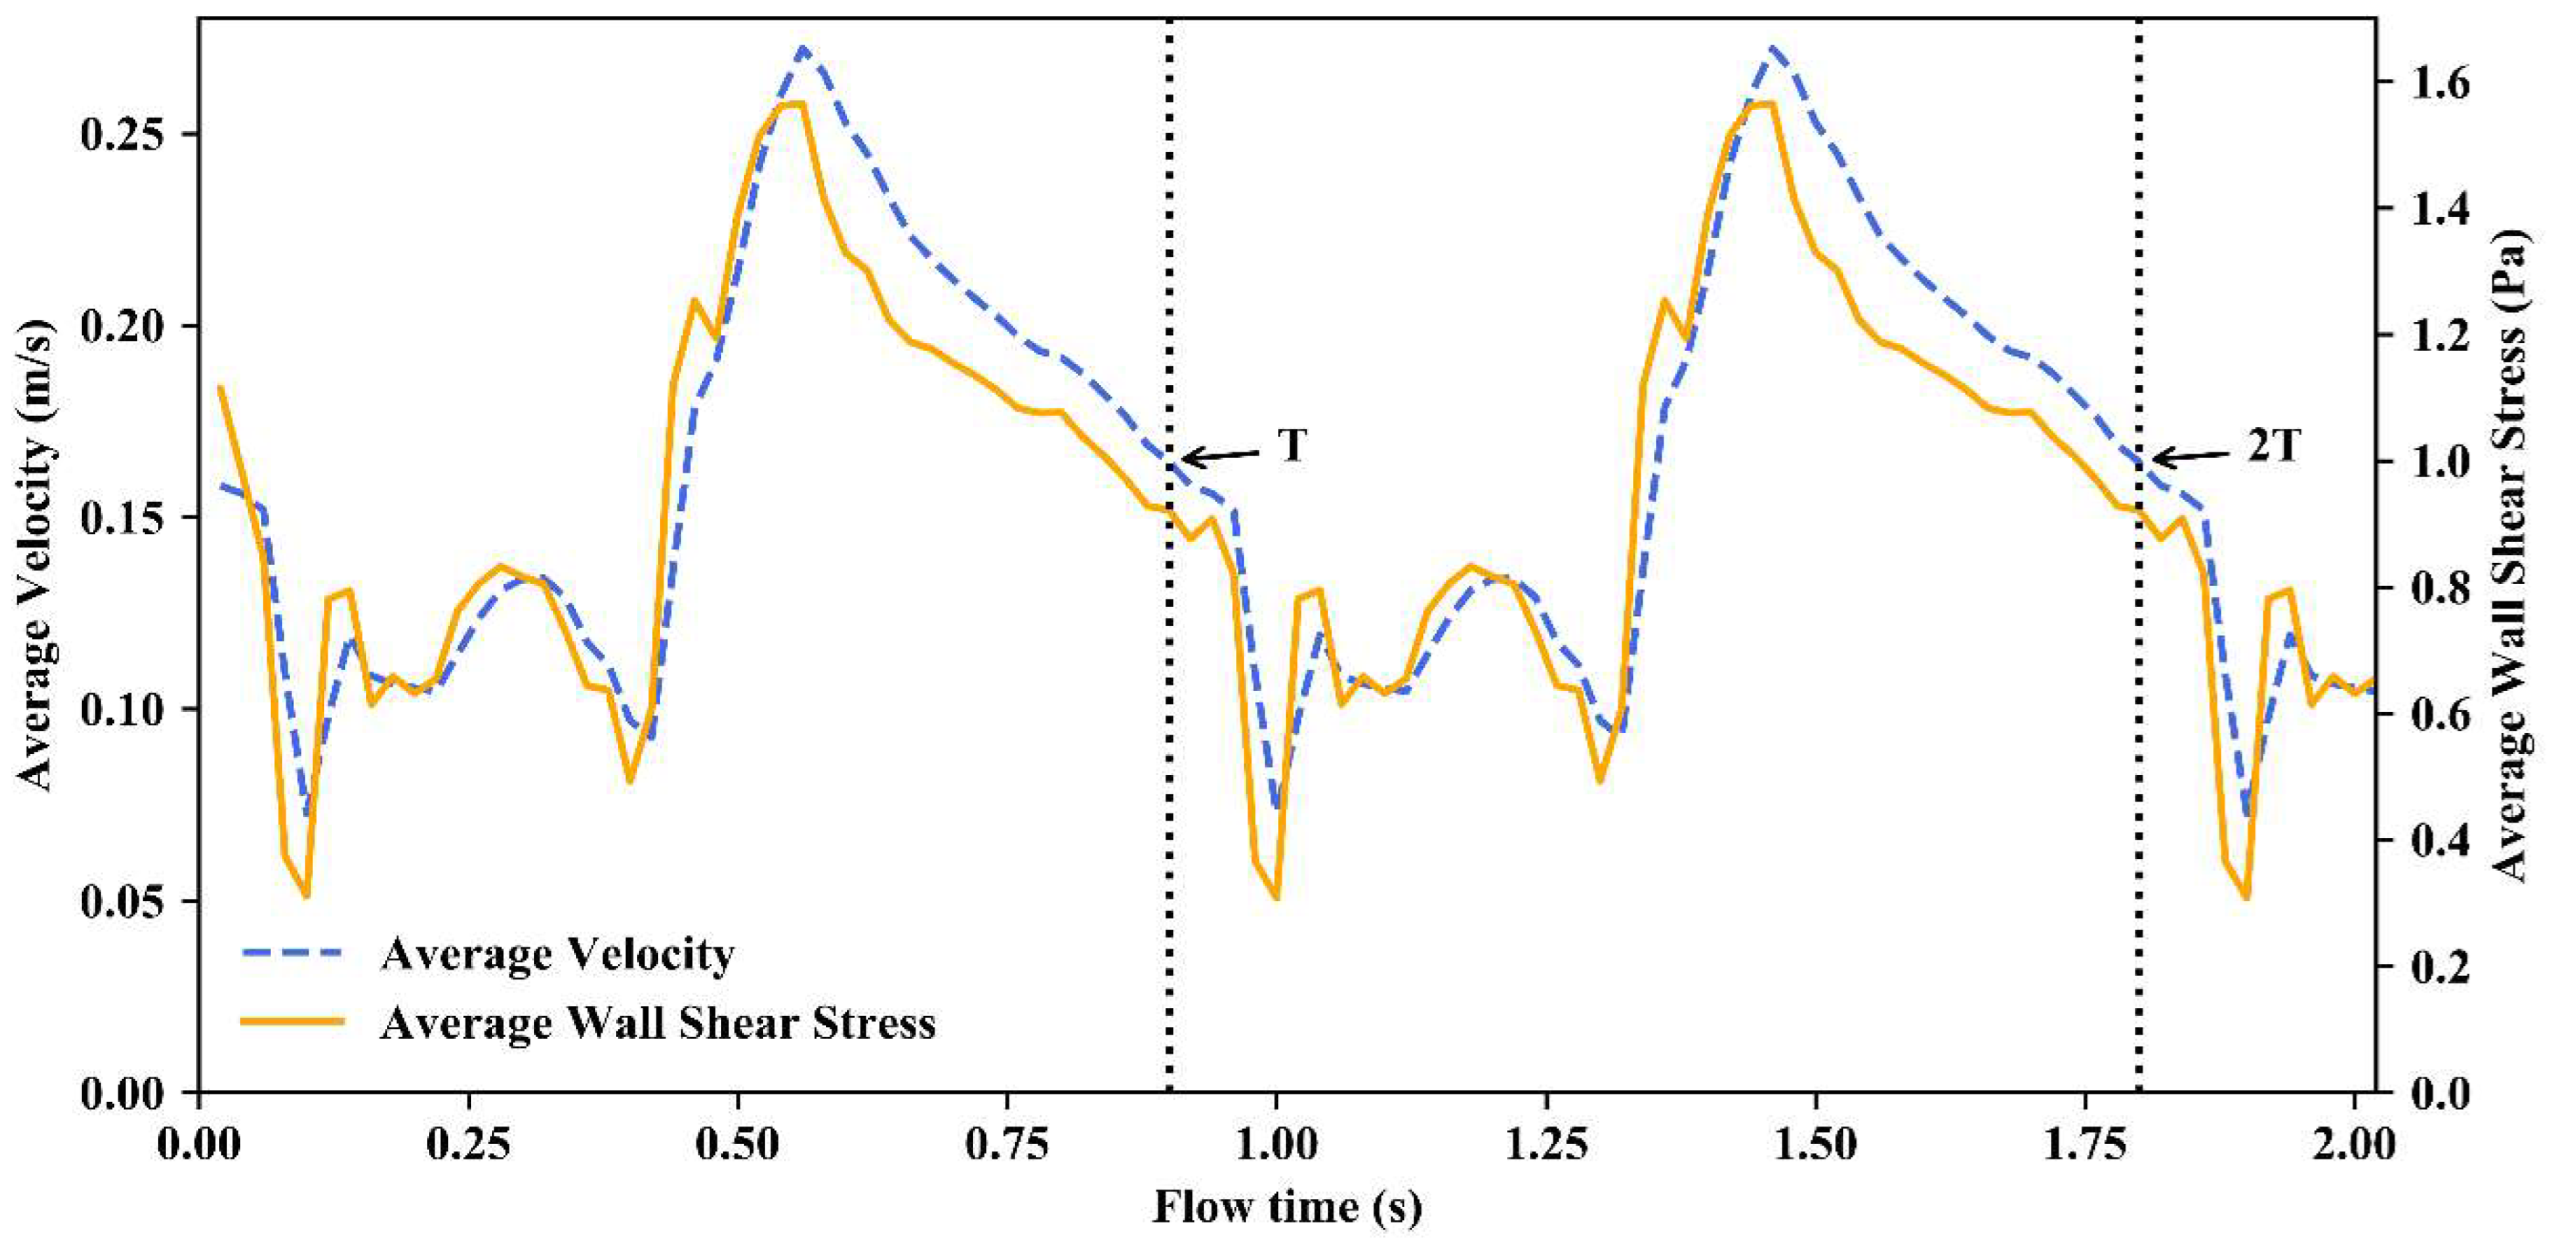
2.4. Boundary Conditions

At the inlet, a velocity that was uniform over the boundary but which varied with time in accordance with a human cardiac cycle of period T = 0.9 s was applied. This was based on the in vivo measurements of cross-sectional average flow velocity in the left anterior descending (LAD) coronary artery reported by Davies et al. [41], which were translated into a Fourier series (Figure 3) using Equations (3)–(6).
v t = a 0 + k = 1 a k cos k ω t + b k sin k ω t
where a 0 , a k and b k are constants:
a 0 = 1 N 1 i = 1 N 1 v i
a k = 2 N 1 i = 1 N 1 v i cos k ω t i
b k = 2 N 1 i = 1 N 1 v i sin k ω t i
where v i and t i are the sampled cross-sectional average flow velocity and time, respectively, and ω is the angular frequency of the signal ( 2 π / T rad/s where T is the time period of one cardiac cycle).
A Fourier series with 17 coefficient pairs was deemed to provide satisfactory correspondence with the experimental data and it was written into a Fluent (Ansys Workbench 17.2) user-defined function in the programming language C and applied to the inlet.
A zero-pressure condition was applied at the outlet with sufficient length for full flow reattachment after the stented region. The distance necessary for this was determined by the analysis of preliminary steady-state results at maximum velocity (0.27 m/s), which showed that disturbed flow behaviour ceased almost immediately after the stented region due to the highly laminar nature of the flow, and hence, a 5 mm extension downstream of the stented region was judged to be sufficient.
Cyclic symmetry was used to reduce the size of the fluid domain to one-third of its original size. The no-slip condition was applied to geometry representing the endothelial surface and the stent strut surface, meaning that the velocity of the fluid relative to these surfaces was zero.

2.5. Simulation

The Fluent laminar pressure-based double-precision solver and the Semi-Implicit Method for Pressure-Linked Equations (SIMPLE) algorithm (with second-order time discretisation) were used for the simulations presented in this study. The SIMPLE algorithm was shown to produce solutions of second-order temporal accuracy when used with a second-order time discretisation method [42]. The Reynolds number was calculated to be 222 at a velocity of 0.27 m/s and assuming blood density 1050 kg/m3 and dynamic viscosity 3.45 mPa s in a vessel of diameter 2.7 mm, and hence a laminar solver was used.
A convergence criterion for all residuals was set at ≤1 × 10⁻⁶ with the allowable number of iterations per time step set such that this criterion was enforced at each time step (of 5 ms). This was favoured over adaptive time-stepping methods in order to simulate the inlet velocity waveform more accurately and provide more accurate time-averaged statistics, as well as permit inspection of the solution at defined times via regular data exports.
Periodic consistency was verified by running a simulation beyond one cycle on the coarse mesh with a 1 × 10⁻⁵ residual convergence criterion. Figure 4 shows that while velocity was consistent between cardiac cycles, WSS during the initial 0.06 s of the first cycle was inconsistent with WSS in subsequent cycles. Therefore, the period of the simulation during 0.06 s–0.96 s was used to give a complete representative cardiac cycle and for any time-averaged calculations. The final simulations had 192 time steps of 5 ms each.
Simulations were completed on a workstation equipped with 16 GB DDR4 RAM and a 3.7 GHz Intel Xeon E3-1240 v6 quad-core CPU with hyper-threading for a total of eight parallel processes. Each time step met a residual convergence criterion of 1 × 10⁻⁶, prior to which convergence was achieved in area-weighted-average WSS (unchanging to four decimal places). Wall clock solution times were 65 h and 68 h for the BVS and DES cases, respectively.

2.6. Calculation of Parameters to Evaluate Risk

The identifiers used to quantify the risk of restenosis were the instantaneous WSS ( τ w ), time-averaged wall shear stress (TAWSS), oscillatory shear index (OSI), relative residence time (RRT), and shear rate ( γ ˙ ). It was observed that atherosclerotic plaque formation correlated best with low mean WSS [17,18] and oscillation in the WSS direction [17]. These characteristics are associated with an increased residence time of circulating particles, and thereby prolonged exposure of atherogenic (atherosclerosis-promoting) agents to the endothelium, whereas particles are cleared rapidly from regions of relatively high WSS and unidirectional flow [17,18]. The oscillation of flow direction affects the alignment of endothelial cells, which may influence the passage of atherogenic agents into the artery wall [17]. OSI was defined to provide a measure of the degree of deviation of the WSS from its average direction and strong correlations were observed between exposure to a high OSI and intimal thickness [43]. Increased permeability of the endothelium has been linked to a higher OSI [44]. However, the OSI is insensitive to shear magnitude (a strong oscillatory flow could have a similar OSI as a much slower flow) and thus the relative residence time parameter was defined given the belief that mean WSS and oscillatory flow may act together to influence endothelial permeability [44]. Increasing shear rates have been shown to promote thrombosis by means of increased platelet concentration near the artery wall and platelet activation [23,24]. Table 3 presents the ranges for TAWSS, OSI, and RRT that are found to promote atherosclerosis and a pathogenic range for shear rate.

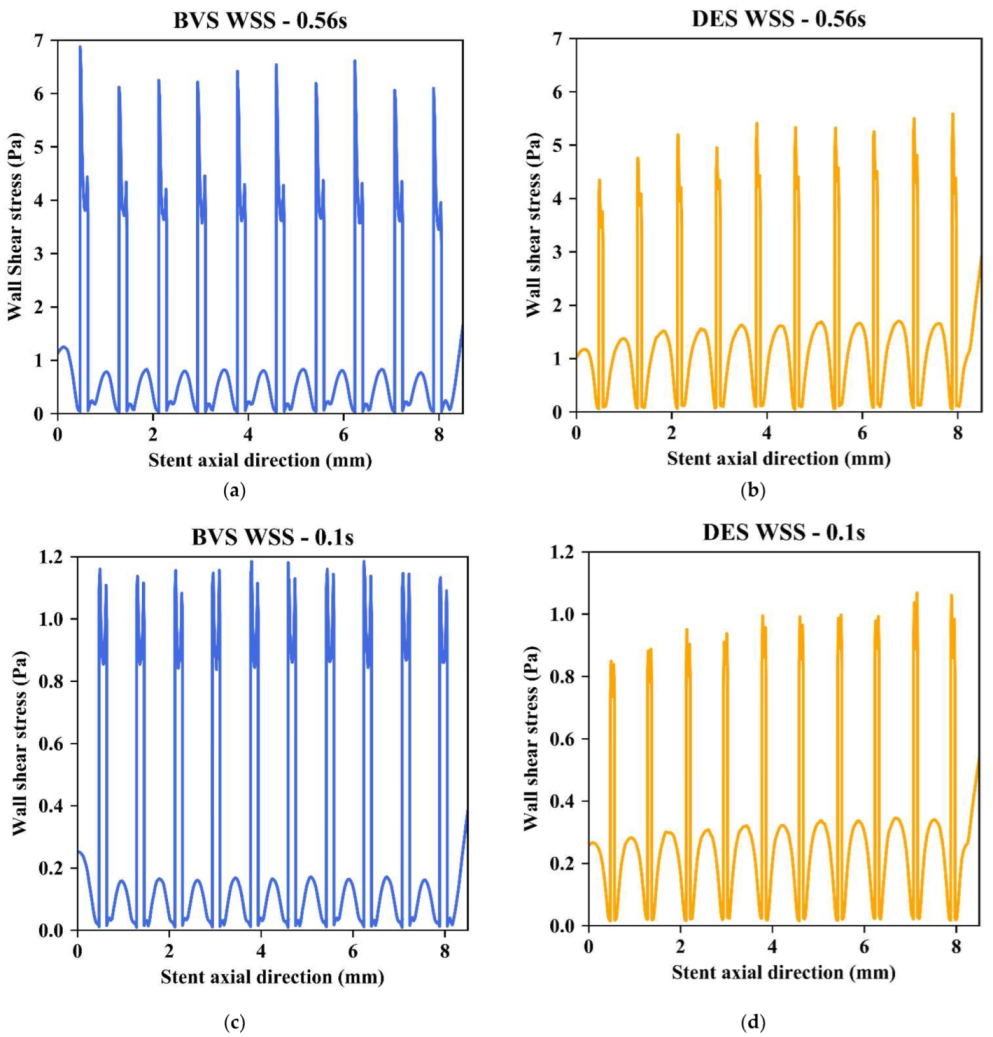
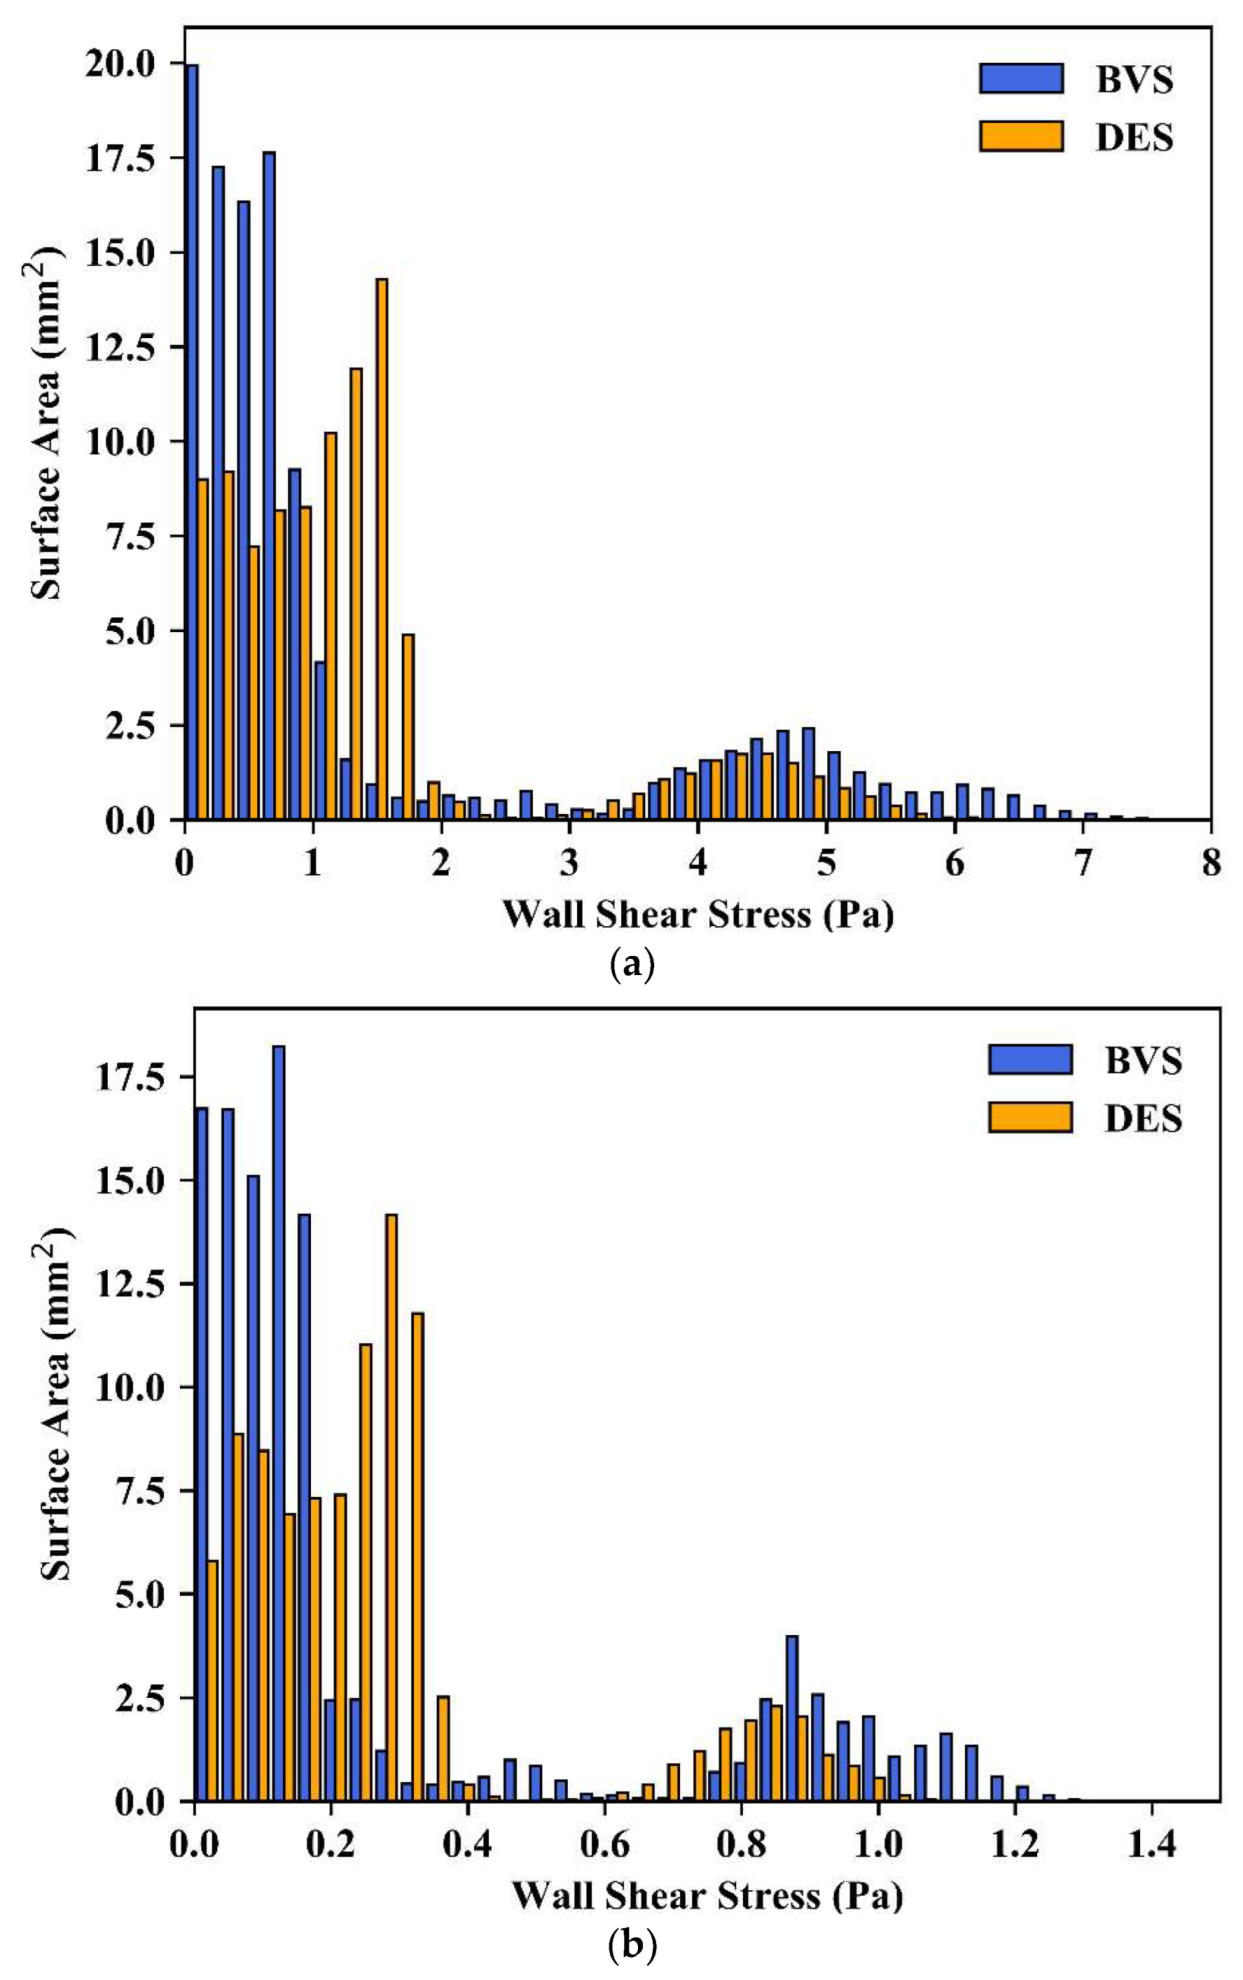
2.6.1. Instantaneous Wall Shear Stress

Wall shear stress is the shear stress that is applied to a wall as a result of a normal velocity gradient. It was calculated computationally using the properties of the flow adjacent to the wall.

2.6.2. Time-Averaged Wall Shear Stress

The TAWSS was calculated at each node using Equation (7):
TAWSS = 1 T 0 T τ w d t 1 N i = 1 N τ w
where T is the time period, τ w is the instantaneous WSS magnitude at a time step i for a total of N time steps. TAWSS is equal to the mean WSS magnitude over a given time period due to the definition of the average value of a function over an interval ab:
f a v g = 1 b a a b f x d x

2.6.3. Oscillatory Shear Index

OSI is a dimensionless index that describes the deviation of the WSS vector from a unidirectional flow [43] (Equation (9)):
OSI = 0.5 1 0 T τ w d t 0 T τ w d t
OSI is calculated using Equation (10) by taking the mean values of WSS magnitude, as well as the mean values for the x, y, and z-components of WSS.
OSI = 0.5 1 i = 1 N τ w x 2 + i = 1 N τ w y 2 + i = 1 N τ w z 2 i = 1 N τ w
where τ w x , τ w y and τ w z are the x, y, and z-components of WSS present at a time step i for a total of N time steps.

2.6.4. Relative Residence Time

Introduced by Himburg et al. [44], RRT is a function of both TAWSS and OSI (Equation (11)):
RRT ~ TAWSS 1 2 OSI 1
Their derivation of RRT at a particular site was in terms of the distance a fully entrained particle would travel during a cardiac cycle. The associated time taken was shown to be directly proportional to the right-hand side of Equation (11). Hence, despite neither being non-dimensional nor having the dimension of time, the term TAWSS 1 2 OSI 1 has come to characterise indirectly the time particles may be in contact with the vessel wall. RRT is a useful comparative tool as it incorporates both the mean WSS and the level of oscillation present over the cardiac cycle in a particular location, where OSI has an increasing influence on RRT as it approaches its limit of 0.5.
The TAWSS and OSI over the cardiac cycle were calculated for each cell in the mesh using a user-defined function, which executed at the end of each converged time step, while RRT was defined as a custom parameter, which referenced the stored values for TAWSS and OSI.

2.6.5. Shear Rate

In the present study, the shear rate governs the viscosity of the fluid as defined in the Carreau model, and thus the shear stresses in the fluid and those acting on the wall.

3. Results

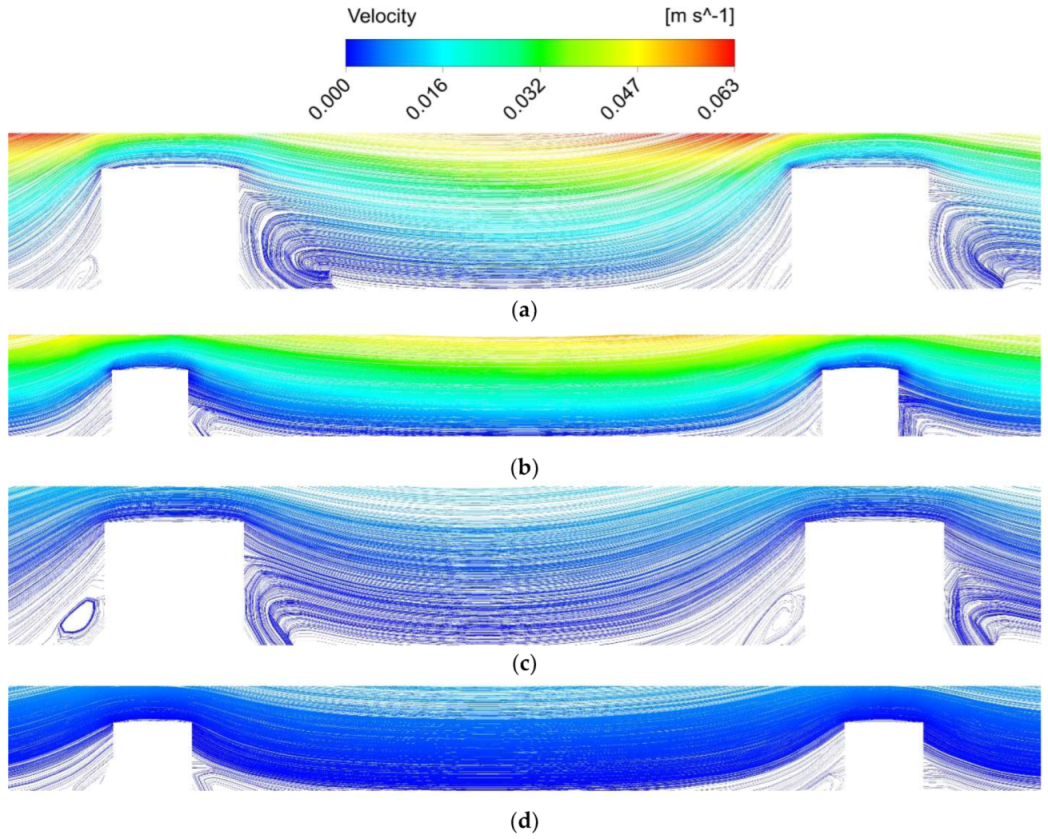
3.1. Instantaneous Flow Characteristics

At the point in the cardiac cycle when the velocity in the coronary artery was a maximum, the flow was observed to be fully developed before reaching the stented region as the boundary layer reached a constant height within the inlet entrance length. Low-velocity regions between stent struts were observed to exhibit stagnating and recirculating behaviour, which persisted throughout the cardiac cycle (Figure 5). Areas of recirculation were more prominent downstream of stent struts and were approximately three times longer and deeper in the BVS compared to the DES case at maximum velocity (at 0.56 s in the cardiac cycle) and about 2.5 times longer and deeper in the BVS case at minimum velocity (at 0.1 s in the cardiac cycle). The extent of the stagnation region upstream of the strut in the BVS case was 13% greater at maximum velocity and 27% greater at minimum velocity compared to the DES.
Low-velocity regions in close proximity to stent struts cause areas of low WSS (<0.4 Pa) due to reduced velocity gradients at the wall. The WSS in the axial direction, along both the artery wall and stent struts, is plotted in Figure 6a–d to highlight these regions at maximum and minimum flow velocity for both BVS and DES geometries. The WSS was at a maximum at the point where the flow met the inner surface of the stent struts (i.e., the surface furthest from the artery wall), and was greatly reduced in the regions between struts. The peak WSS between stent struts was twice as high in the DES than in the BVS (approximately 1.65 Pa compared to 0.82 Pa at maximum flow; approximately 0.33 Pa compared to 0.17 Pa at minimum flow), with smaller differences between WSS on strut inner surfaces (WSS was approximately 18% higher in the BVS at both maximum and minimum flow). Figure 6a,b show that the low WSS regions between stent struts at peak flow velocity were more prominent downstream of a strut as opposed to upstream of the following strut, as the small peaks of WSS in these areas were skewed in the downstream direction. This was observed only to a slight extent at minimum flow velocity (Figure 6c,d).
Figure 7 shows that the BVS geometry had larger areas of WSS under the risk threshold of 0.4 Pa in both peak and minimum velocity cases. At peak velocity, the BVS and DES caused 37.2 mm2 and 18.2 mm2 of surface area under the risk threshold of 0.4 Pa, respectively. At minimum velocity, the BVS caused 88.1 mm2 of risk area, while the DES caused 84.5 mm2. Note that the calculations of the area include both the artery wall and stent surface. In terms of percentage areas, at peak velocity, the BVS caused 33% of its stented region to be under 0.4 Pa, while the DES caused 18.5% of its stented region to be under 0.4 Pa as total surface areas in the stented region were 112.8 mm2 and 98.3 mm2 for the BVS and DES, respectively. At minimum velocity, the DES had a greater percentage of its area at risk—86% compared to 78% in the case of the BVS.

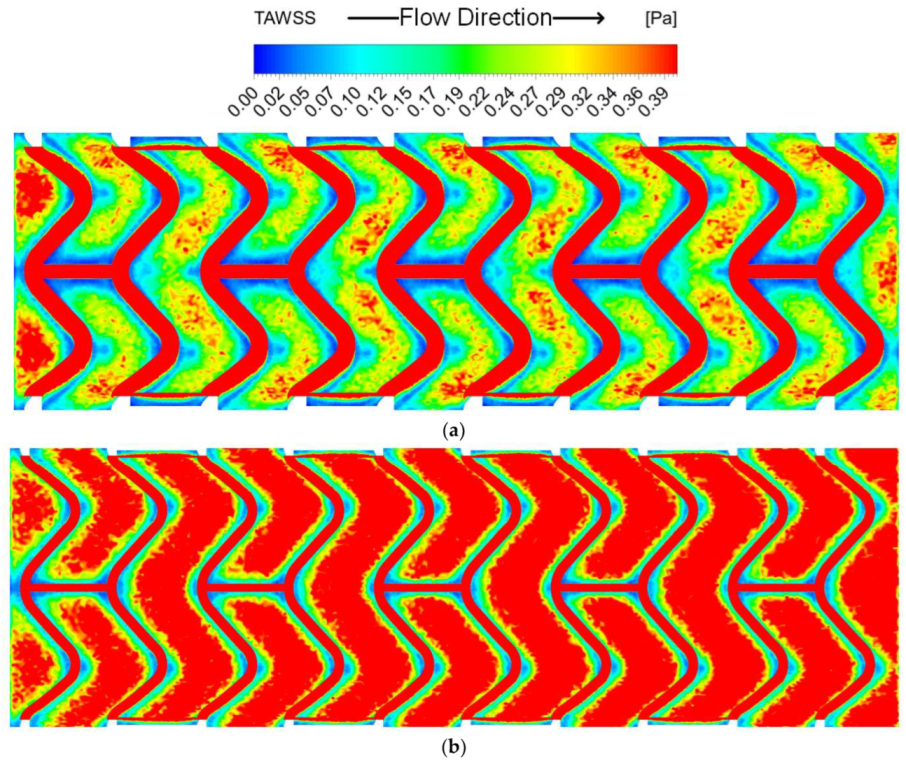
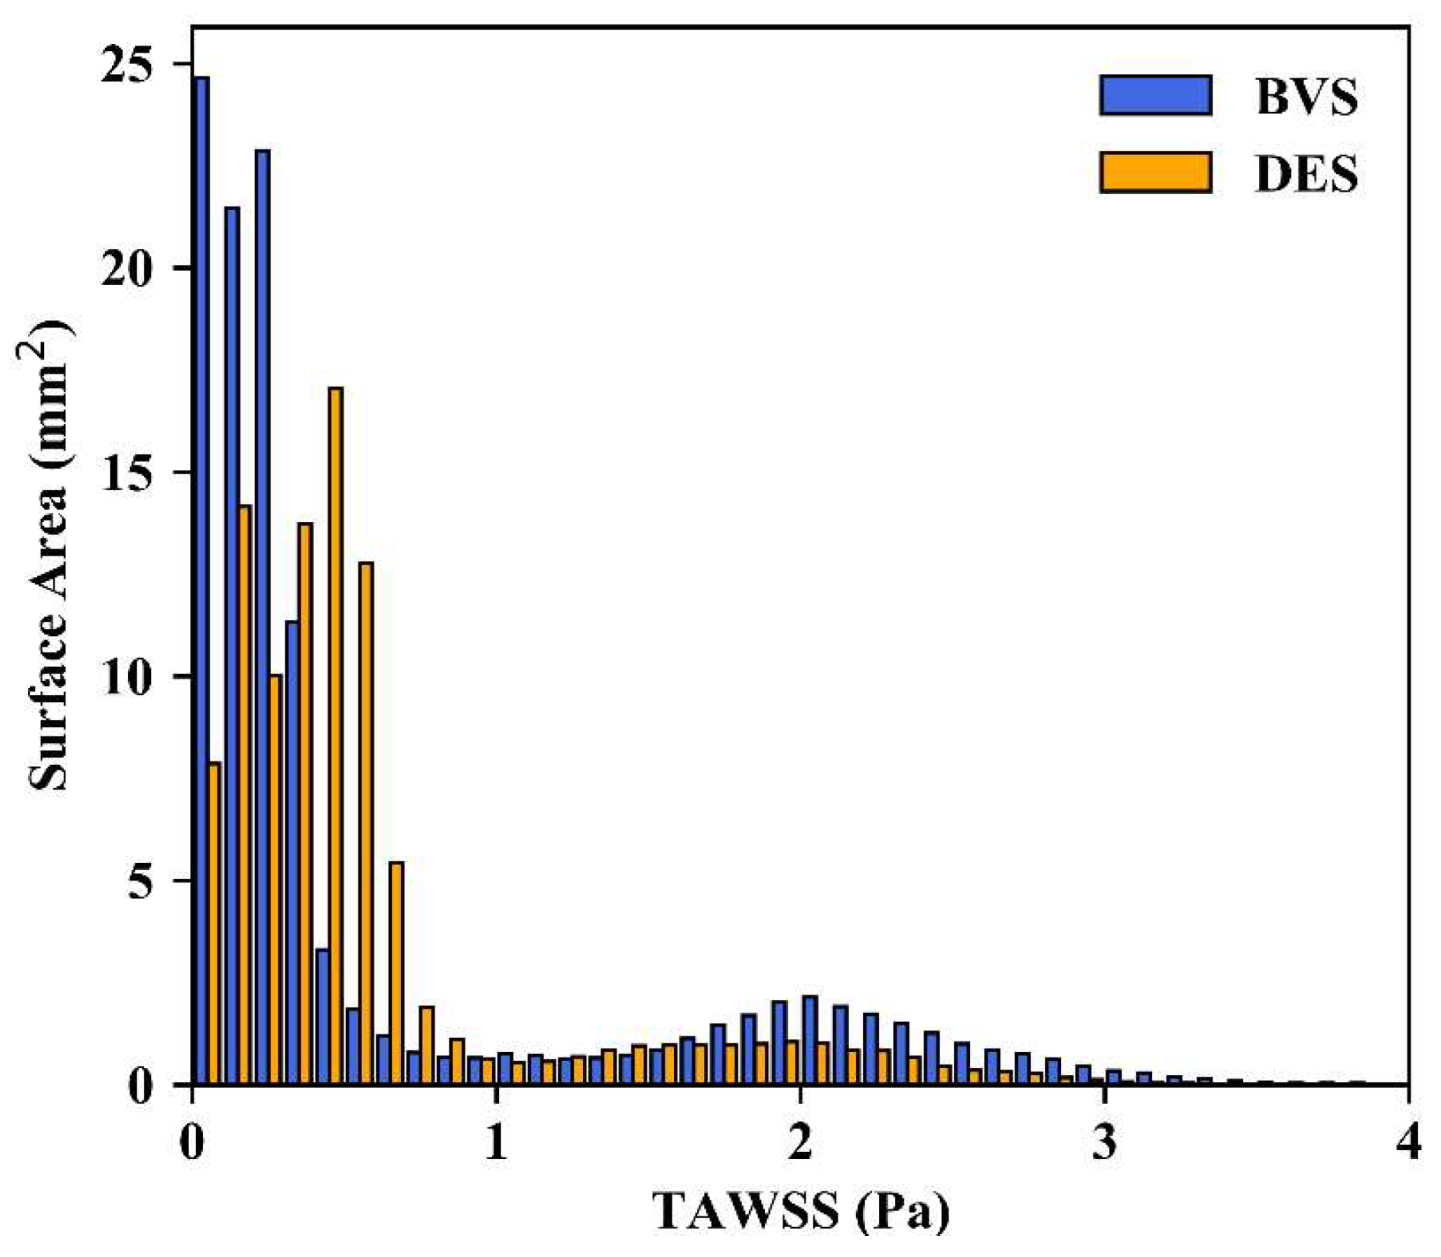
3.2. Time-Averaged Wall Shear Stress

Figure 8 highlights the extent of areas that have an average WSS in the atherogenic range of less than 0.4 Pa over the entire cardiac cycle. Figure 8a indicates that areas of low TAWSS spanned most of the area between stent struts, with the only areas above 0.4 Pa being the inner surface and sides of the stent struts. Figure 8b shows that risk areas caused by the DES geometry were in close proximity to the contact areas of the stent and the inner wall and did not extend as far into the areas between stent struts as in the BVS case.
Figure 9 shows the distribution of TAWSS over the stented region for both cases where each bar is a band of 0.1 Pa. The surface area under these low TAWSS conditions (<0.4 Pa) was 80.4 mm2 for the BVS and 44.1 mm2 for the DES, which was 71% and 45% of their respective total stented areas.

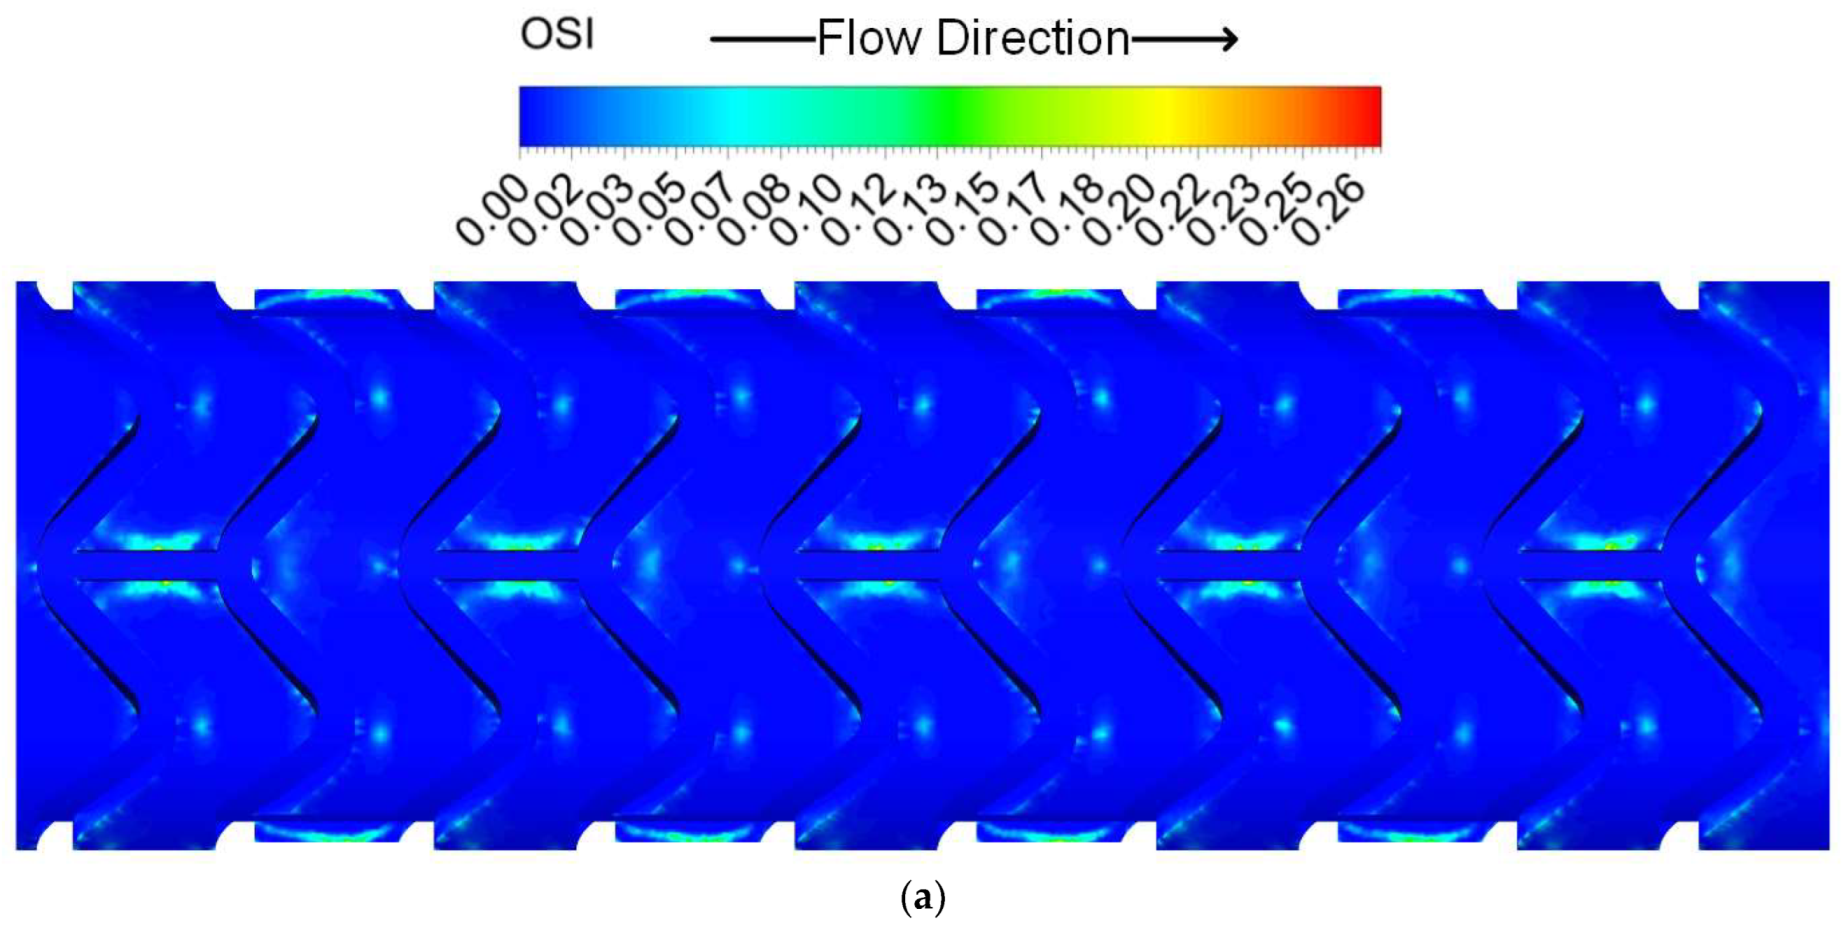
3.3. Oscillatory Shear Index

The OSI over the cardiac cycle is highlighted in Figure 10a,b. In the BVS case, areas downstream of crowns and alongside longitudinal link struts reached a maximum OSI of 0.27 at small points near the middle of these longitudinal struts (Figure 10a). In the case of the DES (Figure 10b), the flow was much less oscillatory, with a maximum value of 0.14 observed in much smaller regions in corners where longitudinal link struts met the curvature of crown sections. OSI values of zero in areas other than close to stent struts were expected as the flow in the coronary artery applied to the inlet of the fluid domain did not reverse direction. Neither case exhibited OSI in an atherosclerosis-promoting range of >0.3.

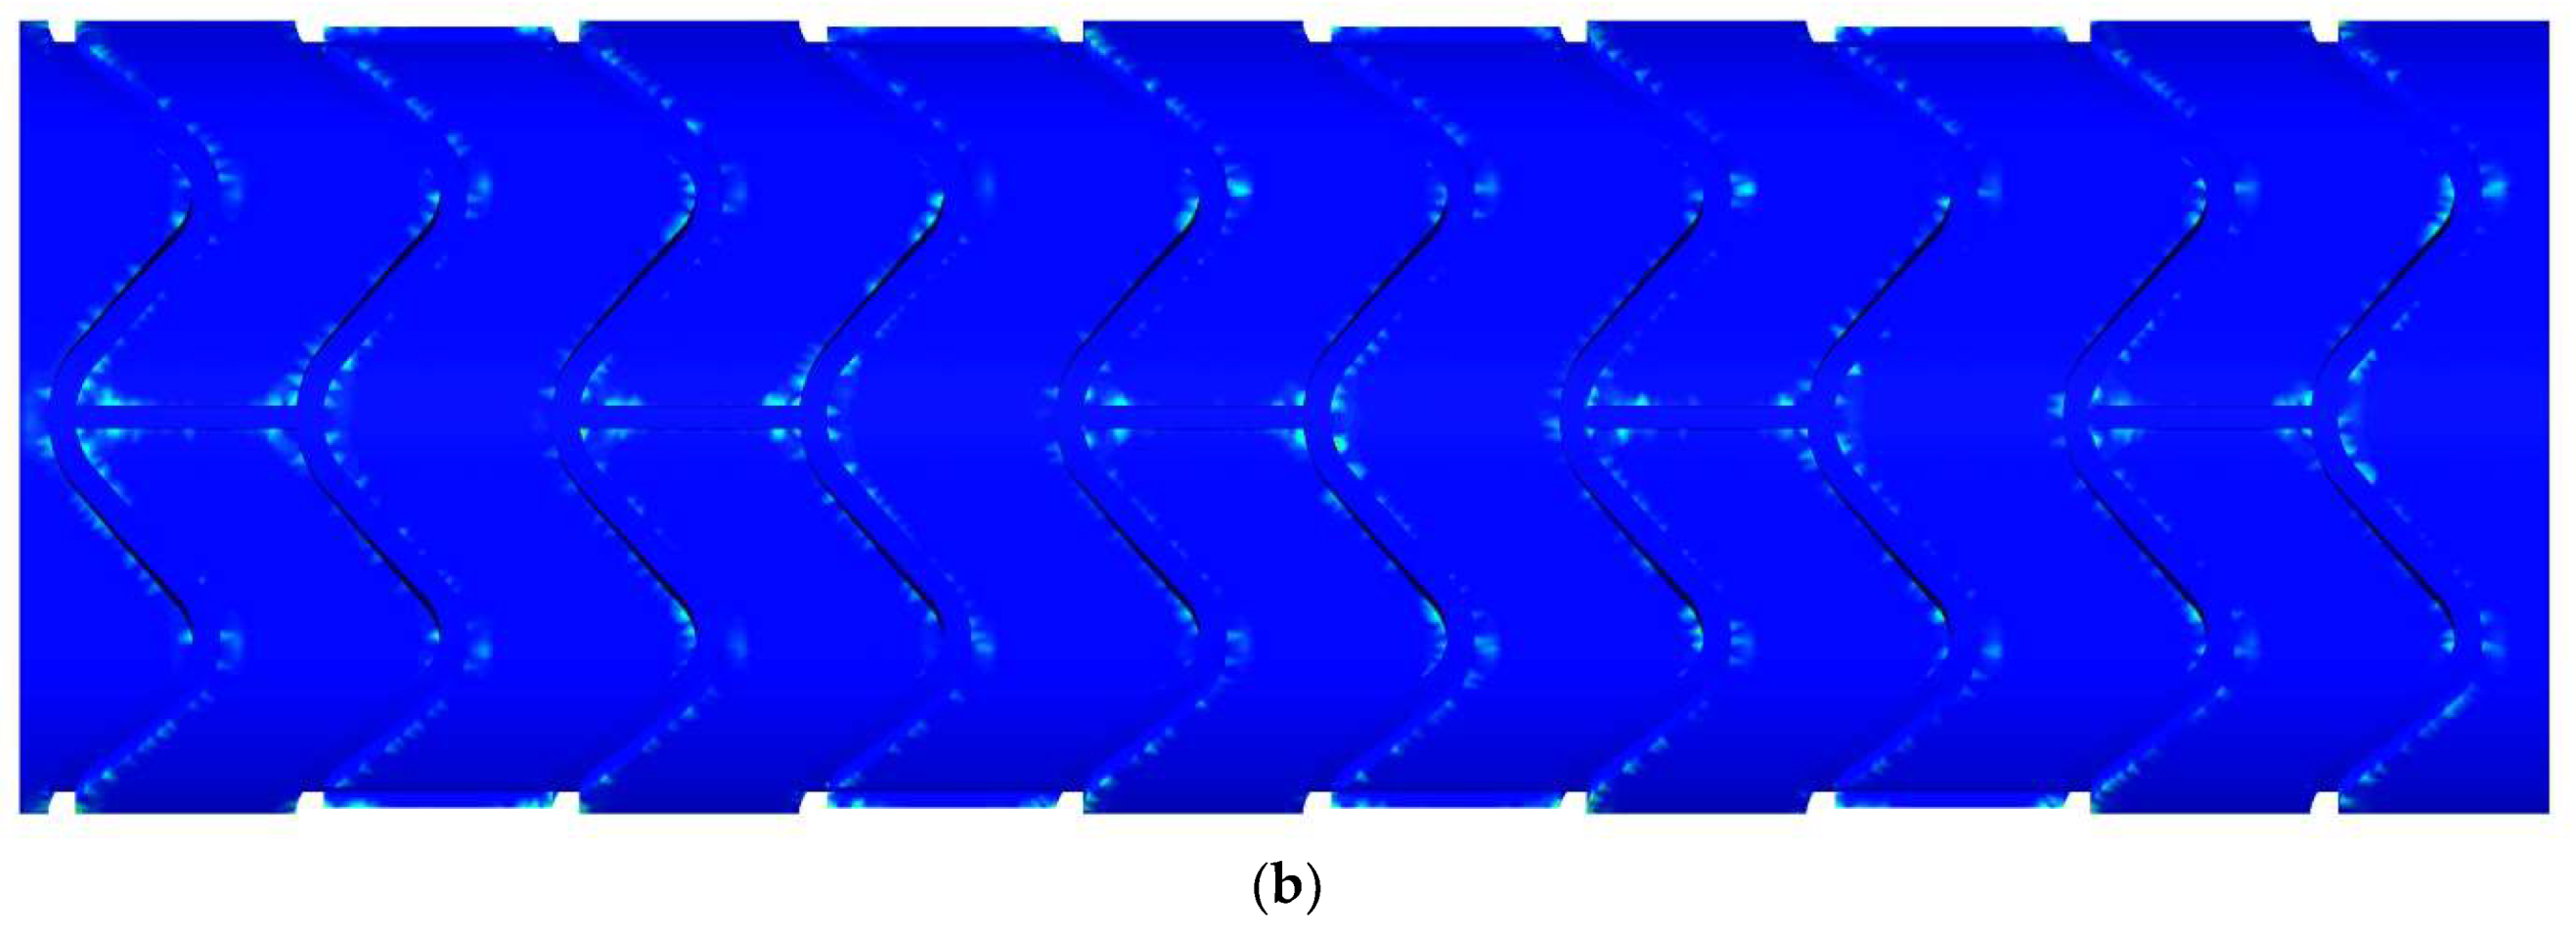
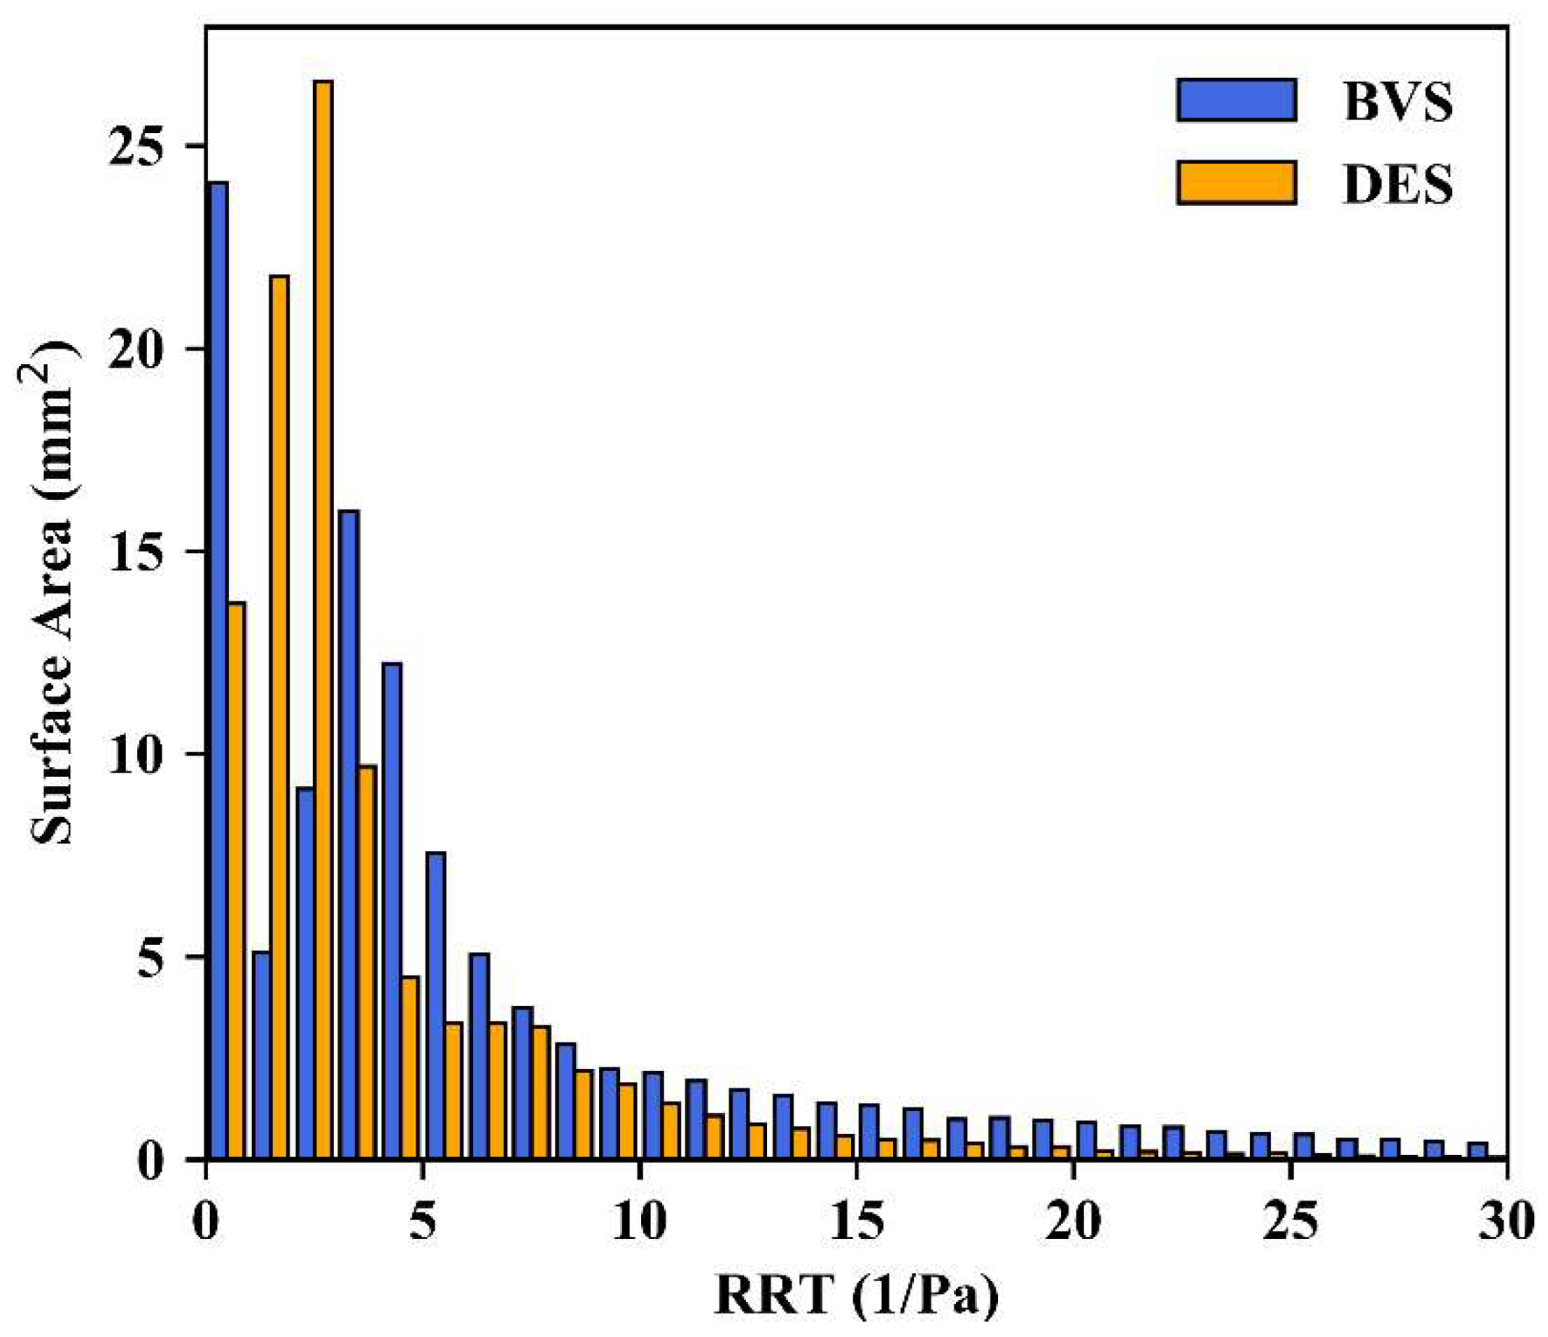
3.4. Relative Residence Time
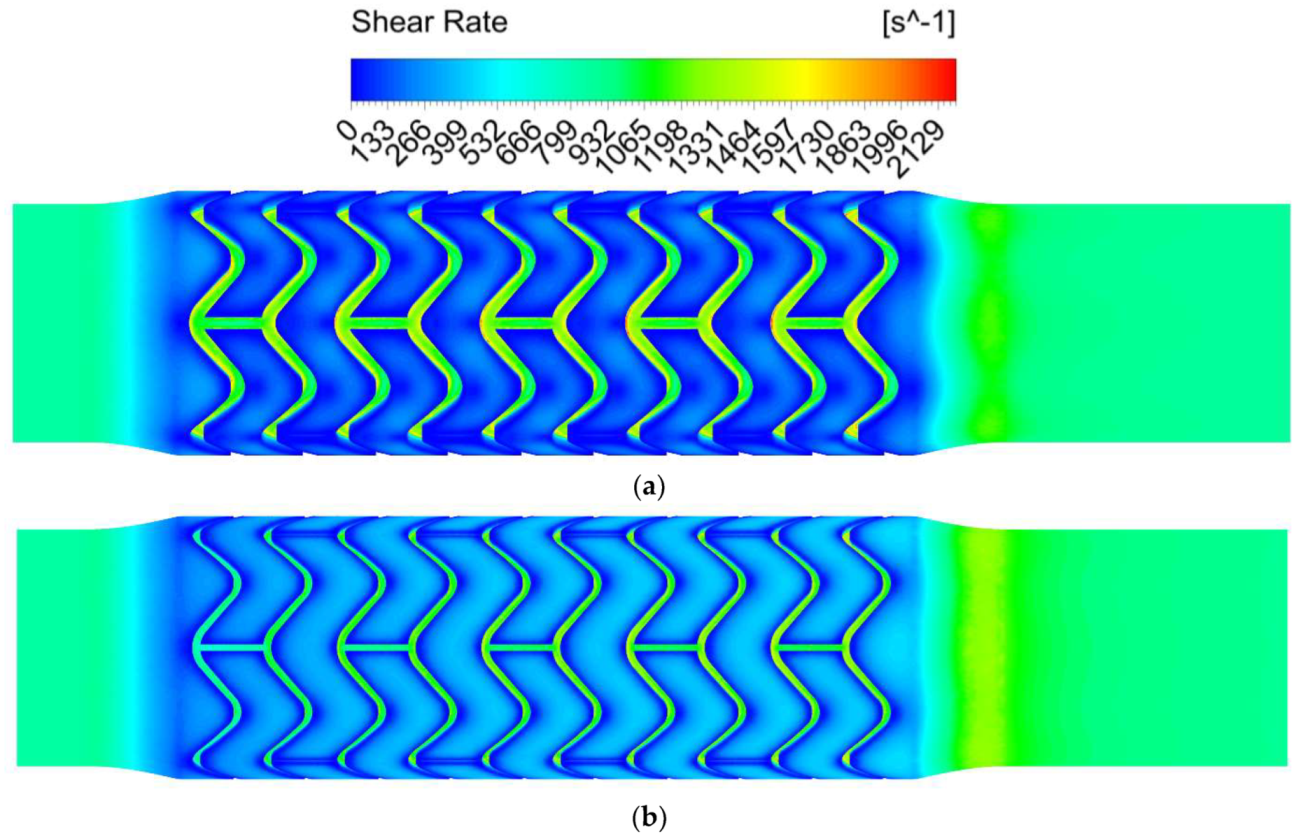
Relative residence times over the risk threshold of 10 Pa−1 are highlighted in Figure 11. Figure 11a shows continuous areas of high RRT (>10 Pa−1) along the interface between the stent and artery wall, with larger areas downstream of stent struts and alongside longitudinal link struts. Figure 11b also shows high levels of RRT in the same areas but to a lesser extent. The surface areas subject to an RRT of at least 10 Pa−1 were 25.5 mm2 for the BVS geometry and 7.5 mm2 for the DES geometry, which were 23% and 8% of their respective areas. The full distribution of RRT in the stented region is given in Figure 12.

3.5. Shear Rate

Shear rates were found to be highest on the leading edge of stent crowns at the downstream end of the stent (Figure 13). BVS geometry promoted higher shear rates on stent strut inner surfaces and lower shear rates between stent struts. The maximum shear rates were 2196 s−1 for the BVS and 1775 s−1 for the DES. While BVS shear rates were approaching levels where thrombus formation has been shown to occur (approximately 2600 s−1) [23,47], they do not reach the pathogenically high-risk levels of 5000 s−1.

4. Discussion

The development of BVS gave optimism of a revolution in coronary intervention and, despite some concerns following clinical trials, it has been advocated that more clinical trials along with non-clinical studies and design refinement are pursued, including investigation of new materials, designs, and implantation techniques [11,15]. The Absorb BVS has been the focus of the largest number of clinical trials [8], but it was taken off the market in 2017. A meta-analysis by Ali et al. [9] combined three-year outcomes from all Absorb clinical trials spanning 3389 patients, 2164 of whom were randomly selected to be fitted with an Absorb BVS. Some findings directly relevant to the stents are summarised and presented in Table 4. All reported relative risks (RR) have p values of at most 0.03.
The primary outcome for these studies was target lesion failure (TLF), which was 1.37 times as likely to occur with the use of the Absorb BVS than with Xience DES. Leading causes of this difference were target vessel myocardial infarction and device thrombosis, which was 2.83 times as likely to occur with Absorb than Xience in the clinical studies analysed.
Stone et al. [48] report five-year outcomes from the Absorb IV randomised trial comparing a BVS with a DES and involving 2604 patients. Despite careful patient selection and improved implantation technique, the rate of TLF at five years was greater for the BVS (17.5% compared to 14.5% for the DES, p = 0.03). In contrast, five-year device thrombosis rates were not significantly different (1.7% for BVS, 1.1% for DES, p = 0.15). They speculate that outcomes would likely be improved using BVS with better expansion characteristics, lower recoil, and thinner struts to improve fluid dynamics and promote faster and more complete endothelialisation.
Geometric features of a stent, such as strut thickness and width, will influence the local hemodynamics. Moreover, it is well established that correlations exist between local hemodynamics and increased restenosis via neointimal hyperplasia and/or thrombosis [17,18,19,20,21,22,23,24]. This provides motivation to model the flow through BVS and DES geometries in order to quantify relative risks between the BVS and DES designs with respect to various hemodynamic metrics and suggest reasons for the adverse clinical outcomes. A limitation of the current study is the idealised geometry consisting of a straight and circular vessel. Zhu et al. [49] have provided a comprehensive catalogue of the human coronary artery axial geometry, including curvature, torsion, and tortuosity, which showed considerable geometric variability between individuals. Recent work [50,51] has given a quantitative assessment of the amount of helical flow in coronary arteries and showed its association with WSS patterns. However, the aim of the current study was to quantify relative risks between the BVS and DES designs and so the main consideration was to have a common base model artery. Future work may involve a range of artery geometries that better represent the coronary vasculature. The model did not include endothelial covering of the stents or any bioresorption of the BVS. This was done to examine early risk factors while the stent is exposed, which have been theorised as the main causes for cases of thrombosis long after the endothelium has covered the stent, especially in small vessels [9].
In both the BVS and DES models, stagnating and recirculating flow was observed between stent struts throughout the cardiac cycle. This caused low WSS between struts, especially in the BVS case where the peak WSS between struts was half that in the DES at corresponding times during the cardiac cycle. This can be related to the increased thickness of the BVS struts, which present a greater obstacle to the oncoming flow and consequently promote more extensive regions of recirculation downstream of the struts. While a similar proportion of the stented regions of the BVS and DES were exposed to WSS under the risk threshold of 0.4 Pa at the minimum flow rate, due to the very low velocity in the coronary artery, the BVS was more at risk at peak velocity with 33% of its stented region under 0.4 Pa compared to 18.5% for the DES. The calculation of TAWSS demonstrated the BVS to be at much greater risk with 71% of its stented area being in the atherogenic range, including most of the area between struts, compared to only 45% of the DES area.
Relative residence time is a function of both TAWSS and OSI. In both the BVS and DES designs, the OSI did not exceed the risk threshold and deviation from unidirectional flow was confined to very small regions. Thus, the distribution of RRT was similar to that of TAWSS and also predicted a greater risk for the BVS with 23% of its surface area subject to an RRT above the threshold compared to 8% of the DES area. High relative residence times were generally found alongside stent struts and longitudinal link struts.
Table 5 summarises the results of this study by listing the surface areas with a heightened risk of restenosis and showing the percentage increase in risk area for the BVS compared to the DES.
Of particular note is the 82.3% increase in the surface area exposed to low TAWSS for the BVS geometry when compared to the DES, and the 240% increase in the area experiencing high particle residence times (although it is noted that the surface areas affected by high RRT are very small). These are major indicators of an increased risk of thrombosis for the BVS via prolonged exposure of platelets and atherogenic agents to the endothelium.
The clinical finding that thrombosis in particular was more likely to occur in the Absorb BVS than in the Xience DES [9] correlates well with the results of the present study and supports its ability to quantify relative risks for restenosis. Parallels cannot be drawn with respect to thrombus volume in either case as these were not reported.
Kolandaivelu et al. [29] showed that a custom-built 162 µm thick metal stent was 49% more thrombogenic than a stent of an almost identical design with half the thickness, while the present study predicts a 240% increase in risk area in the worst case. However, areas of potential risk do not directly translate into thrombus volume in practice, and so a more precise link between risk areas and thrombus volumes cannot be made. Indeed, Kolandaivelu et al. [29] advise that stent thrombosis may arise from the flow disturbance around the stent struts or by virtue of the thrombo-pathology associated with flow disruptions and the injured vessel wall, or some combination of these.

Comparison of Simulation Results with Existing Work

Transient wall shear stresses for the thinner DES geometry were verified by comparison with the study by Chiastra et al. [26] who determined that a 90 µm thick, 8.5 mm long cobalt chromium stent under the same flow velocity caused 38.65% of their region of interest to have a TAWSS of less than 0.4 Pa. This compares favourably with the present study, which found a stent of thickness 81 µm caused 45% of its stented area to have TAWSS values under 0.4 Pa. When the deformed wall regions before and after the stent are included in the calculation for the present study (as they are in Chiastra et al. [26]), this gives a value of 37.6%, which is very similar to the value of 38.65% previously reported.
In terms of instantaneous WSS at maximum velocity (accounting for the region of interest), the present study predicted 15.5% of the area under 0.4 Pa whereas Chiastra et al. [26] calculated 12.8%. A lower value would be expected in the present study due to the slightly thinner stent strut. However, the absence of a non-Newtonian viscosity model might be a limitation in the referenced simulation. It is extrapolated that the current simulation is also valid for the thicker BVS geometry as all boundary conditions and calculations were identical in the two cases, as were vessel geometries apart from the thickness and width of stent struts.

5. Conclusions

This study has compared various hemodynamic risk factors between a BVS and a DES using a time-dependent, three-dimensional CFD model accounting for non-Newtonian blood viscosity. Each of the risk factors—WSS, TAWSS, OSI, RRT, and shear rate—has been associated with an increased risk of restenosis [17,18,19,20,21,22,23,24,43,44,45]. The analysis identified sites in the stented regions for both the BVS and DES that are more susceptible to thrombosis and neointimal hyperplasia and suggests an increased risk for thrombosis and neointimal hyperplasia for the BVS compared to the DES, correlating with the results of in vivo studies and clinical trials [9,25].
It is intended that the results of this study may be used to inform design choices regarding the cross-sectional shape of stent struts and strut patterns in order to reduce the risk of restenosis, resulting in a safer and more effective stent design.

Author Contributions

Conceptualization, J.S.C., R.W.B. and G.H.M.; Data curation, M.S.E.; Formal analysis, M.S.E.; Investigation, M.S.E.; Methodology, M.S.E., J.S.C. and R.W.B.; Project administration, M.S.E. and J.S.C.; Resources, J.S.C. and R.W.B.; Software, M.S.E.; Supervision, J.S.C. and G.H.M.; Validation, M.S.E.; Visualization, M.S.E. and J.S.C.; Writing—original draft, M.S.E.; Writing—review and editing, J.S.C., R.W.B. and G.H.M. All authors have read and agreed to the published version of the manuscript.

Funding

This research received no external funding.

Data Availability Statement

Relevant data are contained within the article.

Conflicts of Interest

The authors declare no conflict of interest.

References

  1. Falk, E. Pathogenesis of atherosclerosis. J. Am. Coll. Cardiol. 2006, 47, C7–C12. [Google Scholar] [CrossRef] [PubMed]
  2. British Heart Foundation. Heart and Circulatory Disease Statistics 2023. Available online: https://www.bhf.org.uk/what-we-do/our-research/heart-statistics/heart-statistics-publications/cardiovascular-disease-statistics-2023 (accessed on 9 August 2023).
  3. Verdonck, P. Advances in Biomedical Engineering, 1st ed.; Elsevier: Amsterdam, The Netherlands, 2009. [Google Scholar]
  4. Stone, G.W.; Moses, J.W.; Ellis, S.G.; Schofer, J.; Dawkins, K.D.; Morice, M.-C.; Colombo, A.; Schampaert, E.; Grube, E.; Kirtane, A.J.; et al. Safety and efficacy of sirolimus- and paclitaxel-eluting coronary stents. N. Engl. J. Med. 2007, 356, 998–1008. [Google Scholar] [CrossRef] [PubMed]
  5. Kereiakes, D.J.; Onuma, Y.; Serruys, P.W.; Stone, G.W. Bioresorbable vascular scaffolds for coronary revascularization. Circulation 2016, 134, 168–182. [Google Scholar] [CrossRef] [PubMed]
  6. Onuma, Y.; Serruys, P.W. Bioresorbable scaffold: The advent of a new era in percutaneous coronary and peripheral revascularization? Circulation 2011, 123, 779–797. [Google Scholar] [CrossRef] [PubMed]
  7. Ormiston, J.A.; Serruys, P.W.S. Bioabsorbable coronary stents. Circ. Cardiovasc. Interv. 2009, 2, 255–260. [Google Scholar] [CrossRef]
  8. Indolfi, C.; De Rosa, S.; Colombo, A. Bioresorbable vascular scaffolds—basic concepts and clinical outcome. Nat. Rev. Cardiol. 2016, 13, 719–729. [Google Scholar] [CrossRef]
  9. Ali, Z.A.; Gao, R.; Kimura, T.; Onuma, Y.; Kereiakes, D.J.; Ellis, S.G.; Chevalier, B.; Vu, M.-T.; Zhang, Z.; Simonton, C.A.; et al. Three-year outcomes with the Absorb bioresorbable scaffold: Individual-patient-data meta-analysis from the ABSORB randomized trials. Circulation 2018, 137, 464–479. [Google Scholar] [CrossRef]
  10. Capodanno, D.; Buccheri, S.; Romano, S.; Capranzano, P.; Francaviglia, B.; Tamburino, C. Decision analytic Markov model weighting expected benefits and current limitations of first-generation bioresorbable vascular scaffolds. Circ. Cardiovasc. Interv. 2018, 11, e005768. [Google Scholar] [CrossRef]
  11. Bangalore, S.; Bezerra, H.G.; Rizik, D.G.; Armstrong, E.J.; Samuels, B.; Naidu, S.S.; Grines, C.L.; Foster, M.T.; Choi, J.W.; Bertolet, B.D.; et al. The state of the Absorb bioresorbable scaffold: Consensus from an expert panel. J. Am. Coll. Cardiol. Interv. 2017, 10, 2349–2359. [Google Scholar] [CrossRef]
  12. Serruys, P.W.; Revaiah, P.C.; Onuma, Y. Bioresorbable scaffolds: Is there still light at the end of the tunnel? J. Am. Coll. Cardiol. 2023, 82, 196–199. [Google Scholar] [CrossRef]
  13. Wang, P.-J.; Ferralis, N.; Conway, C.; Grossman, J.C.; Edelman, E.R. Strain-induced accelerated asymmetric spatial degradation of polymeric vascular scaffolds. Proc. Natl. Acad. Sci. USA 2018, 115, 2640–2645. [Google Scholar] [CrossRef] [PubMed]
  14. Wang, P.-J.; Nezami, F.R.; Gorji, M.B.; Berti, F.; Petrini, L.; Wierzbicki, T.; Migliavacca, F.; Edelman, E.R. Effect of working environment and procedural strategies on mechanical performance of bioresorbable vascular scaffolds. Acta Biomater. 2018, 82, 34–43. [Google Scholar] [CrossRef] [PubMed]
  15. Bangalore, S.; Edelman, E.R.; Bhatt, D.L. First-generation bioresorbable vascular scaffolds. Disappearing stents or disappearing evidence? J. Am. Coll. Cardiol. 2017, 69, 3067–3069. [Google Scholar] [CrossRef] [PubMed]
  16. Lafont, A.; Mennuni, M.G. What happened to the bioresorbable scaffold concept? Circ. Cardiovasc. Interv. 2018, 11, e006283. [Google Scholar] [CrossRef] [PubMed]
  17. Glagov, S.; Zarins, C.K.; Giddens, D.P.; Ku, D.N. Hemodynamics and atherosclerosis. Insights and perspectives gained from studies of human arteries. Arch. Pathol. Lab. Med. 1988, 112, 1018–1031. [Google Scholar] [PubMed]
  18. Asakura, T.; Karino, T. Flow patterns and spatial distribution of atherosclerotic lesions in human coronary arteries. Circ. Res. 1990, 66, 1045–1066. [Google Scholar] [CrossRef]
  19. Kohler, T.R.; Kirkman, T.R.; Kraiss, L.W.; Zierler, B.K.; Clowes, A.W. Increased blood flow inhibits neointimal hyperplasia in endothelialized vascular grafts. Circ. Res. 1991, 69, 1557–1565. [Google Scholar] [CrossRef]
  20. Wentzel, J.J.; Krams, R.; Schuurbiers, J.C.H.; Oomen, J.A.; Kloet, J.; van der Giessen, W.J.; Serruys, P.W.; Slager, C.J. Relationship between neointimal thickness and shear stress after wallstent implantation in human coronary arteries. Circulation 2001, 103, 1740–1745. [Google Scholar] [CrossRef]
  21. LaDisa, J.F.; Olson, L.E.; Molthen, R.C.; Hettrick, D.A.; Pratt, P.F.; Hardel, M.D.; Kersten, J.R.; Warltier, D.C.; Pagel, P.S. Alterations in wall shear stress predict sites of neointimal hyperplasia after stent implantation in rabbit iliac arteries. Am. J. Physiol. Heart Circ. Physiol. 2005, 288, H2465–H2475. [Google Scholar] [CrossRef]
  22. Gay, M.; Zhang, L.T. Numerical studies on fluid-structure interactions of stent deployment and stented arteries. Eng. Comput. 2009, 25, 61–72. [Google Scholar] [CrossRef]
  23. Sakariassen, K.S.; Orning, L.; Turitto, V.T. The impact of blood shear rate on arterial thrombus formation. Future Sci. OA 2015, 1, FSO30. [Google Scholar] [CrossRef] [PubMed]
  24. Casa, L.D.C.; Deaton, D.H.; Ku, D.N. Role of high shear rate in thrombosis. J. Vasc. Surg. 2015, 61, 1068–1080. [Google Scholar] [CrossRef] [PubMed]
  25. Caiazzo, G.; Kilic, I.D.; Fabris, E.; Serdoz, R.; Mattesini, A.; Foin, N.; de Rosa, S.; Indolfi, C.; di Mario, C. Absorb bioresorbable vascular scaffold: What have we learned after 5 years of clinical experience? Int. J. Cardiol. 2015, 201, 129–136. [Google Scholar] [CrossRef] [PubMed]
  26. Chiastra, C.; Migliavacca, F.; Martínez, M.A.; Malve, M. On the necessity of modelling fluid-structure interaction for stented coronary arteries. J. Mech. Behav. Biomed. Mater. 2014, 34, 217–230. [Google Scholar] [CrossRef]
  27. Abbott Vascular. Absorb GT1TM Bioresorbable Vascular Scaffold (BVS) System, Instructions for Use; Abbott Vascular: Santa Clara, CA, USA, 2016. [Google Scholar]
  28. Brugaletta, S.; Gomez-Lara, J.; Diletti, R.; Farooq, V.; van Geuns, R.J.; de Bruyne, B.; Dudek, D.; Garcia-Garcia, H.M.; Ormiston, J.A.; Serruys, P.W. Comparison of in vivo eccentricity and symmetry indices between metallic stents and bioresorbable vascular scaffolds: Insights from the ABSORB and SPIRIT trials. Catheter. Cardiovasc. Interv. 2012, 79, 219–228. [Google Scholar] [CrossRef]
  29. Kolandaivelu, K.; Swaminathan, R.; Gibson, W.J.; Kolachalama, V.B.; Nguyen-Ehrenreich, K.-L.; Giddings, V.L.; Coleman, L.; Wong, G.K.; Edelman, E.R. Stent thrombogenicity early in high-risk interventional settings is driven by stent design and deployment and protected by polymer-drug coatings. Circulation 2011, 123, 1400–1409. [Google Scholar] [CrossRef]
  30. Hsiao, H.-M.; Lee, K.-H.; Liao, Y.-C.; Cheng, Y.-C. Cardiovascular stent design and wall shear stress distribution in coronary stented arteries. Micro Nano Lett. 2012, 7, 430–433. [Google Scholar] [CrossRef]
  31. Stiehm, M.; Brede, M.; Quosdorf, D.; Martin, H.; Leder, A. A sensitivity analysis of stent design parameters using CFD. Biomed. Tech. 2013, 58, SI-1-Track-N. [Google Scholar] [CrossRef]
  32. Briguori, C.; Sarais, C.; Pagnotta, P.; Liistro, F.; Montorfano, M.; Chieffo, A.; Sgura, F.; Corvaja, N.; Albiero, R.; Stankovic, G.; et al. In-stent restenosis in small coronary arteries: Impact of strut thickness. J. Am. Coll. Cardiol. 2002, 40, 403–409. [Google Scholar] [CrossRef]
  33. Foin, N.; Lee, R.D.; Torii, R.; Guitierrez-Chico, J.L.; Mattesini, A.; Nijjer, S.; Sen, S.; Petraco, R.; Davies, J.E.; di Mario, C.; et al. Impact of stent strut design in metallic stents and biodegradable scaffolds. Int. J. Cardiol. 2014, 177, 800–808. [Google Scholar] [CrossRef]
  34. Kays, W.M.; Crawford, M.E. Convective Heat and Mass Transfer, 3rd ed.; McGraw-Hill: New York, NY, USA, 1993. [Google Scholar]
  35. Chiastra, C.; Morlacchi, S.; Pereira, S.; Dubini, G.; Migliavacca, F. Computational fluid dynamics of stented coronary bifurcations studied with a hybrid discretization method. Eur. J. Mech. B Fluids 2012, 35, 76–84. [Google Scholar] [CrossRef]
  36. Roache, P.J. Quantification of uncertainty in computational fluid dynamics. Annu. Rev. Fluid Mech. 1997, 29, 123–160. [Google Scholar] [CrossRef]
  37. Oberkampf, W.L.; Roy, C.J. Verification and Validation in Scientific Computing, 1st ed.; Cambridge University Press: Cambridge, UK, 2010. [Google Scholar]
  38. Slater, J.W. Examining Spatial (Grid) Convergence. Available online: http://www.grc.nasa.gov/WWW/wind/valid/tutorial/spatconv.html (accessed on 25 October 2018).
  39. Merrill, E.W. Rheology of blood. Physiol. Rev. 1969, 49, 863–888. [Google Scholar] [CrossRef] [PubMed]
  40. Soulis, J.V.; Giannoglou, G.D.; Chatzizisis, Y.S.; Seralidou, K.V.; Parcharidis, G.E.; Louridas, G.E. Non-Newtonian models for molecular viscosity and wall shear stress in a 3D reconstructed human left coronary artery. Med. Eng. Phys. 2008, 30, 9–19. [Google Scholar] [CrossRef]
  41. Davies, J.E.; Whinnett, Z.I.; Francis, D.P.; Manisty, C.H.; Aguado-Sierra, J.; Willson, K.; Foale, R.A.; Malik, I.S.; Hughes, A.D.; Parker, K.H.; et al. Evidence of a dominant backward-propagating “suction” wave responsible for diastolic coronary filling in humans, attenuated in left ventricular hypertrophy. Circulation 2006, 113, 1768–1778. [Google Scholar] [CrossRef] [PubMed]
  42. Ni, M.-J.; Abdou, M.A. Temporal second-order accuracy of simple-type methods for incompressible unsteady flows. Numer. Heat Transf. Part B 2004, 46, 529–548. [Google Scholar] [CrossRef]
  43. Ku, D.N.; Giddens, D.P.; Zarins, C.K.; Glagov, S. Pulsatile flow and atherosclerosis in the human carotid bifurcation. Positive correlation between plaque location and low and oscillating shear stress. Arteriosclerosis 1985, 5, 293–302. [Google Scholar] [CrossRef] [PubMed]
  44. Himburg, H.A.; Grzybowski, D.M.; Hazel, A.L.; LaMack, J.A.; Li, X.-M.; Friedman, M.H. Spatial comparison between wall shear stress measures and porcine arterial endothelial permeability. Am. J. Physiol. Heart Circ. Physiol. 2004, 286, H1916–H1922. [Google Scholar] [CrossRef]
  45. Suess, T.; Anderson, J.; Danielson, L.; Pohlson, K.; Remund, T.; Blears, E.; Gent, S.; Kelly, P. Examination of near-wall hemodynamic parameters in the renal bridging stent of various stent graft configurations for repairing visceral branched aortic aneurysms. J. Vasc. Surg. 2016, 64, 788–796. [Google Scholar] [CrossRef]
  46. Morbiducci, U.; Gallo, D.; Massai, D.; Consolo, F.; Ponzini, R.; Antiga, L.; Bignardi, C.; Deriu, M.A.; Redaelli, A. Outflow conditions for image-based hemodynamic models of the carotid bifurcation: Implications for indicators of abnormal flow. J. Biomech. Eng. 2010, 132, 091005. [Google Scholar] [CrossRef]
  47. Barstad, R.M.; Roald, H.E.; Cui, Y.; Turitto, V.T.; Sakariassen, K.S. A perfusion chamber developed to investigate thrombus formation and shear profiles in flowing native human blood at the apex of well-defined stenosis. Arterioscler. Thromb. 1994, 14, 1984–1991. [Google Scholar] [CrossRef] [PubMed]
  48. Stone, G.W.; Kereiakes, D.J.; Gori, T.; Metzger, D.C.; Stein, B.; Erickson, M.; Torzewski, J.; Kabour, A.; Piegari, G.; Cavendish, J.; et al. 5-year outcomes after bioresorbable coronary scaffolds implanted with improved technique. J. Am. Coll. Cardiol. 2023, 82, 183–195. [Google Scholar] [CrossRef] [PubMed]
  49. Zhu, H.; Ding, Z.; Piana, R.N.; Gehrig, T.R.; Friedman, M.H. Cataloguing the geometry of the human coronary arteries: A potential tool for predicting risk of coronary artery disease. Int. J. Cardiol. 2009, 135, 43–52. [Google Scholar] [CrossRef]
  50. de Nisco, G.; Kok, A.M.; Chiastra, C.; Gallo, D.; Hoogendoorn, A.; Migliavacca, F.; Wentzel, J.J.; Morbiducci, U. The atheroprotective nature of helical flow in coronary arteries. Ann. Biomed. Eng. 2019, 47, 425–438. [Google Scholar] [CrossRef] [PubMed]
  51. de Nisco, G.; Hoogendoorn, A.; Chiastra, C.; Gallo, D.; Kok, A.M.; Morbiducci, U.; Wentzel, J.J. The impact of helical flow on coronary atherosclerotic plaque development. Atherosclerosis 2020, 300, 39–46. [Google Scholar] [CrossRef] [PubMed]
Figure 1. Stented region of coronary artery model with BVS (fine mesh).
Fluids 08 00241 g001
Figure 2. Surface meshes near stent struts in the BVS model.
Fluids 08 00241 g002
Figure 3. Average velocity over the cardiac cycle—in vivo data [41] and the generated Fourier series representation.
Fluids 08 00241 g003
Figure 4. Average velocity and wall shear stress in stented region calculated over 2.25 cardiac cycles.
Fluids 08 00241 g004
Figure 5. Streamlines of velocity between stent struts. The plane is cut to illustrate flow in the axial direction, from left to right along the artery. (a) BVS—peak velocity; (b) DES—peak velocity; (c) BVS—minimum velocity; (d) DES—minimum velocity.
Fluids 08 00241 g005
Figure 6. Wall shear stress in the stented region in the axial direction. (a) BVS—peak velocity; (b) DES—peak velocity; (c) BVS—minimum velocity; (d) DES—minimum velocity.
Fluids 08 00241 g006
Figure 7. Distributions of wall shear stress at peak and minimum flow velocities for the BVS and DES cases. (a) peak velocity; (b) minimum velocity.
Fluids 08 00241 g007
Figure 8. Areas of low TAWSS magnitude (one-third of the interior stented region). (a) BVS; (b) DES.
Fluids 08 00241 g008
Figure 9. Distribution of TAWSS in the stented region for the BVS and DES cases.
Fluids 08 00241 g009
Figure 10. Oscillatory shear index (one-third of the interior stented region). (a) BVS; (b) DES.
Fluids 08 00241 g010aFluids 08 00241 g010b
Figure 11. Relative residence time (one-third of the interior stented region). (a) BVS; (b) DES.
Fluids 08 00241 g011
Figure 12. Distribution of relative residence time in the stented region for the BVS and DES cases.
Fluids 08 00241 g012
Figure 13. Shear rate at peak velocity (one-third of the interior stented region). (a) BVS; (b) DES.
Fluids 08 00241 g013
Table 1. Mesh sizing parameters and refinement factors.
Parameter
Stent Design
FineMediumCoarse
BVSDESBVSDESBVSDES
Mesh elements2,681,4152,695,283659,490646,258196,442193,516
Mesh nodes1,354,0501,344,475346,514339,487108,203106,269
Refinement   factor   r i , i + 1 111.5751.5821.4741.473
Global element size0.045 mm0.0719 mm0.11 mm
Stent region element size0.0375 mm0.0625 mm0.1 mm
Stent face element size0.0188 mm0.0313 mm0.05 mm
Table 2. Grid convergence results summary.
MeshAWA WSS (Pa)%Decrease in AWA WSS as Mesh RefinedGCI
BVSDESBVSDESBVSDES
Fine1.3651.3490.51%1.24%0.483%1.58%
Medium1.3721.3660.94%1.94%1.121%3.118%
Coarse1.3851.393NANANANA
Table 3. Risk thresholds for evaluation parameters [24,45,46].
ParameterRisk Threshold
τ w /TAWSS<0.4 Pa
OSI>0.3
RRT>10 Pa−1
Shear rate>5000 s−1
Table 4. Absorb v Xience clinical findings [9].
Finding%OccurrenceRandom-Effect RR (95% Confidence Interval)
Absorb BVSXience DES
Target lesion failure11.7%8.1%1.37 (1.09–1.72)
Target vessel myocardial infarction7.8%4.2%1.68 (1.23–2.29)
Ischaemia-driven target lesion revascularisation6.6%4.4%1.41 (1.03–1.93)
Device thrombosis2.4%0.6%2.83 (1.27–6.31)
Table 5. Summary of risk areas.
ParameterAt-Risk Area (mm2)%Increase in Risk Area
BVSDES
τ w < 0.4 Pa—minimum velocity88.184.53.64.3%
τ w < 0.4 Pa—maximum velocity37.218.219104%
TAWSS < 0.4 Pa80.444.136.382.3%
OSI > 0.30000%
RRT > 10 Pa−125.57.518240%
Shear rate > 5000 s−10000%
Disclaimer/Publisher’s Note: The statements, opinions and data contained in all publications are solely those of the individual author(s) and contributor(s) and not of MDPI and/or the editor(s). MDPI and/or the editor(s) disclaim responsibility for any injury to people or property resulting from any ideas, methods, instructions or products referred to in the content.

