Article

Experimental Study on the Effect of the Angle of Attack on the Flow-Induced Vibration of a Harbor Seal’s Whisker

1
State Key Laboratory of Hydraulic Engineering Simulation and Safety, Tianjin University, Tianjin 300350, China
2
Key Laboratory of Hydrologic-Cycle and Hydrodynamic-System of Ministry of Water Resources, Nanjing 210024, China
*
Author to whom correspondence should be addressed.
Fluids 2023, 8(7), 206; https://doi.org/10.3390/fluids8070206
Submission received: 24 April 2023 / Revised: 6 July 2023 / Accepted: 11 July 2023 / Published: 14 July 2023
(This article belongs to the Special Issue Biological Fluid Dynamics)

Abstract

:
A harbor seal’s whisker is able to sense the trailing vortices of marine organisms due to its unique three-dimensional wavy shape, which suppresses the vibrations caused by its own vortex-shedding, while exciting large-amplitude and synchronized vibrations in a wake flow. This provides insight into the development of whisker-inspired sensors, which have broad applications in the fields of ocean exploration and marine surveys. However, the harbor seal’s whisker may lose its vibration suppression ability when the angle of attack (AoA) of the incoming flow is large. In order to explore the flow-induced vibration (FIV) features of a harbor seal’s whisker at various angles of attack ( θ = 0 90 ), this study experimentally investigates the effect of AoA on the vibration response of a whisker model in a wide range of reduced velocities ( U r = 3–32.2) and the Reynolds number, Re = 400–7000, in a circulating water flume. Meanwhile, for the sake of comparison, the FIV response of an elliptical cylinder with the same equivalent diameters is also presented. The results indicate that an increase in AoA enhances the vibration amplitude and expands the lock-in range for both the whisker model and the elliptical cylinder. The whisker model effectively suppresses vibration responses at θ = 0 due to its unique three-dimensional wavy shape. However, when θ 30 , the wavy surface structure gradually loses its suppression ability, resulting in large-amplitude vibration responses similar to those of the elliptical cylinder. For θ = 30 and 45 , the vibration responses of the whisker model and the elliptical cylinder undergo three vibration regimes, i.e., vortex-induced vibration, transition response, and turbulent-induced vibration, with the increasing U r . However, at θ = 60 and 90 , the vortex-shedding gradually controls the FIV response, and only the vortex-induced vibration is observed.

1. Introduction

For thousands of years, humans have created a series of biomimetic tools through observing, learning, and imitating from nature. Among them, marine organisms have inspired many biomimetic ideas for humans in ocean exploration, such as the sonar system invented by dolphins. Recently, it has been found that pinnipeds, such as harbor seals, can achieve accurate positioning of their prey without having a sonar system [1] and without relying on visual, auditory, or chemical signals [2,3,4,5,6,7]. This ability of harbor seals to sense the surrounding environments is attributed to their whiskers, which can identify hydrodynamic signals in the wake of swimming marine organisms [3]. This provides a promising tool for ocean exploration and marine surveying by using whisker-inspired sensors.
Harbor seals can identify hydrodynamic signals due to the unique three-dimensional periodic wavy shapes of their whiskers with a sinusoidal profile along the span [8]. This structural feature completely suppresses the flow-induced vibration (FIV) of the whiskers in a uniform flow while exciting periodic and large-amplitude vibrations in a wake flow, providing a higher signal-to-noise ratio (SNR) for the harbor seals to recognize hydrodynamic signals [8,9,10]. Hans et al. [11] found that the wavy structures of the whiskers can disrupt the coherent structures of vortex shedding in a uniform flow, thereby significantly reducing lift and suppressing vibration. Wang and Liu [12] compared the vortex-shedding frequencies at the saddle and nodal planes and found that the dominant vortex-shedding frequencies at the two planes are different, leading to complex and unsteady vortex shedding processes that suppress the FIV of the whiskers.
The FIV responses of harbor seal whiskers in a uniform flow are significantly influenced by variations in the angle of attack (AoA, θ ) due to their non-axisymmetric structure. Previous research on the suppression of FIV mainly focused on the scenario with θ = 0 , i.e., the major axis of the whisker is parallel to the oncoming flow direction, but the role of θ in suppressing flow-induced vibrations of the whisker is not fully understood. On the other hand, a harbor seal swings its head while swimming; therefore, the AoA of the incoming flow varies with time [4,13]. Therefore, it is important to understand how the FIV responses of whiskers change with varying angles of attack. Murphy et al. [14] investigated the FIV responses of whiskers at different angles of attack ( θ = 0 , 45 and 90 ) and showed that the amplitude of whisker vibration increases and the frequency decreases as the AoA increases. MIT researchers developed whisker-inspired flow sensors based on the whisker model [15,16,17,18], which demonstrated the significant role of the AoA in detecting flow direction. Wang and Liu [19] conducted wind tunnel experiments on the FIV of a whisker model at different angles of attack ( θ = 0 90 with an increment of 15 ), revealing that the whisker’s structure can leverage its FIV suppression when θ < 30 . Wake flows of genuine harbor seal whiskers were also examined by Bunjevac et al. [10] using particle image velocimetry (PIV), revealing that a larger AoA leads to higher vortex-shedding frequency and stronger flow instability. Kim and Yoon [20] conducted a numerical investigation of vortex structures, drag and lift coefficients, and vortex-shedding frequency of a harbor seal’s whisker and an ellipse cylinder at angles of attack ranging from 0 to 90 . They found that the whisker exhibits significantly reduced fluctuation lift and a first-increase-then-decrease behavior of the vortex-shedding frequency along the AoA. Recent studies provide valuable insights into the flow-sensing mechanisms and biomimetic potential of seal whiskers [21,22], as well as the trail-tracking capabilities and natural frequency measurements of whisker arrays [23,24].
From the above, it is apparent that most studies have focused on the wake flow and vibration responses of a harbor seal’s whisker at a zero AoA, with only a few investigating the effects of the AoA on whisker vibrations experimentally [10,13,15,16,17,18,19] or numerically [20]. Although Wang and Liu [19] systematically investigated the vibration responses of a whisker model at varying θ in a wind tunnel, the mass ratio of the whisker model in their test was two orders of magnitude higher than reality, which could significantly alter the dynamic responses. To the authors’ knowledge, the flow-induced vibration of an elastically supported rigid harbor seal whisker model in a water flume at a low mass ratio and with different angles of attack has not been studied. In this research, a series of experimental tests on the FIV of a harbor seal whisker model fabricated using the parameters proposed by Hanke et al. [8] were conducted in a circulating water flume. The vibration amplitude and frequency were investigated in a parametric space ( θ , U r ), where θ = 0 –90 and U r = U / ( f n w D ) = 3–32.2 are the reduced velocities. In the above, U is the free-stream velocity, f n w is the structural natural frequency in still water, and D is the equivalent diameter of the whisker model. The Reynolds number based on U and D is Re = U D / ν = 400–7000, where ν is the fluid kinematic viscosity. Additionally, to elaborate on the roles played by the whisker’s unique wavy shape, the FIV of an elliptical cylinder with the same equivalent diameters was investigated at different angles of attack.
The remaining sections of the paper are organized as follows. Section 2 details the experimental setup, while Section 3 presents the vibration responses of the whisker model and the elliptical cylinder at varying angles of attack. Finally, in Section 4, the main conclusions are summarized.

2. Experimental Setup

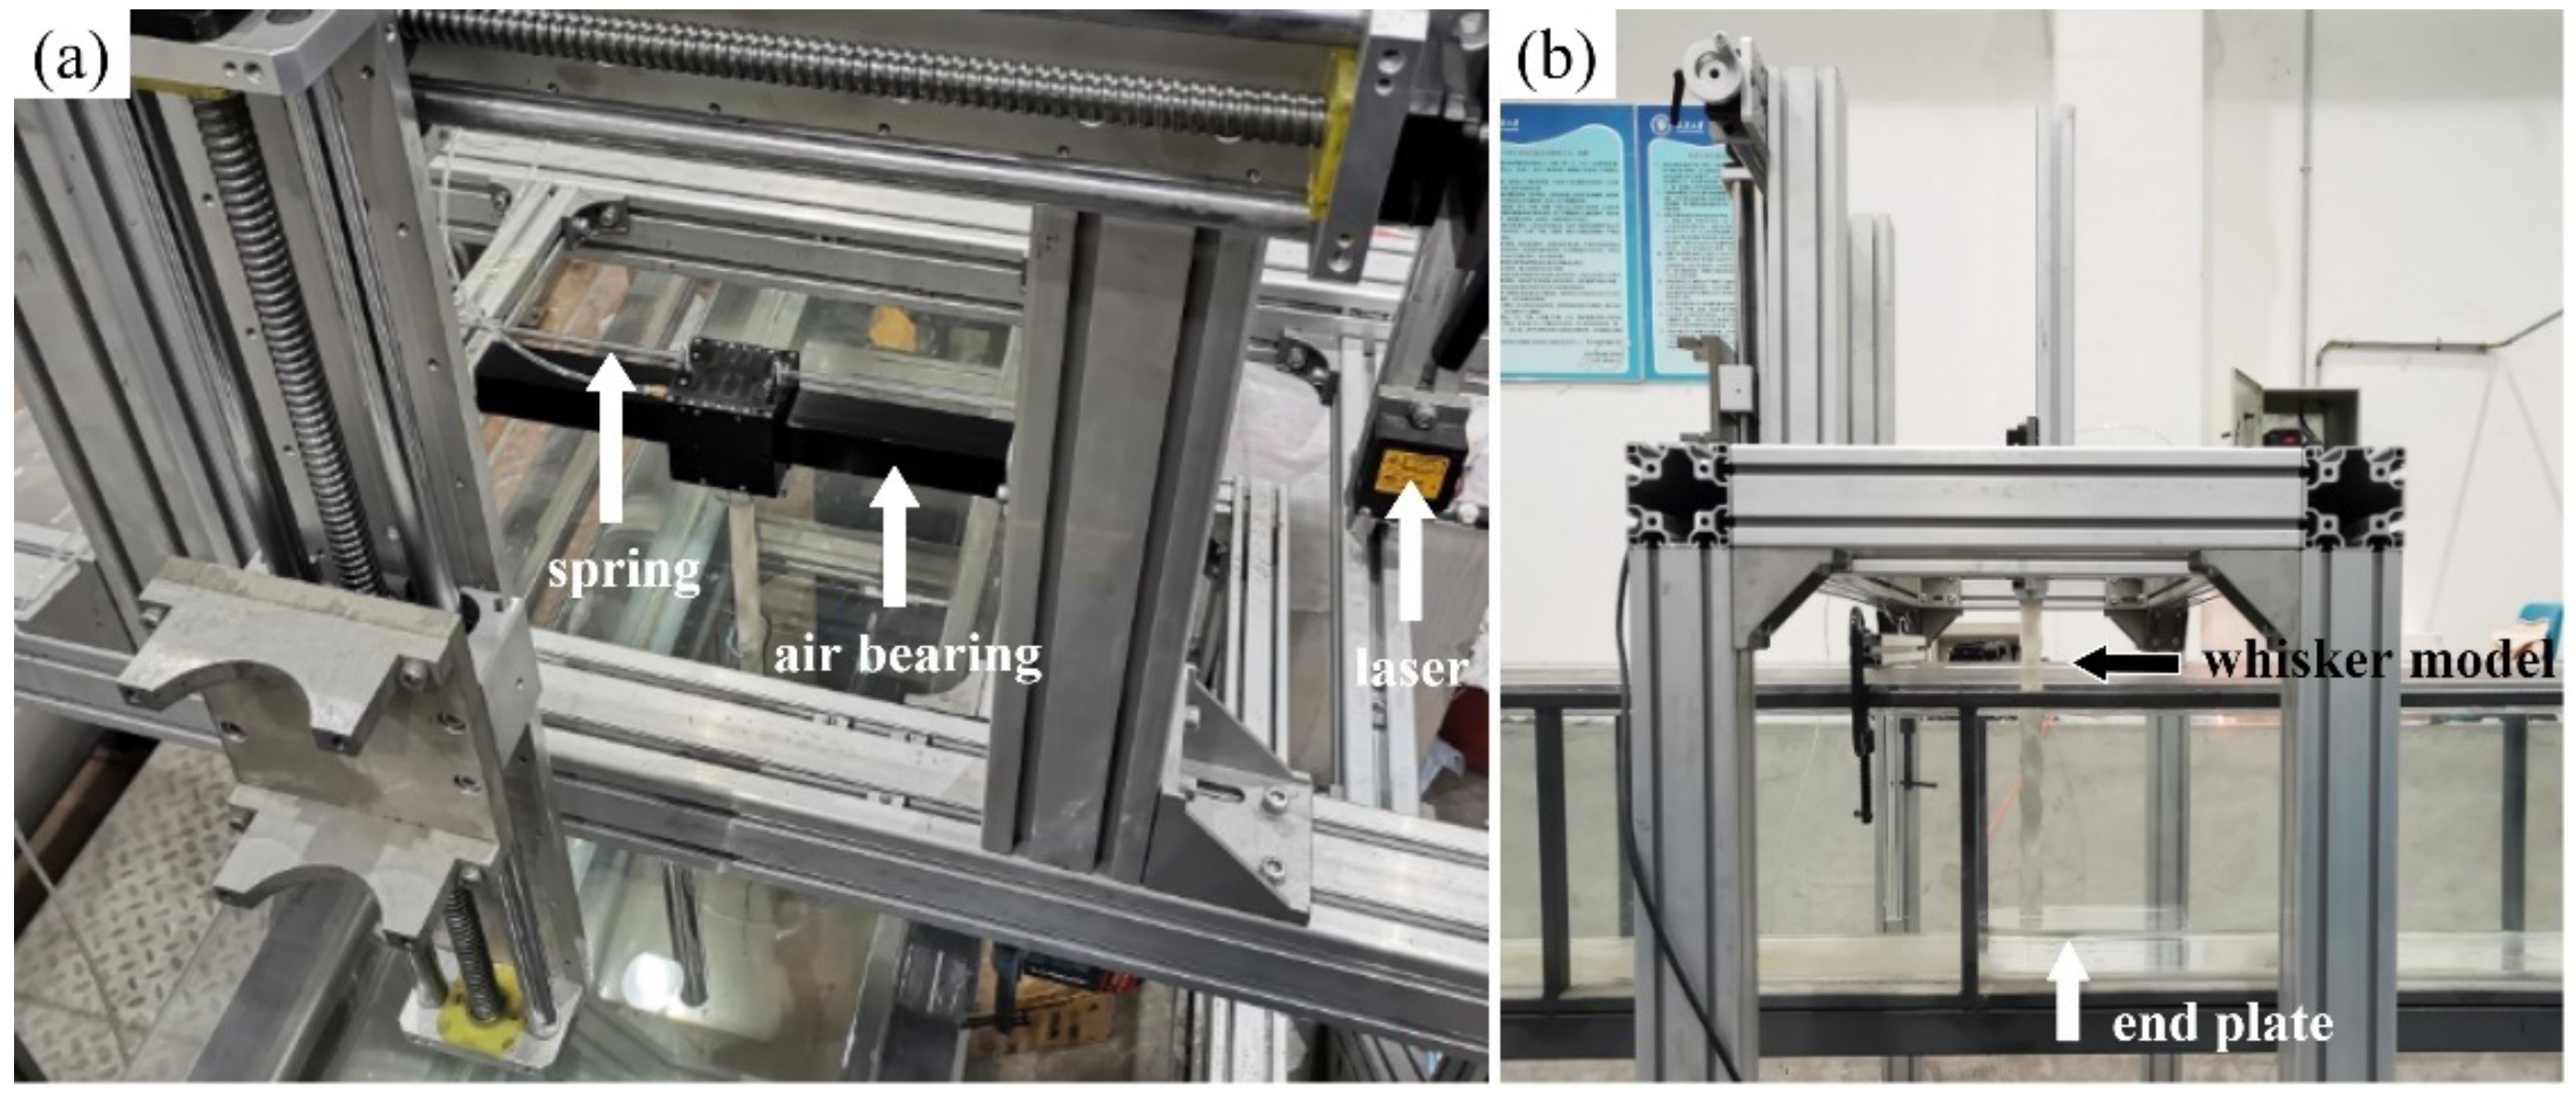
2.1. Experimental Apparatus

This experiment was performed in the low turbulence circulating water flume of the fluid mechanics laboratory at Tianjin University (Figure 1). The test section of the circulating water flume has a length of 2.370 m, a height of 0.400 m, and a width of 0.306 m. The water depth was kept at 0.330 m in the experiment, and the immersed depth of the whisker model was 0.273 m (Figure 2). The maximum flow velocity was U = 0.4 m/s, and the turbulence intensity was less than 1%.
The lower end of the whisker model is free, while the upper end is rigidly connected to a low-damping vibration measuring system (LODVMS), which comprises a low-damping air-bearing slider, a linear spring, a laser displacement sensor, a signal acquisition card, an aluminum experimental platform, and a data acquisition system. This system allows for low-damping single-degree-of-freedom vibration. The air-bearing slide used is the New Way S40-03075-38381, with a sliding length of 0.3048 m and an air pressure supply of 4.1 × 10 5 –5.5 × 10 5 Pa. The laser displacement sensor used is the Baumer ADM2016480/S14F, with a measurement range of 0.1–0.6 m, a resolution of 1.5 × 10 5 –6.7 × 10 4 m, and a linear error of ±5 × 10 5 –2 × 10 3 m. The maximum relative measurement uncertainty is 3.3 × 10 3 . The signal acquisition card used is the NI USB-6008, with a maximum sampling rate of 10 KS/s and a system noise of 5 mVrms under a single-ended ±10 V range. To eliminate the boundary layer effect at the bottom of the water flume and the three-dimensional effect of the model’s free end, an end plate is installed at the bottom of the water flume under the experimental model. The end plate consists of a 0.2 m diameter semicircular plate and a 0.2 m length square plate, with a thickness of 2.0 × 10 3 m. A very small gap of less than 2 × 10 3 m exists between the surface of the end plate and the free end of the whisker model (Figure 1b). By using the end plate near the free end, the tip vortices that significantly alter the hydrodynamic forces and, thus, change the vibration behaviors of the model, are significantly suppressed, and the flow becomes primarily two-dimensional.
For distance measurements, the laser displacement sensor emits a laser pulse, creating a fixed point on a reflection plate connected to the air-bearing slider that can move along a shaft in the cross-flow direction. By measuring the time it takes for the pulse to travel back and forth, the sensor calculates the distance between the laser and the reflection plate, as shown in Figure 2. The vibration signal obtained from the laser displacement sensor and data acquisition card was transmitted to a data acquisition system connected to a PC terminal. The signal was sampled at a frequency of 1000 Hz, which is significantly higher than the frequency of most vibration signals (approximately 1 Hz). A third-order Butterworth filter with a cut-off frequency of 20 Hz was used to low-pass filter the displacement signal and minimize the effect of background noise. Each set of conditions was tested for a duration of 120 s.

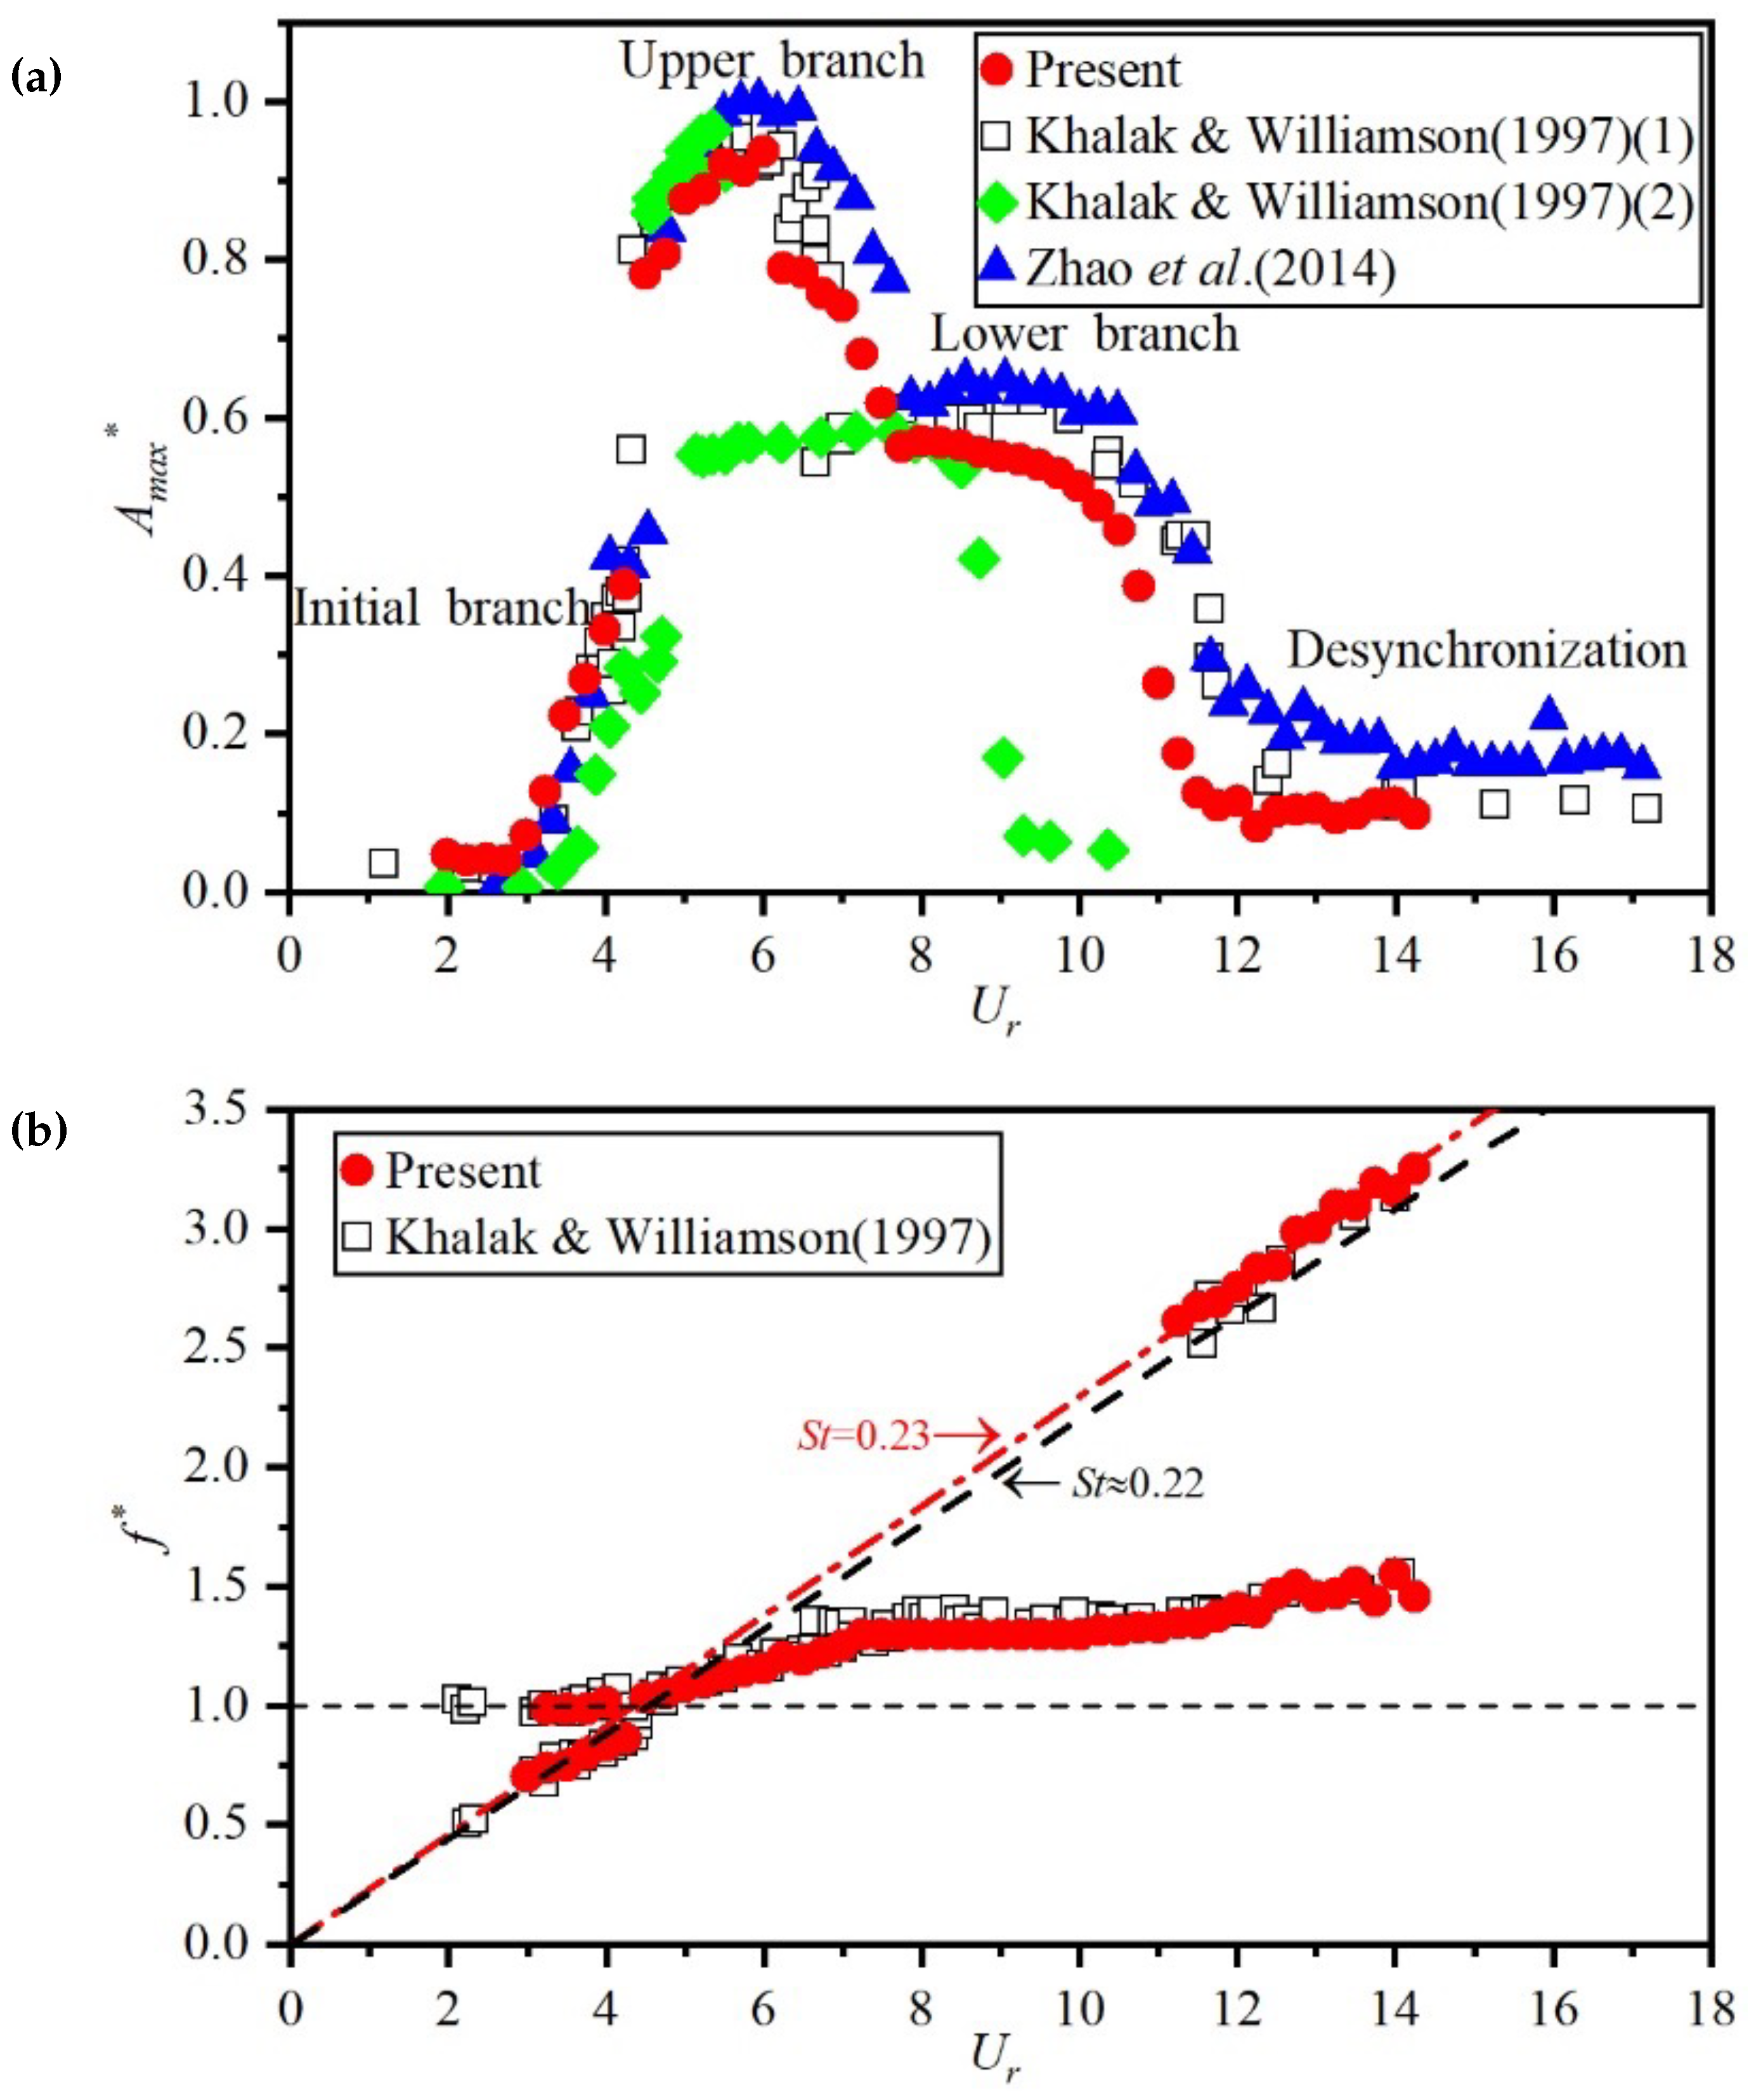
2.2. Verification of Experimental Setup
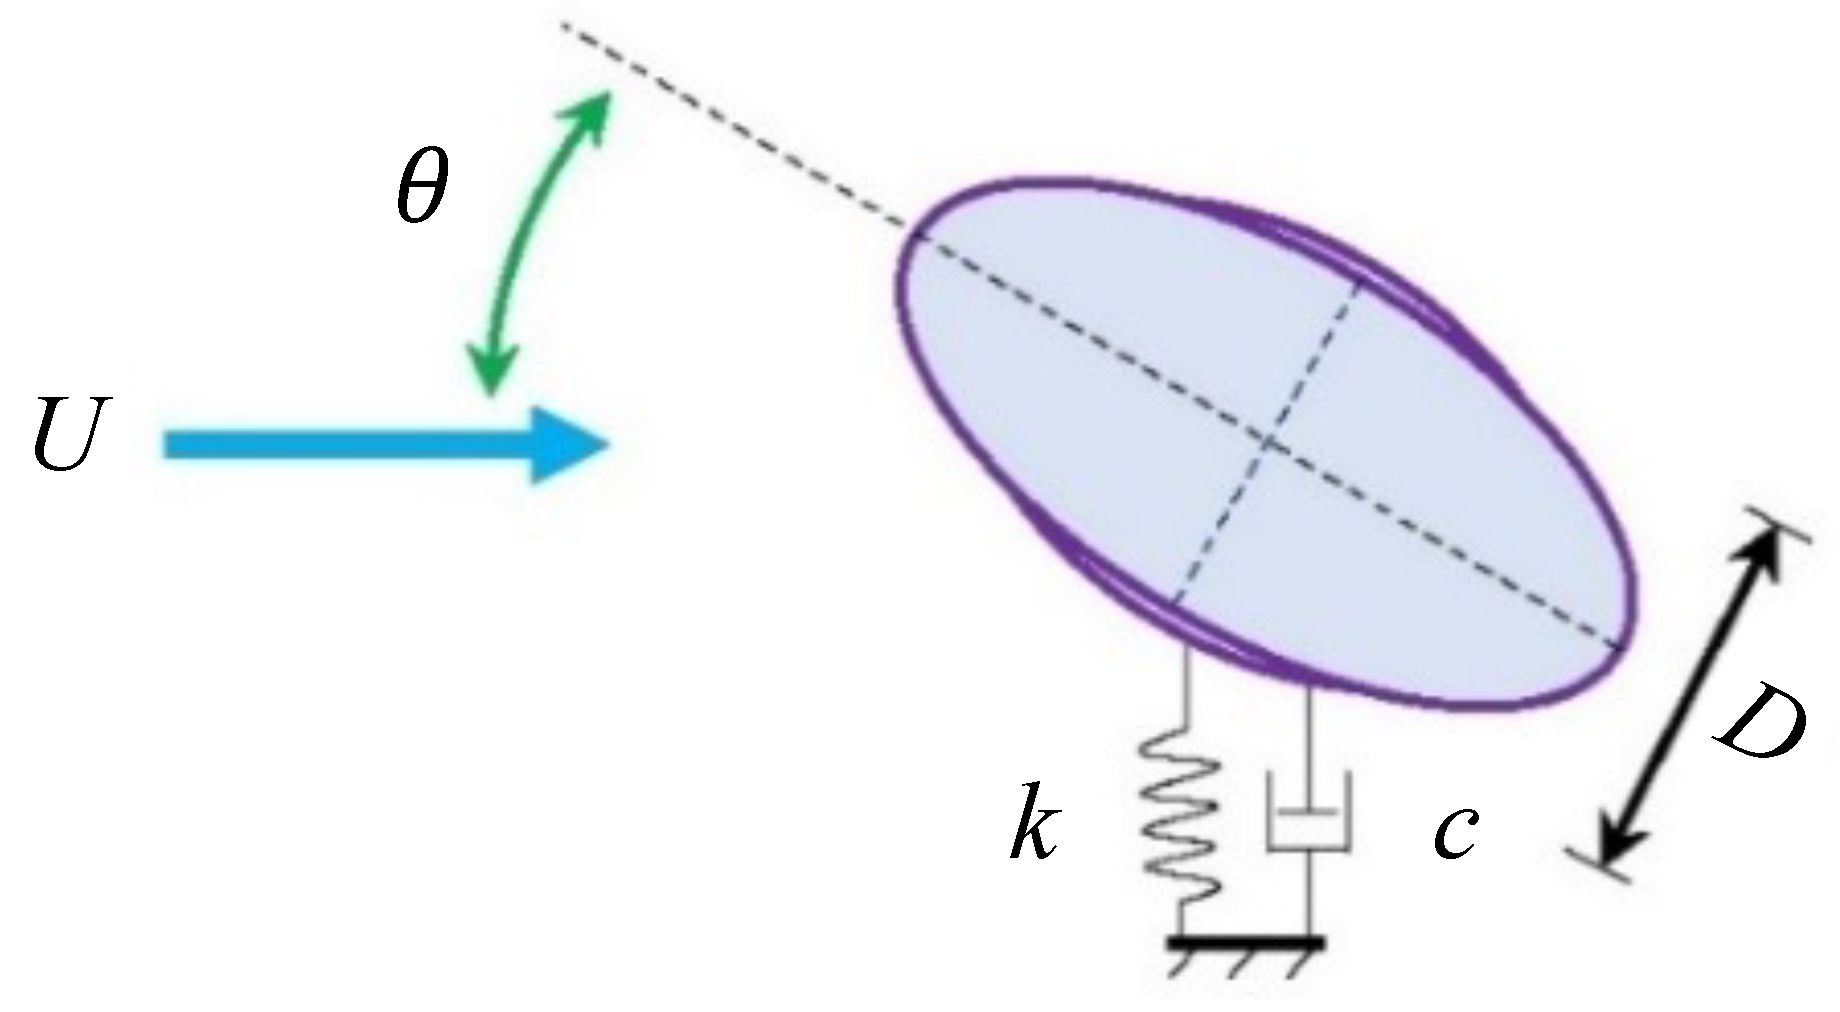
To ensure the experimental procedure’s reliability, a vortex-induced vibration (VIV) experiment on a single-degree-of-freedom isolated circular cylinder was conducted. The obtained results were then compared with those reported by Khalak and Williamson [25] and Zhao et al. [26]. The verification case’s experimental parameters are listed in Table 1, along with those adopted by Khalak and Williamson [25] and Zhao et al. [26]. The mass ratio is denoted by m , while the damping ratio of the system in the air is represented by ζ a i r .
In Figure 3, we compare the results of our experiment with those of previously published studies. The graph displays the non-dimensional maximum cross-flow amplitude ( A m a x = A m a x / D ) of the VIV of the cylinder as a function of the reduced velocity. Our results show good agreement with those in Khalak and Williamson [25] and Zhao et al. [26], except for a larger difference in the lock-in region with Khalak and Williamson [25] due to the difference in mass ratio. Additionally, Figure 3 displays the non-dimensional frequency f (= f / f n w , where f is the vibration frequency of the cylinder) of the VIV of the cylinder with the reduced velocity. Our experimental results successfully reproduce the lock-in phenomenon between the cylinder vibration frequency and the natural frequency, and are consistent with the results of Khalak and Williamson [25]. These comparison results demonstrate the high reliability of the experimental setup and methods used in our study.

2.3. Whisker Model

The study by Hanke et al. [8] established a whisker model with seven characteristic parameters, as shown in Figure 4, which was used in this study to investigate the effects of the AoA on FIV. The whisker model consists of alternating ellipses for the nodal plane and the saddle plane. The nodal plane ellipse has a long radius of a = 5.95 × 10 4 m and a short radius of b = 2.40 × 10 4 m, with an inclination angle of α = 15.27 . The saddle plane ellipse has a long radius of k = 4.75 × 10 4 m and a short radius of l = 2.9 × 10 4 m, with an inclination angle of β = 17.6 . The span-wise distance between the two planes is M = 9.1 × 10 4 m. The equivalent diameters d and d w i d e of the whisker are defined as the mean values of the diameters at the nodal and saddle planes, i.e., d = ( 2 b + 2 l ) / 2 = 5.3 × 10 4 m and d w i d e = ( 2 a cos α + 2 k cos β ) / 2 = 1.027 × 10 3 m. Note that the inclination angles are considered when calculating the equivalent diameter along the major axis.
In this study, the whisker model was enlarged by a factor of 30, with equivalent diameters of D = 1.59 × 10 2 m and D w i d e = 3.08 × 10 2 m, as shown in Figure 4, for accurate measurements of the vibration responses. To investigate the effects of the whisker’s wavy shape on FIV, an elliptical cylinder with the same equivalent diameters was used, but with periodic variations in radii and inclination angles along the span removed. The whisker model and the elliptical cylinder were fabricated using high-precision 3D printing with resin material.
Figure 5 shows a schematic diagram of the mechanical setup for the whisker model in a uniform flow, where the spring stiffness coefficient is k = 25.78 N/m, the mass ratio of the whisker model is m = 9.38, the damping ratio in air is ζ a i r = 5.78 × 10 3 , and the natural frequency in the air is f n a = 0.847 Hz. The mechanical schematic for the elliptical cylinder is similar to that of the whisker model, with m = 9.31, ζ a i r = 4.42 × 10 3 and f n a = 0.845 Hz. Here, the natural frequencies of the whisker model and the elliptical cylinder were measured by conducting free-decay tests in a quiescent fluid. In these tests, the body was initially displaced from its balanced position, and the resulting vibration was recorded to determine the vibration period. The natural frequency was then calculated as the reciprocal of the vibration period. The natural frequency of the body in water is generally lower than the natural frequency in the air (see Table 2); due to the added mass effects-the accelerated fluid surrounding the vibrating body increases the effective vibrating mass and reduces the natural frequency. Note that the density of water is approximately 830 times that of air, resulting in more significant added mass effects in water. The AoA ranges from 0 to 90 for both the whisker model and the elliptical cylinder. Due to the difference in the flow structure surrounding the whisker model and the elliptical cylinder at different angles of attack, their added mass and natural frequencies in water f n w vary with θ , as listed in Table 2.

3. Results and Discussions

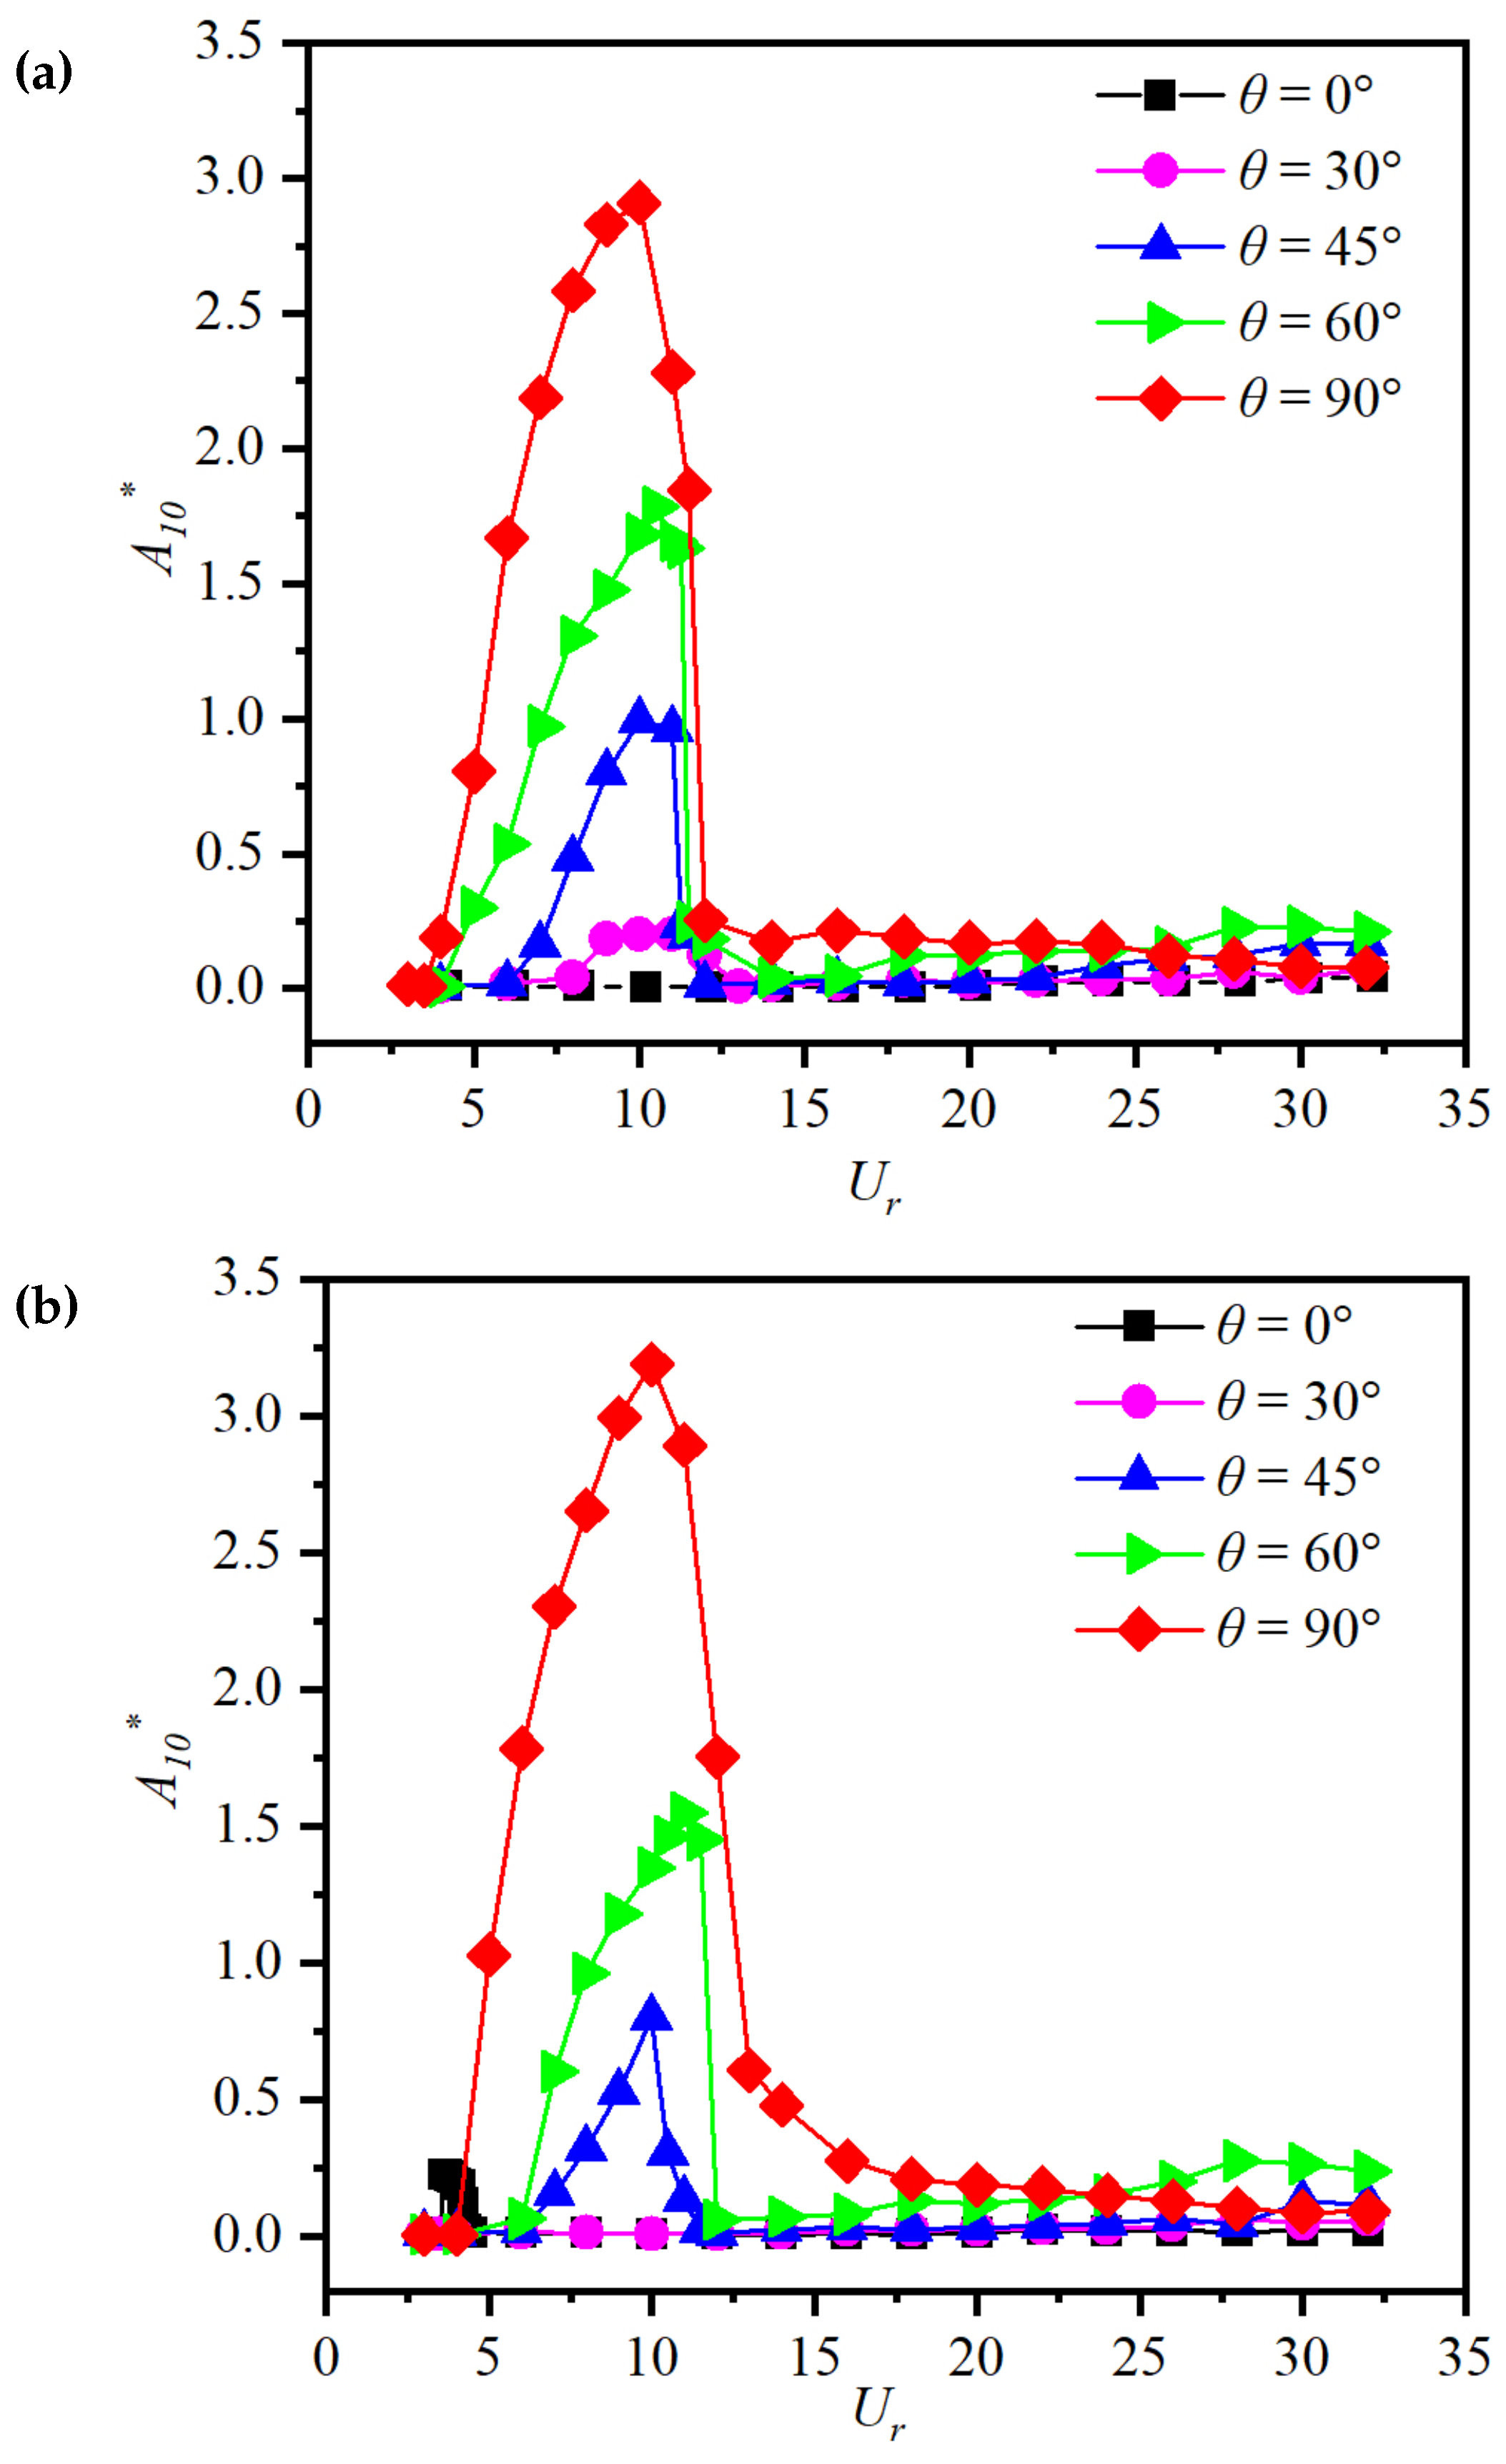
3.1. Vibration Amplitude

In this section, the FIV of the whisker model and elliptical cylinder at various angles of attack are examined. Figure 6 presents the non-dimensional amplitude A 10 = A 10 / D (where A 10 is the average of the first 10% of the amplitude) of the whisker model and elliptical cylinder at different angles of attack against the reduced velocity. Figure 6a reveals that at θ = 0 , the whisker model shows weak vibration across the entire range of reduced velocity, indicating its superior ability to suppress VIV. This can be attributed to the unique wavy shape of the whisker model, which leads to the formation of complex three-dimensional vortex structures. These structures, as shown in Figure 5 of Hanke et al. [8], reduce the strength of the primary vortices. As stated by Hanke et al. [8], these weakened and downstream-shifted primary vortices contribute to a smaller lift. Additionally, the presence of varying phases of vortex shedding on different span-wise locations further disrupts the correlation of the lift force. Different from the vibration response of the whisker model, the elliptical cylinder exhibits a narrow VIV lock-in region ( U r = 3.5–4.6) with a maximum A 10 of only 0.22 at this AoA, as shown in Figure 6b. This narrow lock-in response of the elliptical cylinder is caused by the vortex shedding, which is well-documented in Zhao et al. [27]. Note that, the lock-in is identified by observing the matching of the vibration frequency with the natural frequency, accompanied by significant vibration amplitudes.
As θ increases to 30 , the whisker model starts to display the VIV response. A further increase in the AoA leads to a higher vibration amplitude and a wider lock-in range. For example, A 10 increases from 0.2 at θ = 30 to 2.9 at θ = 90 , which is significantly larger than the VIV amplitude A 10 1.0 of a circular cylinder, even if the amplitude is normalized by using the major equivalent diameter D w i d e . Although the ending of the lock-in region ( U r 12) seems to be independent of the AoA, the beginning of the lock-in region extends to a smaller reduced velocity at a higher θ , resulting in an expanding lock-in region, with an increase in AoA. In the wind tunnel experiment by Wang and Liu [19], the AoA at which the whisker model starts to exhibit noticeable VIV is θ = 45 because of the very high mass ratio ( m = 500) of the whisker model in their experiment. When the mass ratio is higher, the whisker model necessitates greater flow instability to initiate vibration. In reality, the mass ratio of harbor seal whiskers is about 1.0 [28]; thus, the results of the present study are closer to the vibration characteristics of a genuine harbor seal’s whisker.
Figure 6b demonstrates that, unlike the whisker model, the elliptical cylinder remains ‘silent’ across the reduced velocity range at θ = 30 . At a larger AoA, the VIV responses of the elliptical cylinder show similar variations with the reduced velocity, compared to those of the whisker model. Additionally, concerning the maximum amplitude, the elliptical cylinder has a smaller amplitude at θ = 45 and 60 but a larger one at θ = 90 . That is, the peak values of A 10 are 2.9 and 3.2 for the whisker model and the elliptical cylinder at θ = 90 , respectively. We should note that the vibration amplitudes are normalized using the minor equivalent diameters D. If the cross-flow dimension D w i d e at θ = 90 is applied, the peak amplitudes are 1.45 and 1.6, respectively, which are comparable to A 10 = 1.5 for the VIV of an elliptical cylinder in Zhao et al. [27].

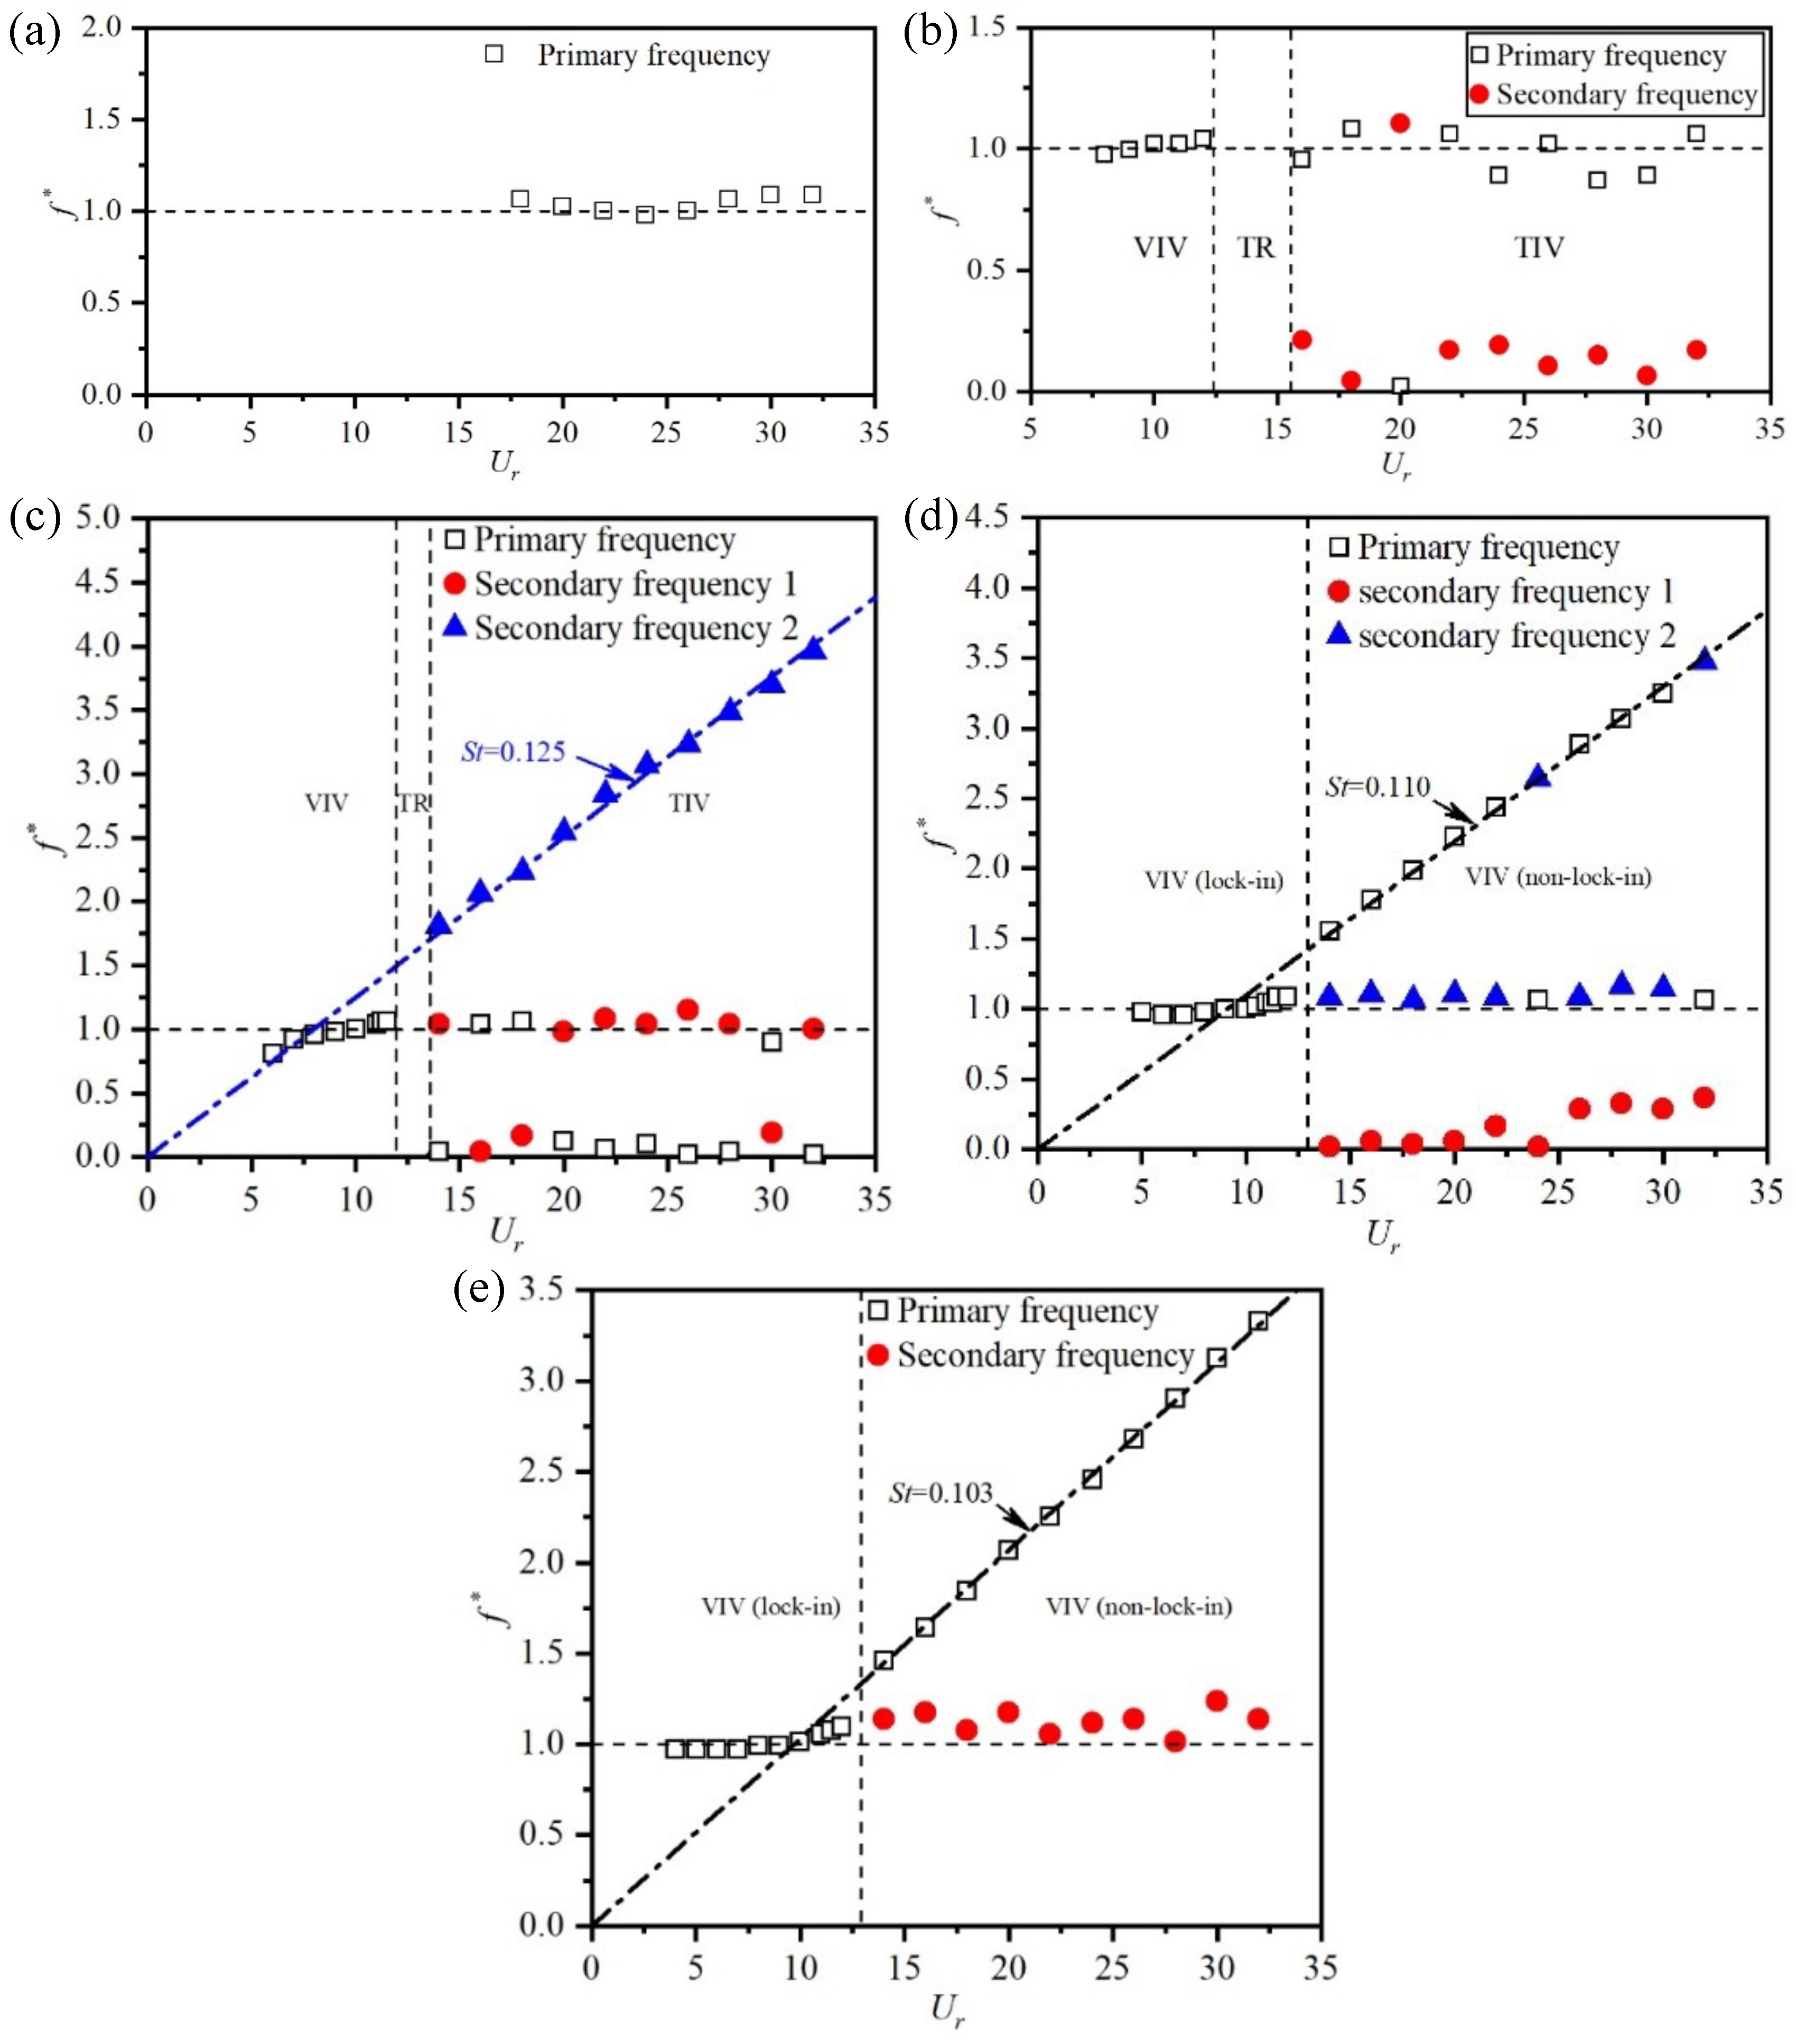
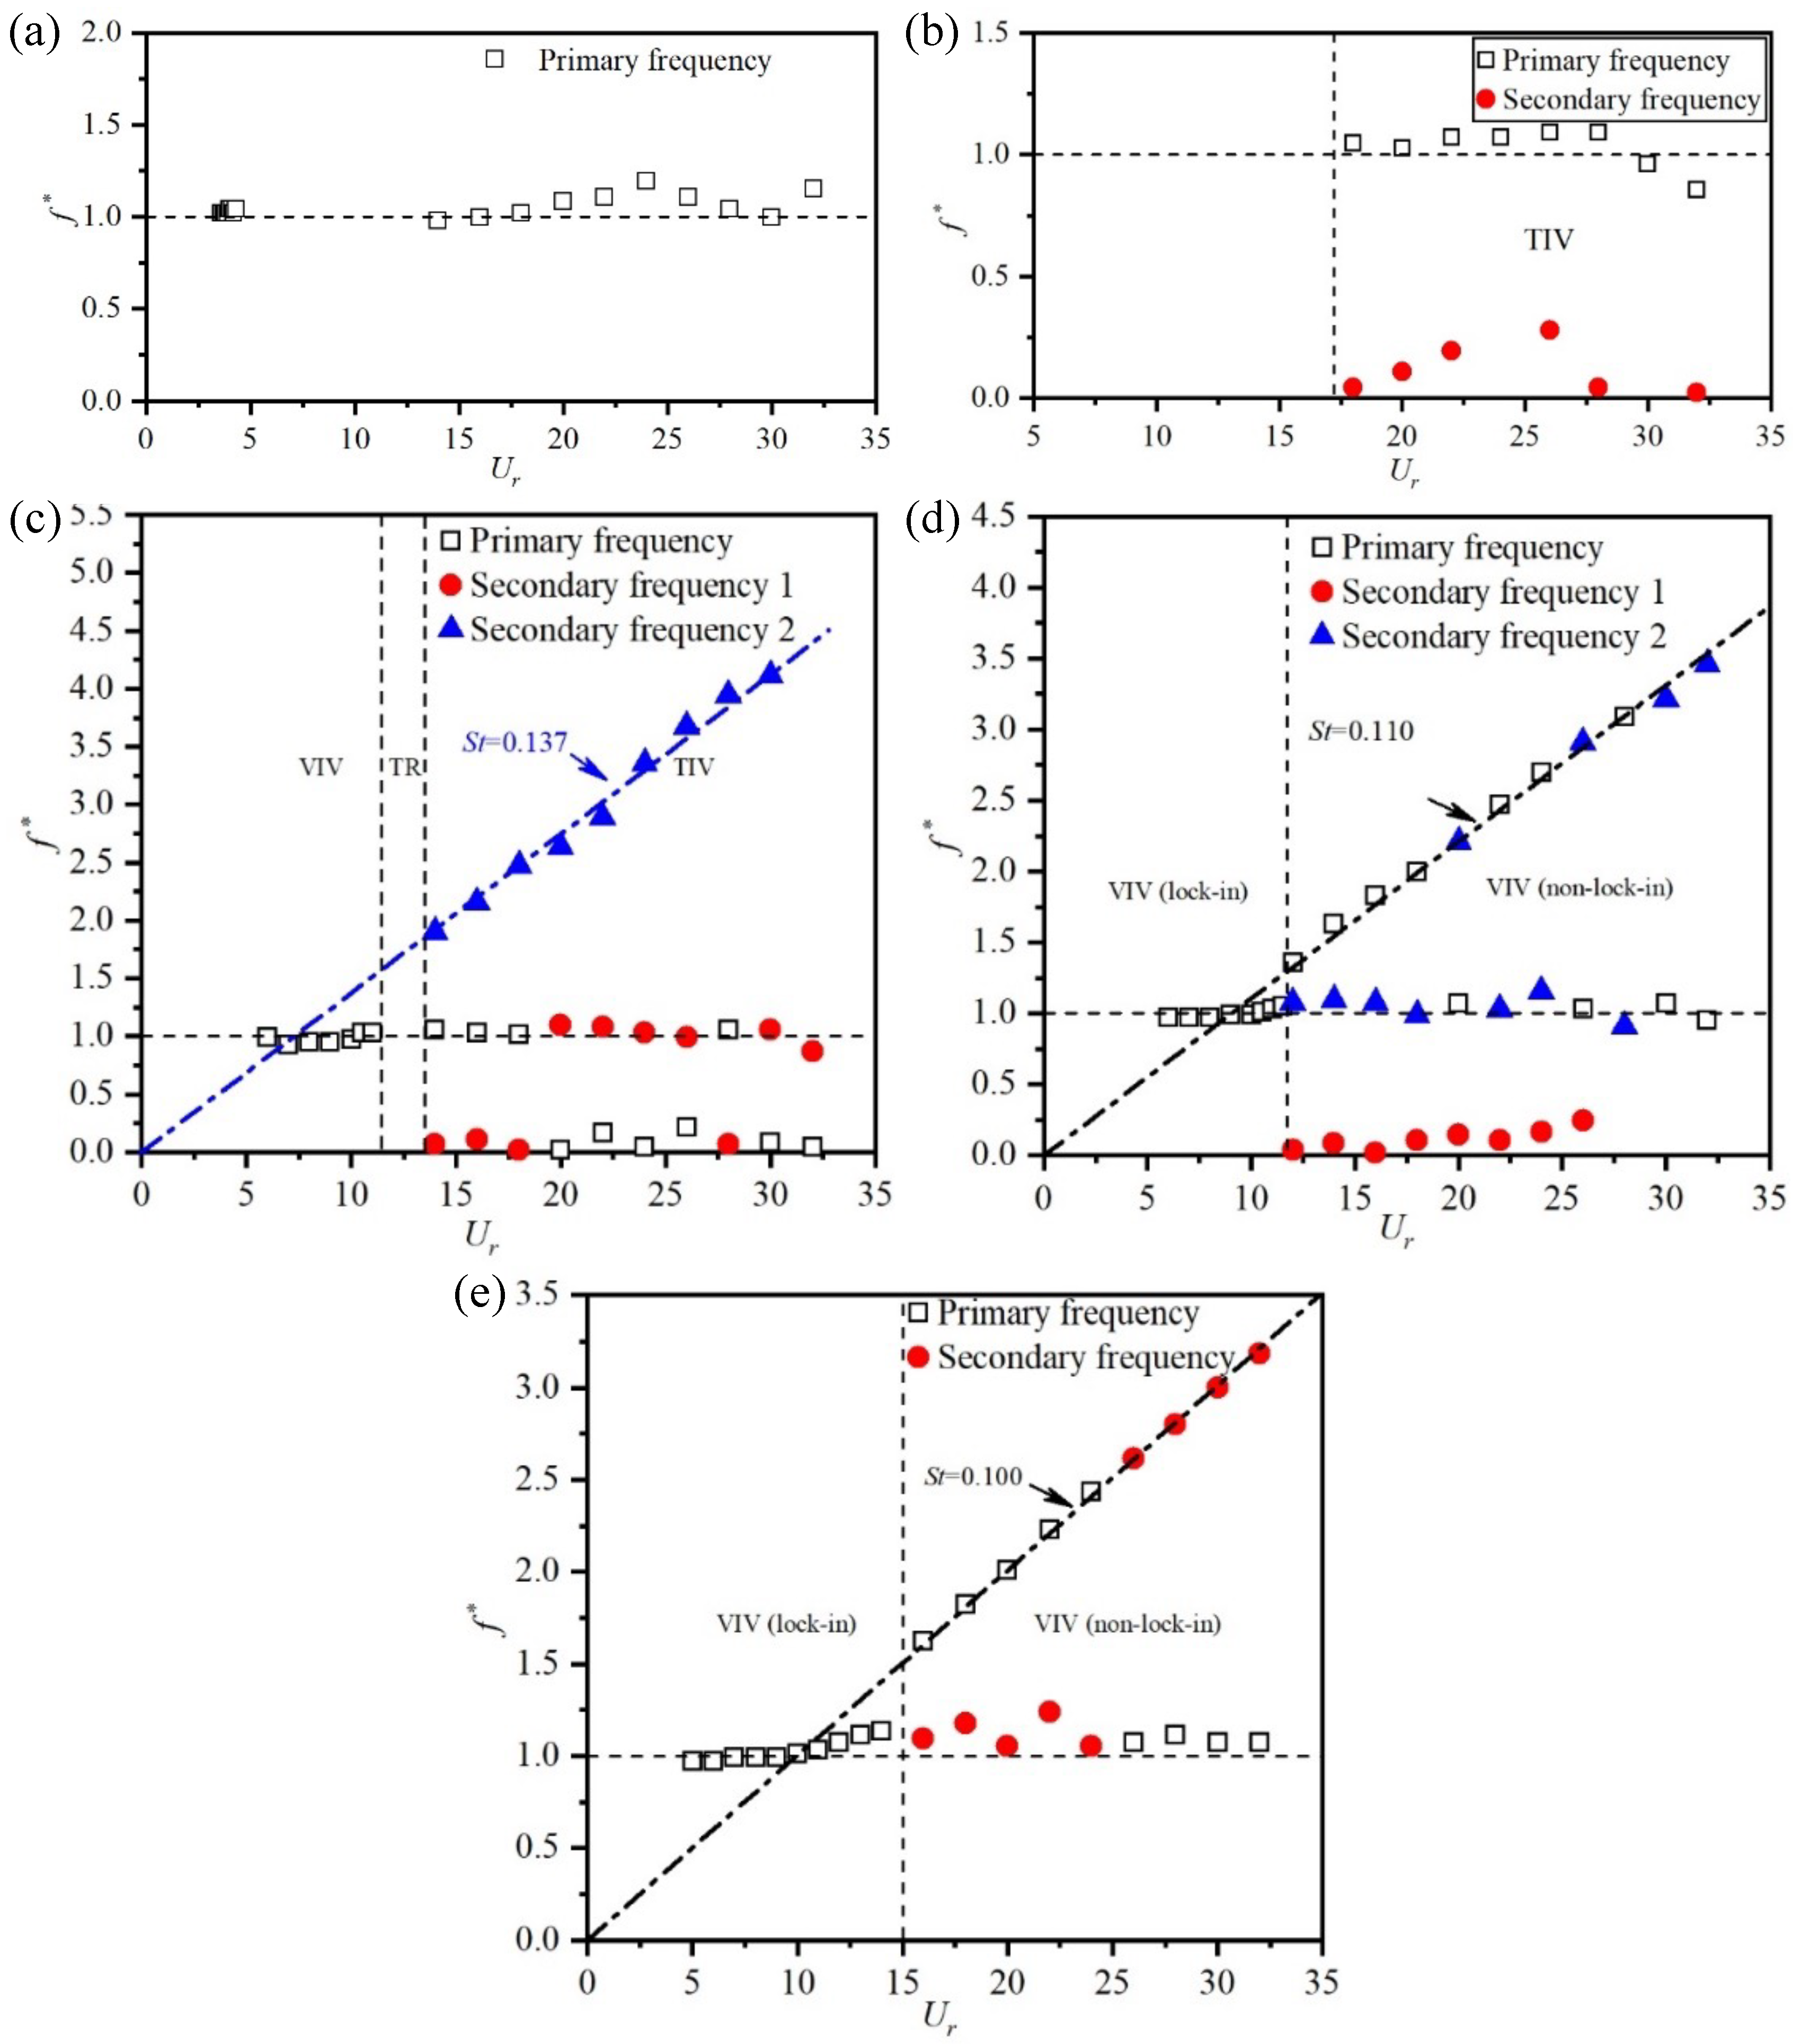
3.2. Vibration Frequency

Figure 7 and Figure 8 show the variations of the non-dimensional vibration frequency f of the whisker model and the elliptical cylinder with the reduced velocity under different angles of attack. Here, the vibration frequency is obtained by performing fast Fourier transform (FFT) on the displacement time history. The open squares in the figures represent the primary frequency, while the red solid circles and blue solid triangles represent significant secondary frequencies.
When θ = 0 , it can be seen from Figure 7a that there is no detected vibration frequency at U r < 18 because the whisker model does not vibrate at all. However, at U r > 18, the whisker model exhibits vibration frequencies near its natural frequency due to the perceivable vibration provoked by the turbulent incoming flow at high velocity. Note that this small-amplitude turbulent-induced vibration (TIV) in the high- U r region is not related to the vortex shedding of the whisker model and, thus, the vibration frequencies following an inclined line are not observed in the figure.
Figure 7b shows f with increasing reduced velocity for the whisker model at θ = 30 . The whisker model undergoes VIV at 8 < U r < 12, where the vortex-shedding frequency is well locked to the vibration frequency close to the natural frequency. Resonance occurs and leads to large-amplitude vibrations. At 12 < U r < 16, the vibration of the whisker model is completely suppressed, without any identified vibration frequency. Beyond U r = 16, the whisker model starts to exhibit small-amplitude TIV extending up to the maximum reduced velocity tested. Compared to the TIV response at θ = 0 , a very low secondary frequency emerges due to the beating vibration of the whisker model. Based on the features of the vibration amplitude and frequencies, three vibration regimes are classified as VIV (8 < U r < 12), transition (TR, 12 < U r < 16), and TIV ( U r > 16).
Similar to the case at θ = 30 , the whisker model at θ = 45 goes through three regimes, i.e., VIV, TR, and TIV, with increasing reduced velocity. However, the f of the whisker model shows significant changes in the TIV regime compared to the case at θ = 30 . As shown in Figure 7c, in the TIV regime, besides the higher frequency indicating the vibration frequency near the natural frequency and the lower frequency representing the beating frequency, a significant secondary frequency closely following the Strouhal number St = f v D / U = 0.125 (see the blue dash-dot line in Figure 7c) is identified, where f v is the vortex-shedding frequency of a stationary whisker model. This indicates that the vortex shedding of the whisker model starts to affect the TIV response at this AoA. However, due to the significant difference between the vortex-shedding frequency and the dominant vibration frequency, the small-amplitude vibration at U r 14 is not excited by the vortices shed from the whisker model. Instead, because the turbulent incoming flow has a wide and continuous spectrum, with the increasing flow velocity and turbulent intensity, the spectral components with frequencies close to the natural frequency of the model excite the vibration of the model. Additionally, in the TIV regime, the dominant frequency switches back and forth between the resonance frequency and the beat frequency. Because the two frequencies are both related to the turbulent incoming flow, the whisker model is still controlled by TIV.
A transition occurs at θ = 60 , where the dominant frequency at U r > 13 shifts to the Strouhal number at St = 0.110, as shown in Figure 7d. Compared to the dominant frequency, the resonance frequency and the beat frequency are minor, indicating that the vibration response is governed by vortex-induced vibration. In this regard, the vibration response of the whisker model at θ = 60 is classified as VIV, with lock-in occurring in the range of 5 < U r < 13. Beyond U r = 13, the vibration frequency deviates from the natural frequency, signifying desynchronization. Compared to the vibration response observed at θ = 45 , the whisker model starts to vibrate at a lower reduced velocity, which is consistent with the previous observation that the beginning of the lock-in region extends to a smaller reduced velocity at a higher θ . It is worth noting that, in the non-lock-in region, the dominant frequency occasionally switches between the vortex-shedding frequency (the Strouhal number) and the resonance frequency, whereas at θ = 30 and 45 , the dominant frequency switches between the resonance and beat frequencies. This can be attributed to the stronger vortex shedding at higher angles of attack due to the compromised streamlined shape of the whisker model.
At θ = 90 , the vibration frequency is completely dominated by the vortex-shedding frequency in the non-lock-in region, with no switching between frequencies observed. Moreover, at this AoA, the beat vibration frequency disappears, further indicating the predominant roles played by vortex shedding on the vibration response of the whisker model.
Figure 8 shows the non-dimensional vibration frequency of the elliptical cylinder at varying AoA. Generally, the frequency responses of the elliptical cylinder are quite like those of the whisker model, despite some subtle differences in dominant frequency switching and the values of the Strouhal number.
Table 3 summarizes the non-dimensional vortex-shedding frequencies of the whisker model and the elliptical cylinder, i.e., the St numbers, at different angles of attack. Because there is not a dominant frequency in the cases with θ = 0 and 30 , only the dominant frequencies at θ = 45 90 are listed in the table. It can be seen that the St number gradually decreases as θ increases, indicating that the vortex shedding has a lower frequency at a larger AoA. This is easy to understand since the whisker model and the elliptical cylinder have a larger blockage diameter at a larger θ , and a wider bluff body sheds vortices slower. Additionally, at θ = 45 , the St number of the whisker model is slightly lower than that of the elliptical cylinder, while at θ = 60 and 90 , the two values are almost identical.

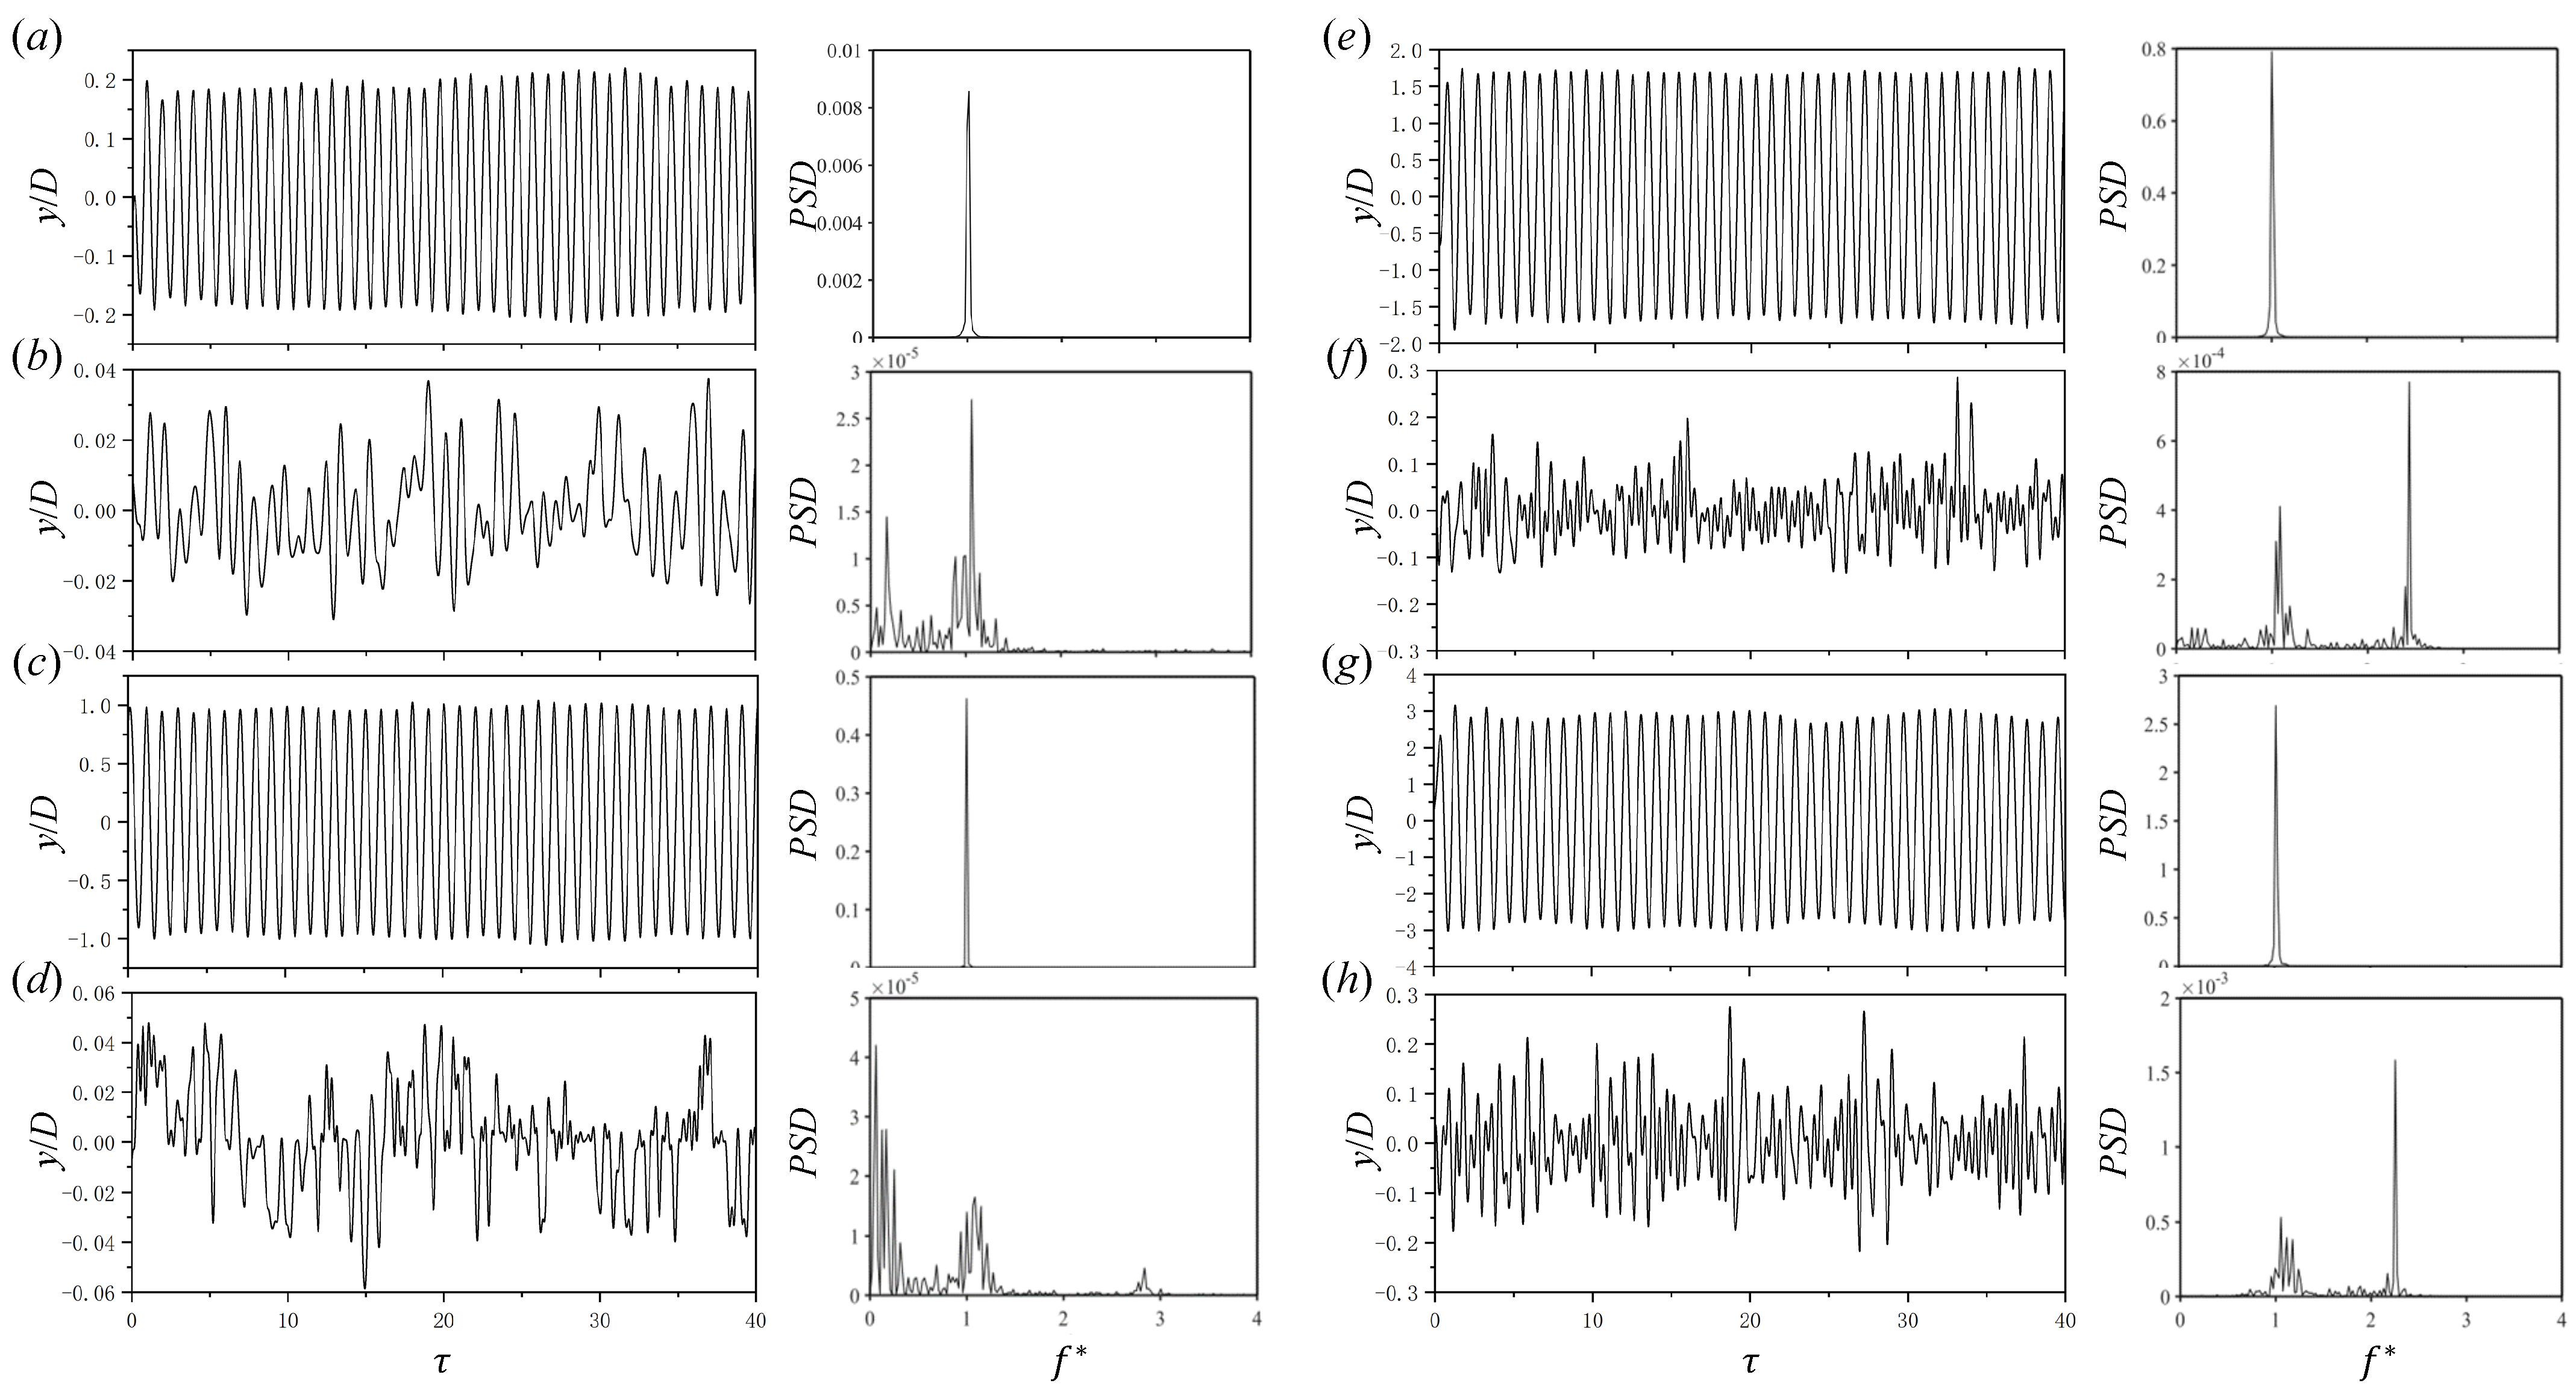
3.3. Displacement Time History and Vibration Spectra

To further illustrate the vibration response of the whisker model under different angles of attack, Figure 9 shows the displacement time history and vibration spectra of the whisker model. Here, two reduced velocities, i.e., U r = 10 and 22, are selected, representing the large-amplitude locked VIV response and the small-amplitude TIV or non-locked VIV response, respectively. In the figure, τ = t f n w is the non-dimensional time, and the displacement data over the entire time span (about 40 vibration cycles) shown in the left column subplots are used in calculating the power spectral density (PSD).
The displacement time history reveals that the whisker model’s vibration is stable and periodic in the large-amplitude VIV regime, as depicted in Figure 9a,c,e,g. This is reflected in a pure PSD with only one peak. Conversely, in the small-amplitude TIV regime, the time history is unstable and aperiodic, with the corresponding spectra exhibiting multiple peaks surrounded by many spikes, as shown in Figure 9b,d. In contrast to the resonance frequency dominating at f = 1 at θ = 30 , the low beating frequency dominates the spectrum at θ = 45 , with a high vortex-shedding frequency near f = 2.8. Due to the vortex-shedding frequency, the displacement time history in Figure 9d displays small but fast fluctuations, which are absent in Figure 9b. Results of the non-locked-in VIV regime in Figure 9f,h exhibit similar features to the dominant vortex-shedding frequency.
The vibration of the whisker model becomes more prominent with an increase in the AoA, regardless of the vibration regime. This indicates that the ability of the whisker model to suppress VIV is considerably weakened as the AoA increases. Meanwhile, the vibration of the whisker model is increasingly governed by vortex shedding.

4. Conclusions

This study examined the impact of the angle of attack on the vibration response of a whisker model in uniform flow and compared it with the vibration response of an elliptical cylinder under similar conditions. Five sets of conditions with θ = 0 , 30 , 45 , 60 , and 90 were chosen, and the vibration responses of the whisker model and elliptical cylinder were studied within the reduced velocity range of U r = 3–32.2. The key findings are as follows:
  • The vibration amplitude of the whisker model increases continuously with the angle of attack, reaching a maximum of A 10 = 2.9 at θ = 90 .
  • As the angle of attack increases, the reduced velocity at which the whisker model begins to vibrate decreases, and the lock-in regime range expands.
  • The vibration response of the elliptical cylinder is similar to that of the whisker model under various angle-of-attack conditions, except at θ = 0 and 30 .
  • For θ = 30 and 45 , the vibration response of the whisker model undergoes three vibration regimes as the reduced velocity increases: VIV, TR, and TIV.
  • At θ = 60 and 90 , the TR and TIV regimes disappear, and the vibration response of the whisker model is dominated by VIV.
These findings indicate that the vibration responses of the whisker model significantly depend on the angle of attack. At a large angle of attack, the wavy surface structure of the whisker model gradually loses its suppression ability. Regarding the development of whisker-inspired sensors, it is necessary to align the whisker model with the oncoming flow.
In this study, we experimentally investigated the FIV features of a whisker model in uniform flows, with the aim of developing whisker-inspired sensors. However, only the vibration displacement of the model was measured. In future studies, the hydrodynamic forces on the whisker model will be investigated using a load cell, which will complement the displacement signals. Future studies may also consider flow visualization using PIV techniques, which are valuable for understanding the underlying physics by showing the complex flow structures surrounding the whisker model. Moreover, in this study, the vibration characteristics of the whisker model in uniform flows were investigated. Future studies may further investigate the FIV features of the whisker model in the wake of bluff bodies at different angles of attack.

Author Contributions

Conceptualization, Y.W., C.J., and L.S.; methodology, C.J.; validation, Y.W. and L.S.; formal analysis, Y.W., C.J., and L.S.; resources, C.J. and D.Y.; data curation, Y.W. and L.S.; writing—original draft preparation, Y.W.; writing—review and editing, C.J., D.Y., and D.X.; visualization, Y.W.; supervision, C.J.; funding acquisition, C.J. All authors have read and agreed to the published version of the manuscript.

Funding

This research was funded by the National Key R&D Program of China (2022YFB2603000) and the National Natural Science Foundation of China (51779172 and 52179076).

Data Availability Statement

The data that support the findings of this study are available within the article.

Conflicts of Interest

The authors declare no conflict of interest.

References

  1. Watkins, W.A.; Wartzok, D. Sensory biophysics of marine mammals. Mar. Mammal Sci. 1985, 1, 219–260. [Google Scholar] [CrossRef]
  2. Dehnhardt, G.; Kaminski, A. Sensitivity of the mystacial vibrissae of harbour seals (Phoca vitulina) for size differences of actively touched objects. J. Exp. Biol. 1995, 198, 2317–2323. [Google Scholar] [CrossRef]
  3. Dehnhardt, G.; Mauck, B.; Bleckmann, H. Seal whiskers detect water movements. Nature 1998, 394, 235–236. [Google Scholar] [CrossRef]
  4. Dehnhardt, G.; Mauck, B.; Hanke, W.; Bleckmann, H. Hydrodynamic trail-following in harbor seals (Phoca vitulina). Science 2001, 293, 102–104. [Google Scholar] [CrossRef]
  5. Wieskotten, S.; Dehnhardt, G.; Mauck, B.; Miersch, L.; Hanke, W. Hydrodynamic determination of the moving direction of an artificial fin by a harbour seal (Phoca vitulina). J. Exp. Biol. 2010, 213, 2194–2200. [Google Scholar] [CrossRef] [PubMed] [Green Version]
  6. Schulte-Pelkum, N.; Wieskotten, S.; Hanke, W.; Dehnhardt, G.; Mauck, B. Tracking of biogenic hydrodynamic trails in harbour seals (Phoca vitulina). J. Exp. Biol. 2007, 210, 781–787. [Google Scholar] [CrossRef] [Green Version]
  7. Wieskotten, S.; Mauck, B.; Miersch, L.; Dehnhardt, G.; Hanke, W. Hydrodynamic discrimination of wakes caused by objects of different size or shape in a harbour seal (Phoca vitulina). J. Exp. Biol. 2011, 214, 1922–1930. [Google Scholar] [CrossRef] [Green Version]
  8. Hanke, W.; Witte, M.; Miersch, L.; Brede, M.; Oeffner, J.; Michael, M.; Hanke, F.; Leder, A.; Dehnhardt, G. Harbor seal vibrissa morphology suppresses vortex-induced vibrations. J. Exp. Biol. 2010, 213, 2665–2672. [Google Scholar] [CrossRef] [Green Version]
  9. Beem, H.R.; Triantafyllou, M.S. Wake-induced ‘slaloming’response explains exquisite sensitivity of seal whisker-like sensors. J. Fluid Mech. 2015, 783, 306–322. [Google Scholar] [CrossRef] [Green Version]
  10. Bunjevac, J.; Turk, J.; Rinehart, A.; Zhang, W. Wake induced by an undulating elephant seal whisker. J. Vis. 2018, 21, 597–612. [Google Scholar] [CrossRef]
  11. Hans, H.; Miao, J.; Weymouth, G.; Triantafyllou, M. Whisker-like geometries and their force reduction properties. In Proceedings of the 2013 MTS/IEEE OCEANS-Bergen, Bergen, Norway, 10–14 June 2013; pp. 1–7. [Google Scholar]
  12. Wang, S.; Liu, Y. Wake dynamics behind a seal-vibrissa-shaped cylinder: A comparative study by time-resolved particle velocimetry measurements. Exp. Fluids 2016, 57, 1–20. [Google Scholar] [CrossRef]
  13. Gläser, N.; Wieskotten, S.; Otter, C.; Dehnhardt, G.; Hanke, W. Hydrodynamic trail following in a California sea lion (Zalophus californianus). J. Comp. Physiol. A 2011, 197, 141–151. [Google Scholar] [CrossRef]
  14. Murphy, C.T.; Eberhardt, W.C.; Calhoun, B.H.; Mann, K.A.; Mann, D.A. Effect of angle on flow-induced vibrations of pinniped vibrissae. PLoS ONE 2013, 8, e69872. [Google Scholar] [CrossRef] [Green Version]
  15. Hans, H.; Miao, J.; Triantafyllou, M. Characterization of von Kármán street with seal whisker-like sensor. In Proceedings of the SENSORS, Taipei, Taiwan, 28–31 October 2012; pp. 1–4. [Google Scholar]
  16. y Alvarado, P.V.; Subramaniam, V.; Triantafyllou, M. Design of a bio-inspired whisker sensor for underwater applications. In Proceedings of the SENSORS, Taipei, Taiwan, 28–31 October 2012; pp. 1–4. [Google Scholar]
  17. Beem, H.; Hildner, M.; Triantafyllou, M. Calibration and validation of a harbor seal whisker-inspired flow sensor. Smart Mater. Struct. 2012, 22, 014012. [Google Scholar] [CrossRef]
  18. Beem, H.; Hildner, M.; Triantafyllou, M. Characterization of a harbor seal whisker-inspired flow sensor. In Proceedings of the 2012 Oceans, Hampton Roads, VA, USA, 14–19 October 2012; pp. 1–4. [Google Scholar]
  19. Wang, S.; Liu, Y.Z. Flow structures behind a vibrissa-shaped cylinder at different angles of attack: Complication on vortex-induced vibration. Int. J. Heat Fluid Flow 2017, 68, 31–52. [Google Scholar] [CrossRef]
  20. Kim, H.; Yoon, H.S. Effect of the orientation of the harbor seal vibrissa based biomimetic cylinder on hydrodynamic forces and vortex induced frequency. AIP Adv. 2017, 7, 105015. [Google Scholar] [CrossRef] [Green Version]
  21. Zheng, X.; Kamat, A.M.; Cao, M.; Kottapalli, A.G.P. Creating underwater vision through wavy whiskers: A review of the flow-sensing mechanisms and biomimetic potential of seal whiskers. J. R. Soc. Interface 2021, 18, 20210629. [Google Scholar] [CrossRef] [PubMed]
  22. Zhang, X.; Shan, X.; Xie, T.; Miao, J.; Du, H.; Song, R. Harbor seal whisker inspired self-powered piezoelectric sensor for detecting the underwater flow angle of attack and velocity. Measurement 2021, 172, 108866. [Google Scholar] [CrossRef]
  23. Zheng, X.; Kamat, A.M.; Cao, M.; Kottapalli, A.G.P. Natural Frequency Measurements of Seal Whiskers Using A 3D-Printed MEMS Graphene-Based Cantilever Sensor. In Proceedings of the 2022 IEEE 35th International Conference on Micro Electro Mechanical Systems Conference (MEMS), Tokyo, Japan, 9–13 January 2022; pp. 714–717. [Google Scholar]
  24. Zheng, X.; Kamat, A.M.; Cao, M.; Kottapalli, A.G.P. Wavy Whiskers in Wakes: Explaining the Trail-Tracking Capabilities of Whisker Arrays on Seal Muzzles. Adv. Sci. 2023, 10, 2203062. [Google Scholar] [CrossRef] [PubMed]
  25. Khalak, A.; Williamson, C. Fluid forces and dynamics of a hydroelastic structure with very low mass and damping. J. Fluids Struct. 1997, 11, 973–982. [Google Scholar] [CrossRef]
  26. Zhao, J.; Leontini, J.S.; Jacono, D.L.; Sheridan, J. Fluid–structure interaction of a square cylinder at different angles of attack. J. Fluid Mech. 2014, 747, 688–721. [Google Scholar] [CrossRef]
  27. Zhao, J.; Hourigan, K.; Thompson, M.C. Dynamic response of elliptical cylinders undergoing transverse flow-induced vibration. J. Fluids Struct. 2019, 89, 123–131. [Google Scholar] [CrossRef]
  28. Hanke, W.; Wieskotten, S.; Marshall, C.; Dehnhardt, G. Hydrodynamic perception in true seals (Phocidae) and eared seals (Otariidae). J. Comp. Physiol. A 2013, 199, 421–440. [Google Scholar] [CrossRef] [PubMed]
Figure 1. Photos of the experimental facilities: (a) aerial view and (b) side view.
Fluids 08 00206 g001
Figure 2. Sketch of the circulating water flume: (a) plan view and (b) side view.
Fluids 08 00206 g002
Figure 3. Comparison of the maximum amplitude (a) and frequency (b) of the vortex-induced vibration of an isolated circular cylinder (Khalak and Williamson [25] and Zhao et al. [26]).
Fluids 08 00206 g003
Figure 4. Characteristic parameters of the harbor seal whisker model used in the present study.
Fluids 08 00206 g004
Figure 5. Setup of the whisker model in uniform flow.
Fluids 08 00206 g005
Figure 6. Vibration amplitudes of the whisker model (a) and the elliptical cylinder (b) at different angles of attack.
Fluids 08 00206 g006
Figure 7. The vibration frequencies of the whisker model varying with reduced velocity at different angles of attack. (a) θ = 0 , (b) θ = 30 , (c) θ = 45 , (d) θ = 60 , (e) θ = 90 .
Fluids 08 00206 g007
Figure 8. The vibration frequencies of the elliptical cylinder varying with reduced velocity at different angles of attack. (a) θ = 0 , (b) θ = 30 , (c) θ = 45 , (d) θ = 60 , (e) θ = 90 .
Fluids 08 00206 g008
Figure 9. The displacement time history and its power spectrum of the whisker model. (a) θ = 30 and U r = 10, (b) θ = 30 and U r = 22, (c) θ = 45 and U r = 10, (d) θ = 45 and U r = 22, (e) θ = 60 and U r = 10, (f) θ = 60 and U r = 22, (g) θ = 90 and U r = 10, (h) θ = 90 and U r = 22. Subplots (a,c,e,g) show the results of the large-amplitude VIV regime (lock-in), subplots (b,d) show the results of the TIV regime, and subplots (f,h) show the results of the small-amplitude VIV regime (non-lock-in).
Fluids 08 00206 g009
Table 1. Parameters of verification cases for the vortex-induced vibration of an isolated circular cylinder.
PresentK&W(1)K&W(2)Zhao et al. [26]
m 2.672.410.12.4
ζ a i r 5.08 × 10 3 4.50 × 10 3 1.34 × 10 3 2.91 × 10 3
Note: K&W(1) and K&W(2), respectively, represent two groups of experiments with different parameters in Khalak and Williamson [25].
Table 2. The natural frequencies of the whisker model and the elliptical cylinder in water at different angles of attack.
θ = 0 θ = 30 θ = 45 θ = 60 θ = 90
The whisker model0.7670.7850.7990.8150.821
The elliptical cylinder0.7690.7790.7900.8090.822
Table 3. The St number of the whisker model and the elliptical cylinder at different angles of attack.
θ = 45 θ = 60 θ = 90
The whisker model0.1250.1100.103
The elliptical cylinder0.1370.1100.100
Disclaimer/Publisher’s Note: The statements, opinions and data contained in all publications are solely those of the individual author(s) and contributor(s) and not of MDPI and/or the editor(s). MDPI and/or the editor(s) disclaim responsibility for any injury to people or property resulting from any ideas, methods, instructions or products referred to in the content.

