Article

Influence of Morphological Parameters on the Flow Development within Human Airways

by
Andres Santiago Espinosa-Moreno
*,†,
Carlos Alberto Duque-Daza
and
Diego Alexander Garzón-Alvarado
Department of Mechanical and Mechatronics Engineering, Universidad Nacional de Colombia, Bogota 111321, Colombia
*
Author to whom correspondence should be addressed.
These authors contributed equally to this work.
Fluids 2023, 8(3), 78; https://doi.org/10.3390/fluids8030078
Submission received: 31 December 2022 / Revised: 2 February 2023 / Accepted: 8 February 2023 / Published: 21 February 2023
(This article belongs to the Special Issue Biological Fluid Dynamics)

Abstract

:
Anatomical airways parameters, such as length, diameter and angles, have a strong effect on the flow dynamics. Aiming to explore the effect of variations of the bifurcation angle (BA) and carina rounding radius (CRR) of lower human airways on respiratory processes, numerical simulations of airflow during inhalation and exhalation were performed using synthetic bifurcation models. Geometries for the airways models were parameterized based on a set of different BA’s and several CRR’s. A range of Reynolds numbers (Re), relevant to the human breathing process, were selected to analyze airflow behavior. The numerical results showed a significant influence of BA and the CRR on the development of the airflow within the airways, and, therefore, affecting the following relevant features of the flow: the deformation of velocity profiles, alterations of pressure drop, flow patterns, and, finally, enhancement or attenuation of wall shear stresses (WSS) appearing during the regular respiratory process. The numerical results showed that increases in the bifurcation angle value were accompanied by pressure increases of about 20%, especially in the regions close to the bifurcation. Similarly, increases in the BA value led to a reduction in peak shear stresses of up to 70%. For the ranges of angles and radii explored, an increase in pressure of about 20% and a reduction in wall shear stress of more than 400% were obtained by increasing the carina rounding radius. Analysis of the coherent structures and secondary flow patterns also revealed a direct relationship between the location of the vortical structures, the local maxima of the velocity profiles and the local vorticity minima. This relationship was observed for all branches analyzed, for both the inhalation and exhalation processes of the respiratory cycle.

1. Introduction

The human airways, as described by West [1], are divided in three zones: conducting, transitional, and respiratory. The conducting zone is intended to transport air from upper airways to the gas exchange zone, and is composed of the trachea, main bronchus, lobar bronchus and bronchioles. As explained by Minnich & Mathisen [2], the trachea stretches from the lower edge of the cricoid cartilage to the point of bifurcation of the main bronchus, also known as the carina. Some geometrical parameters, such as diameter, length and angle, among others, make it possible to concretely characterize the types of morphological branches and, therefore, to establish a hierarchy of generations, as indicated by Singhal et al. [3]. The bifurcation angle (BA) is a parameter closely related to lung morphology. Its numerical value depends on a number of factors, including chest width [4], gender and age [5]. Similarly, the choice of techniques and methodologies used to measure the value of the BA has a significant influence on the determination of the BA, with radiography, computed tomography and in-vitro measurements on human cadavers being among the most commonly used [6]. The values of the bifurcation angle reported in the literature vary widely. A range of subcarinal angle variation between 55 and 65 for all ages is described by Haskin & Goodman [4]. Meanwhile, in the study carried out by Bipinchandra et al. [6], a range between 50 to 130 was found. Furthermore, Christou et al. [7] reported ranges from 65 . 04 to 122 . 01 for men and from 69 . 46 to 113 . 94 for women. On the other hand, the study by Sahni et al. [8] showed that this parameter had values ranging from 42 to 75 in human fetuses. The widening of the bifurcation angle may also be influenced by some physical pathologies, such as pericardial fluid accumulation [9], or enlargement of the left atrium [10,11]. These abnormal conditions cause displacement of the bronchi and, thus, alteration of the bifurcation angle.
Another relevant morphological parameter is the carina rounding radius (CRR). As pointed out by Horsfield et al. [12], the rounding radius varies in shape from an almost straight and sharp junction, in some cases, to a very blunt bifurcation in others. This radius can be related to the diameter of the daughter branch, from which a dimensionless parameter, characterising the cross-section as a function of diameter, can be estimated. This ratio, although variable, is approximately 0.1 [12]. From a geometrical perspective, Martonen et al. [13] describes four potential configurations for this parameter: blunt, parabolic, saddle, and asymmetric. These configurations affect the airflow patterns and conditions within the human airways. For example, asymmetric and saddle configurations are generally linked to the development of larger regions of instability, compared to parabolic and symmetric shapes.
The ventilation process and other related phenomena occurring in the human airways during inhalation and exhalation processes have been extensively studied, both numerically and experimentally. The recent comparative study carried out by Xu et al. [14] showed how computational fluid dynamic (CFD) techniques adequately captured upper airway fluid phenomena by comparison with experimental results. In fact the research work done by Faizal et al. [15] and Tran et al. [16] illustrated how these numerical approaches and methods were so robust that they even allowed simulating pre- and post-surgical processes in human airways. The applicability also extends to the study of pathologies, such as asthma [17,18], chronic obstructive pulmonary disease -COPD- [19,20], tumors [21], and stenosis [22], as well as particle transport phenomena [23,24], coughing and sneezing [25,26], among others. Approaches such as the one developed by Mason et al. [27] show, through CFD simulations, how aerodynamic stresses on the airways of infants are greater than in adulthood, allowing characterization of some pathologies depending on the age of the patients. Numerical simulation studies generally require the development of a computational domain from a geometrical configuration of the airways. The most commonly used models are the Weibel model [28] and the Horsfield model [12]. For the characterisation of these models it is necessary to define several morphological parameters, among which are the bifurcation angle and the carina rounding radius mentioned above. As described in several works see [23,29,30,31,32], the areas near the bifurcation points are of special attention, as they are, for example, associated with particle accumulation and dispersion. In fact, numerical work performed by Balashazy et al. [33], to analyze the effect of carina shape on particle behavior, showed how the deposition patterns were quite similar for carina geometries with a straight joint and one with a slight smoothing. Therefore, it is important to characterise the behavior of fluid flow through the airways, as well as the affectation of flow due to variation of morphological parameters associated with bifurcation, such as BA and CRR. Although a lot of numerical investigations focused on the analysis of flow through branched systems, the specific effect of BA and CRR on velocity profiles, secondary flow patterns, pressure drops and shear stresses have not been extensively studied.
In order to shed additional light on the effects of morphological parameters on the respiratory cycle, the main objective of the present work was to analyze the effect of variations of the bifurcation angle (BA) and carina rounding radius (CRR) on the respiratory process. The exploration of the effect of BA and CRR was performed by numerical experiments on synthetic models of the human lower airways. Geometric models were used for seven different BA values and three different CRRs. In addition, airflow at different Reynolds numbers was used to explore the influence of these morphological parameters on different flow regimes in the inspiratory and expiratory phases. The comparative analysis performed in this study further deepens the description and characterization of airflow through the human airways, thus, complementing the existing debate on the effects of variations of morphological parameters of the bronchial tree. The results presented in this work focused especially on the description of some flow characteristics that have not been described in depth before, such as wall shear stresses and variability of flow patterns due to morphological changes. This numerical analysis made it possible to explore a large number of configurations that would otherwise involve high experimental complexity.
The present manuscript is organised as follows. The first section of this paper specifies the methodology and the numerical model used in this work, while the second section presents and discusses the results obtained from the numerical simulations for the inhalation (BA and CRR) and exhalation (BA only) processes. Finally, the last section of this manuscript presents the main conclusions and recommendations arising from this work.

2. Methodology

In this study, the effects of variations of two morphological parameters on the breathing process were explored. Bifurcation angle (BA) and carina rounding radius (CRR) were evaluated using independent geometric models and specific boundary conditions. Both morphological parameters were analyzed using computational models implemented in OpenFOAM, following the assumptions of incompressible and isothermal air as the working fluid. The details of each of these models, and their respective methodological aspects, are presented below.

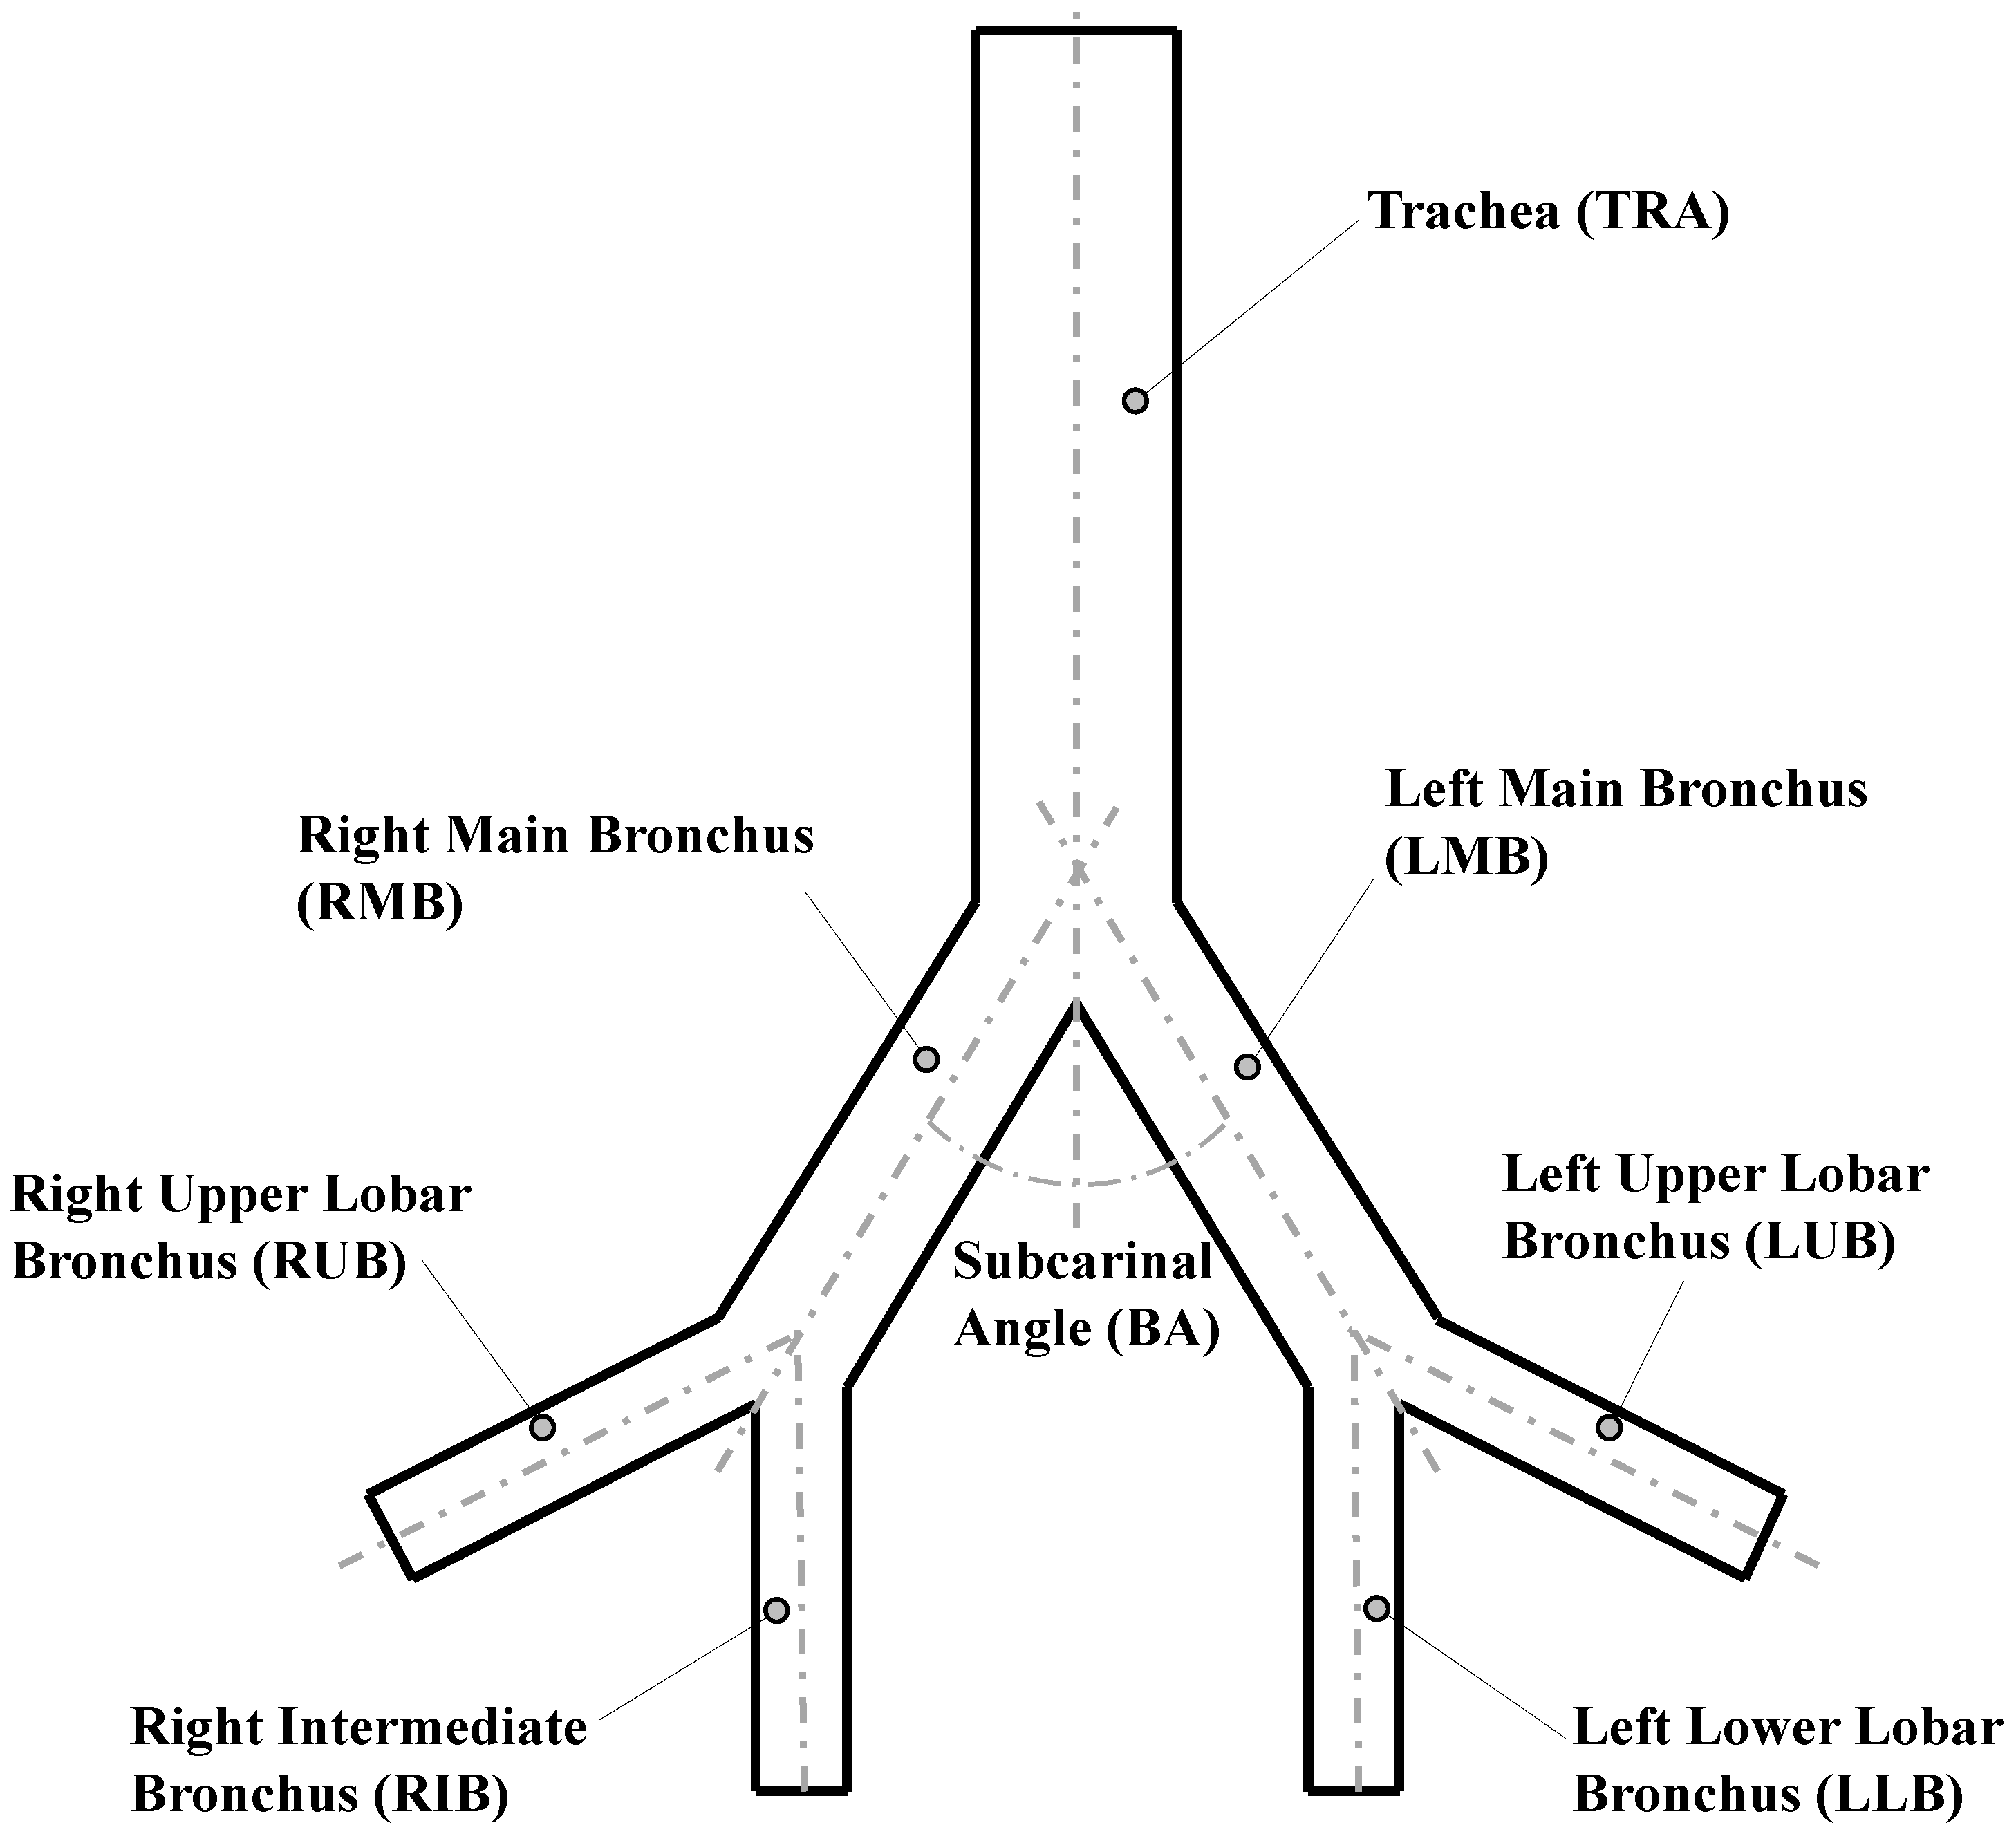
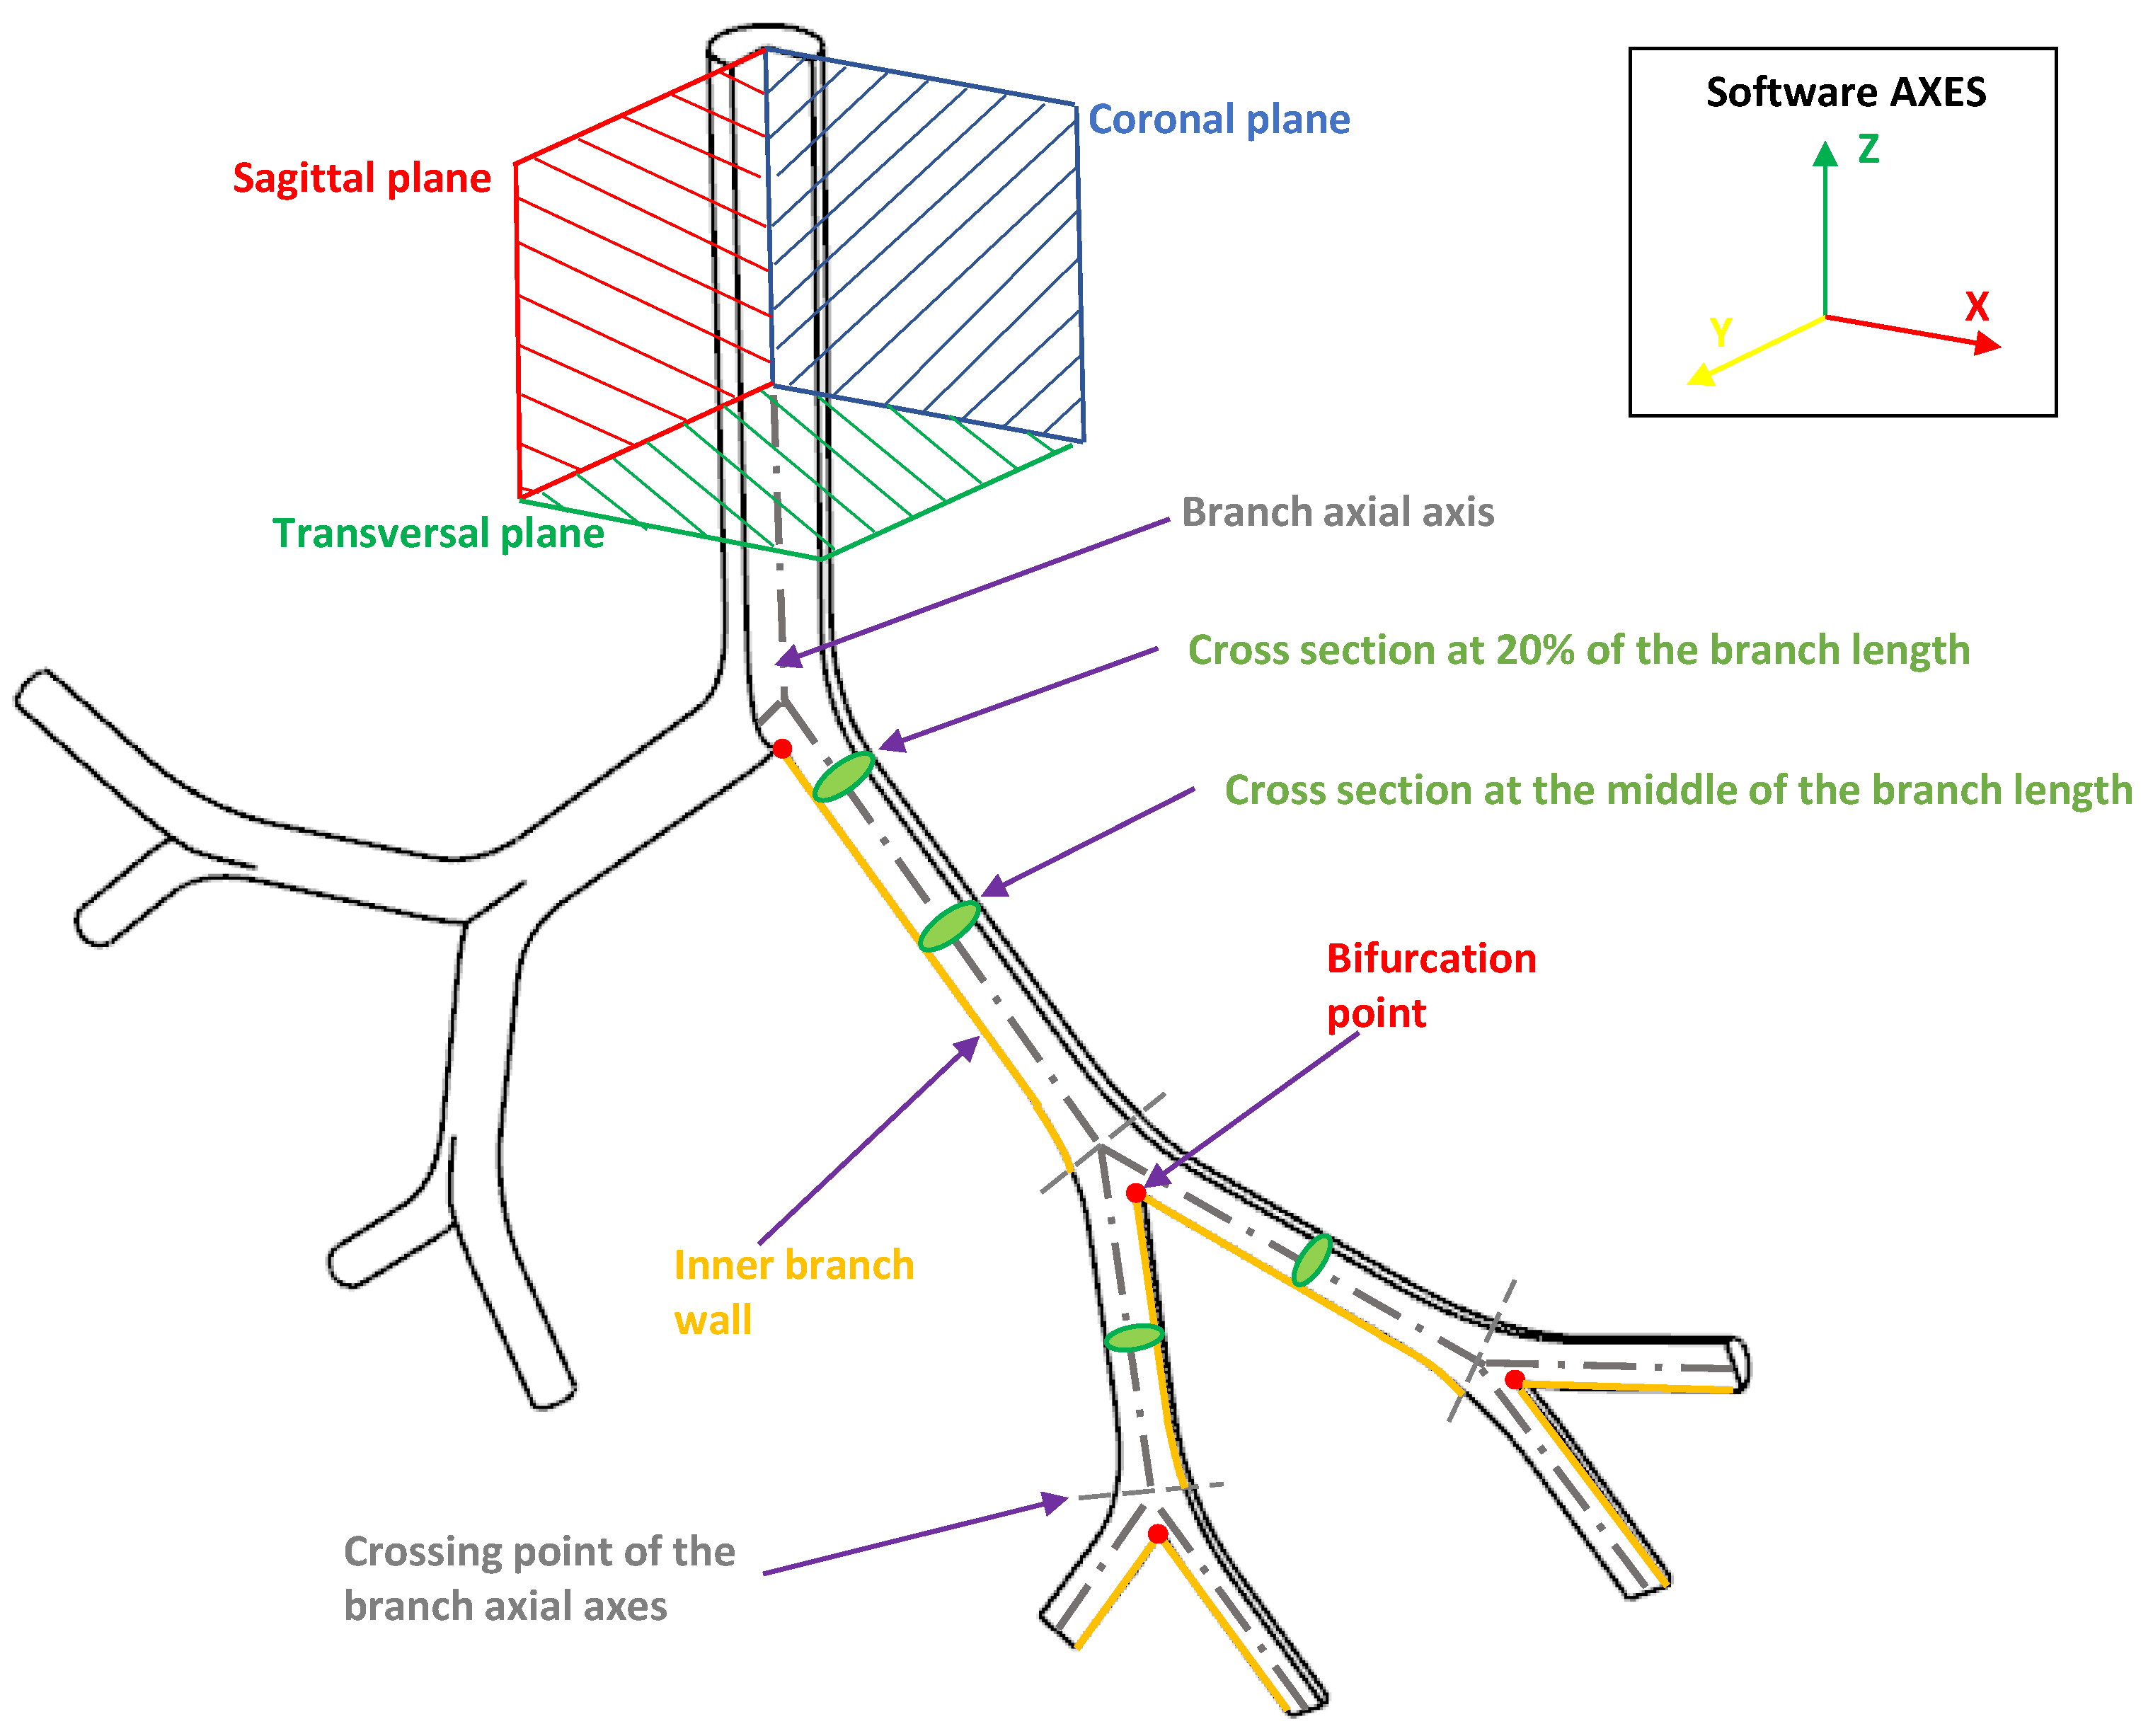
2.1. Bifurcation Angle (BA). Morphological Definition

The analysis of the bifurcation angle was carried out using a Weibel 3-D model of airways, which included the first three generations of human morphology (see reference [28]). Those generations represented the trachea, main bronchus and secondary bronchus. To simplify the analysis, the notation for airways provided by Christou et al. [7] was adopted. The values selected for the geometric parameters of the model are shown in Table 1 and illustrated in Figure 1.
To avoid problems related to flow development in the regions close to the outlets, the length of each of the last generation branches was extended to ensure a minimum length of five times the related outlet diameter. The bifurcation points were considered as straight joints, i.e., the carina rounding radius for these geometries was set equal to zero.
To evaluate the effect of the bifurcation angle (BA), two values of 55 . 9 and 63 . 1 were selected from experimental measurements of physiologically relevant subcarinal angles, reported by Haskin & Goodman [4]. As shown in Table 2, these angles corresponded to the average measured for people between 50 and 60 years old, and the average for people 61 years old or older, respectively. In order to extend the analysis, a model with an additional value for BA of 70 was also explored, according to the mean angle with minimum resistance, discussed by Horsfield & Cumming [34]. Each selected angle value was prescribed as the bifurcation angle for all model generations in each of the numerical experiments.

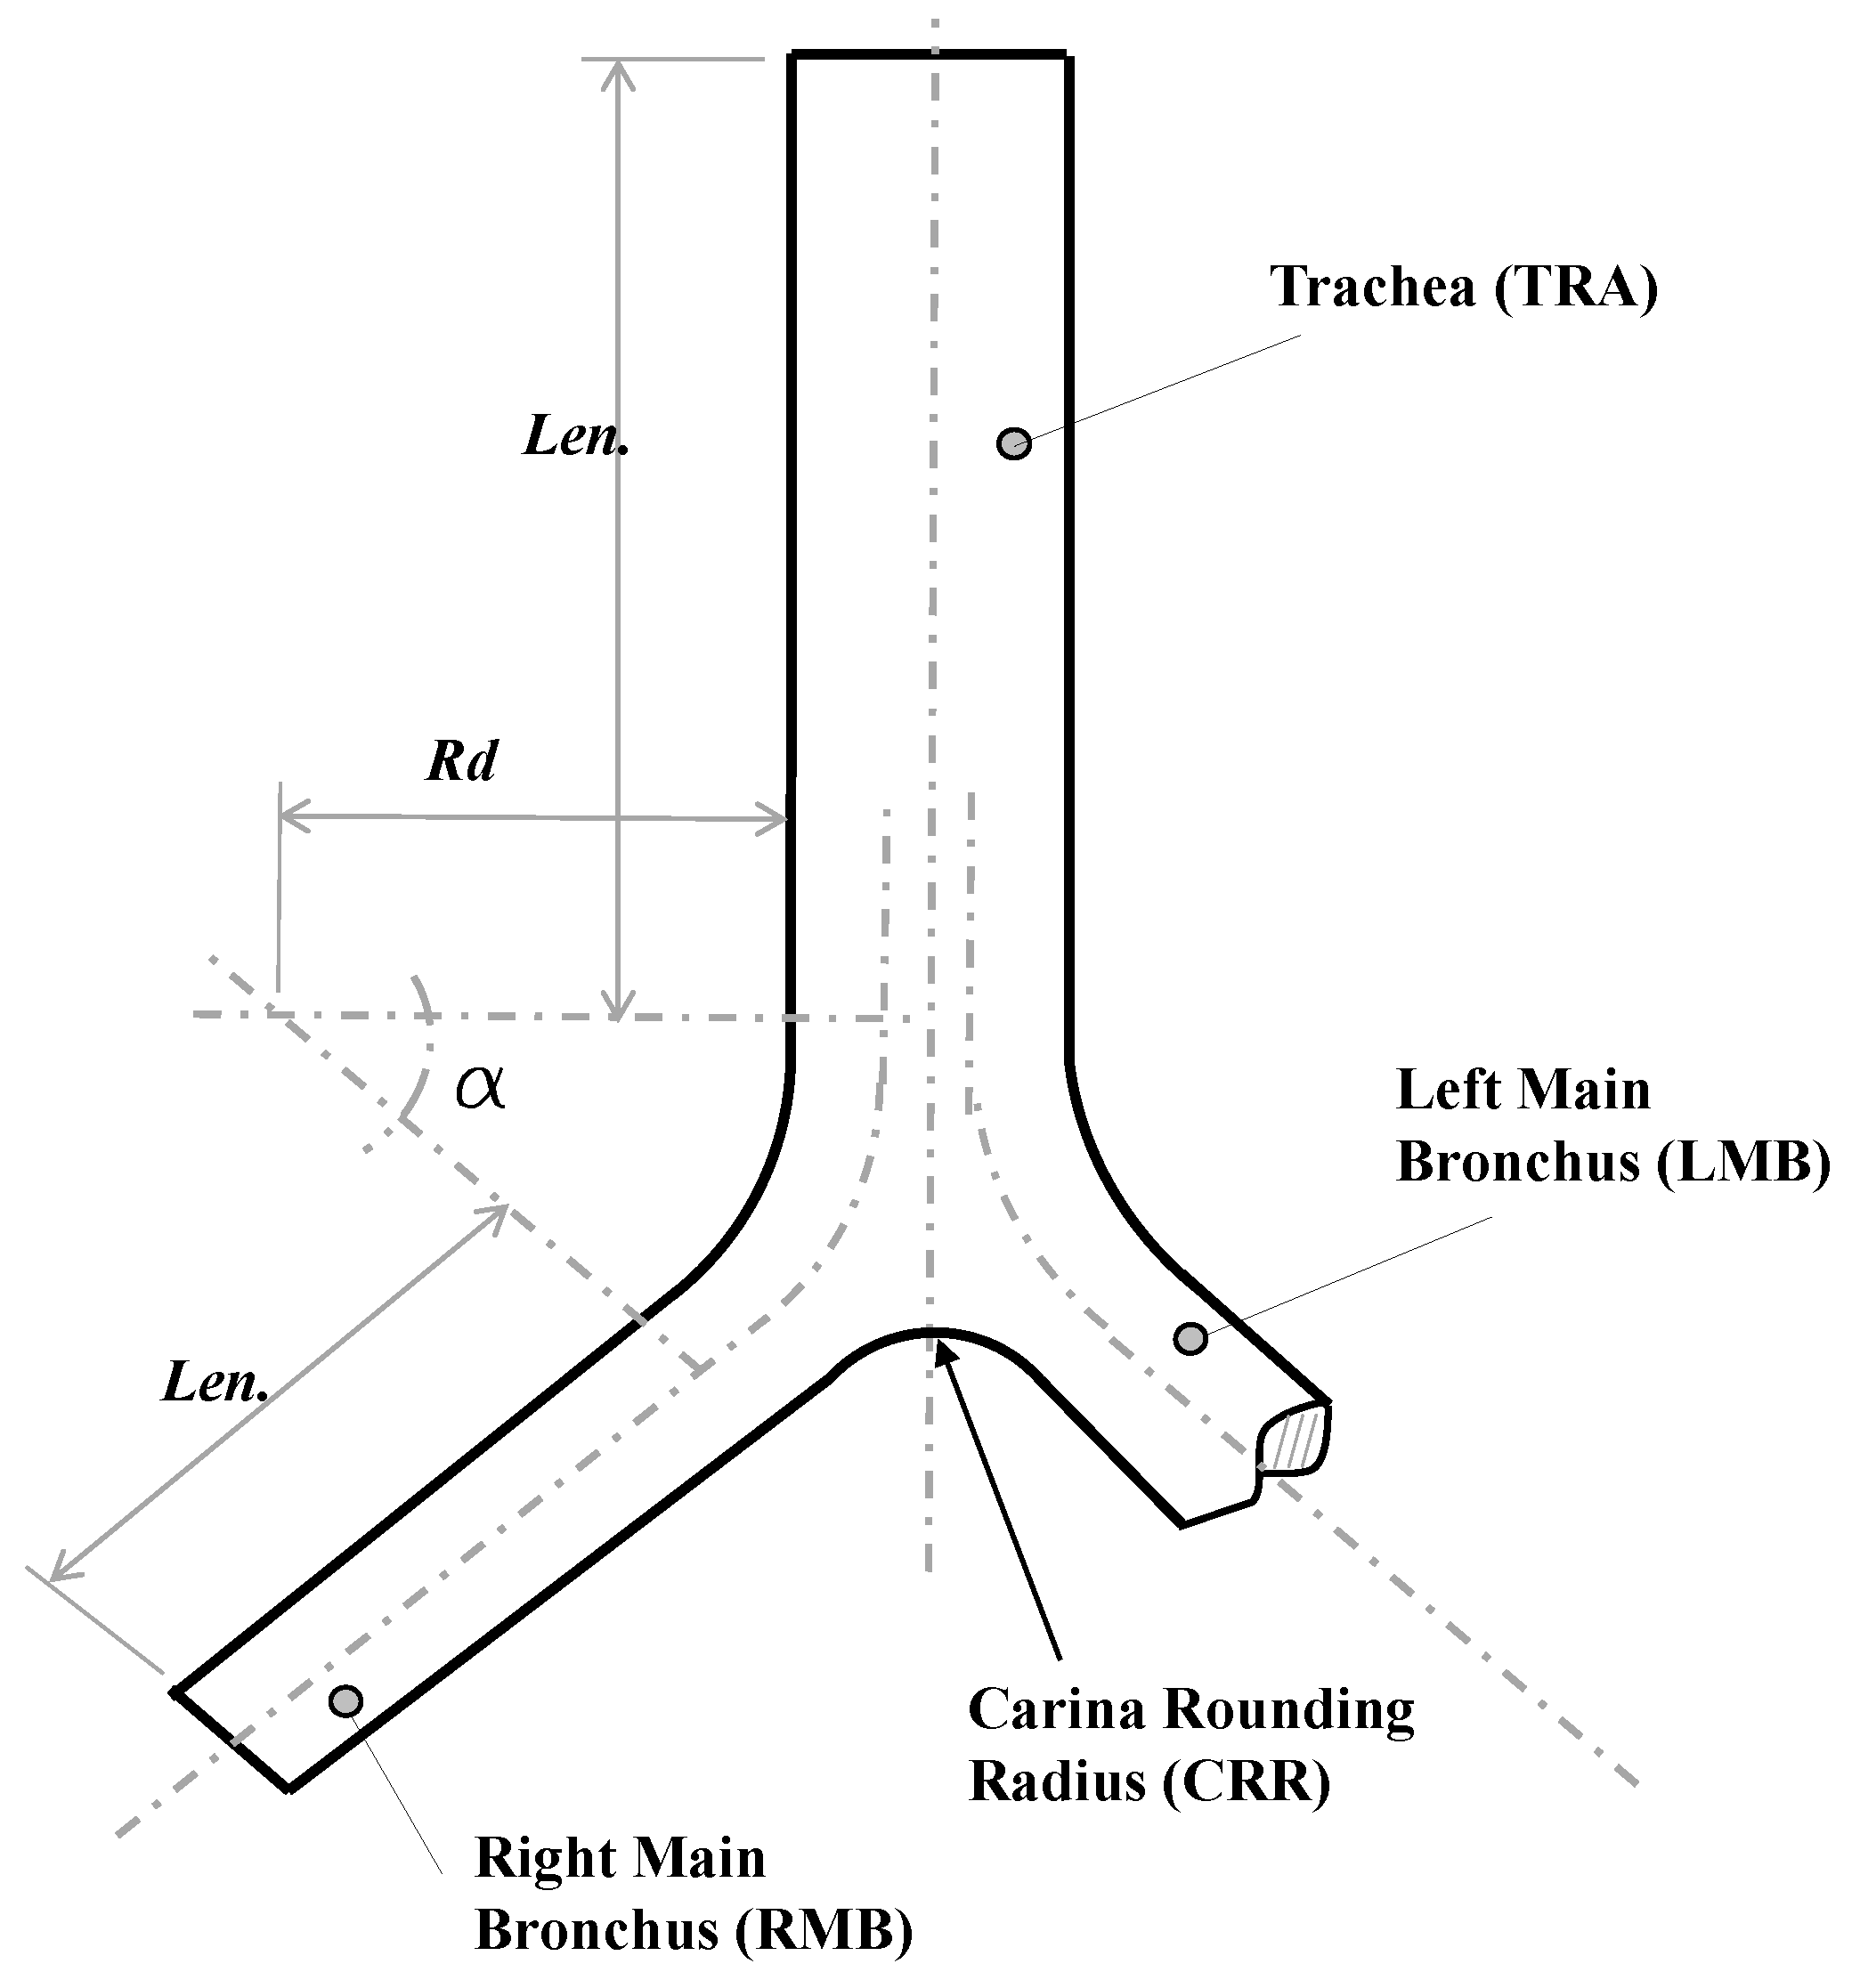
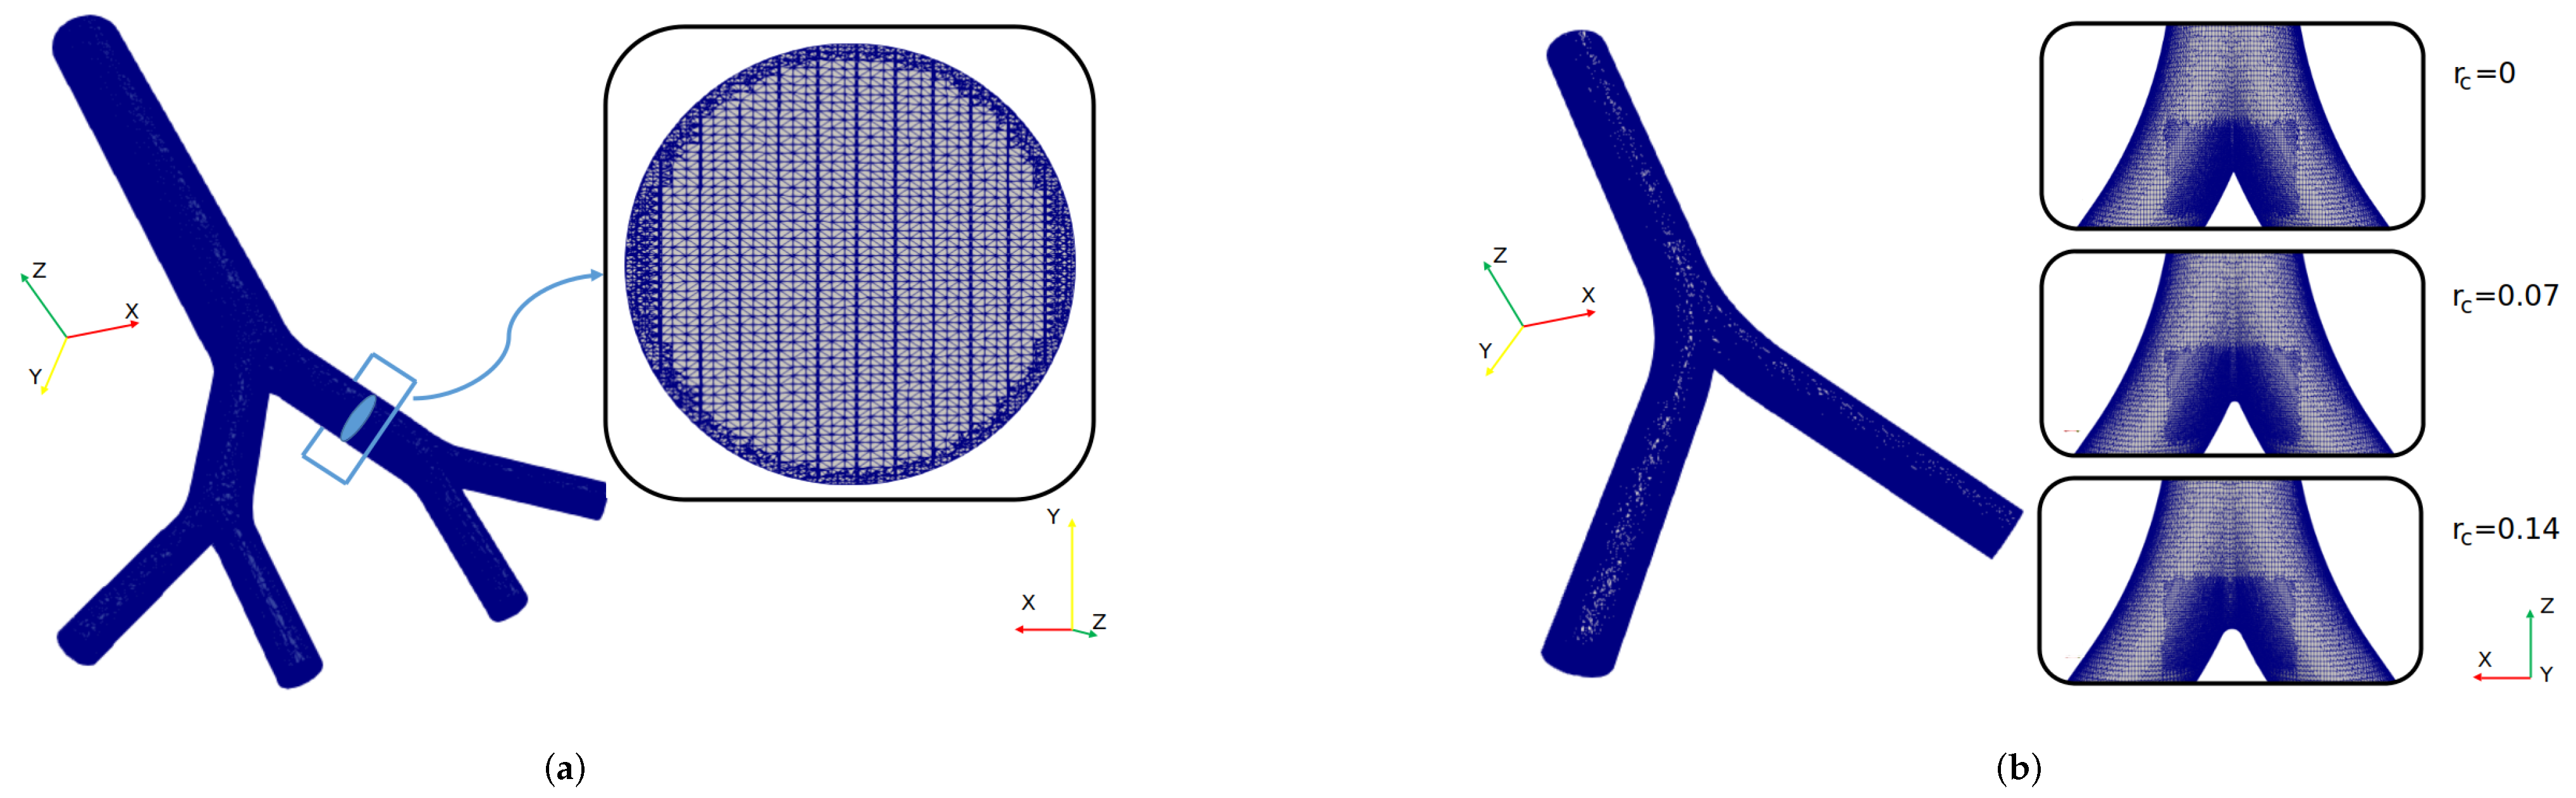
2.2. Carina Rounding Radius (CRR). Morphological Definition

For the study of the CRR, a synthetic 3-D airways model, based on the bifurcation geometry proposed by Lee et al. [35], was selected. Parameters and values for the implementation of this model are presented in detail in Table 3 and Figure 2. These generations represented the trachea and main bronchus. As in the BA study, the geometric model was adjusted to ensure a minimum length of the branches of the last generation of at least five times the related outflow diameter. Specifically, the parameters R d and α described the curvature of the bifurcation. The CRR was non-dimensionalized using the following expression:
r c = CRR r t
where r c is the dimensionless rounding radius and r t the trachea radius. As reported by Horsfield et al. [12] and Balashazy et al. [33], for human airways the average value of r c ranges around 0.1 . In fact, a dimensionless rounding radius of 0.07 and 0.14 for symmetric and asymmetric airways, respectively, were used in the lung architecture characterization work carried out by Lee et al. [35]. Based on the above, three dimensionless carina radii, equivalent to 0, 0.07 and 0.14 , were selected in the present work.

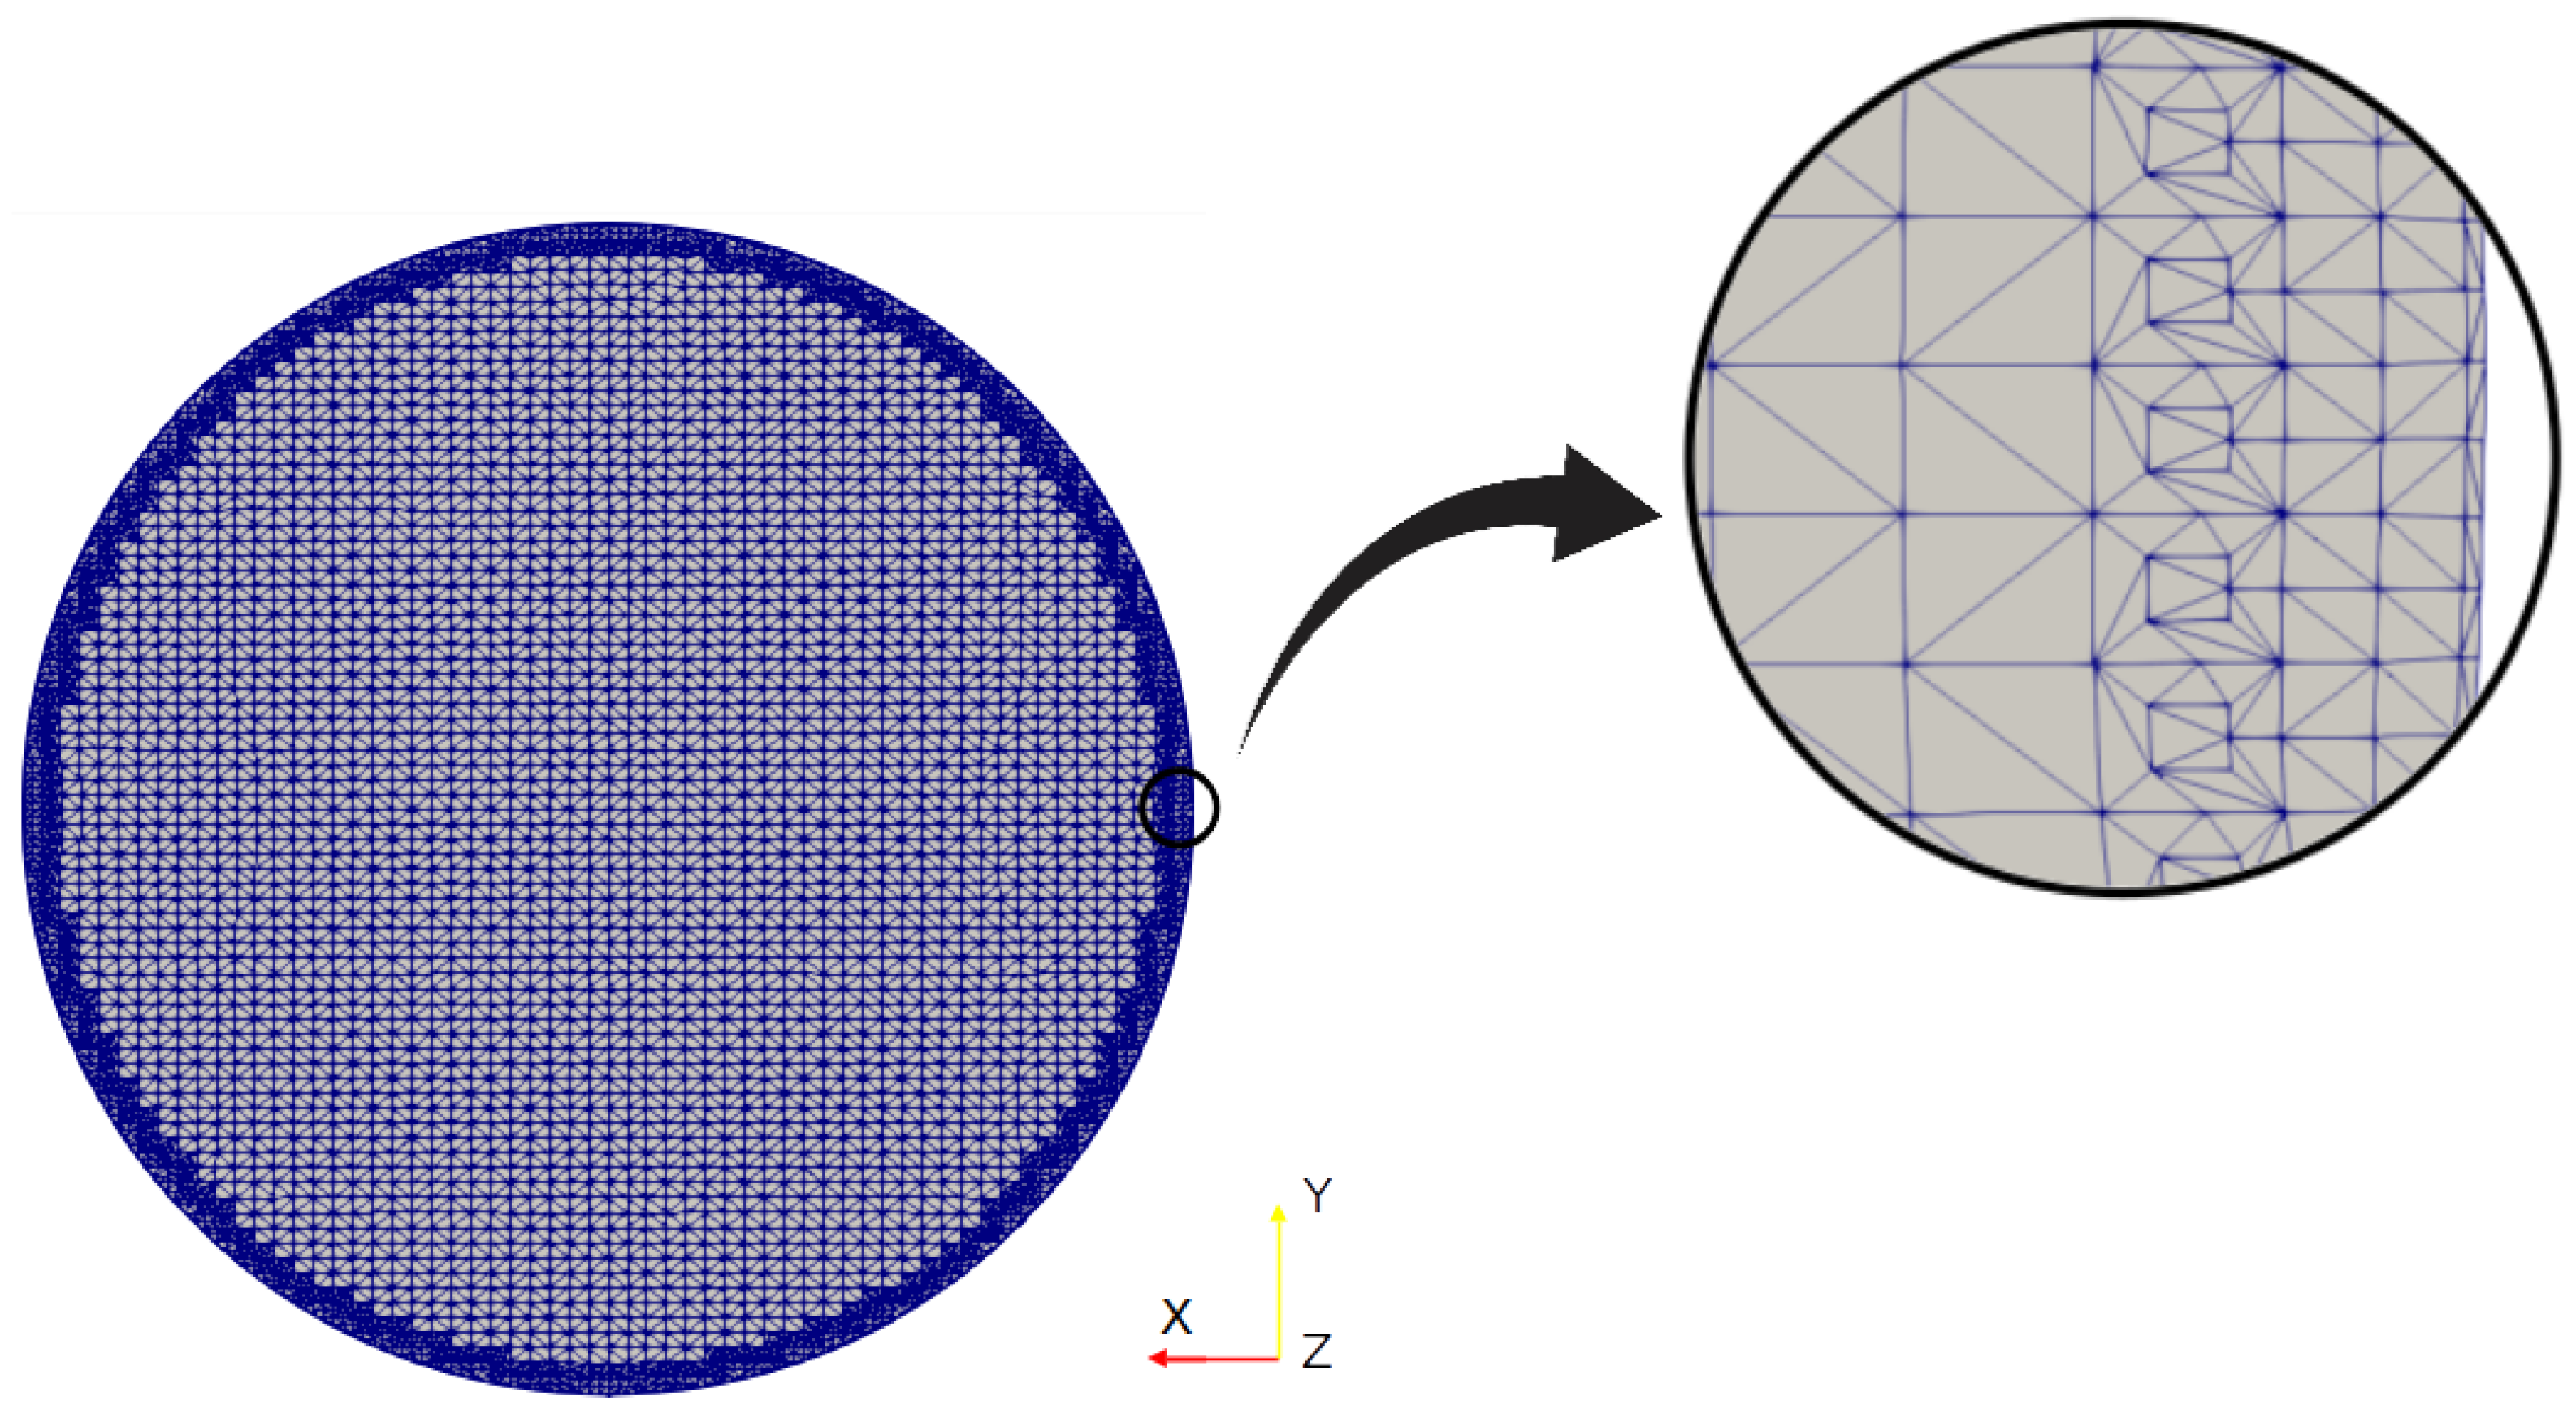
2.3. Governing Equations and Computational Model

The ventilation process within human beings takes place at relatively low Reynolds number regimes, and at very low Mach numbers, even for agitated breathing situations ([13,36]). Therefore, for both BA and CRR experiments, the fluid flow through the synthetic human airways was assumed to be laminar and incompressible. Additionally, isothermal air was assumed as the working fluid, in line with the predefined flow conditions. The governing equations selected for this fluid flow regime were the conservation of mass equation and the Navier–Stokes (conservation of momentum) equations, which, for incompressible and isothermal flow, can be formulated as:
· v ~ = 0
u i t + · ( u i v ~ ) = 1 ρ p + · ( ν u i )
where u i and v ~ are the i-th velocity component and the velocity vector field, respectively Equally, in Equation (3), p is the fluid pressure and ν = μ / ρ its kinematic viscosity with ρ standing for the density of the fluid. For the purposes of this work, the Reynolds number was defined as:
Re = U a v e D ν
where U a v e = 0.5 U m a x . Air properties were defined at ambient temperature of 15 , with ρ = 1.23 [kg/m 3 ] and ν = 1.48 × 10⁻⁵ [m 2 /s].
The two breathing processes, i.e., inhalation and exhalation, were decoupled and studied as independent processes. The main objective of this work was to characterize and establish general patterns of airflow within a portion of the human airways. By simulating the processes independently we were able to guarantee the stabilization of the flow and, thus, the stabilization of the patterns reported in the present manuscript, mainly aiming at getting a general description and overview of the flow. It is also noteworthy that a large body of research in this field has been performed employing this consideration of independent processes, including experimental and numerical studies see [37,38,39,40,41,42,43]. For instance, Zhao & Lieber [42,43] characterized the flow through the airways experimentally for the inhalation and exhalation states independently. Yang et al. [39] characterized airway inflow patterns as a single process, and Zhang et al. [41] described the effect of tracheal curvature on respiratory inhalation as an independent stage. A large number of numerical studies on particle dispersion, such as those developed by Yu et al. [40] and Comer et al. [37], considered a single breathing state to characterize the phenomena and to obtain patterns of behavior. Accordingly, considering the large portion of published work on the modeling of the human respiratory process, based on the one-way respiration flow assumption, instead of a more realistic oscillatory flow, and the success of this approach in modeling a number of different airflow conditions, the same methodology was used to explore the cases considered in the present work. To ensure proper flow development in the inhalation process simulations, a parabolic velocity profile was adopted. This profile was prescribed as symmetrical around the inlet axis, i.e., the trachea, and is given by:
U ( r ) = U m a x 1 r R 2
where U ( r ) is the inlet velocity, U m a x is the maximum velocity, r a radial position and R the inlet radius. Human breathing rates range from 0.2 L / s to 2.5 L / s [13,36], which corresponds to a range of Reynolds numbers (Re) between 200 and 2800. This range was observed by Adler & Brücker [44] in an experimental investigation using a pulsatile flow, where a maximum value of Re = 3000 was reached. Different Reynolds number values were explored in the present study. However, for brevity, only the results for two values, representative of the extremes of the breathing process, and corresponding to Re = 500 and Re = 2000 , are presented. At the outlets, a uniform pressure boundary condition was prescribed for all outlets. As indicated by Bauer & Brücker [45], this consideration allowed the flow to adjust to different pressure gradients across different airway generations. Therefore, the velocity condition at the outlets is given by:
v n = 0
In the surface of the wall a Dirichlet no-slip boundary condition was applied to the velocity field at all airway walls:
v = 0
The exhalation study was performed only for BA analysis. While in the inhalation stage the inlet was the trachea and the outlets were the bronchi, for the exhalation stage the bronchi were the inlets and the trachea was the outlet. Parabolic velocity profiles (see Equation (5)) were prescribed at each of the inlets. These profiles were defined symmetrically with respect to the axial lines of each last generation branch, and their maximum value was equal to the maximum velocity obtained at the outlets in the respective inhalation cases. At the Outlet a uniform pressure condition was set up. The velocity condition was described by Equation (6). A Dirichlet no-slip boundary condition was applied to the velocity field at all airway walls, as described in Equation (7).
All boundaries were considered rigid. Investigations such as those carried out by Wall & Rabczuk [46], Wang et al. [47] and Koombua et al. [48], showed that under normal breathing conditions, i.e., low Reynolds numbers and healthy airway geometries, the wall deformation is relatively small, and, therefore, the effect on airflow is not highly relevant. The study performed by Wall & Rabczuk [46] showed that the difference between the numerical results obtained with fluid–structure interaction simulations, versus CFD results, was minimal, and, in fact, the flow fields were very similar for small Tidal breathing volumes, i.e., for considerations close to normal breathing in physiological conditions.
The governing equations were solved numerically using the open source computational fluid dynamics (CFD) suite OpenFOAM, which offers different schemes and numerical methods to solve different fluid flow phenomena. For the selected flow conditions and mathematical model, a finite volume method (FVM) approach was adopted. OpenFOAM (OF) offers a number of the so-called solvers and for the purposes of the present study the pisoFoam solver was selected, which is suitable for unsteady and incompressible laminar flows. The simulation setup was configured to maintain a Courant number less than 1, with a time step size equal to 1 × 10 4 . This consideration ensured that the solution had a stable behavior during the simulation time [49,50,51]. Temporal integration was performed by using a backward scheme and the spatial discretization was solved using second-order interpolation schemes for the gradient and divergence terms. The Geometric Agglomerated Algebraic Multigrid Solver (GAMG) was used to solve the Poisson–pressure equations, whereas the velocity field was obtained using the smoothSolver scheme available in OF. Pressure–velocity coupling was accomplished by using the PISO algorithm. All the numerical simulations of this study were performed in parallel using a Simple Domain Decomposition. The unstructured mesh generator snappyHexMesh was employed to generate the computational grid for the different geometries covered in this work. An example of one of the finite volume mesh for BA’s study is illustrated in Figure 3a. As can be seen in the cross section of the branch, a finer refinement was implemented near the walls. The average number of tetrahedral cells in the different computational models was 3.5 × 10 6 . The finite volume meshes for CRR’s study are shown in Figure 3b. In order to obtain a zone of finer cells near the carina, particular sub-regions of refinement were defined. In this case, the average number of tetrahedral cells was 1.5 × 10 6 .
To ensure that the resolution of the mesh was capable of capturing the associated flow phenomena, the computational mesh was configured so that the wall-normal distance of the cell centres neighbouring the airway walls was less than the resolution threshold of the viscous sublayer. This value was expressed in non-dimensional form in terms of wall-units, generically referred to as y + . This parameter can be evaluated as:
y + = u τ y ν
where ν is the fluid’s kinematic viscosity, u τ is the friction velocity, defined as:
u τ = τ w ρ
the variable y is the wall-normal distance from the cell centre to the bounding wall, and τ w the local wall shear stress. As the larger velocities appear in the trachea, y + was computed in that branch, as shown in Figure 4. The parameter τ w was calculated at the maximum velocity of our test set, i.e., Re = 2000 . The average value obtained by applying Equation (8) and Equation (9) was y + = 0.258 . Considering that this value was less than 1, it was possible to conclude that the meshes constructed and employed in the present work were fine enough to accurately capture the flow phenomenon for the different regimes considered here.

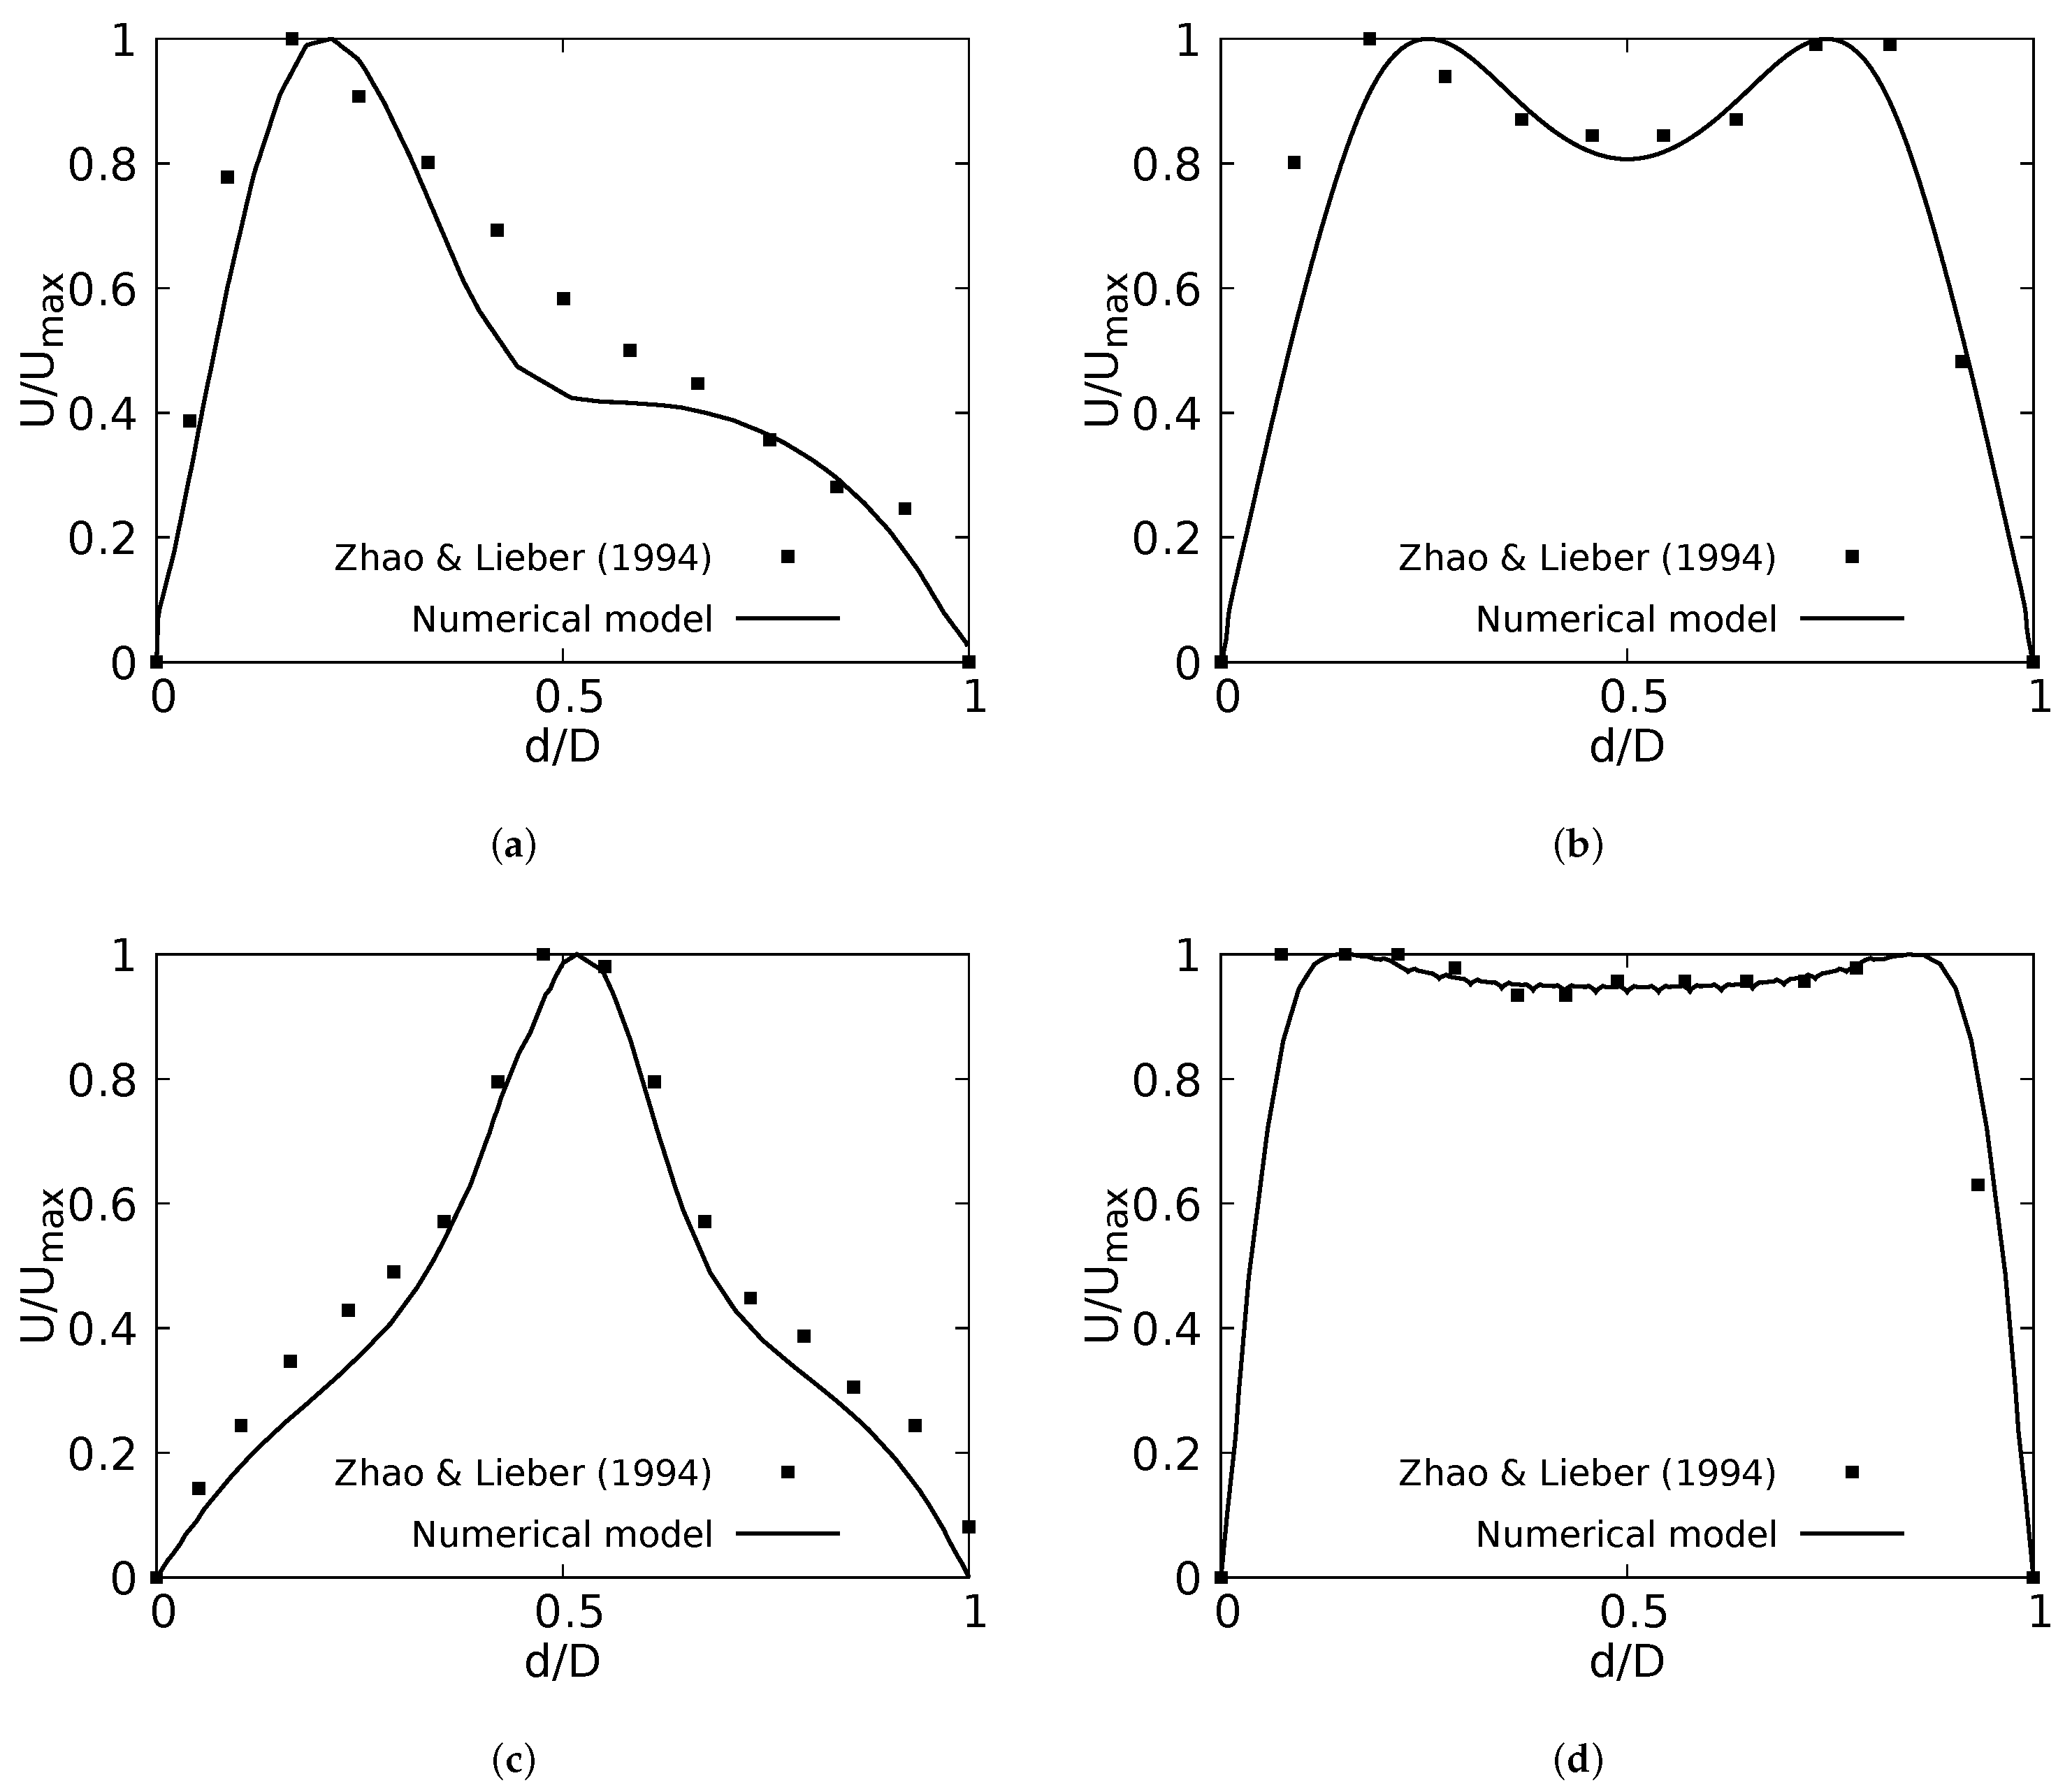
2.4. Validation of the Numerical Model

The numerical model applied in this study was tested and validated against experimental results obtained by Zhao & Lieber for both inhalation [42] and exhalation [43] flow. The model selected for this validation was the simple bifurcation geometry developed for the CRR study (see Figure 2), since this configuration is similar to the geometry of the experimental study, with an opening angle of 70 and with a rounding radius of 0. The comparison was performed using the normalized profiles with the maximum velocity U m a x for Re = 500 . The comparative results for flow in inhalation are illustrated in Figure 5a,b. These profiles were taken at the end of the second generation branch. It can be seen how the main flow features were accurately captured, particularly the narrowing and deformation of the velocity profile towards the inner wall of the branch (on the coronal plane), and the formation of the M-shape of the profile (on the sagittal plane). A similar result was obtained in the comparison of the results in the exhalation stage. As evidenced in Figure 5c,d, both the peak velocity centered on the axial branch axis in the coronal plane and the M-shaped profile over the sagittal plane were faithfully captured. These comparative results confirmed that the numerical model selected for the exploration of the effect of BA and CRR on airflow was accurate and suitable for the purposes of our study.
Our discussion and results for both the effects of BA and CRR variations focused on the analysis of velocity profiles, secondary flow patterns, pressure drops and wall shear stresses (WSS). These indicators were generally analyzed in the coronal and sagittal planes. In the present work, these values were explored specifically in the areas and at the points shown in Figure 6.

3. Results I. Effect of Variations of the Bifurcation Angle (BA)

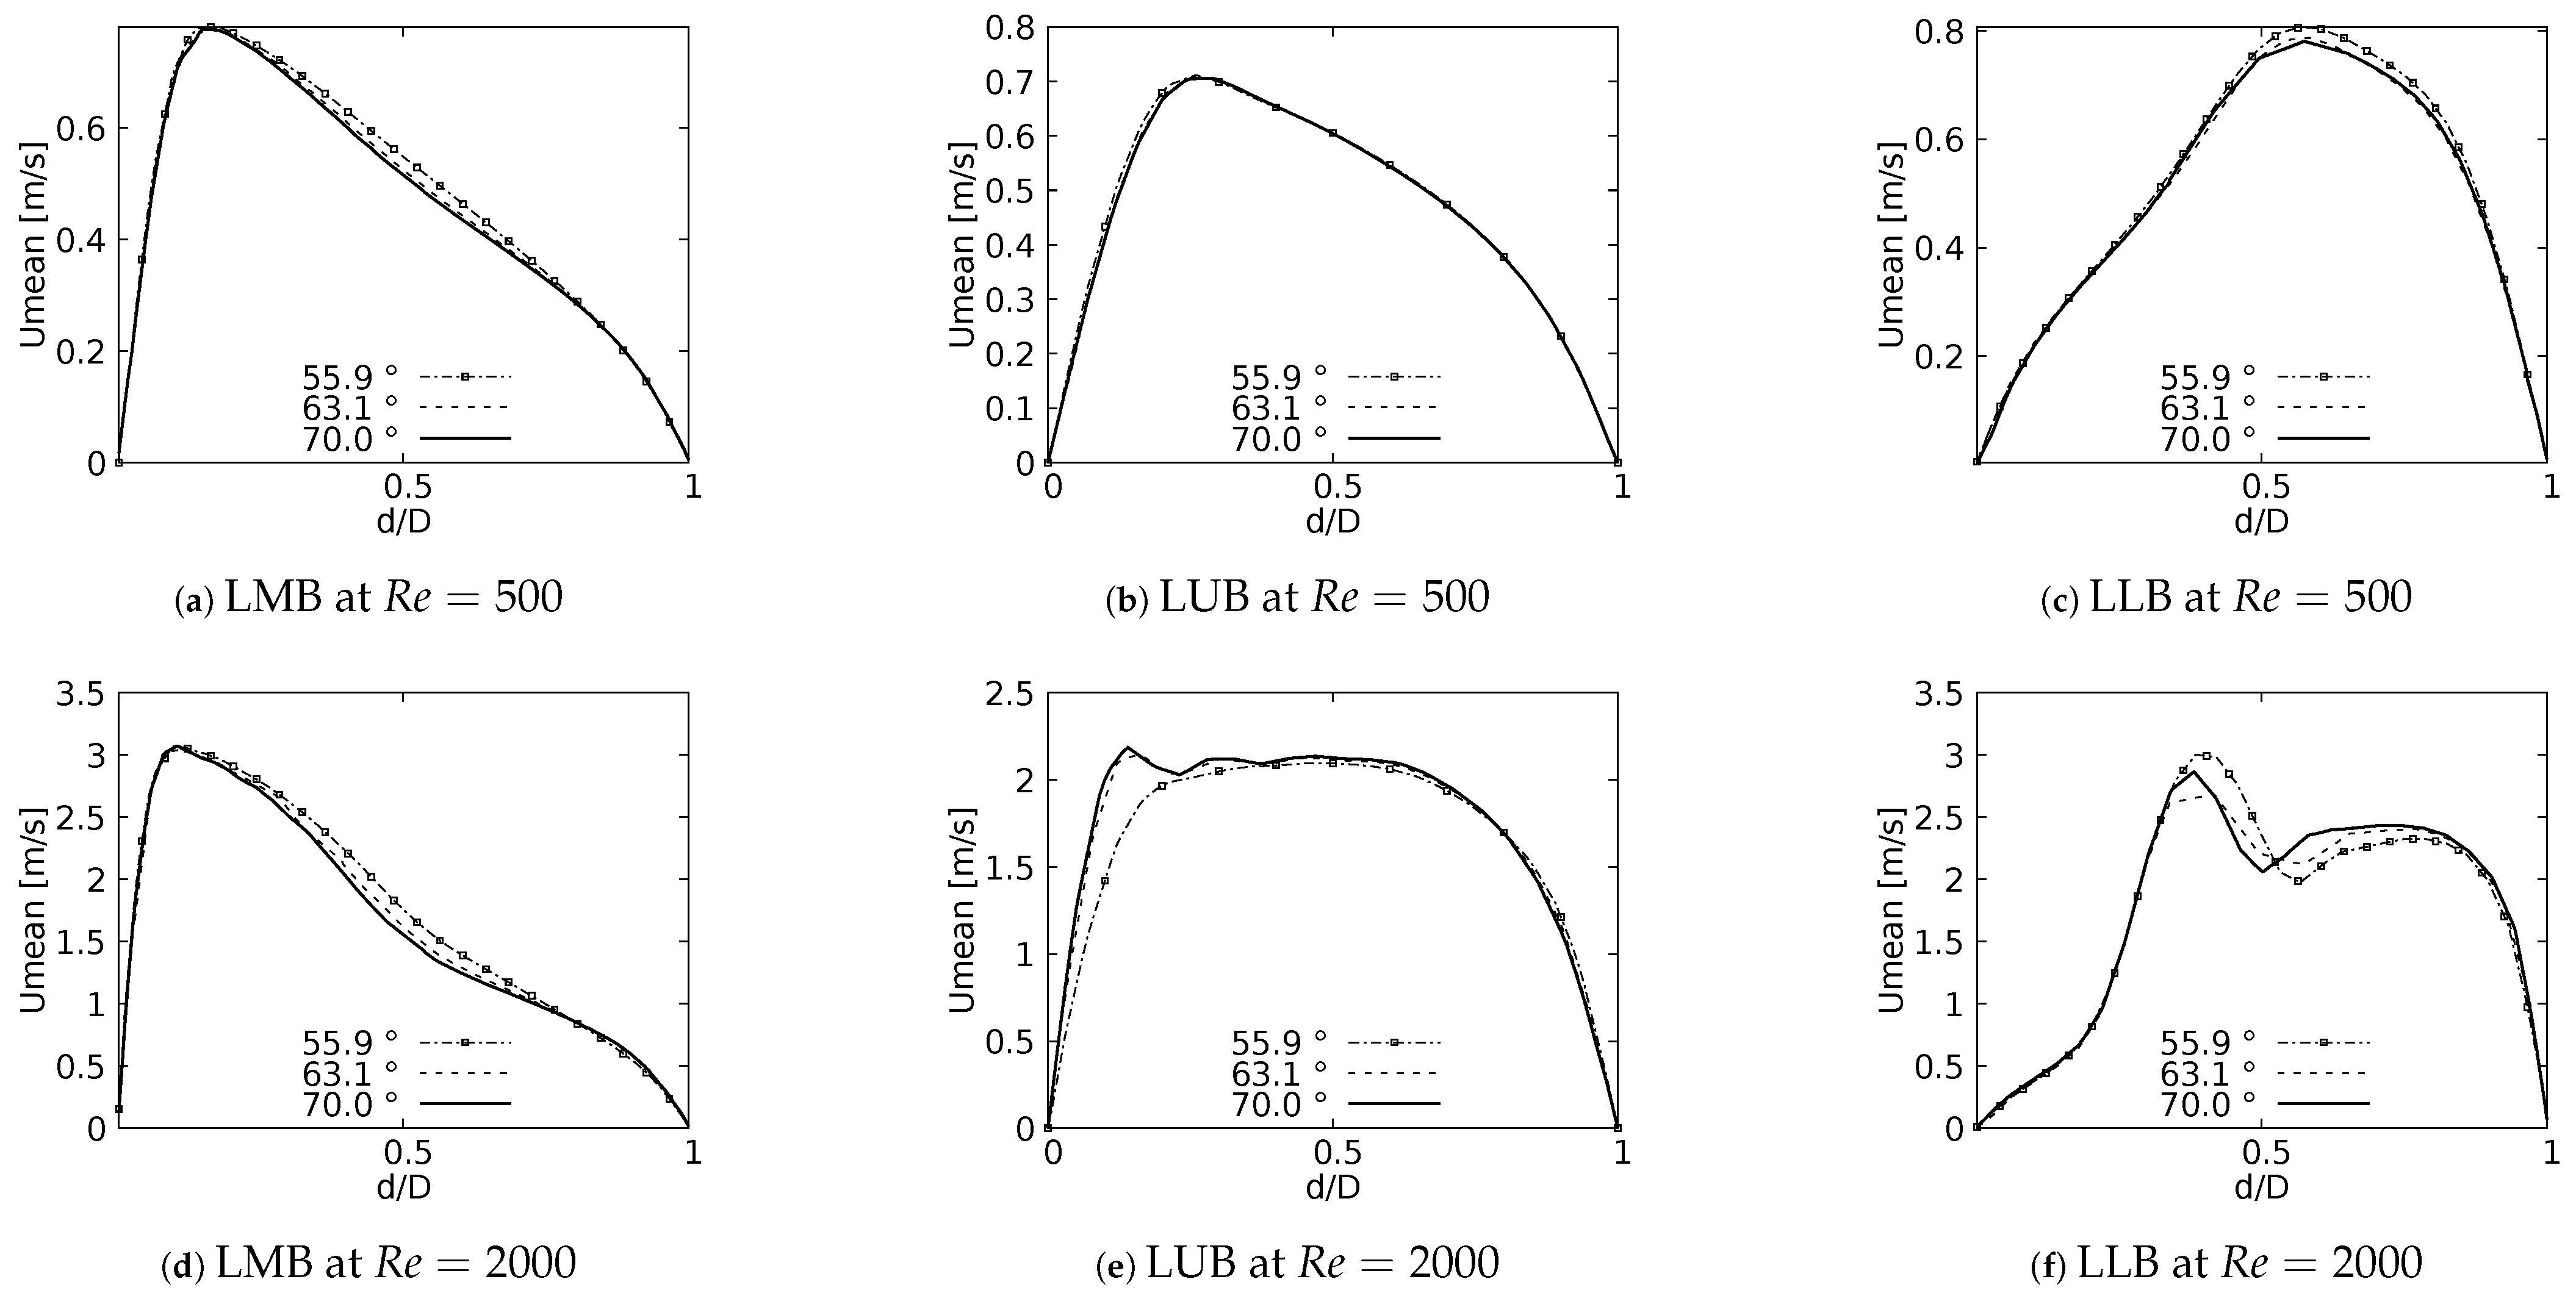
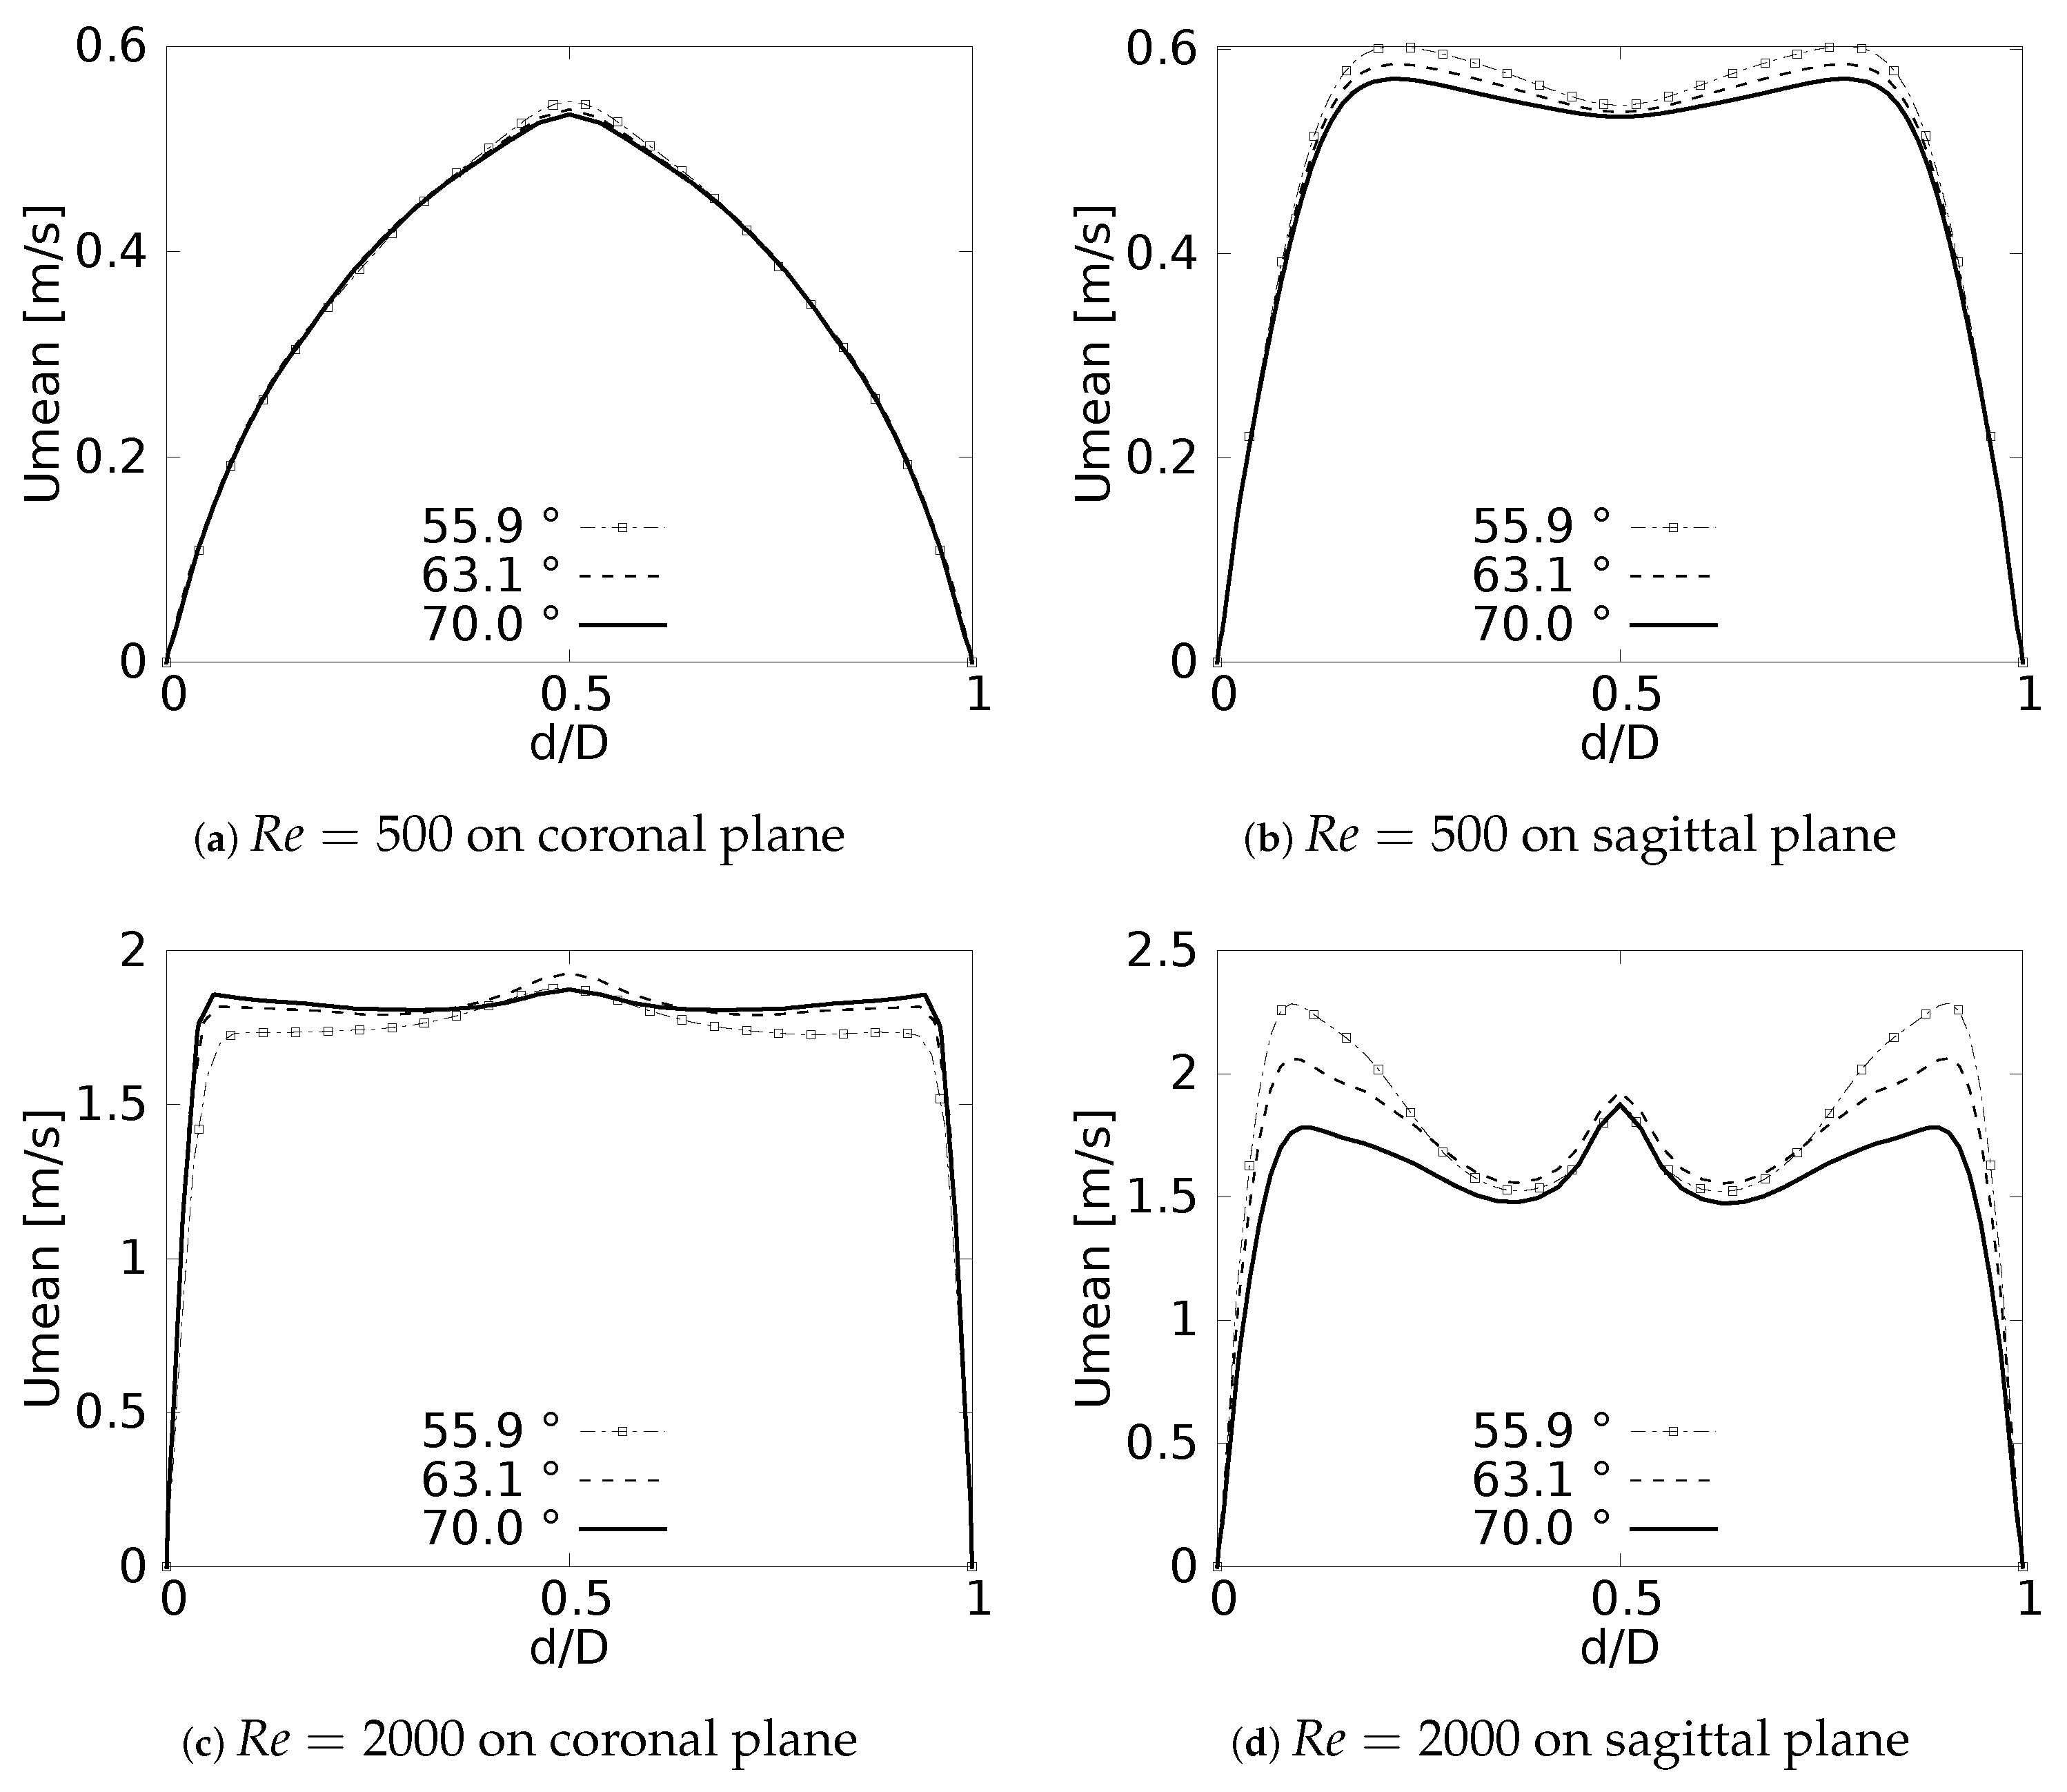
3.1. Velocity Profiles
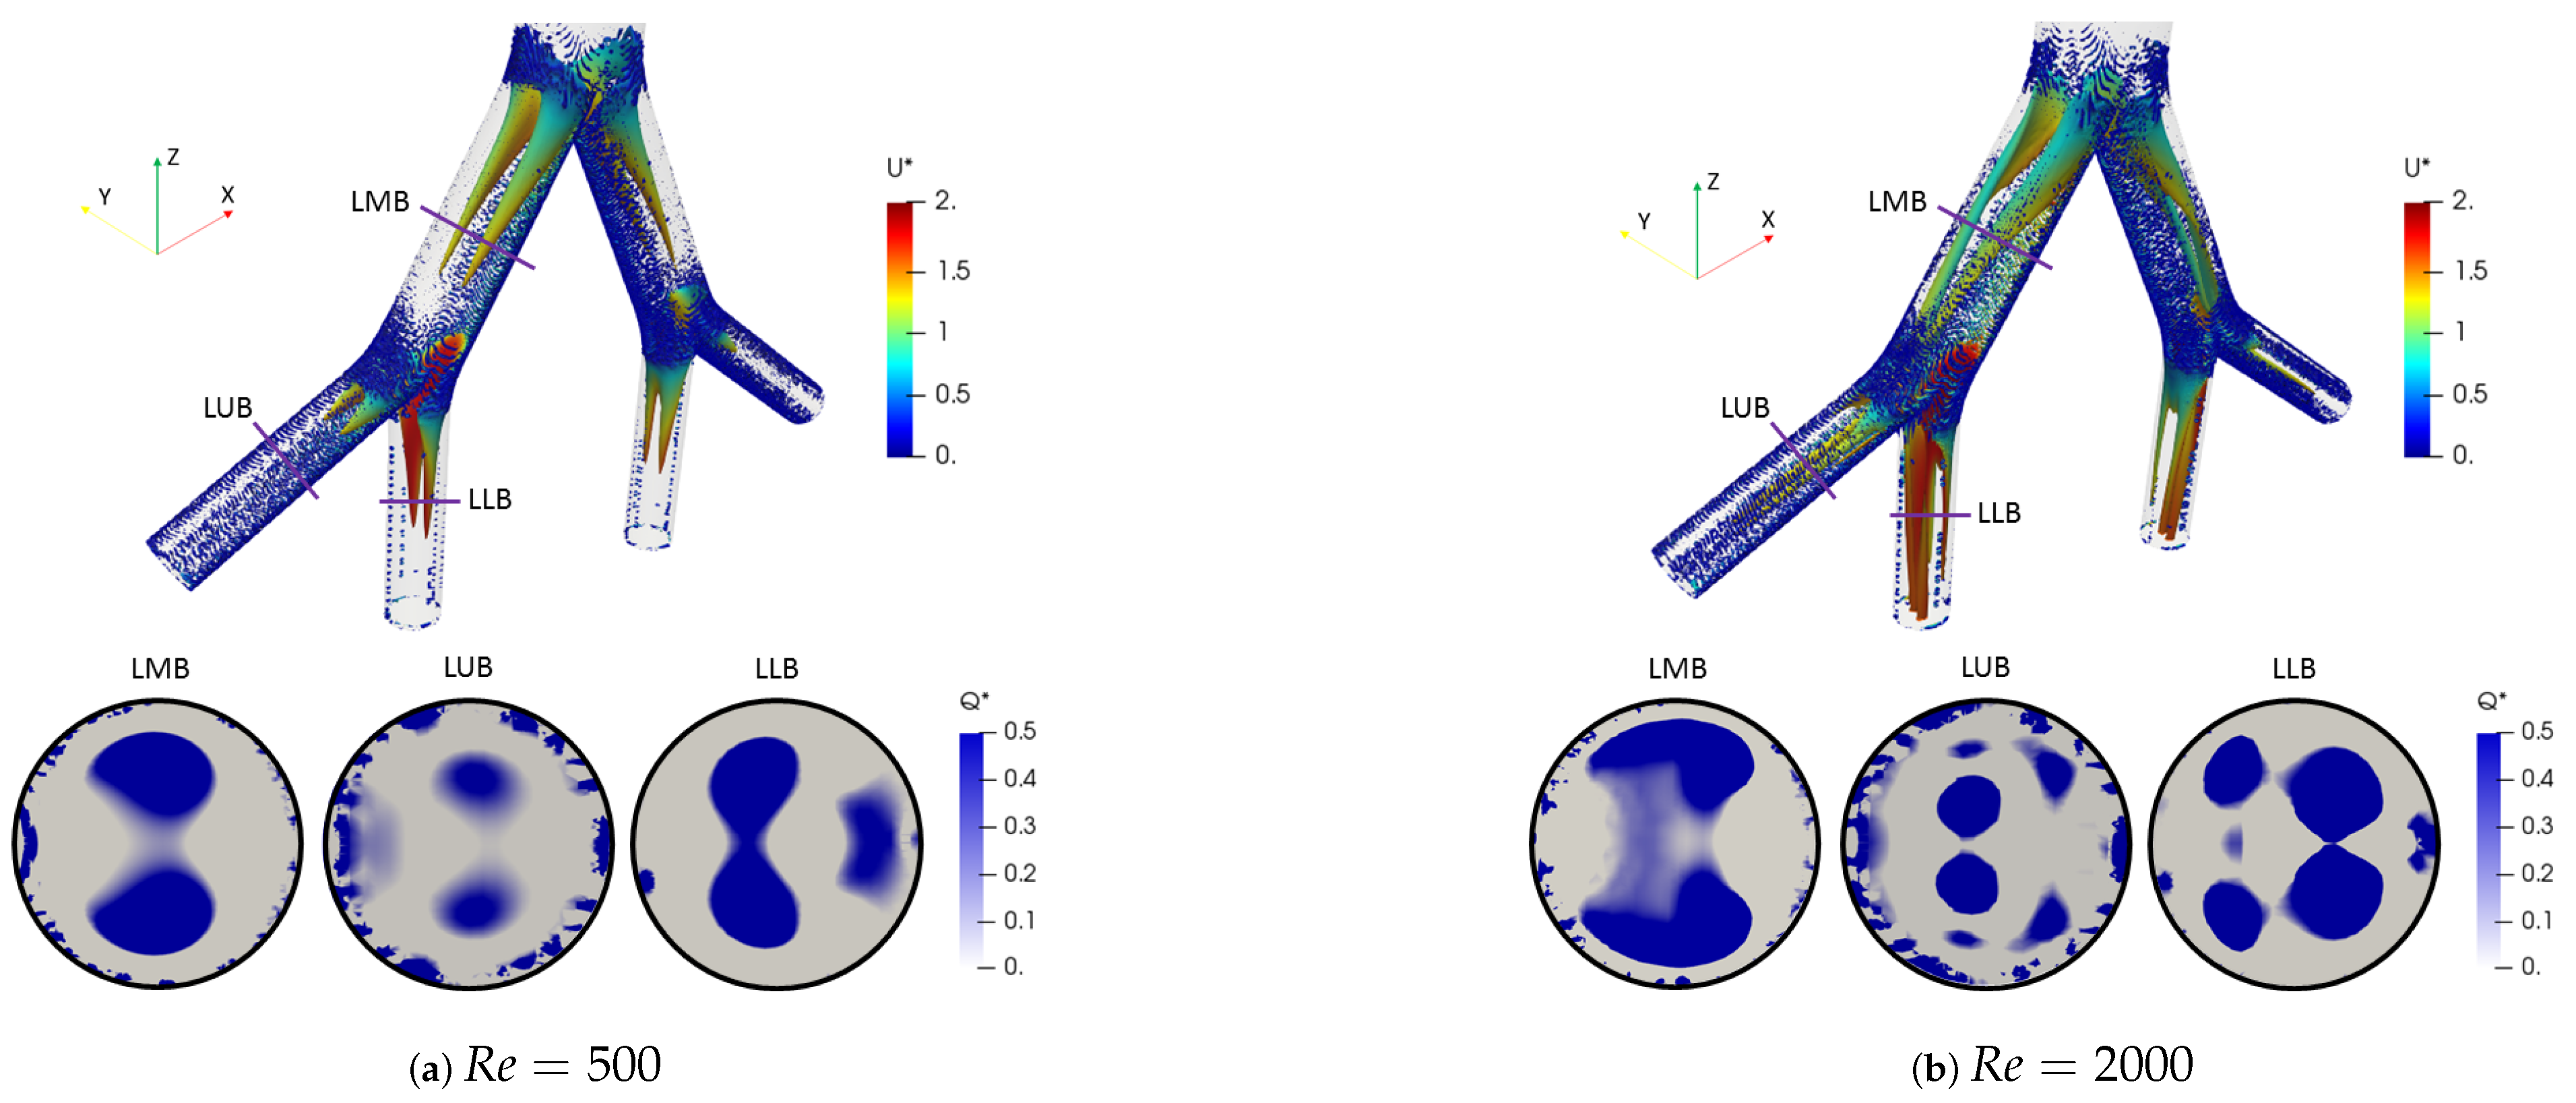
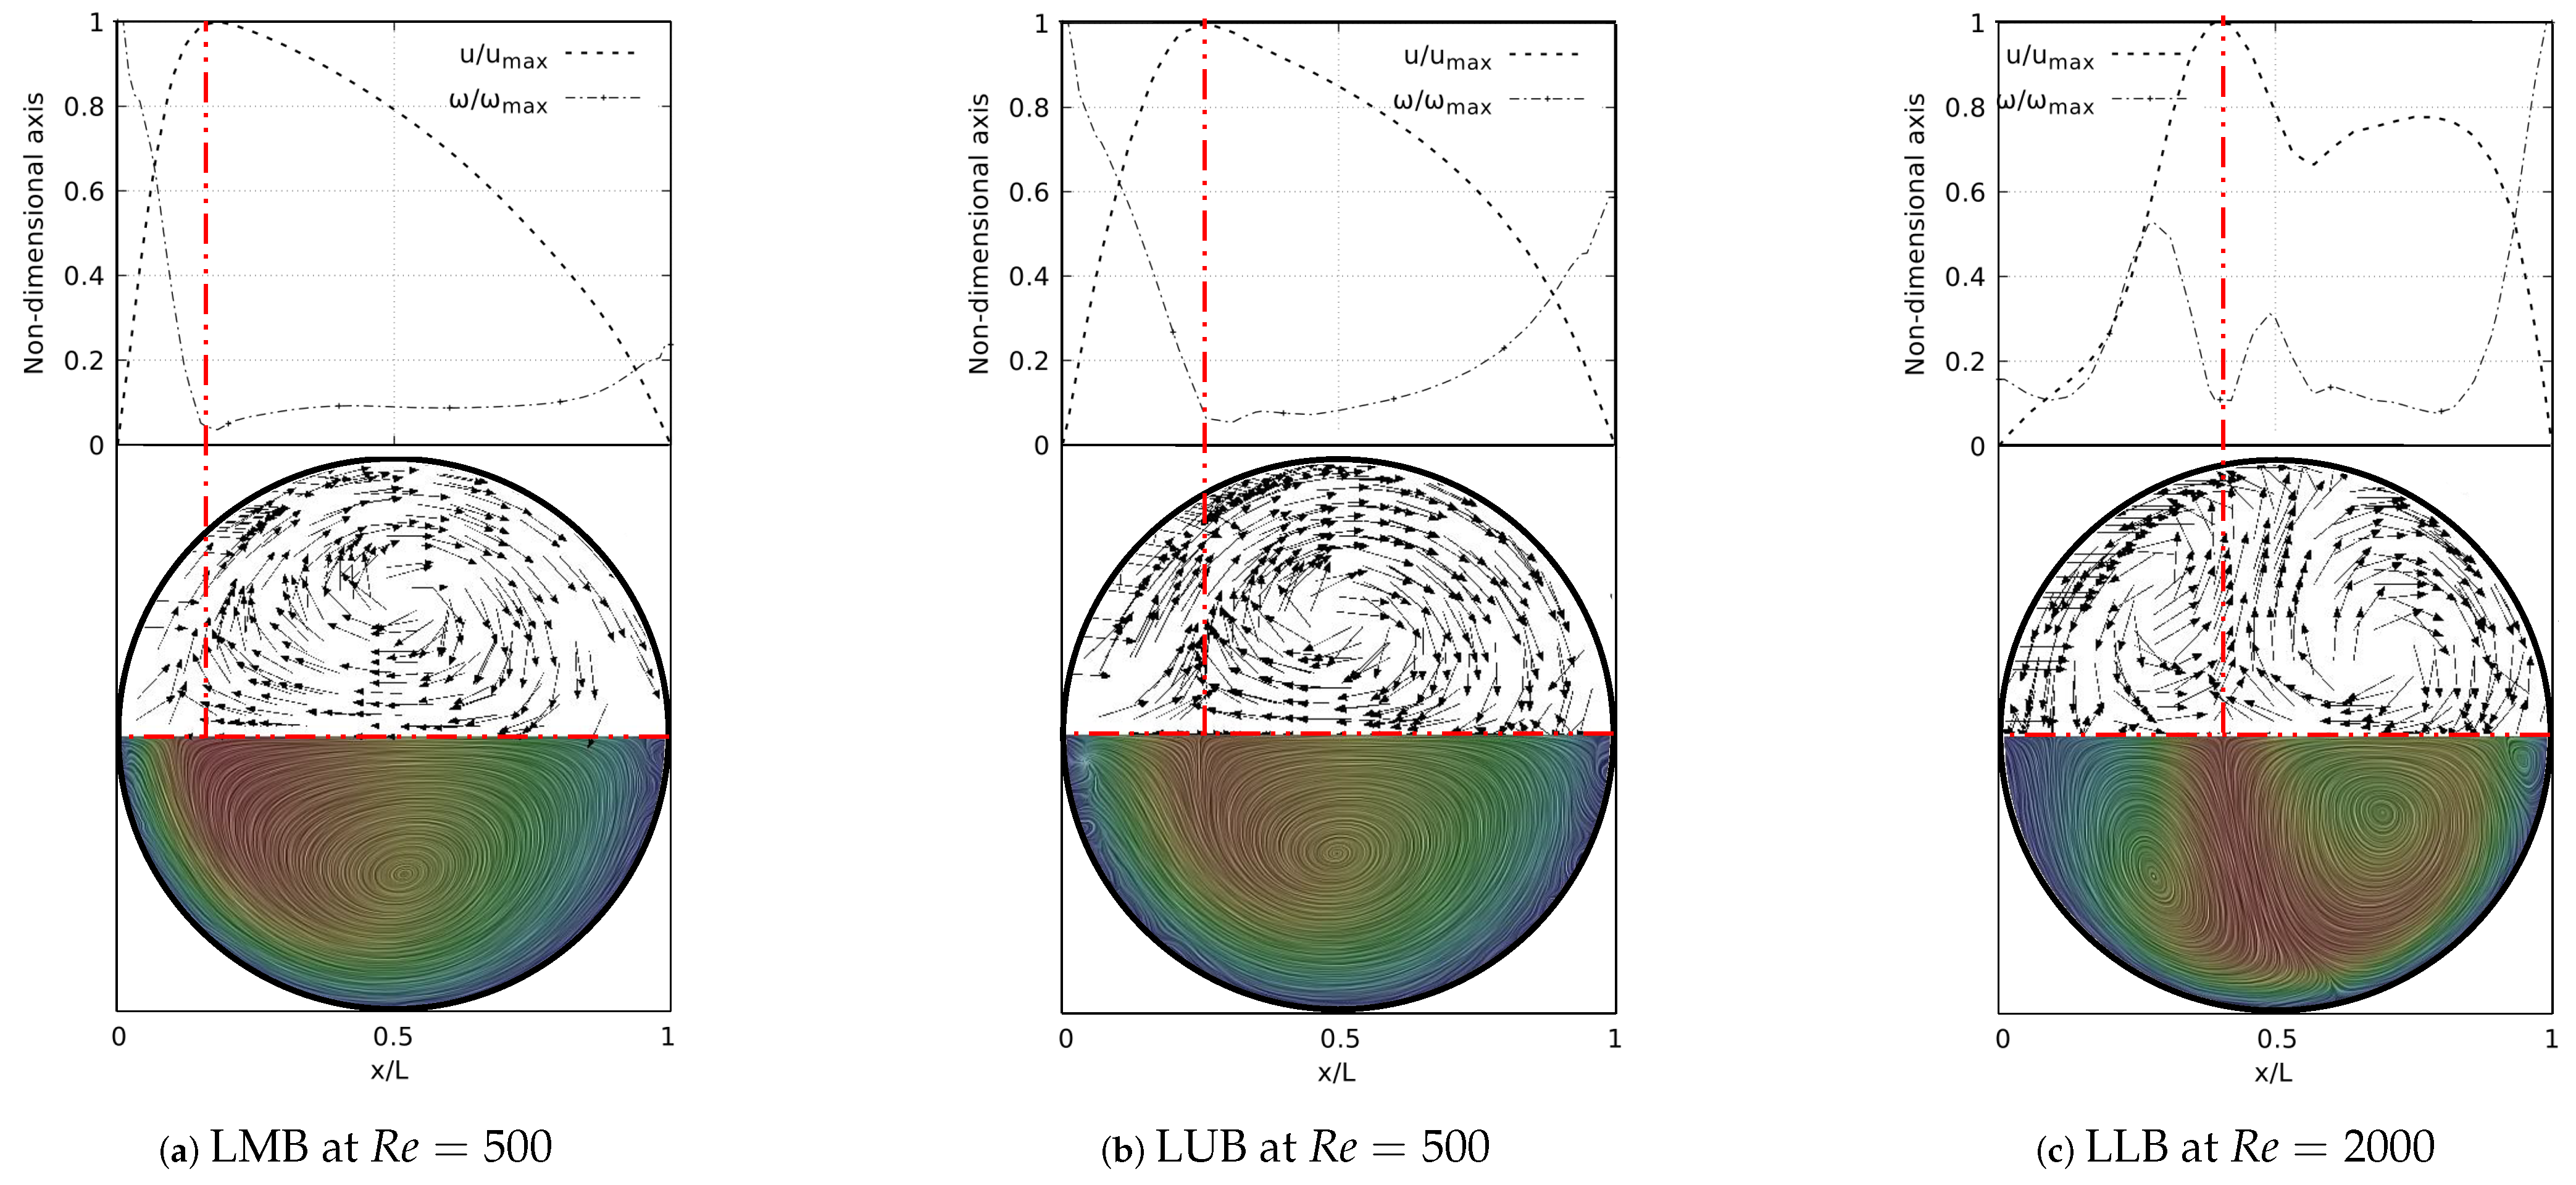
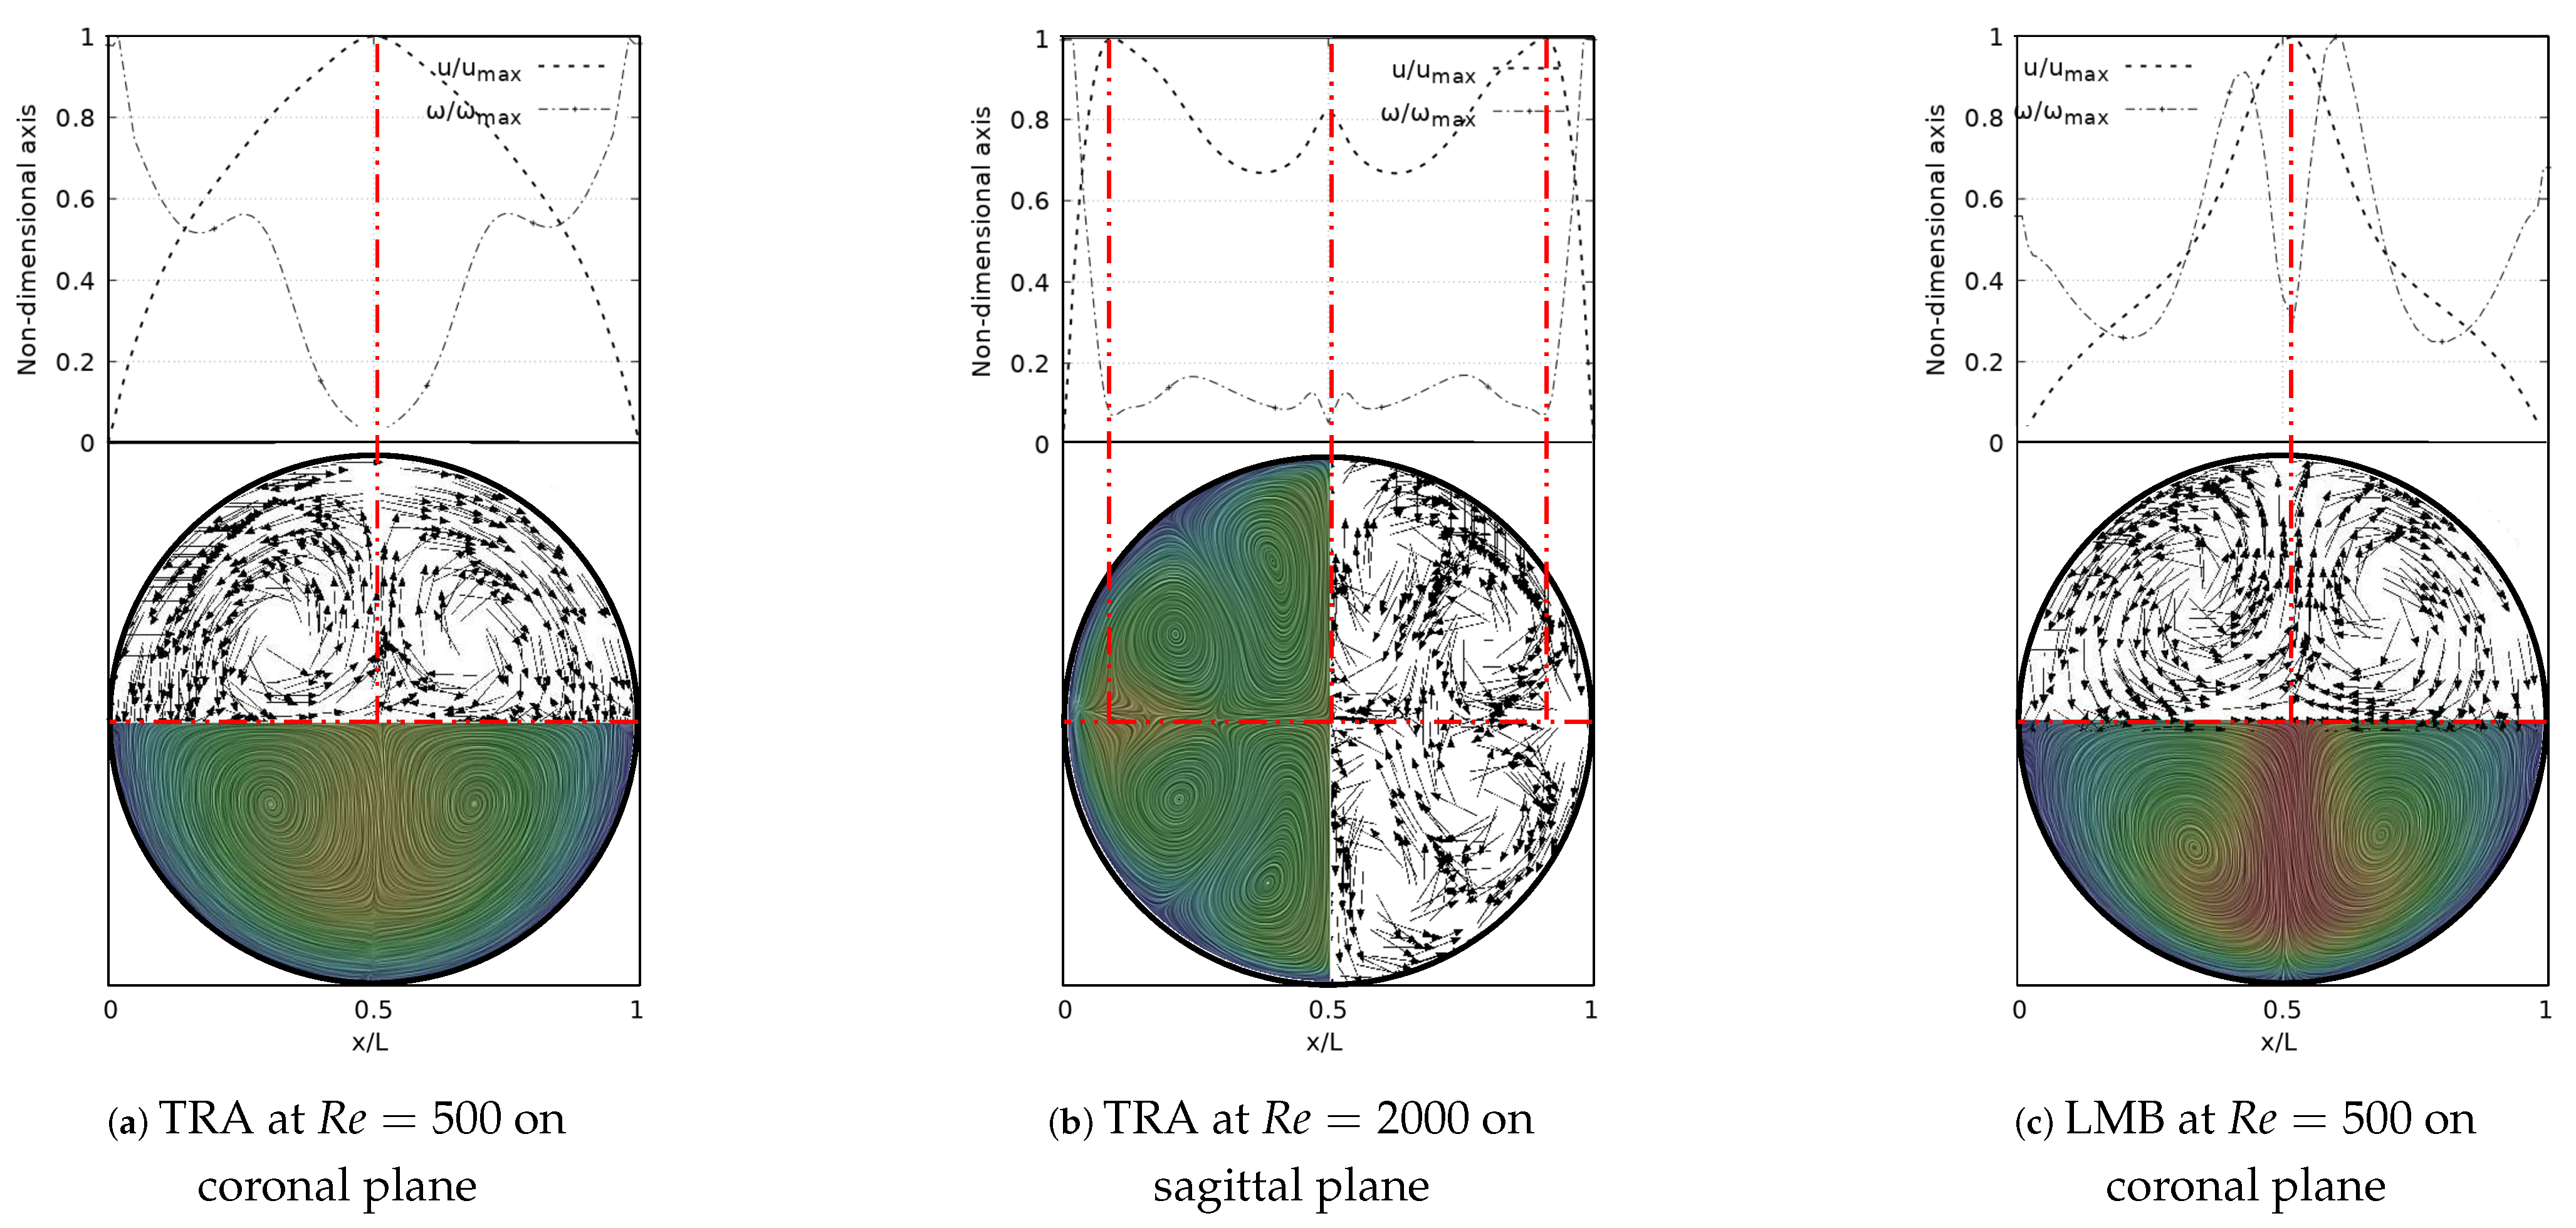
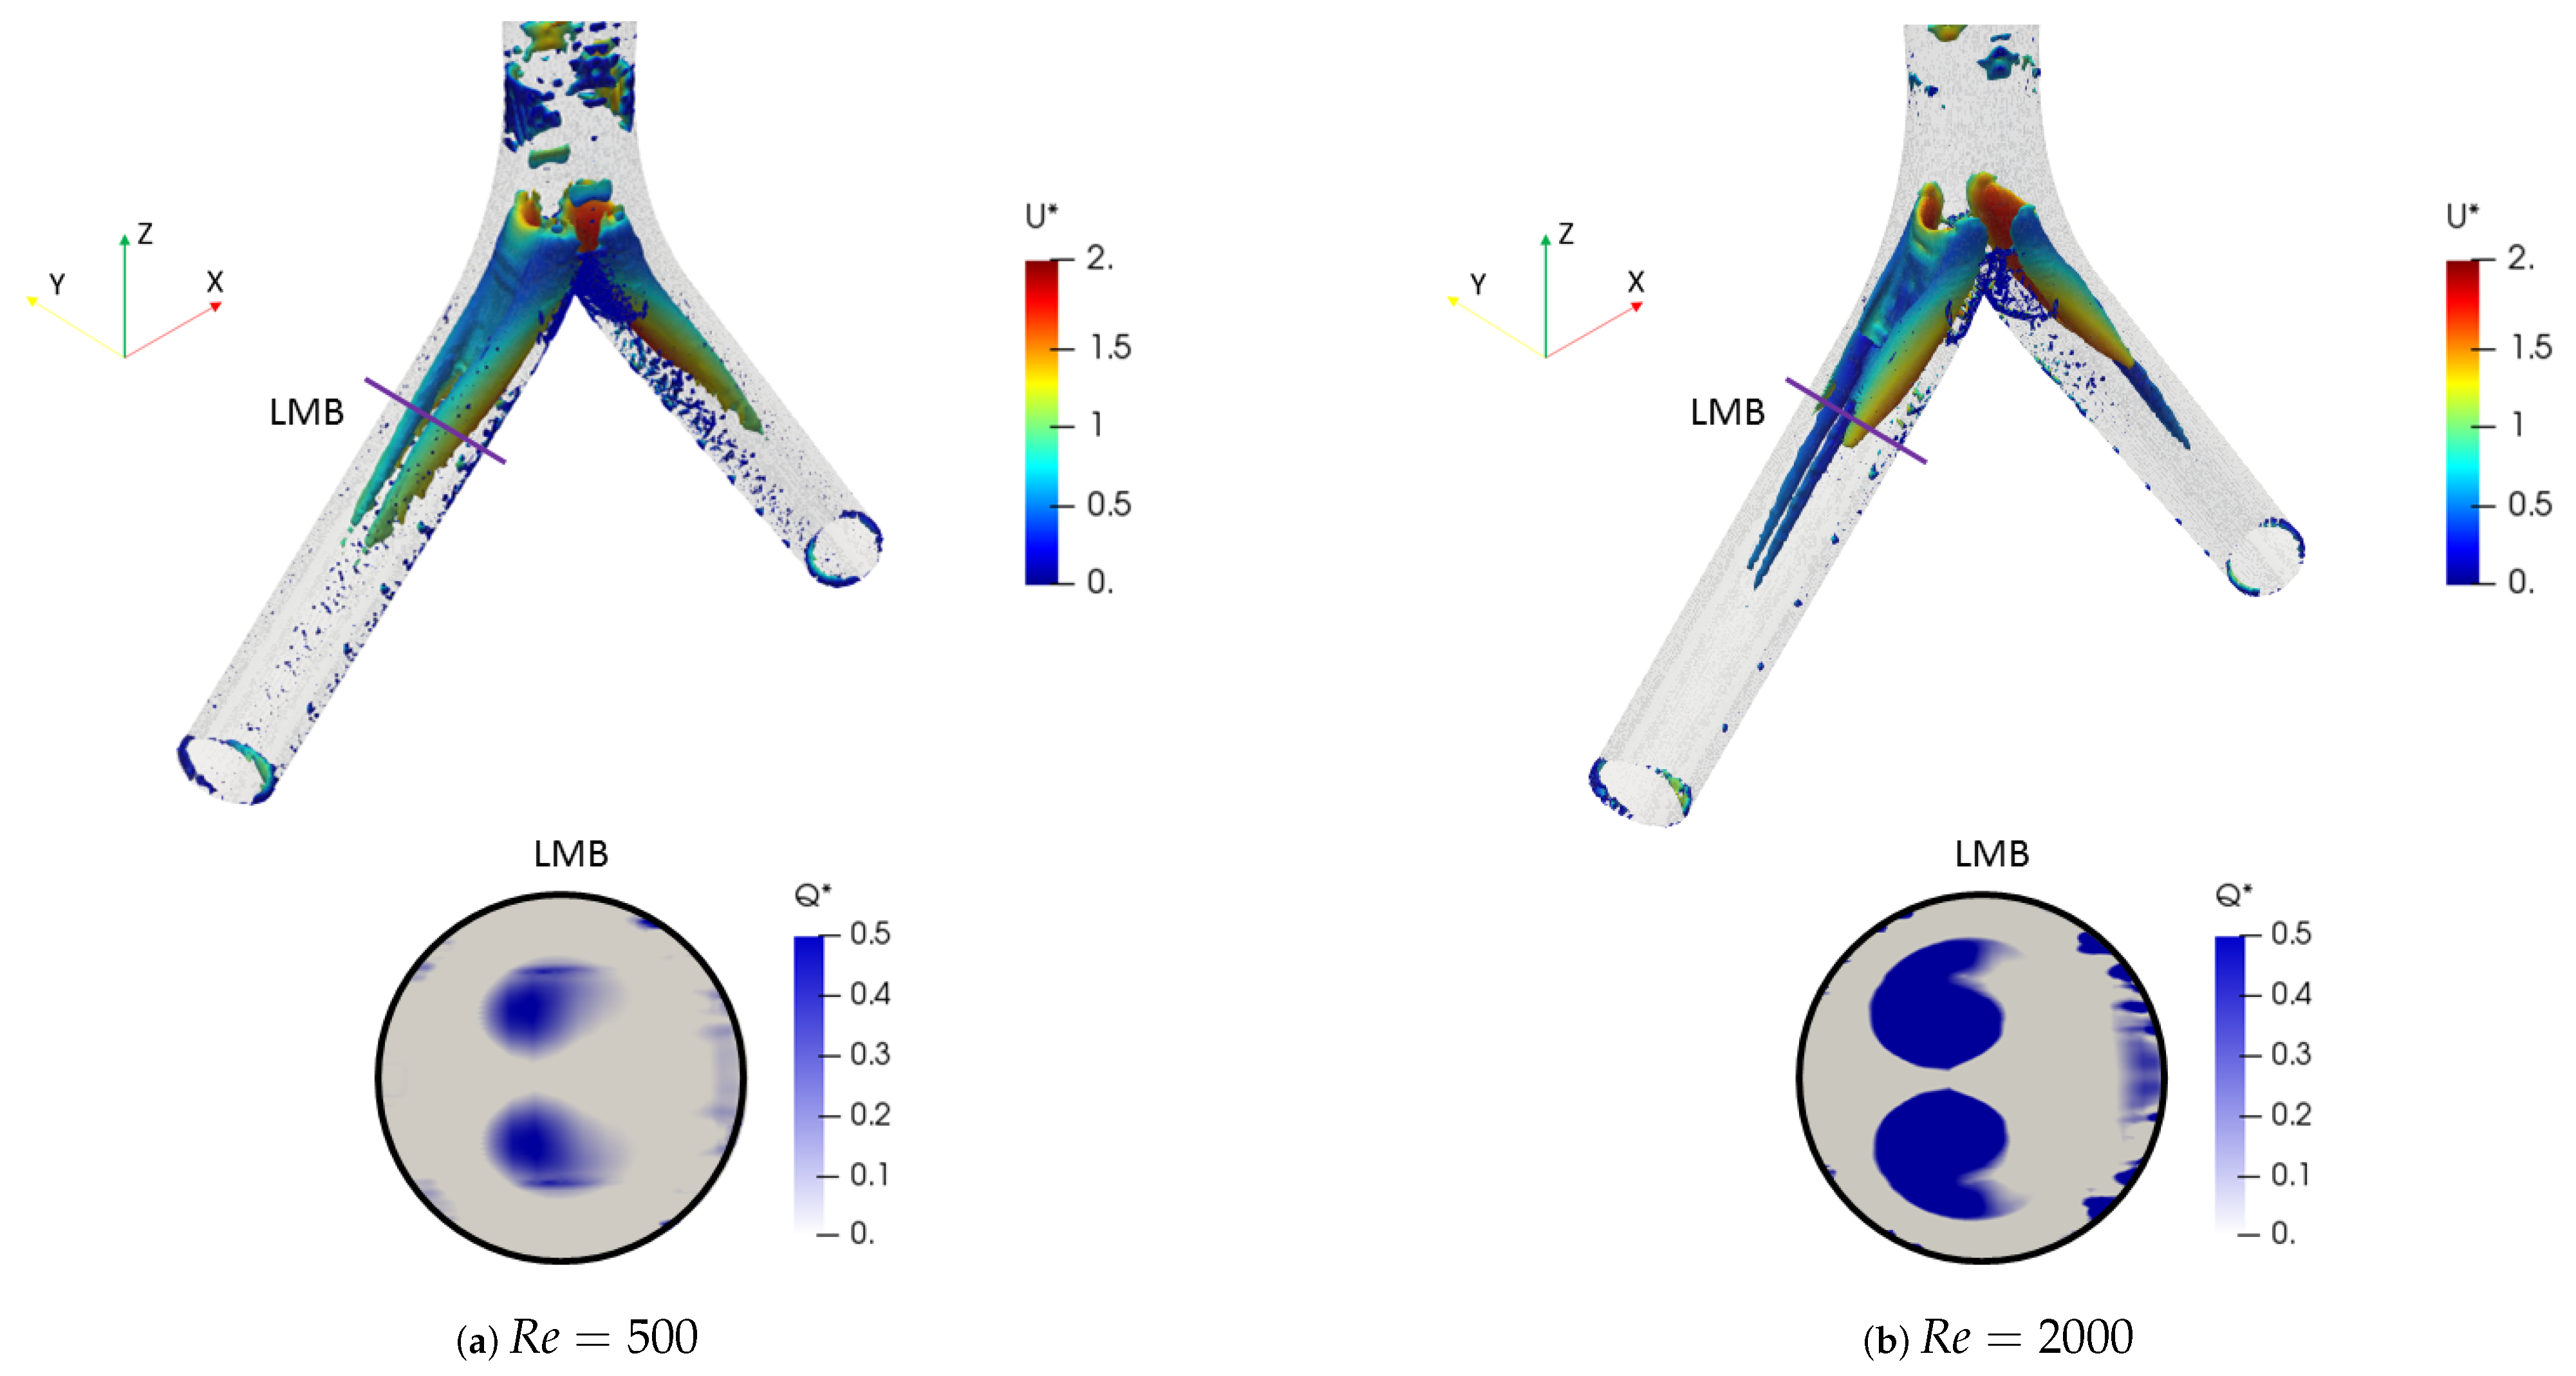
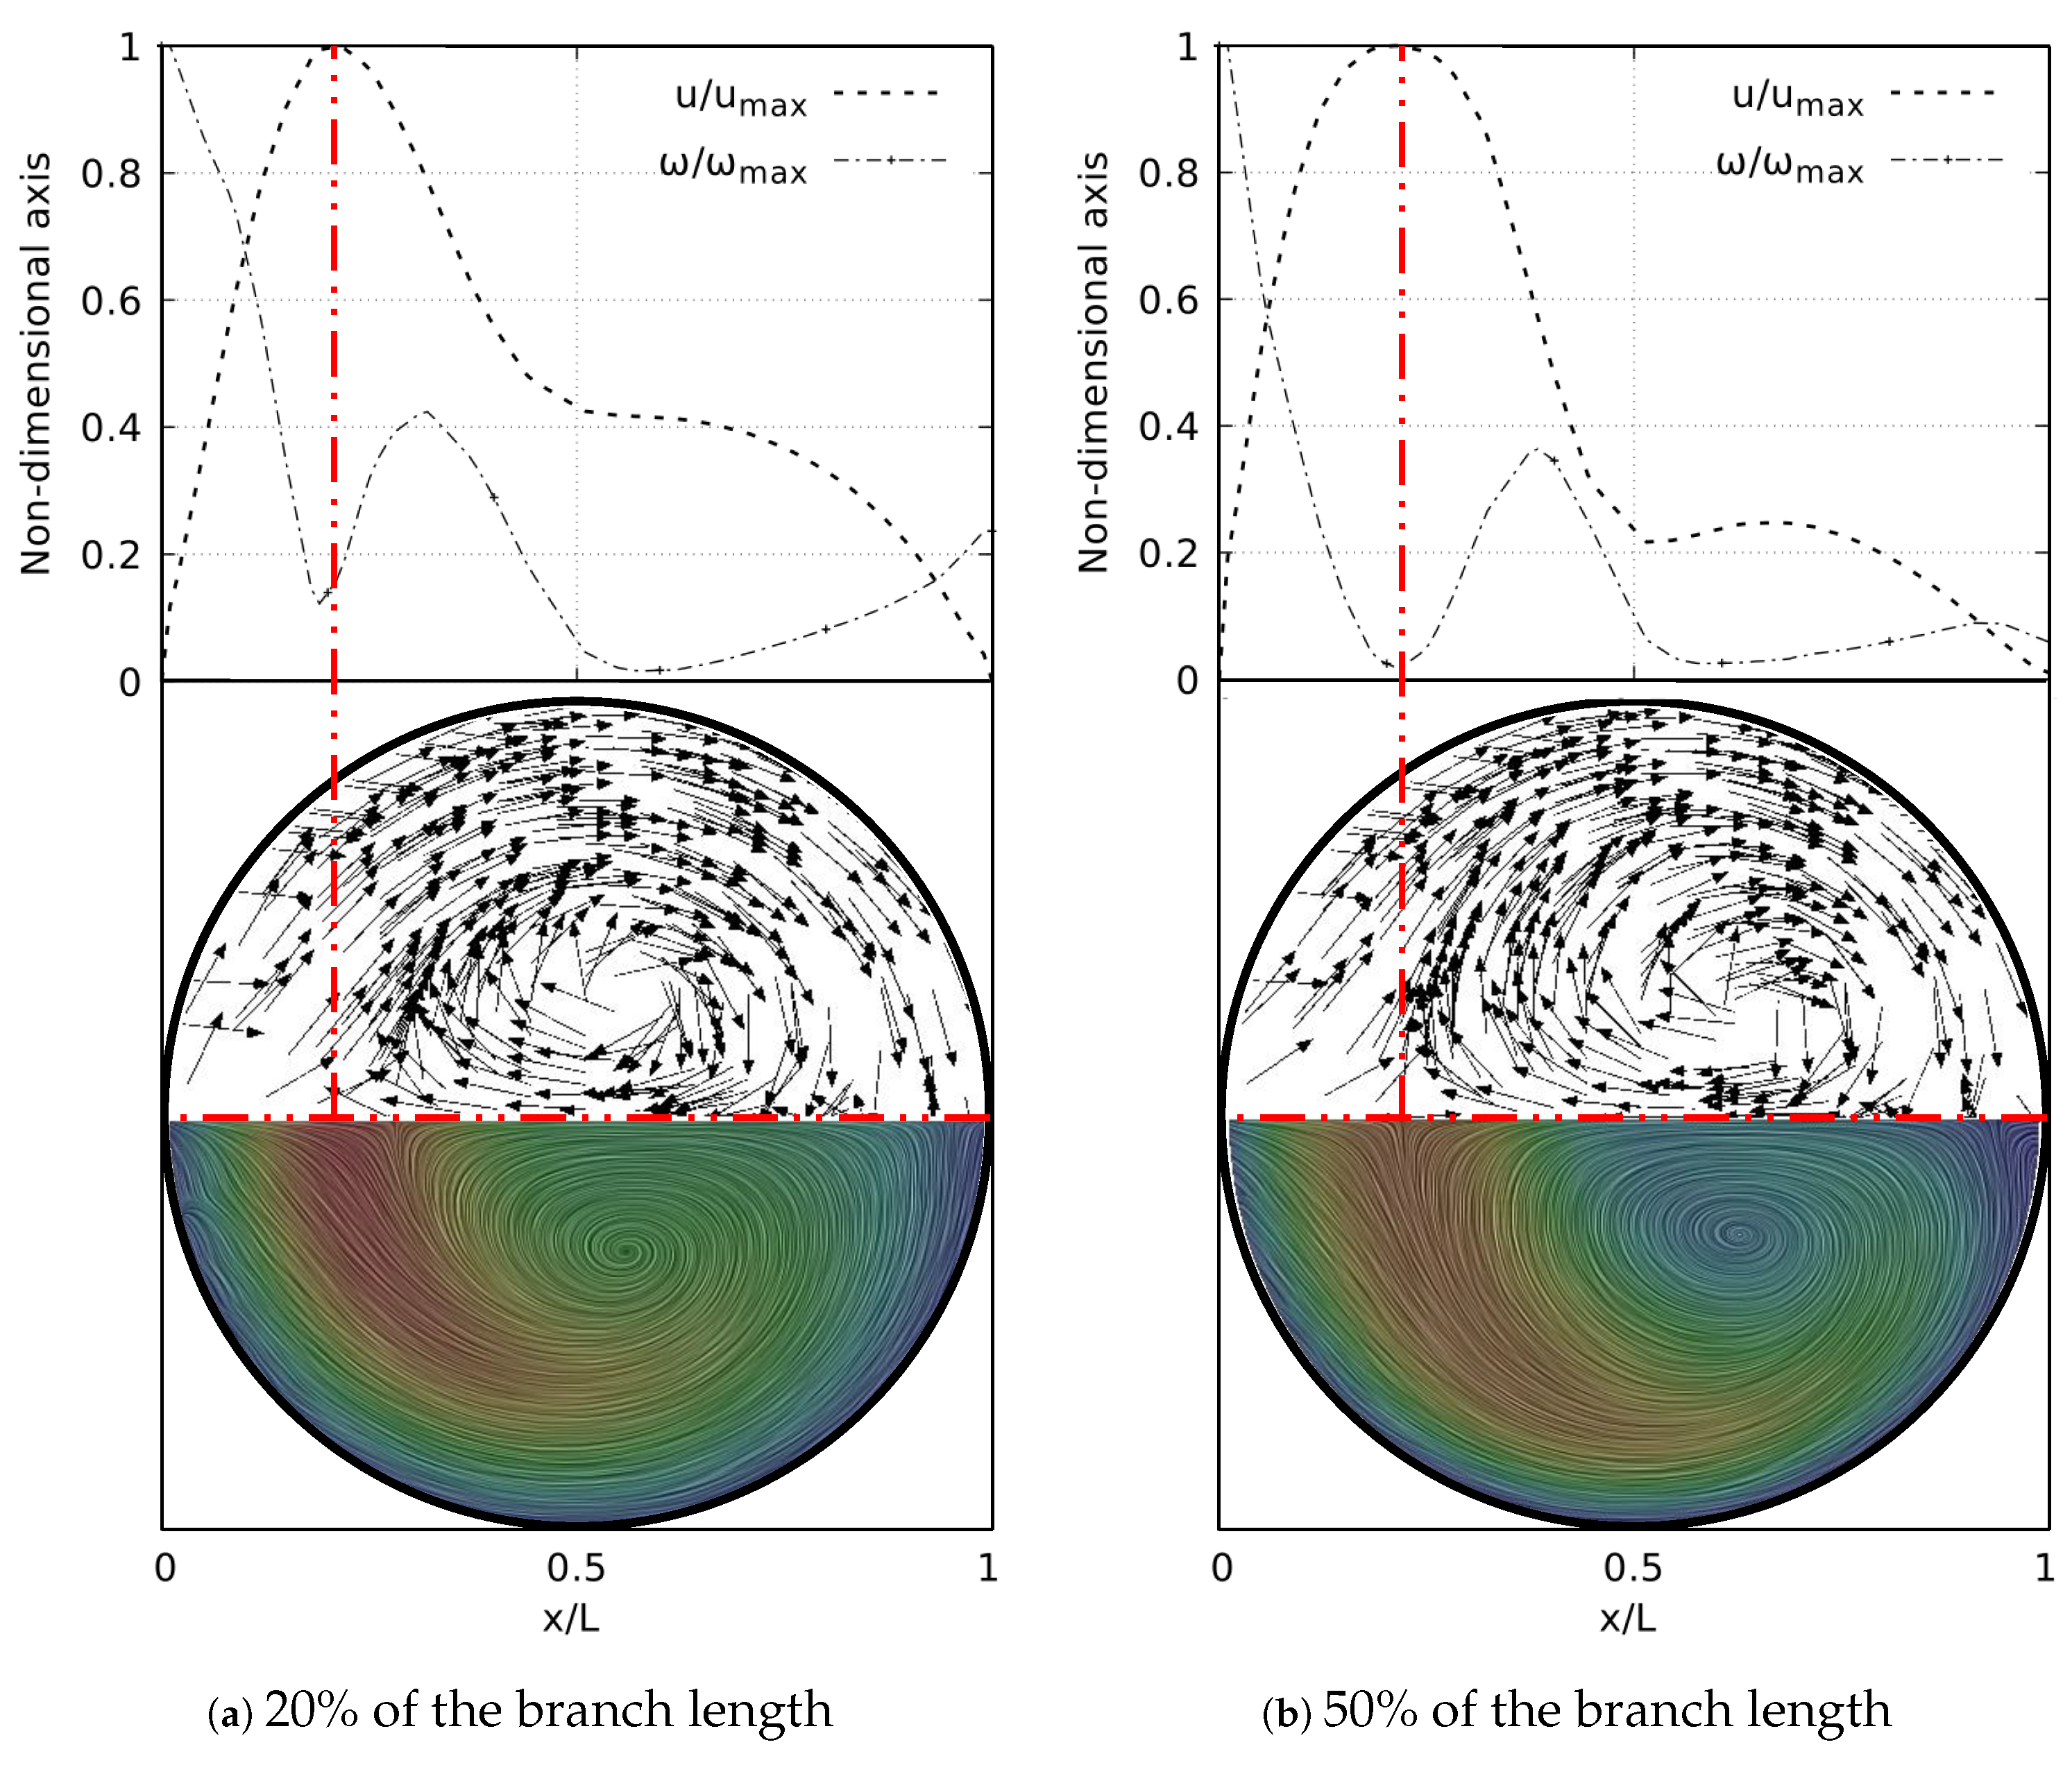
One of the main features of any flow pattern is the mean velocity profile. For the intended analysis, mean velocity profiles on the coronal plane for the selected BAs were constructed, and are shown in Figure 7 for flows at Re = 500 and Re = 2000 . These curves were built using a normalized length d / D which was measured at the centre of each branch: Left Main Bronchus (LMB), Left Upper Lobar Bronchus (LUB) and Left Lower Lobar Bronchus (LLB), following the nomenclature described in Figure 1. The unit of the magnitude of the mean velocity was [m/s]. Velocity averages were performed only when the flow was fully developed, i.e., in the steady state of the simulation. As reported by different authors see [36,42,52,53,54], a narrowing of the velocity profile, as well as a shift of the maximum peak from the outer to the inner walls, are among the main effects of flow through a bifurcation. Observing Figure 7, it can be seen how these alterations of the velocity profiles were affected by changes in the bifurcation angle, especially at high Re numbers. For the Re = 500 regime the velocity profiles measured at the three selected positions (LMB, LUB and LLB) presented similar behavior, with a single velocity peak tending towards the inner wall of the branch, as shown in Figure 7a–c. Noteworthy is the fact that, at the lower Re regime, the BA mildly affected the narrowing of the profile, where there was a slight increase of the peak value at lower BA values, although this effect was almost imperceptible in the LUB branch. In turn, for Re = 2000 , only in the LMB branch, Figure 7d, was the behavior described above preserved. For the LUB branch, shown in Figure 7e, a two-peaks profile was obtained for the larger angles. In the case of the LLB branch, Figure 7f, a deceleration in the center of the branch led to the development of an even clearer two-peaks profile, an effect that became more noticeable as the BA decreased. It seemed clear then that the BA deformation effect on the velocity profiles, at least in comparison with symmetrical profile patterns, was stronger as the Reynolds number increased.
Figure 8 show the velocity profiles taken in the sagittal plane for the selected angles at Re = 500 and Re = 2000 . These profiles show mirrored symmetry around the axis of the branches, and a characteristic “M” shape could be identified. This shape was described by Schroter & Sudlow [53] and it illustrates how the flow velocity increased near the walls and decreased towards the branch axis. As shown in Figure 8a,c for Re = 500 , and Figure 8d,f for Re = 2000 , this effect was more noticeable for the LMB and LLB branches as BA increased. In contrast, for the LUB branch, Figure 8b,e, it was more pronounced as BA decreased. Again, it was evident that the velocity profiles taken in the sagittal plane were more affected by the BA as the Reynolds number became larger.
Results for the exhalation stage, presented in Figure 9, show how the velocity profiles were symmetrical, both in coronal and sagittal planes, a result that was previously observed and reported by Schroter & Sudlow [53], Corieri [55]. The existence of a single velocity peak centered in the middle of the branch in the coronal plane is illustrated in Figure 9a. In turn, the velocity profiles in the sagittal plane again developed the M-shape, as shown in Figure 9b, which had been obtained for the branches in the inhalation stage. These effects were observed for Re = 500 and were more noticeable for lower BA values. The velocity profiles in the coronal and sagittal planes for Re = 2000 are shown in Figure 9c,d, respectively. These plots show how a higher flow velocity led to the generation of three peaks located both in the center and near the branch walls. For the profiles taken on the coronal plane this effect was more pronounced for larger BAs, contrary to the sagittal plane, where the effect increased with lower BA’s.

3.2. Flow Patterns

The effect of the changes of the selected morphological parameters was also explored by studying coherent vortical structures. In particular, Figure 10 shows the behavior of the vortical structures through the branched structure by applying the Q-criterion, for both Reynolds numbers at the inhalation stage. This criterion was based on the second invariant of the velocity gradient tensor and computed as:
Q = 1 2 ( | | Ω | | 2 | | S | | 2 )
where Ω is the rotation tensor and S is the rate of strain tensor. The dimensionless factor Q * = Q ( D 2 ) / ( U b u l k ) 2 described by Han et al. [56] was adopted. Likewise, the color scales for the structures are presented using the dimensionless velocity U * = U / U b u l k . The two vortex cores generated after each bifurcation point for all branches are shown in Figure 10a for Re = 500 . These structures were symmetric on the coronal plane and their location and quantity changed with respect to the number of Reynolds, as evidenced by the isocontours for Re = 2000 in Figure 10b. The presence of four vortices for the last generation (LLB and LUB branches) was evidenced. However, it is striking that the patterns obtained using the Q-criterion showed no significant changes for the range of bifurcation angles selected in this study. As illustrated in Figure 11, the vortical structures for an angle of BA = 55 . 9 were similar to those for BA = 70 at Re = 2000 .
A deeper analysis of these structures was carried out through the study of secondary flow patterns (SFP’s). This analysis was performed using a line integral convolution projection, commonly known as Surface LIC. Using the surface LIC method it is possible to establish visual analogies with temporal stability points, and to identify spatial points that act as orbit centres or as saddle points. In the present work, a correlation between these SFPs and velocity and vorticity profiles was obtained for all the bifurcation angles studied. By performing a juxtaposition of the Surface LIC plots with the velocity and vorticity profiles, a particular relationship between the vortical structures and the profiles was observed. An example of this characteristic link for the inhalation stage is presented in Figure 12 for a model featuring a BA equal to 55 . 9 . Examining the secondary flow patterns it seemed clear that in all branches dean vortices [57] and saddle points developed. These vortical structures were symmetric with respect to the coronal plane and their quantity and location depended on the Reynolds number, as discussed above with the coherent structures. If the velocity and vorticity profiles were superposed on each other, using a non-dimensional axis, a composed profile was obtained, such as those presented in Figure 12. In the present work such profiles were called “V-W” profiles. By examining these profiles, it was possible to observe how the velocity peak coincided with the point of minimum vorticity, which also consistently coincided with the location of the saddle point on the secondary flow. As illustrated in Figure 12a,b, the V-W curves for Re = 500 presented a single velocity peak and a vorticity minimum which were aligned with the saddle point. For higher flow velocities two new vortices were generated and the saddle point was relocated. As previously shown in Figure 12f, for Re = 2000 there were two velocity peaks in the LLB branch. By analyzing Figure 12c, it was observed how the peak of higher magnitude was also aligned with a local minimum of vorticity and with the central saddle point. In turn, the secondary velocity peak was also aligned with another local minimum of vorticity and with another not so well defined saddle point.
The coherent structures for the exhalation stage at different Reynolds numbers are shown in Figure 13. Similar to the structures observed in the inhalation case, the vortex cores, after the first bifurcation point, gave an indication of the existence of four vortices in the LMB branch. In the trachea, from four to eight vortices developed as the Reynolds number increased up to Re = 2000 . The comparison of these structures for BA = 55 . 9 and BA = 70 is illustrated in Figure 14. A slight difference between the vortex core lengths in the LBM branch was observed. A longer vortex core length was evident for the larger bifurcation angle.
The secondary flow patterns and the V-W profiles at exhalation stage are shown in Figure 15. These flow patterns and vorticity profiles were symmetric with respect to the coronal and sagittal planes. Figure 15a evidenced the existence of four vortices rotating around the axial axis of the trachea for Re = 500 , in line with the description derived from coherent structures. The saddle point was located exactly at the center of the branch, as well as the peak velocity and the local minimum vorticity. Similarly, for the LMB branch at Re = 500 , the saddle point remained centered on the axial axis and aligned with the peak velocity and minimum vorticity, as illustrated in Figure 15c. As described in Figure 9d, the velocity profiles over the sagittal plane for Re = 2000 showed three peaks. Figure 15b illustrates how these peaks were coincident with the three local minima of vorticity and the three saddle points visible through the flow patterns. In this case, eight vortices were clearly identifiable.

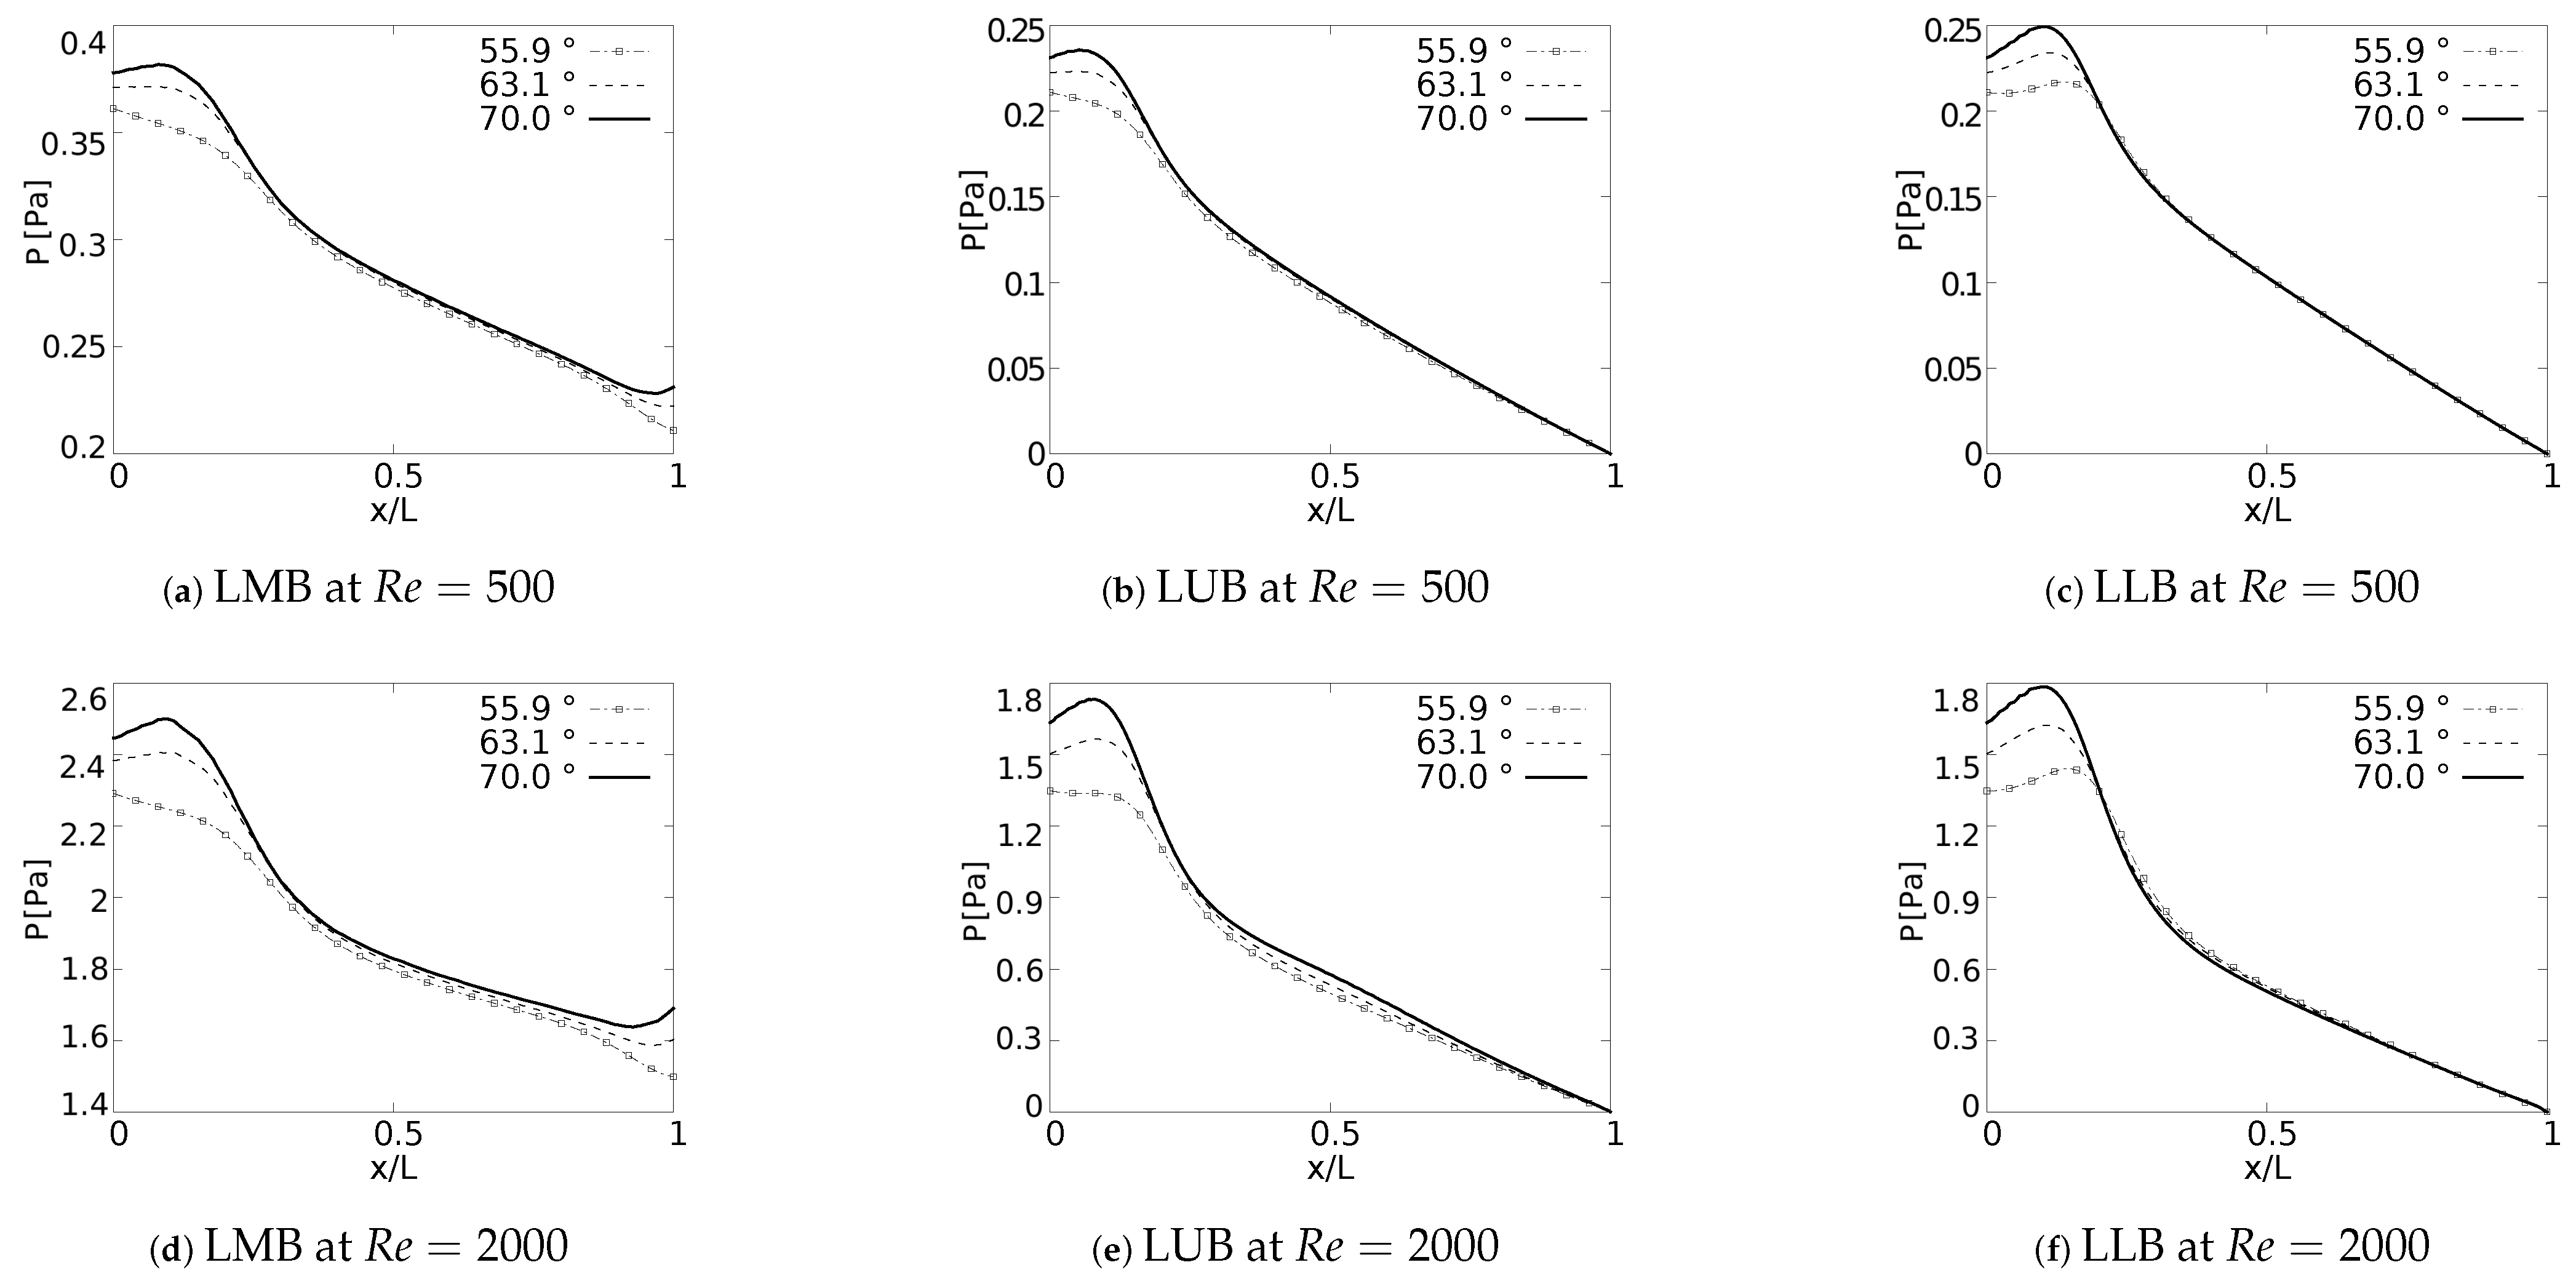
3.3. Pressure Behaviour

Pressure drop behavior, as explained by Pedley et al. [58], is directly influenced by changes in kinetic energy and by the dissipation of viscous energy. Geometric configuration and the definition of parameters, such as length and cross section, impact the pressure behavior in branched systems [59]. In fact, the numerical study in micro-channel networks, developed by Wang et al. [60], illustrated how the growth of the bifurcation angle influenced the increase of pressure drops for branched systems of rectangular cross section. Plots of P versus a normalized length along the branches axial axes are presented in Figure 16. The unit of the magnitude of the pressure was [Pa]. In all generations for all the cases explored a local pressure growth at the beginning of the axial line was evidenced. This behavior was a result of the increase of pressure gradients generated by the bifurcation points. As might be expected, a higher magnitude in pressure drop was the result of an increase in BA for all branches. This local growth was slightly noticeable for the LLB branch (Figure 16c,f) with respect to the LUB branch (Figure 16b,e). This difference was related to the velocity profiles over the coronal and sagittal plane, shown in Figure 7 and Figure 8, respectively. For the LLB branch, the velocity magnitudes were slightly larger than for the LUB branch. The maximum of this local pressure increase between the angle of BA = 55 . 9 and BA = 70 was up to 20% for the first bifurcation point.
The pressure drop profiles in the exhalation state for Re = 500 are shown in Figure 17. these profiles were plotted in the upstream direction, i.e., from the last generation towards the trachea. Contrary to the results obtained in the inhalation state, no particular behavior derived from the bifurcation angles was identified for the exhalation stage.

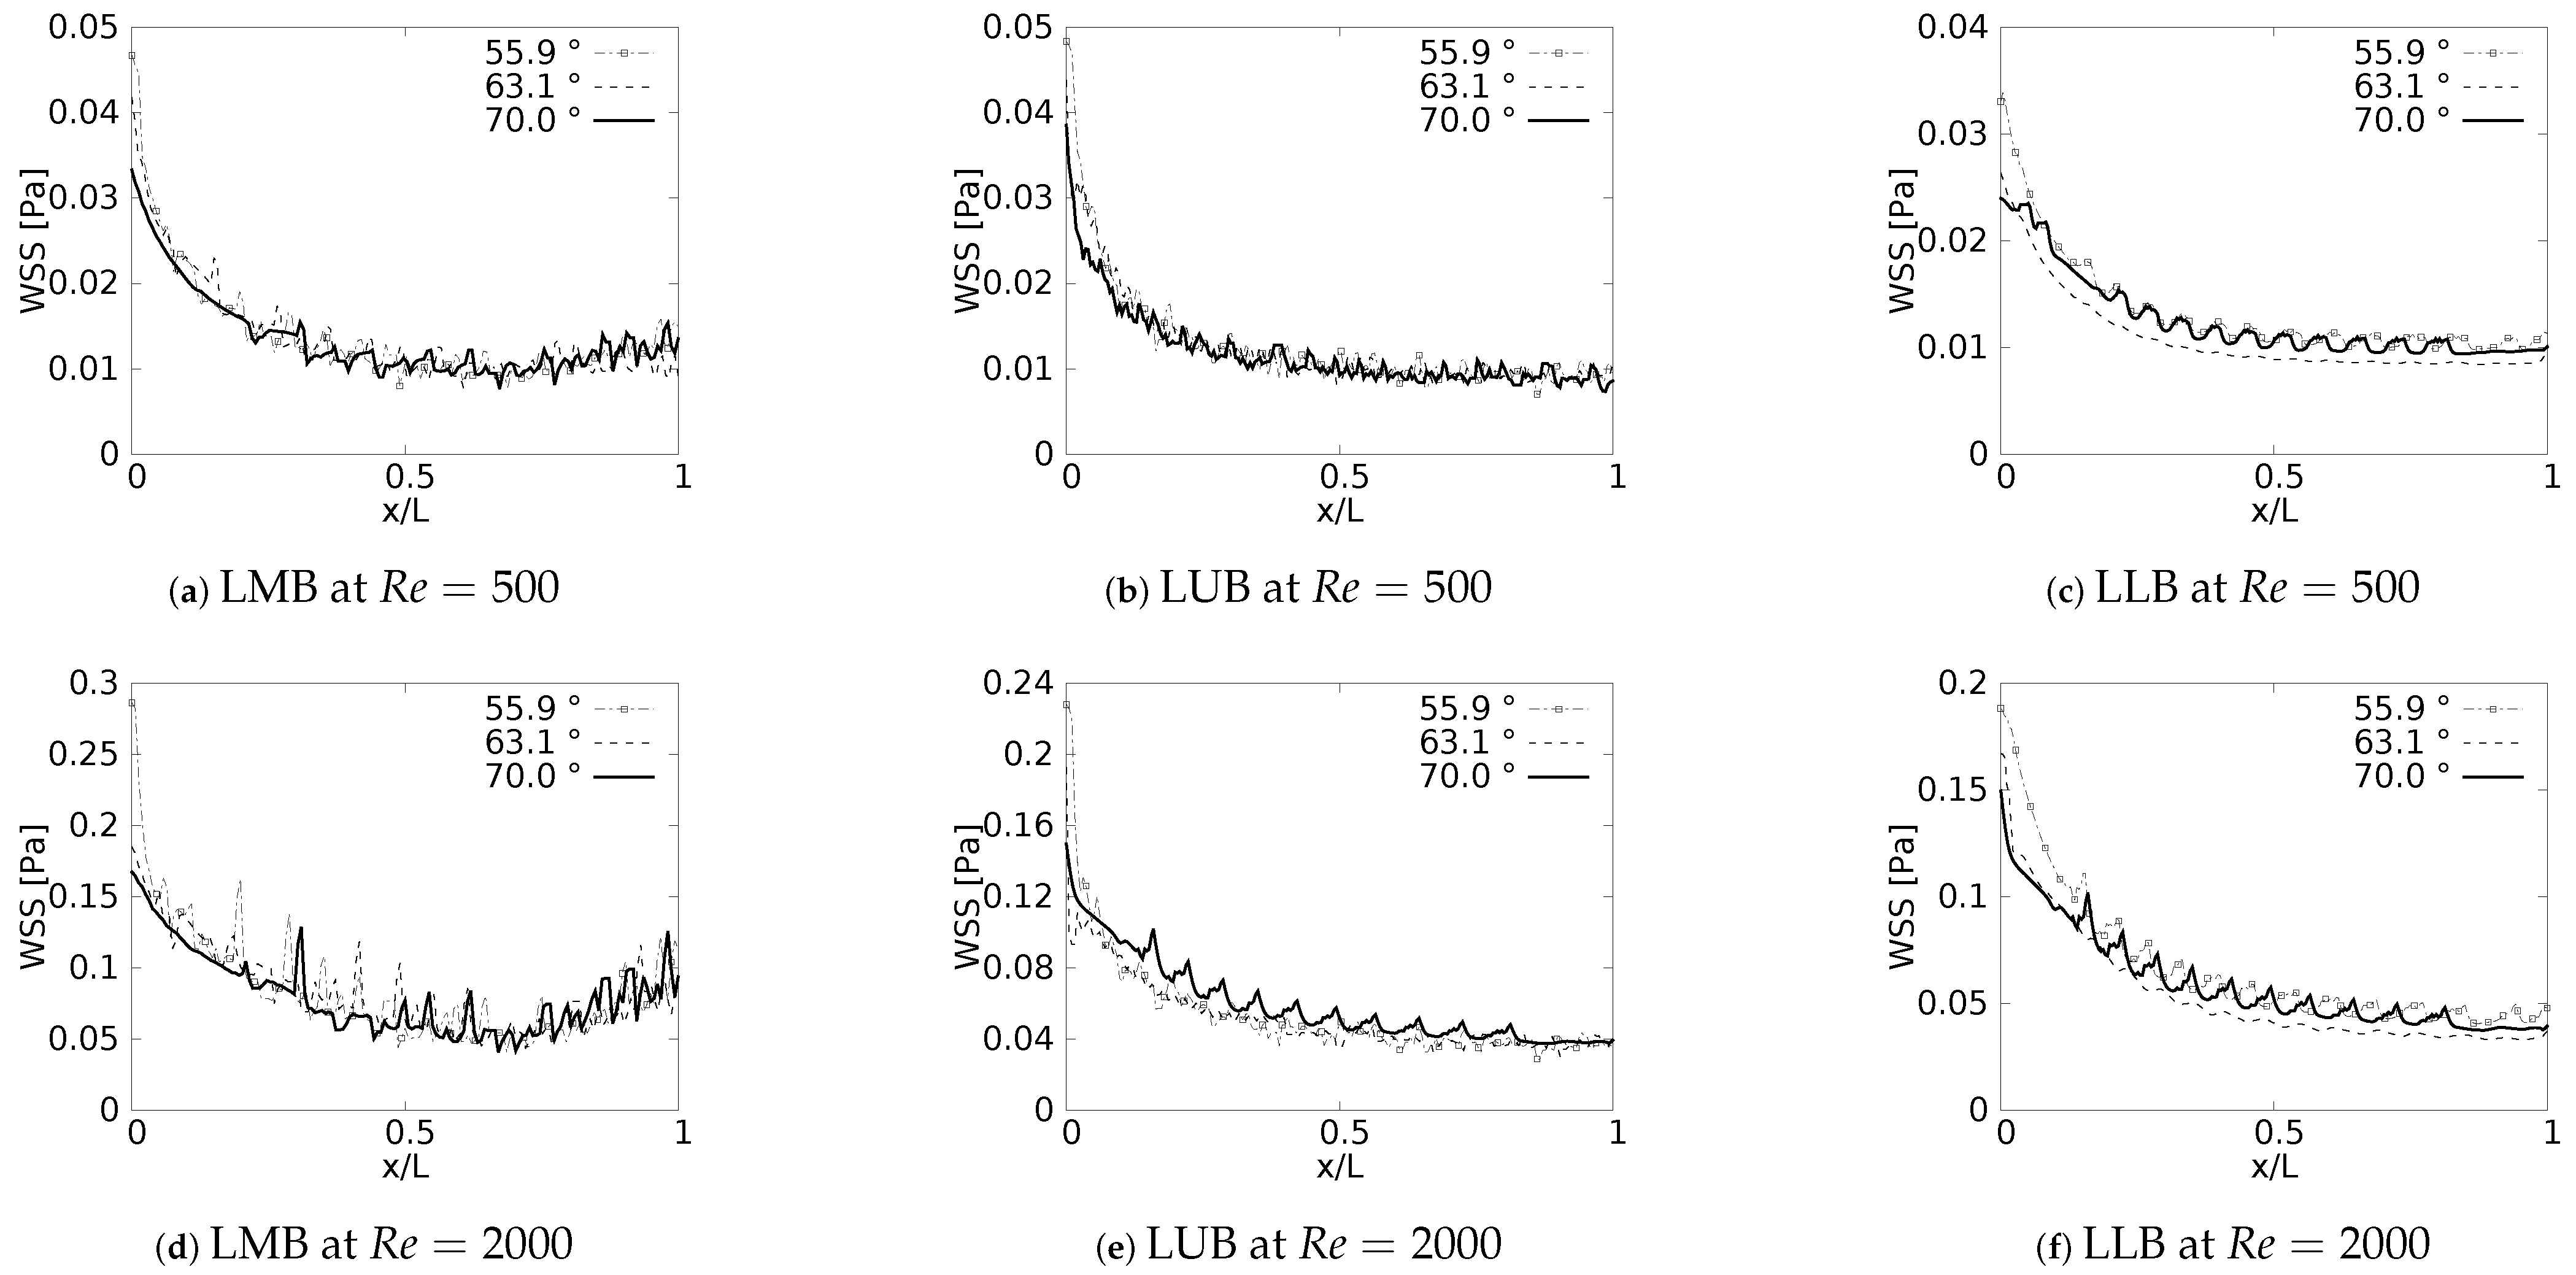
3.4. Wall Shear Stresses

During the inhalation and exhalation stages, the maximum shear stresses developed were located on the inner and external wall, respectively, as reported by different authors [61,62,63]. In a similar manner, as discussed with the pressure drop, and as might be expected, the behavior of the WSS was also strongly related to the specific changes of the velocity profiles reported in this paper. Particularly, the previously discussed tendency of displacement of the peak of the profiles (shown earlier in Figure 7) was always associated with the appearance of regions of maximum wall shear stress.
Wall shear stress was measured along the inner wall (for inhalation) and in a perpendicular direction of the inner wall (for exhalation) on each of the branches. In the different plots (Figure 18 and Figure 19), the length was presented in normalized form ( x / L , where L was the total length of the branch). In all cases, for the x-label, the values of “0” and “1” refeedr to the upstream and downstream, respectively. The unit of magnitude of the WSS was [Pa]. By analyzing the effect of the bifurcation angle (BA) on the wall shear stress distribution for the inhalation process, it was possible to determine that, as observed in different studies, the maximum shear stress was located towards the intersection of the bifurcation, that is in the region near the joints. It was further observed that, for the different branches, as the BA considered was augmented, the magnitude of the maximum WSS decreased, giving. as a result, for instance, the highest figures for WSS for the smallest angle, which, in the present study, was BA = 55 . 9 . The decrease of the WSS between the angle of BA = 55 . 9 and BA = 70 was up to 70% at the bifurcation point. Examining the WSS in each of the branches, along the local axial direction, and, therefore, progressing through the branching line, the WSS seemed to collapse, reaching an average common value regardless of the BA explored. This trend, however, was sightly disrupted in LLB (Figure 18c,f), where it was possible to appreciate a very subtle difference between the Mean values of wall shear stress attained for BA = 63 . 1 , in comparison to the other BA explored. Thus, it could be established that the shear forces varied with respect to the bifurcation angle only in the zones or regions near the bifurcation point, but converged to an average value downstream of such a point when considering inhalation.
The results obtained for the exhalation process, and presented in Figure 19, showed a completely different picture for the distribution of the wall shear stresses, at least in comparison with the inhalation process described just above. For instance, it was possible to observe that exhalation brought about an increase of the WSS in the first half of each branch, so the maximum values of WSS were present between 0.2 < x / L < 0.5 . In this case x / L was measured from the upstream bifurcation following the downstream direction and, as mentioned previously, using, as a normalizing factor, the length of the respective branch L. In any case, for all the branches, there was a reduction of the WSS that seemed to have similar behavior for the different angles considered in this work. In this exhalation process, however, a converging or collapsing trend to an average value was not clear. Noteworthy is the fact that, the maximum WSS in each branch was accompanied by strong oscillations; albeit, this oscillatory tendency was stronger for LMB than for the TRA. This particular effect might be related to the onset of flow instabilities and, eventually, some perturbations which grew in the flow direction, as a result of the increment of the local flow rate and cross sectional area. A clear indication of this phenomena was increase of the local Reynolds number as the fluid flowed downstream towards the TRA.

4. Results II. Effect of Variations of the Carina Rounding Radius (CRR)

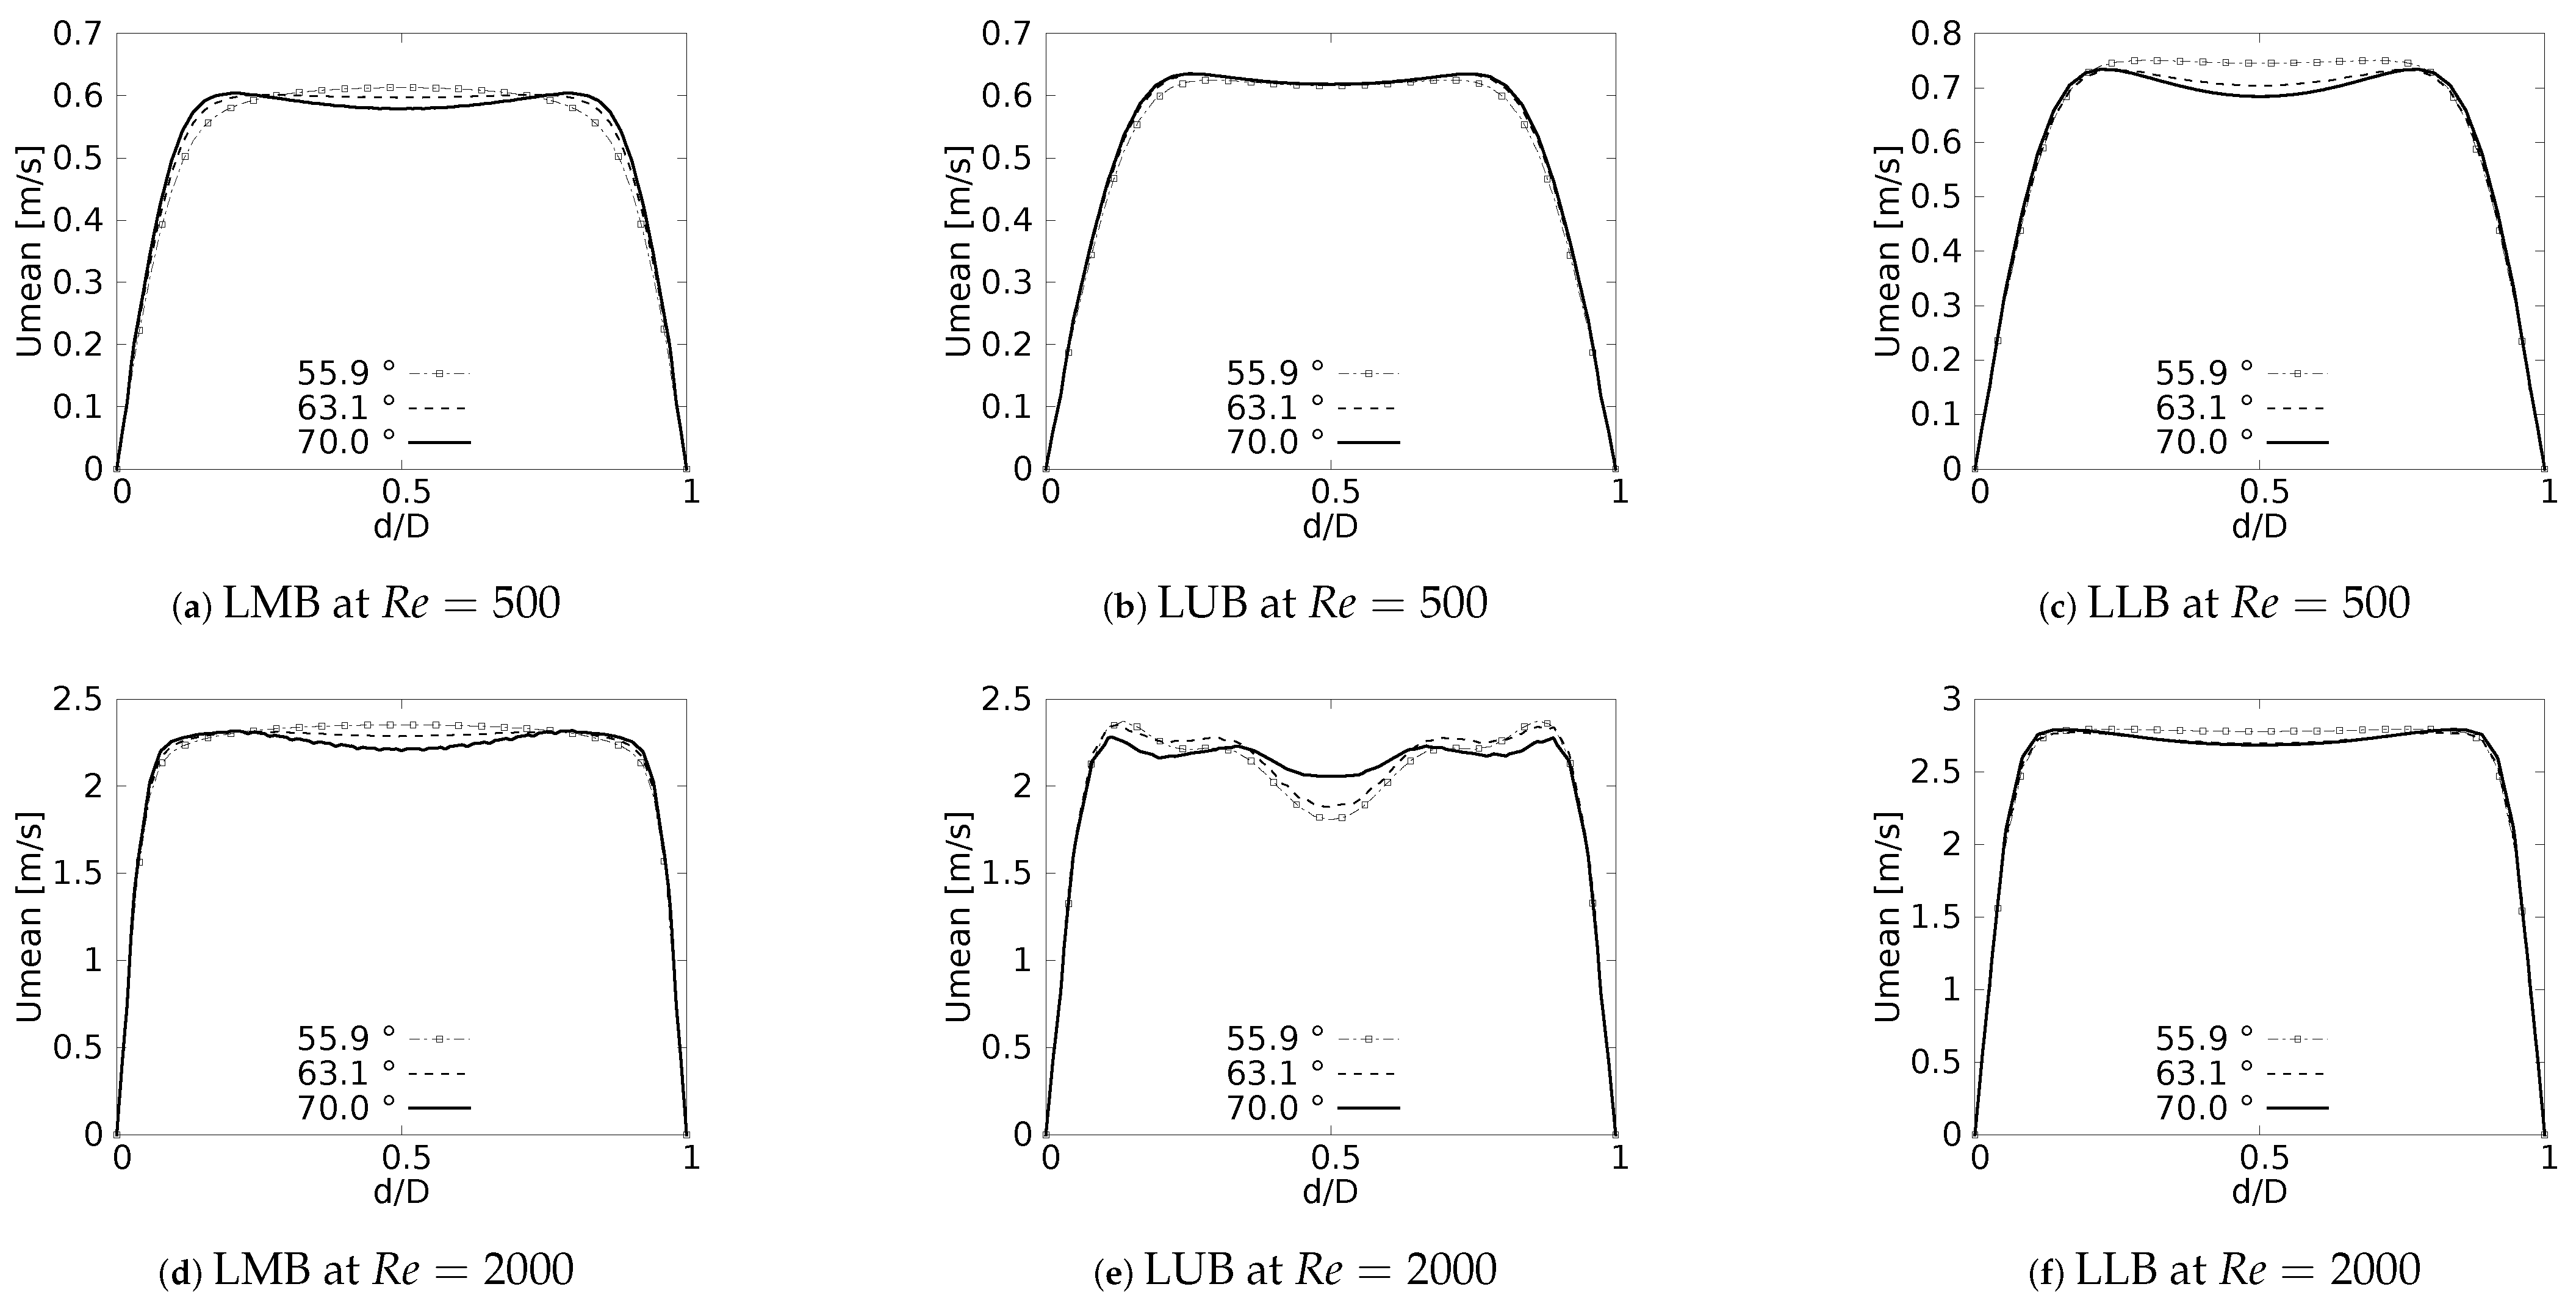
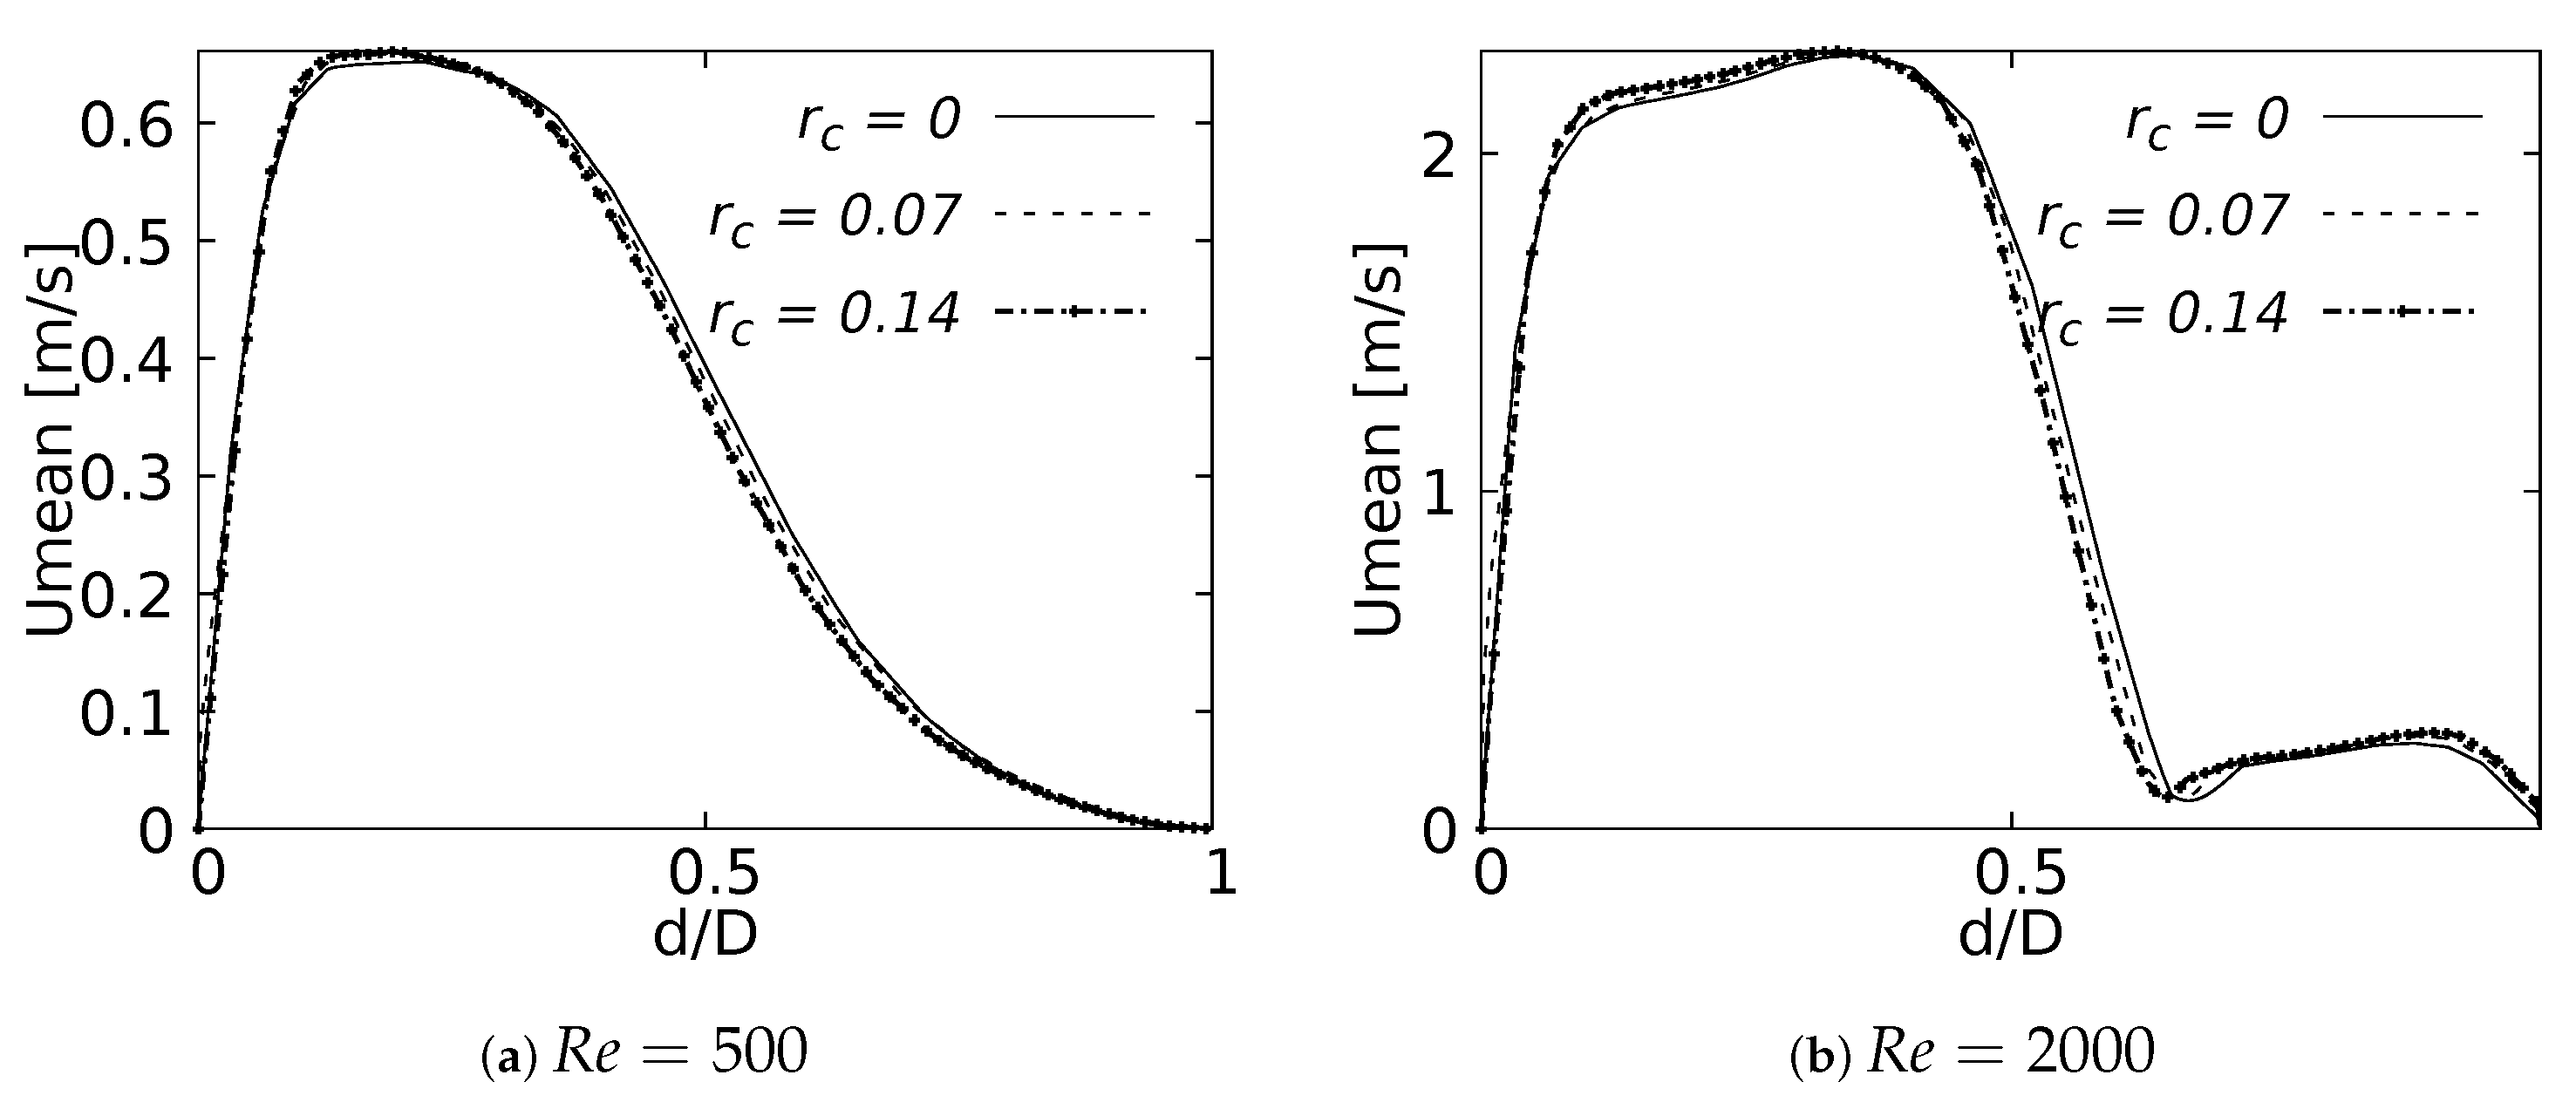
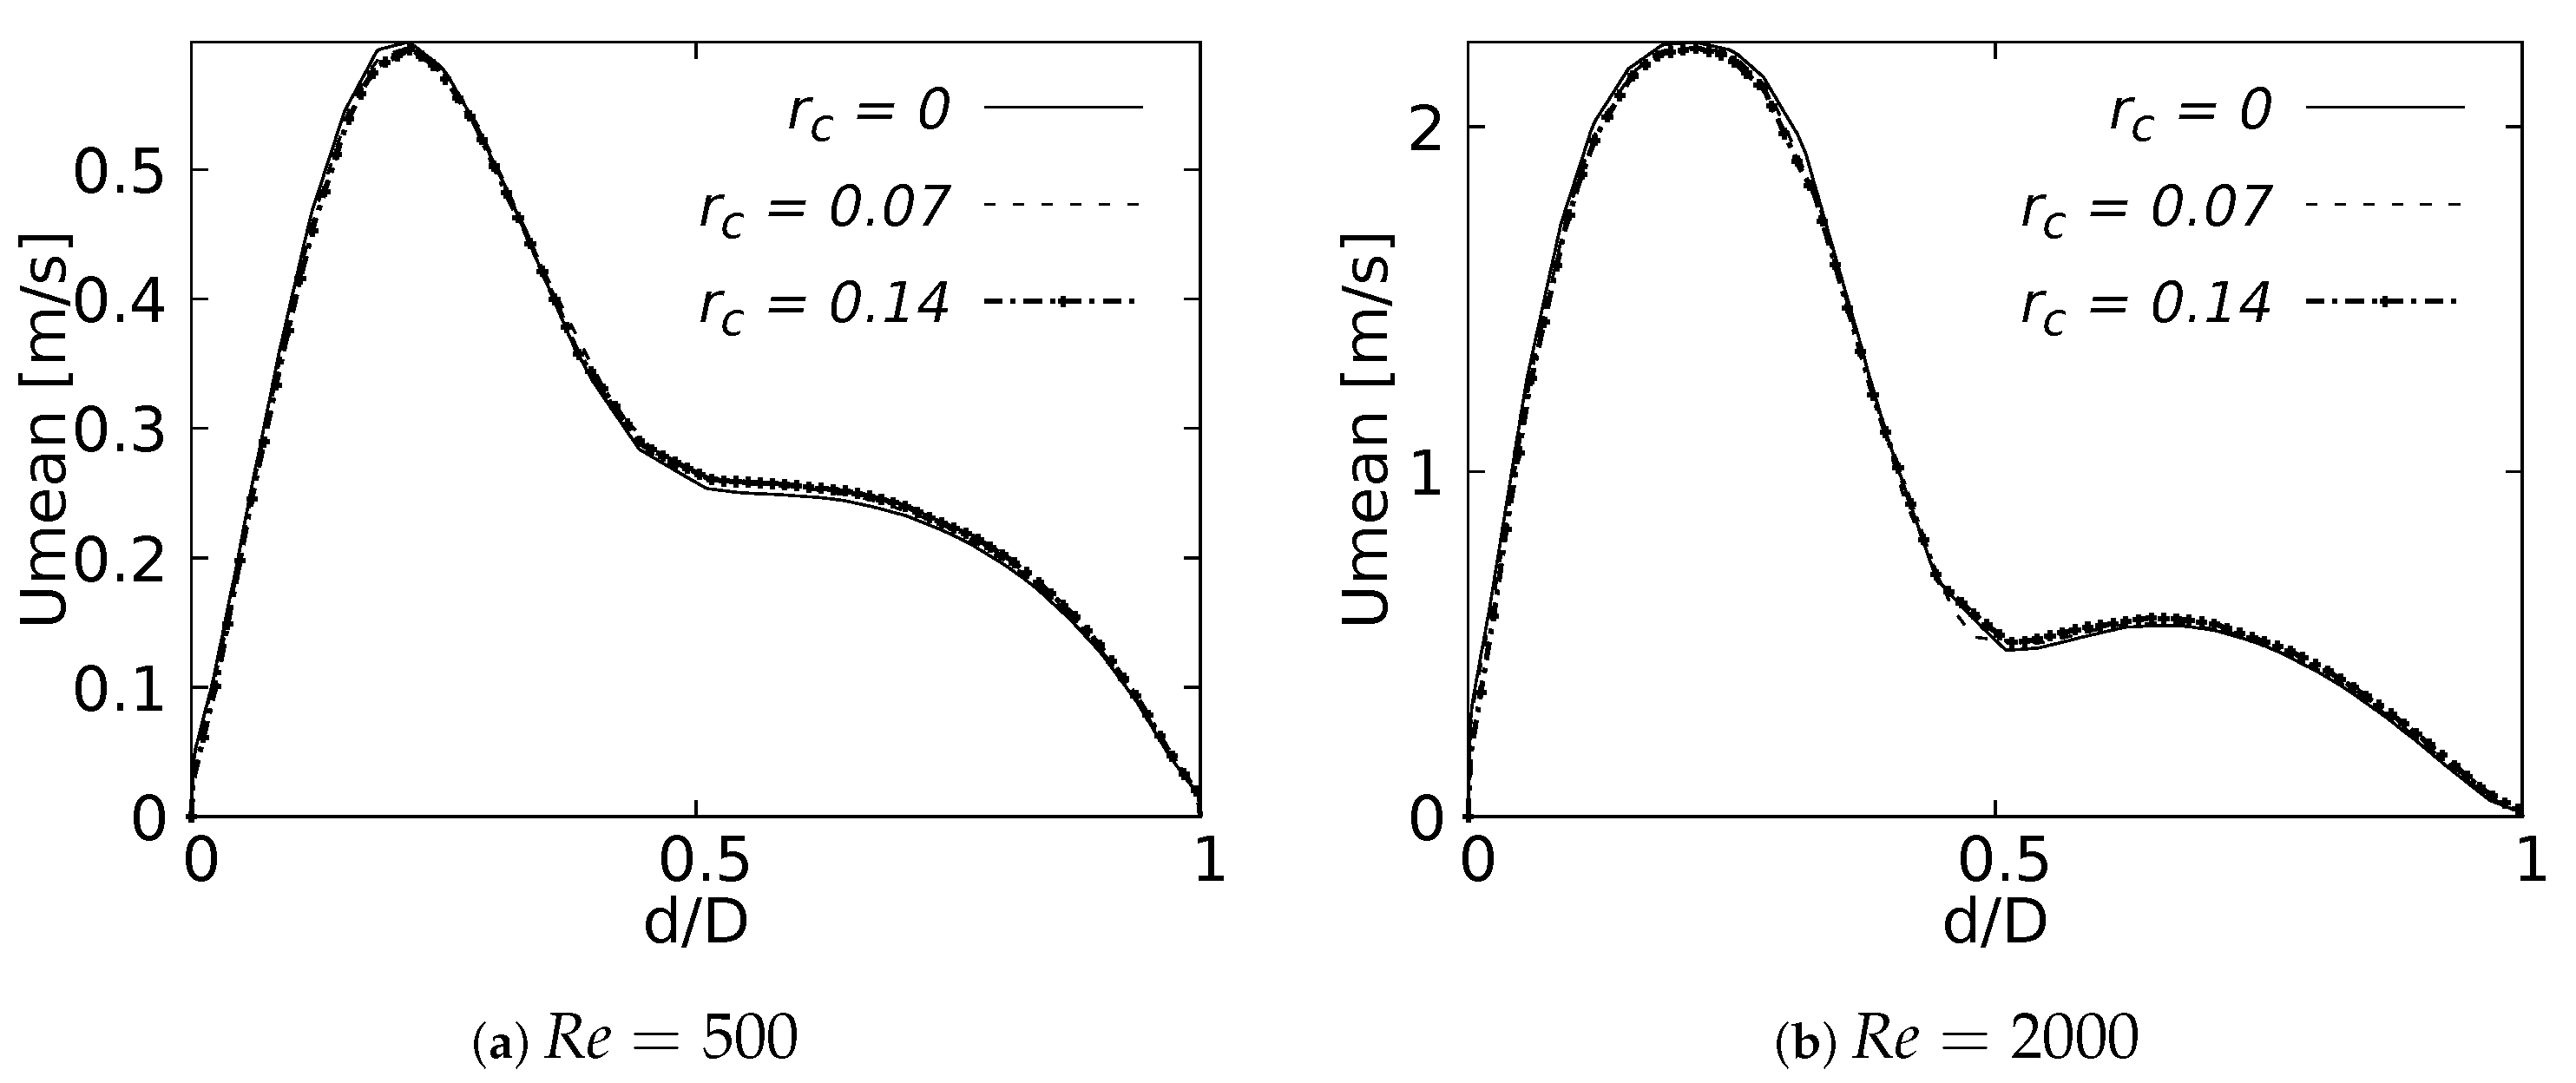
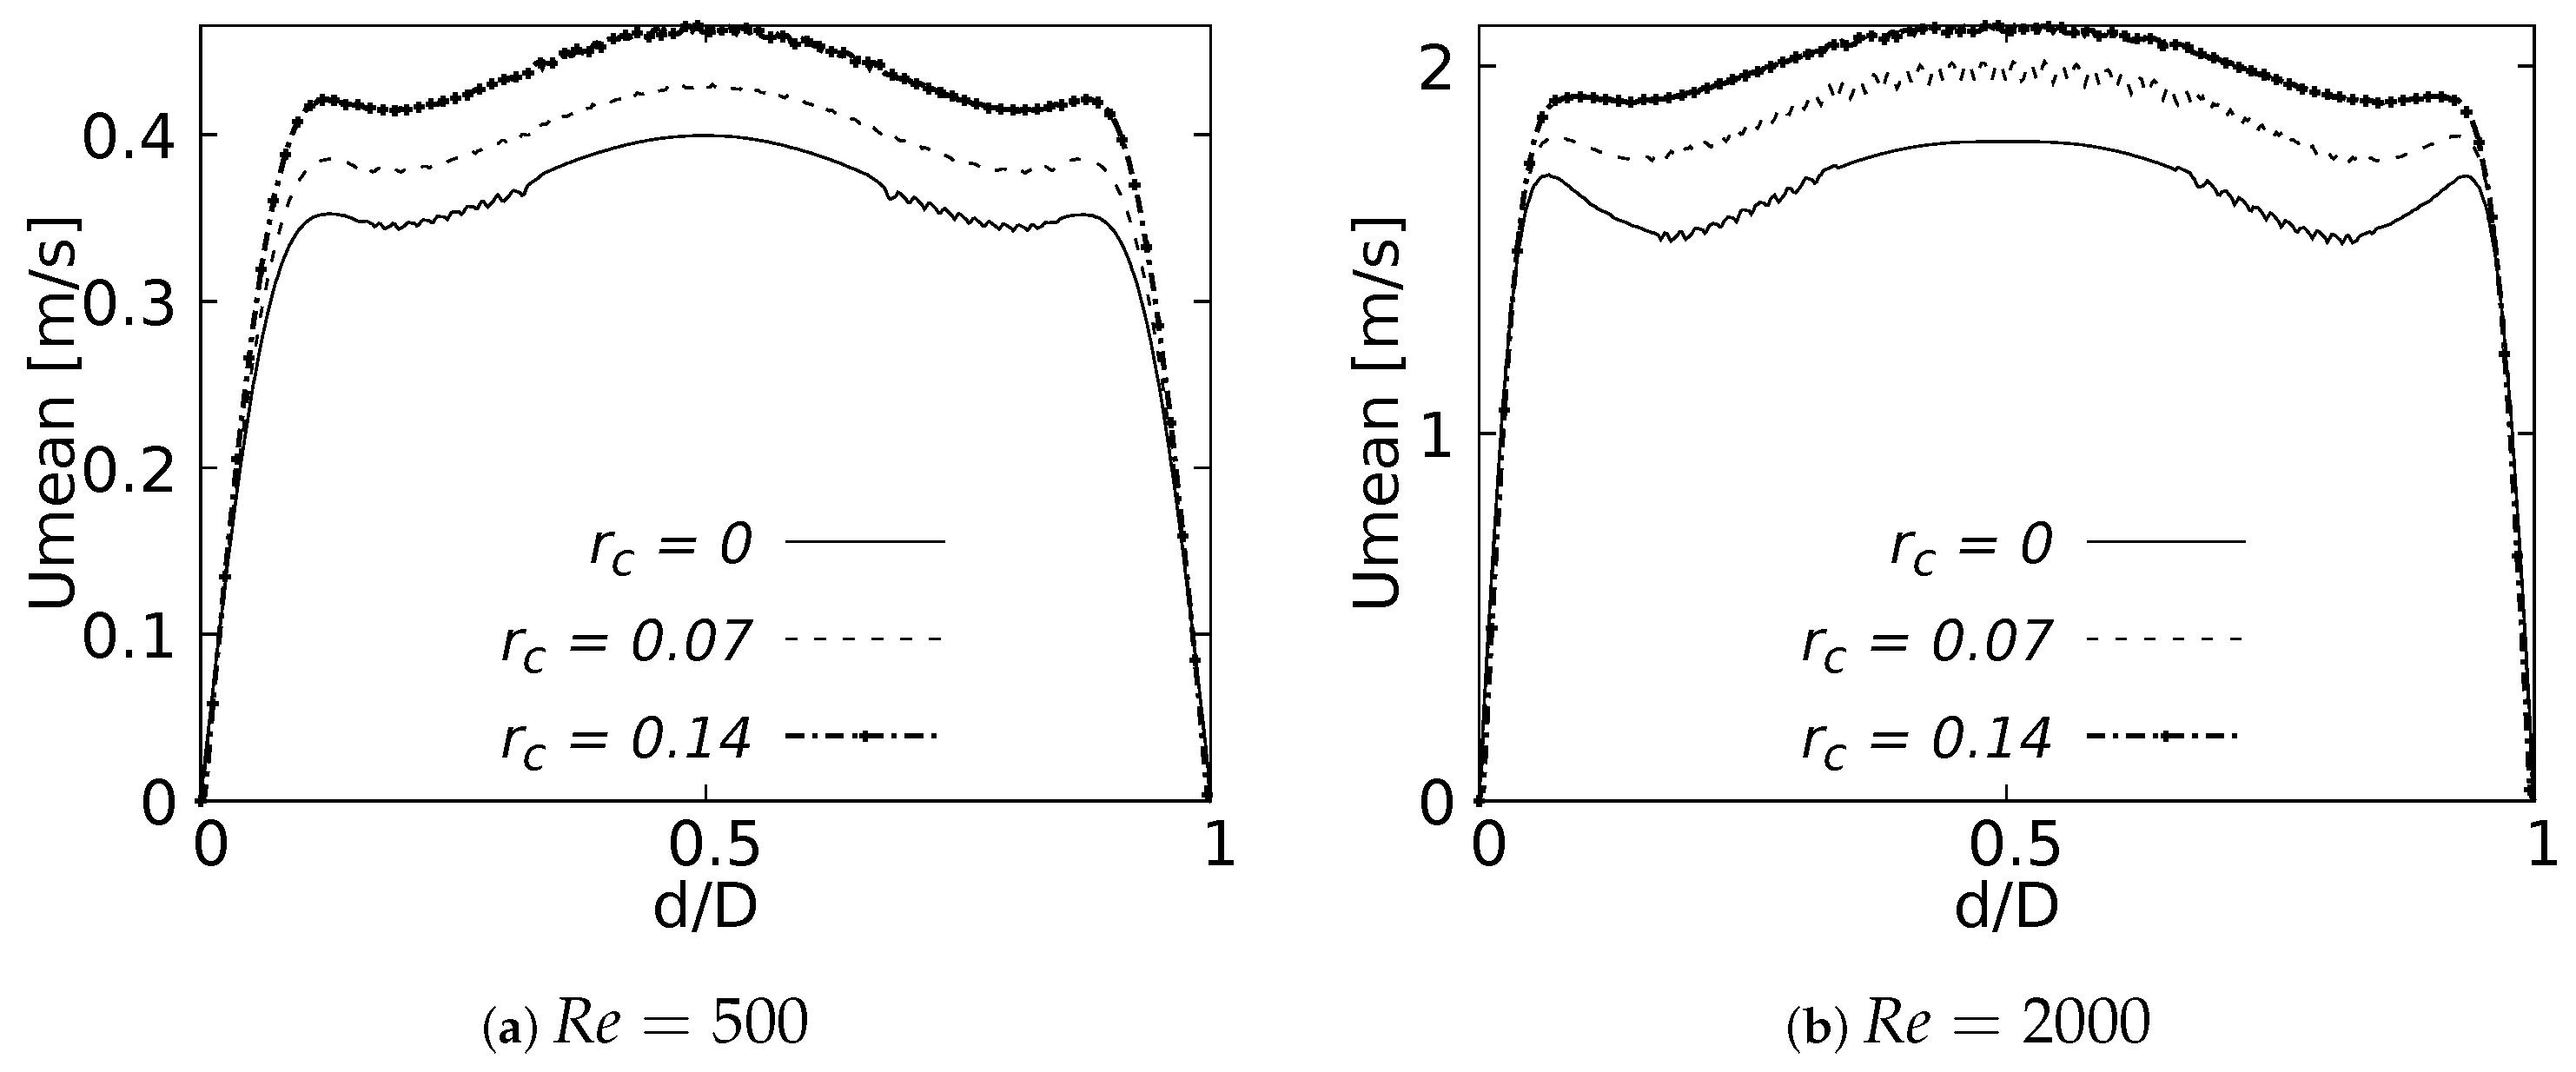
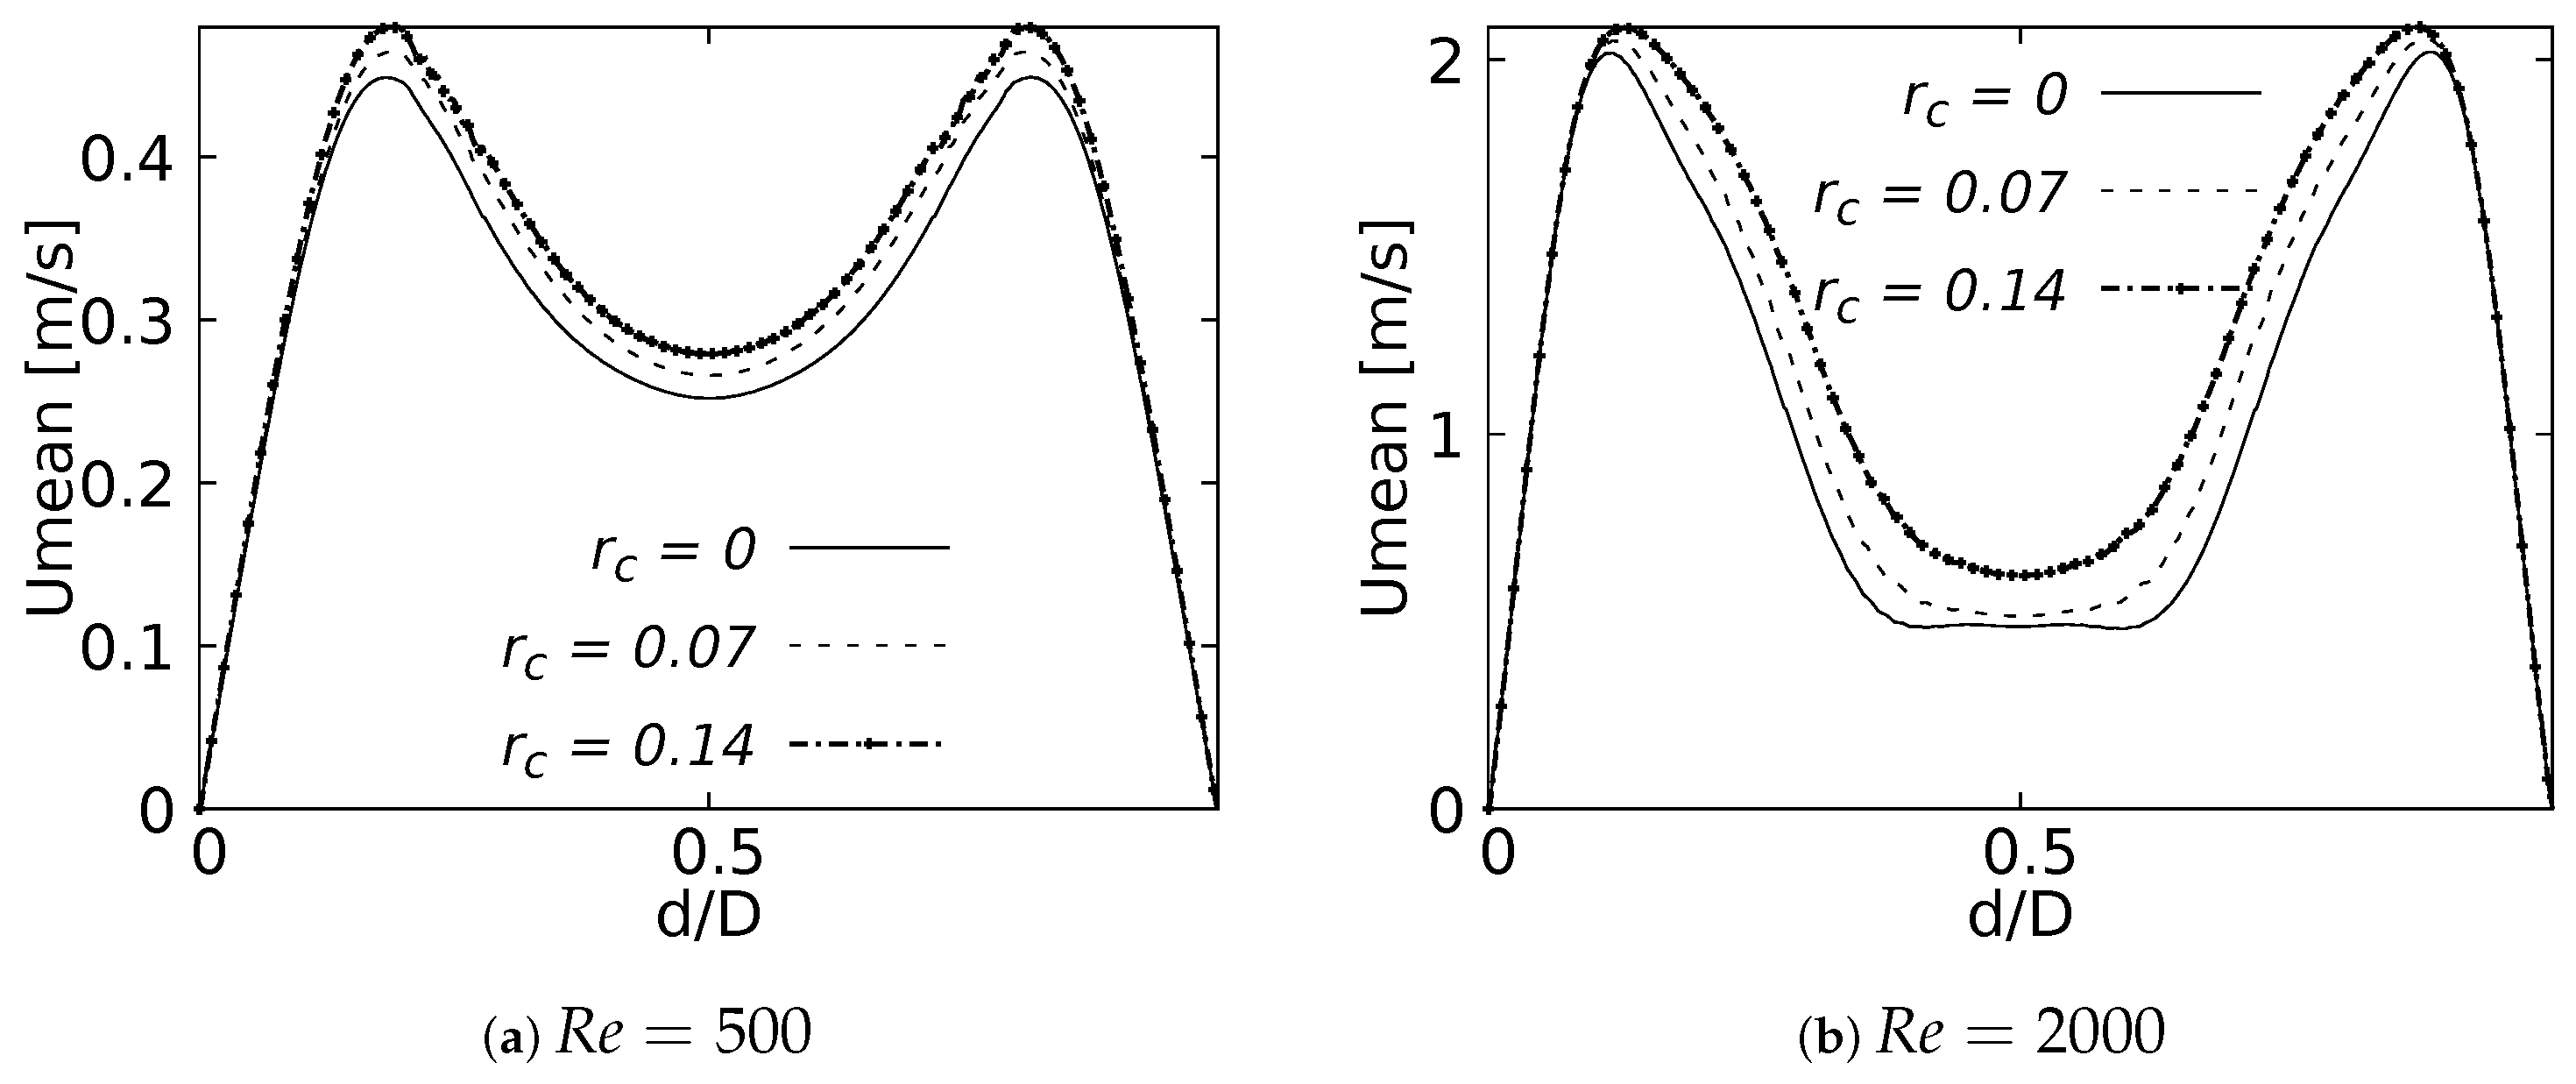
4.1. Velocity Profiles
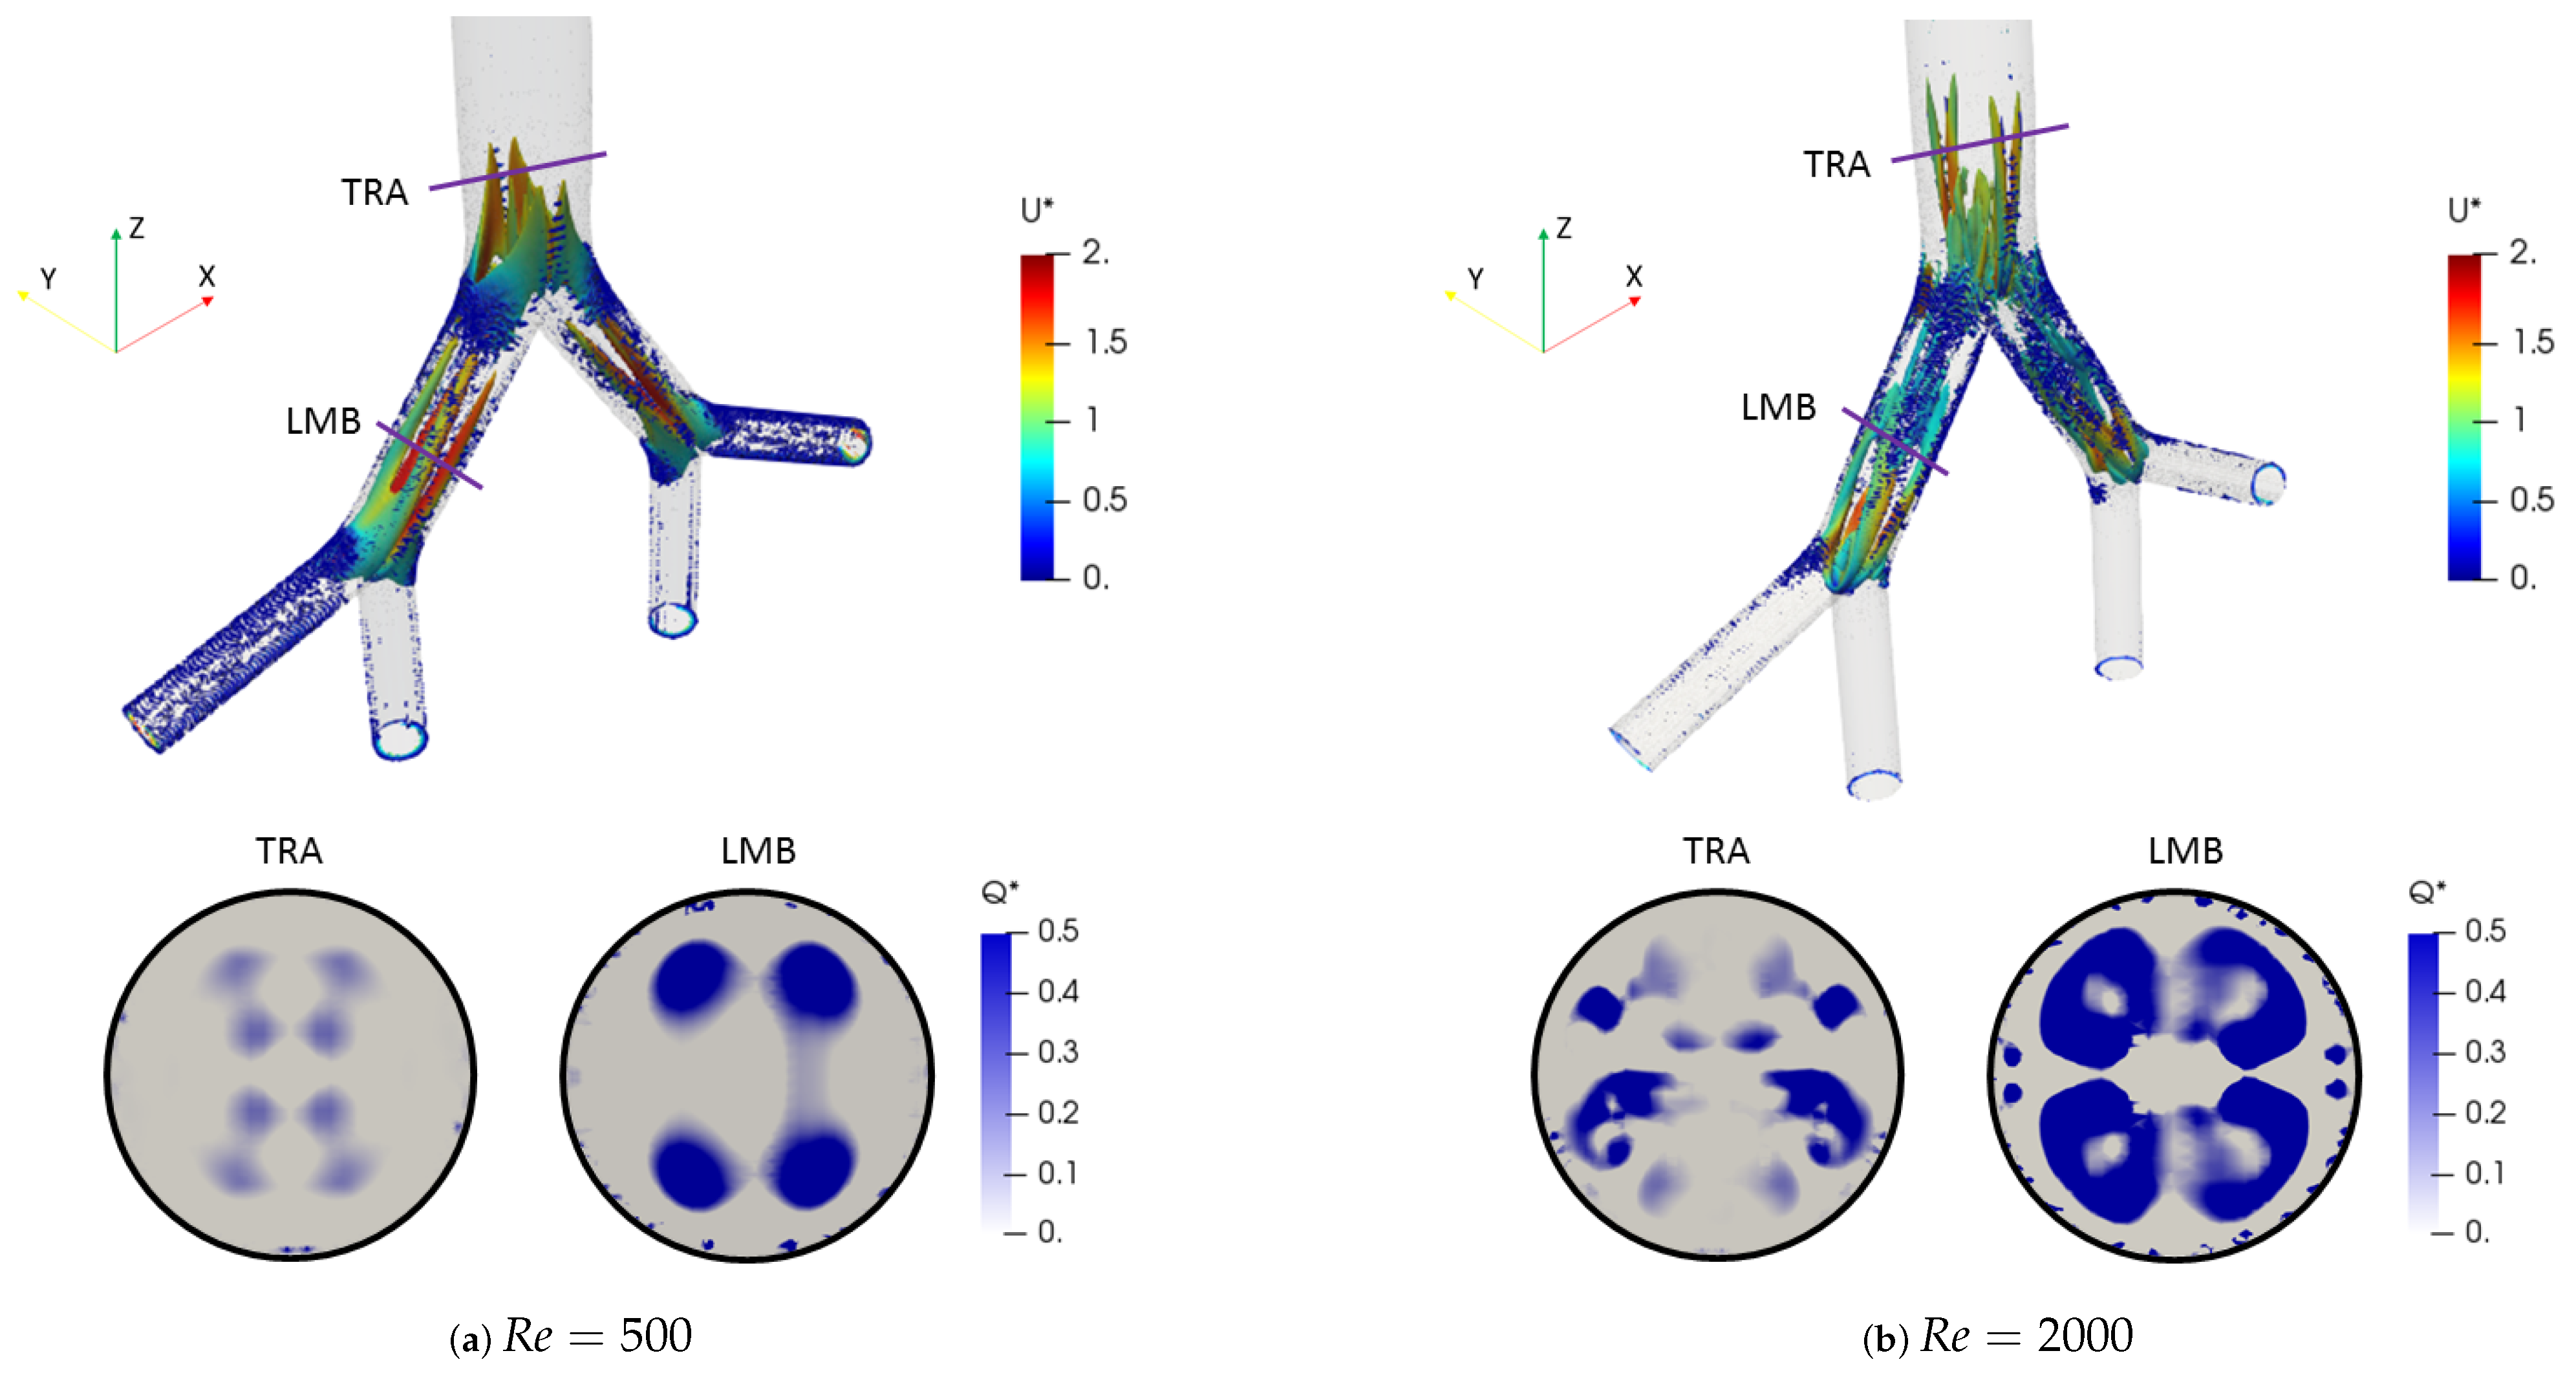
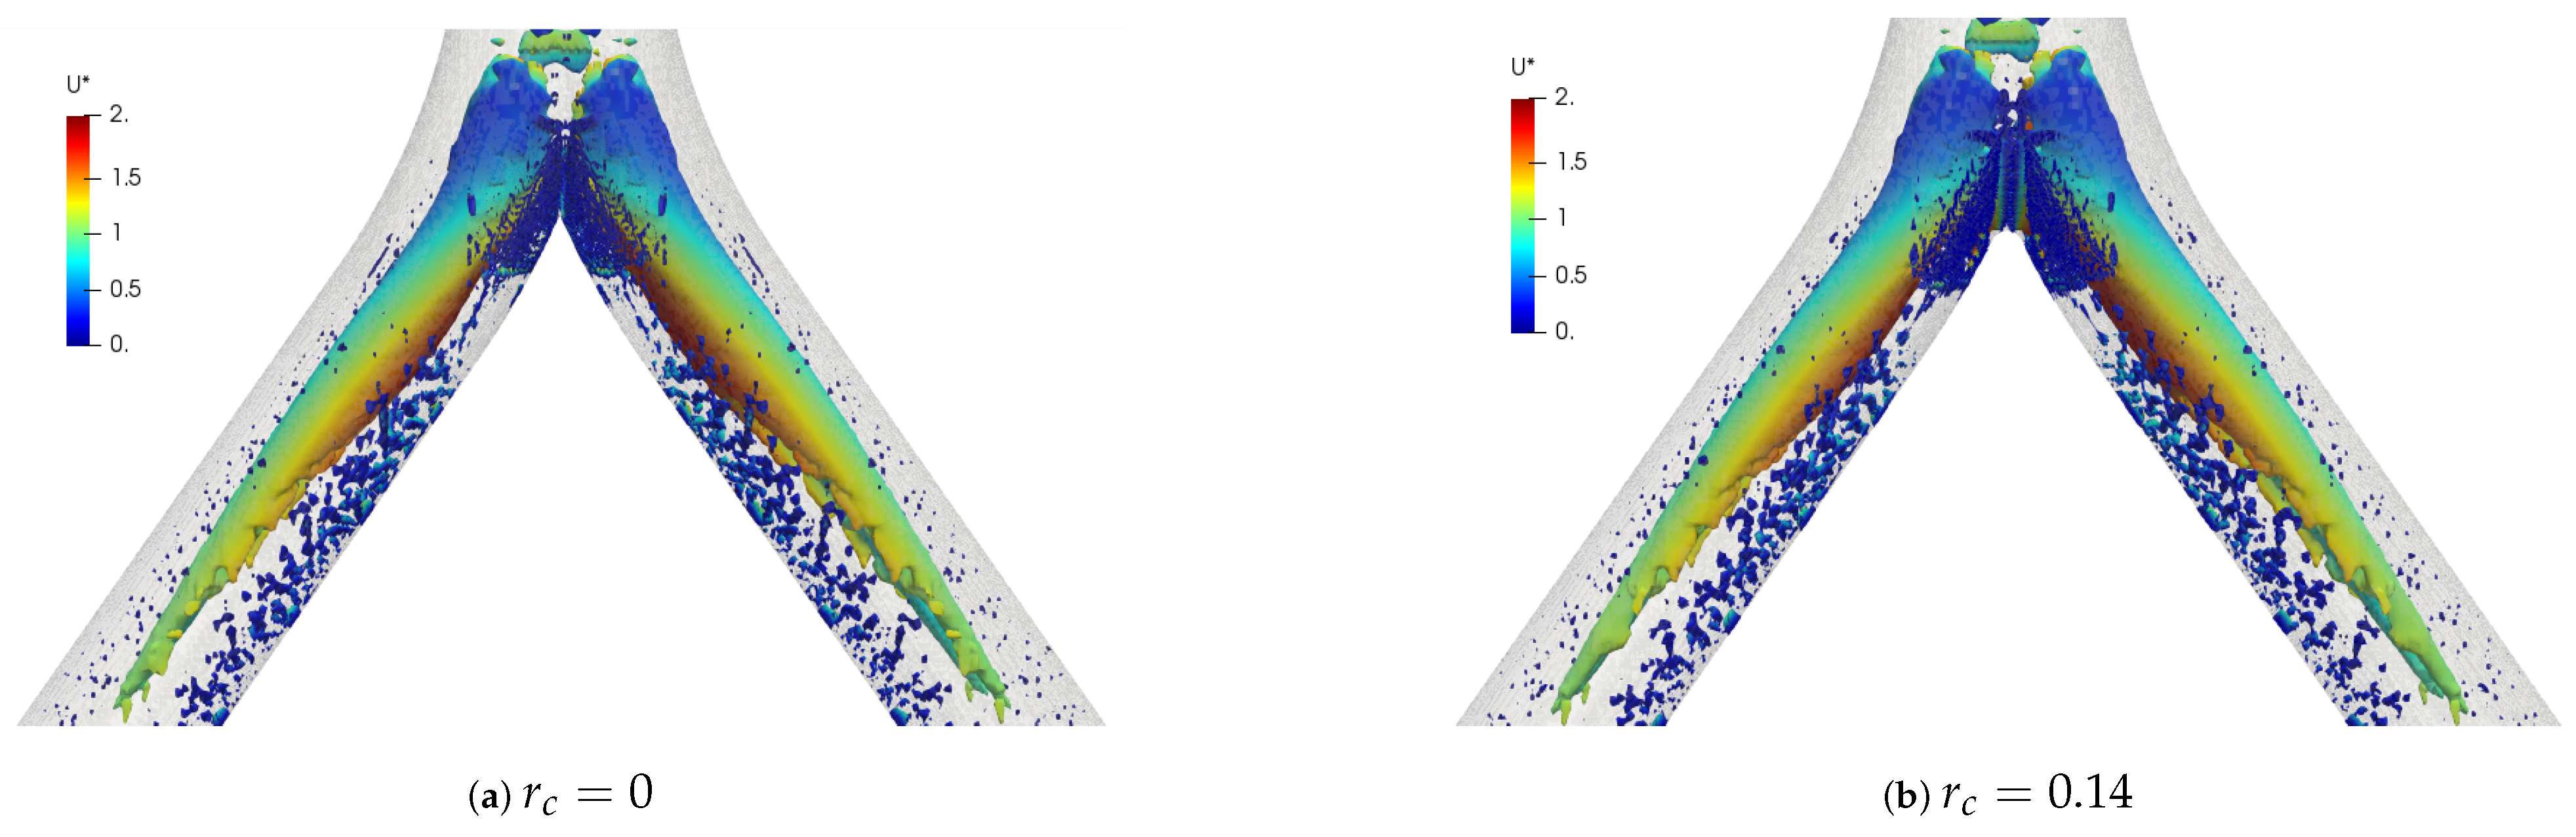
Mean velocity profiles on the coronal plane for the selected CRRs were constructed and are shown in Figure 20 and Figure 21 for flows at Re = 500 and Re = 2000 . These curves were built using a normalized length d / D , measured in sections at 20% and 50% of the total LMB branch length, with the main intention of analyzing the velocity profiles, both at a point close to the carina and in the middle of the branch. Figure 20 shows how the rounding radius had a slight effect on the velocity profiles measured at 20% of the LMB length. The narrowing of the profile toward the inner face of the branch was more noticeable as the CRR was larger. As the flow was transported downstream this behavior became almost imperceptible, as can be seen in Figure 21 for velocity profiles measured at 50% of the LMB length.
Figure 22 and Figure 23 show the velocity profiles over the sagittal plane for Re = 500 and Re = 2000 . These measurements were taken at 20% and 50% of the LMB branch length. In contrast to the coronal plane profiles, the effect of the CRR variation was clearly noticeable. The flow experienced a greater acceleration as the CRR was larger for both Re = 500 and Re = 2000 , respectively. It is also possible to observe how the profiles near the bifurcation developed the maximum peak at the center of the branch, as illustrated in Figure 22. The profiles took on the characteristic M-shape previously described in the results for the BA as the flow moved downstream, as shown in Figure 23:

4.2. Flow Patterns

The coherent structures for the different Reynolds numbers are shown in Figure 24. These structures were calculated through the Q-criterion, with the same procedure described in the BA section. These isocontours were provided with the color scale of the dimensionless velocity U * . For this simple bifurcation geometry it was possible to appreciate the existence of two vortex cores after the bifurcation, with a symmetric behaviour with respect to the coronal plane. Figure 25 illustrates the comparison of coherent structures for two rounding radius explored in this investigation. As can be seen, no effect derived from the variation of the CRR was clearly visible, since the structures were very similar to each other.
Vorticity profiles on the coronal plane for the selected CRR are shown in Figure 26 for flows at Re = 500 and Re = 2000 . These curves were built using a normalized length d/D and a normalized vorticity ω / ω m a x and were taken at 20% of the total LMB branch length. The vorticity measured at 50% branch length was not shown in this paper, since it did not show any singular behavioral pattern concerning the CRR variation. The maximum vorticity intensity was located on the inner wall of the branch for Re = 500 , as shown in Figure 26a. The existence of a local vorticity peak located near the center of the branch was also evidenced. The increase of the magnitude of this local peak was associated with the increase of the CRR. This effect was preserved as the flow accelerated, as seen in Figure 26b for Re = 2000 . This behavior indicated that the rounding radius influenced, to some extent, the rotation that the flow experienced as it passed through the bifurcation.
As well as in the BA study, the secondary flow patterns were performed using the Surface LIC method. Figure 27 shows the juxtaposition of the Surface LIC plots with the velocity and vorticity profiles in the sections at 20% and 50% of the branch length. These plots corresponded to the geometry with r c = 0 at Re = 2000 . Two dean vortices and a saddle point were clearly identified, in line with the coherent structures described above. The relationship of these vortical structures to the V-W curves was again observed. As illustrated in Figure 27a, at 20% of the branch length the vorticity had not reached its global minimum. This value was reached as the flow advanced downstream and its location coincided with the peak velocity, as shown in Figure 27b.

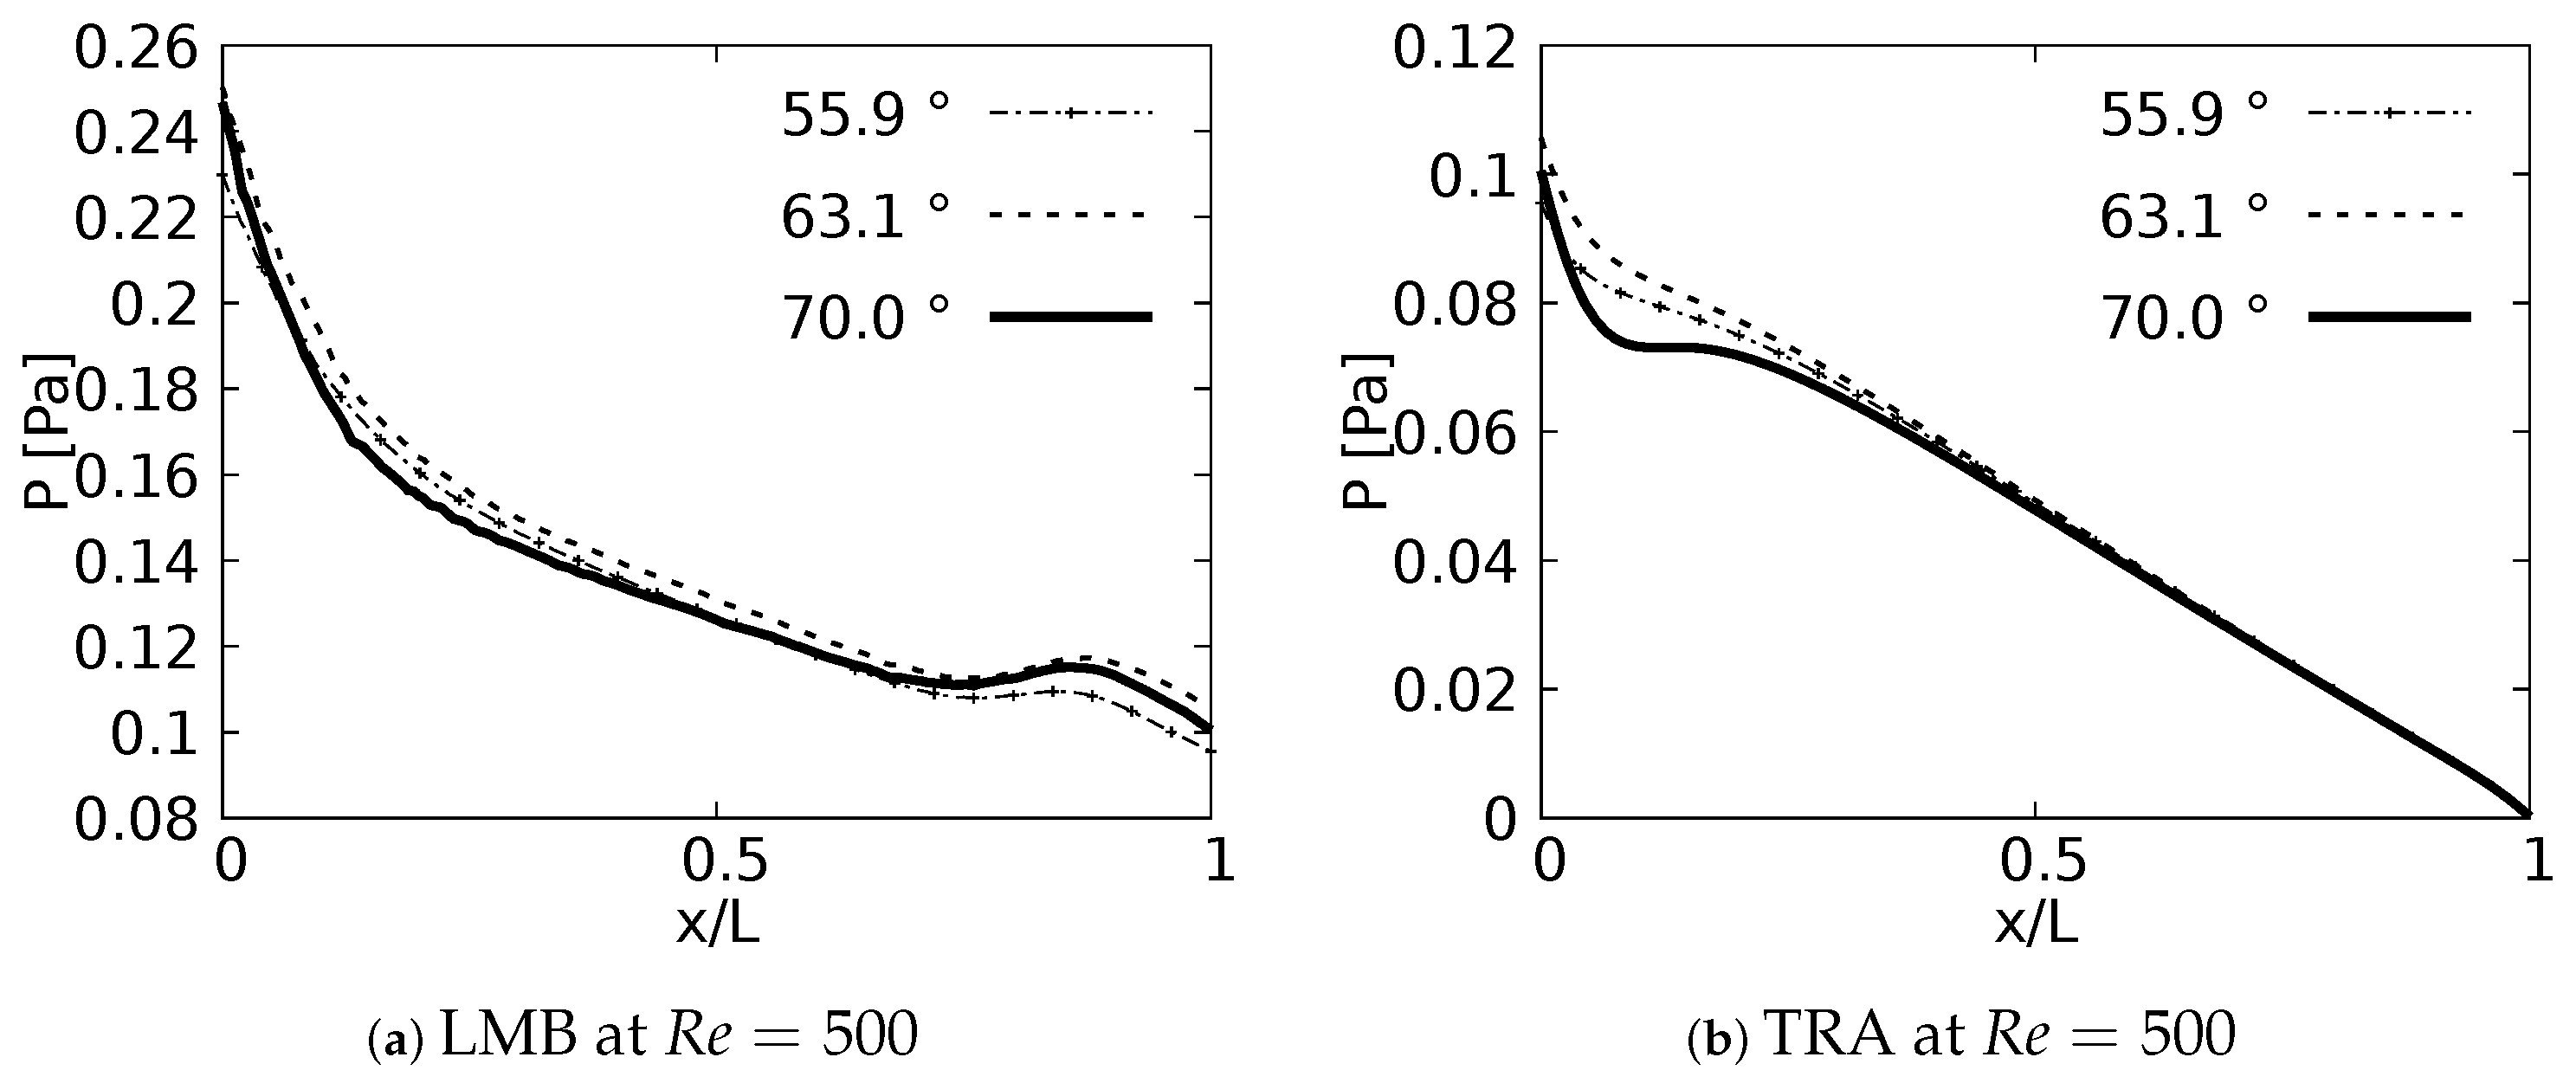
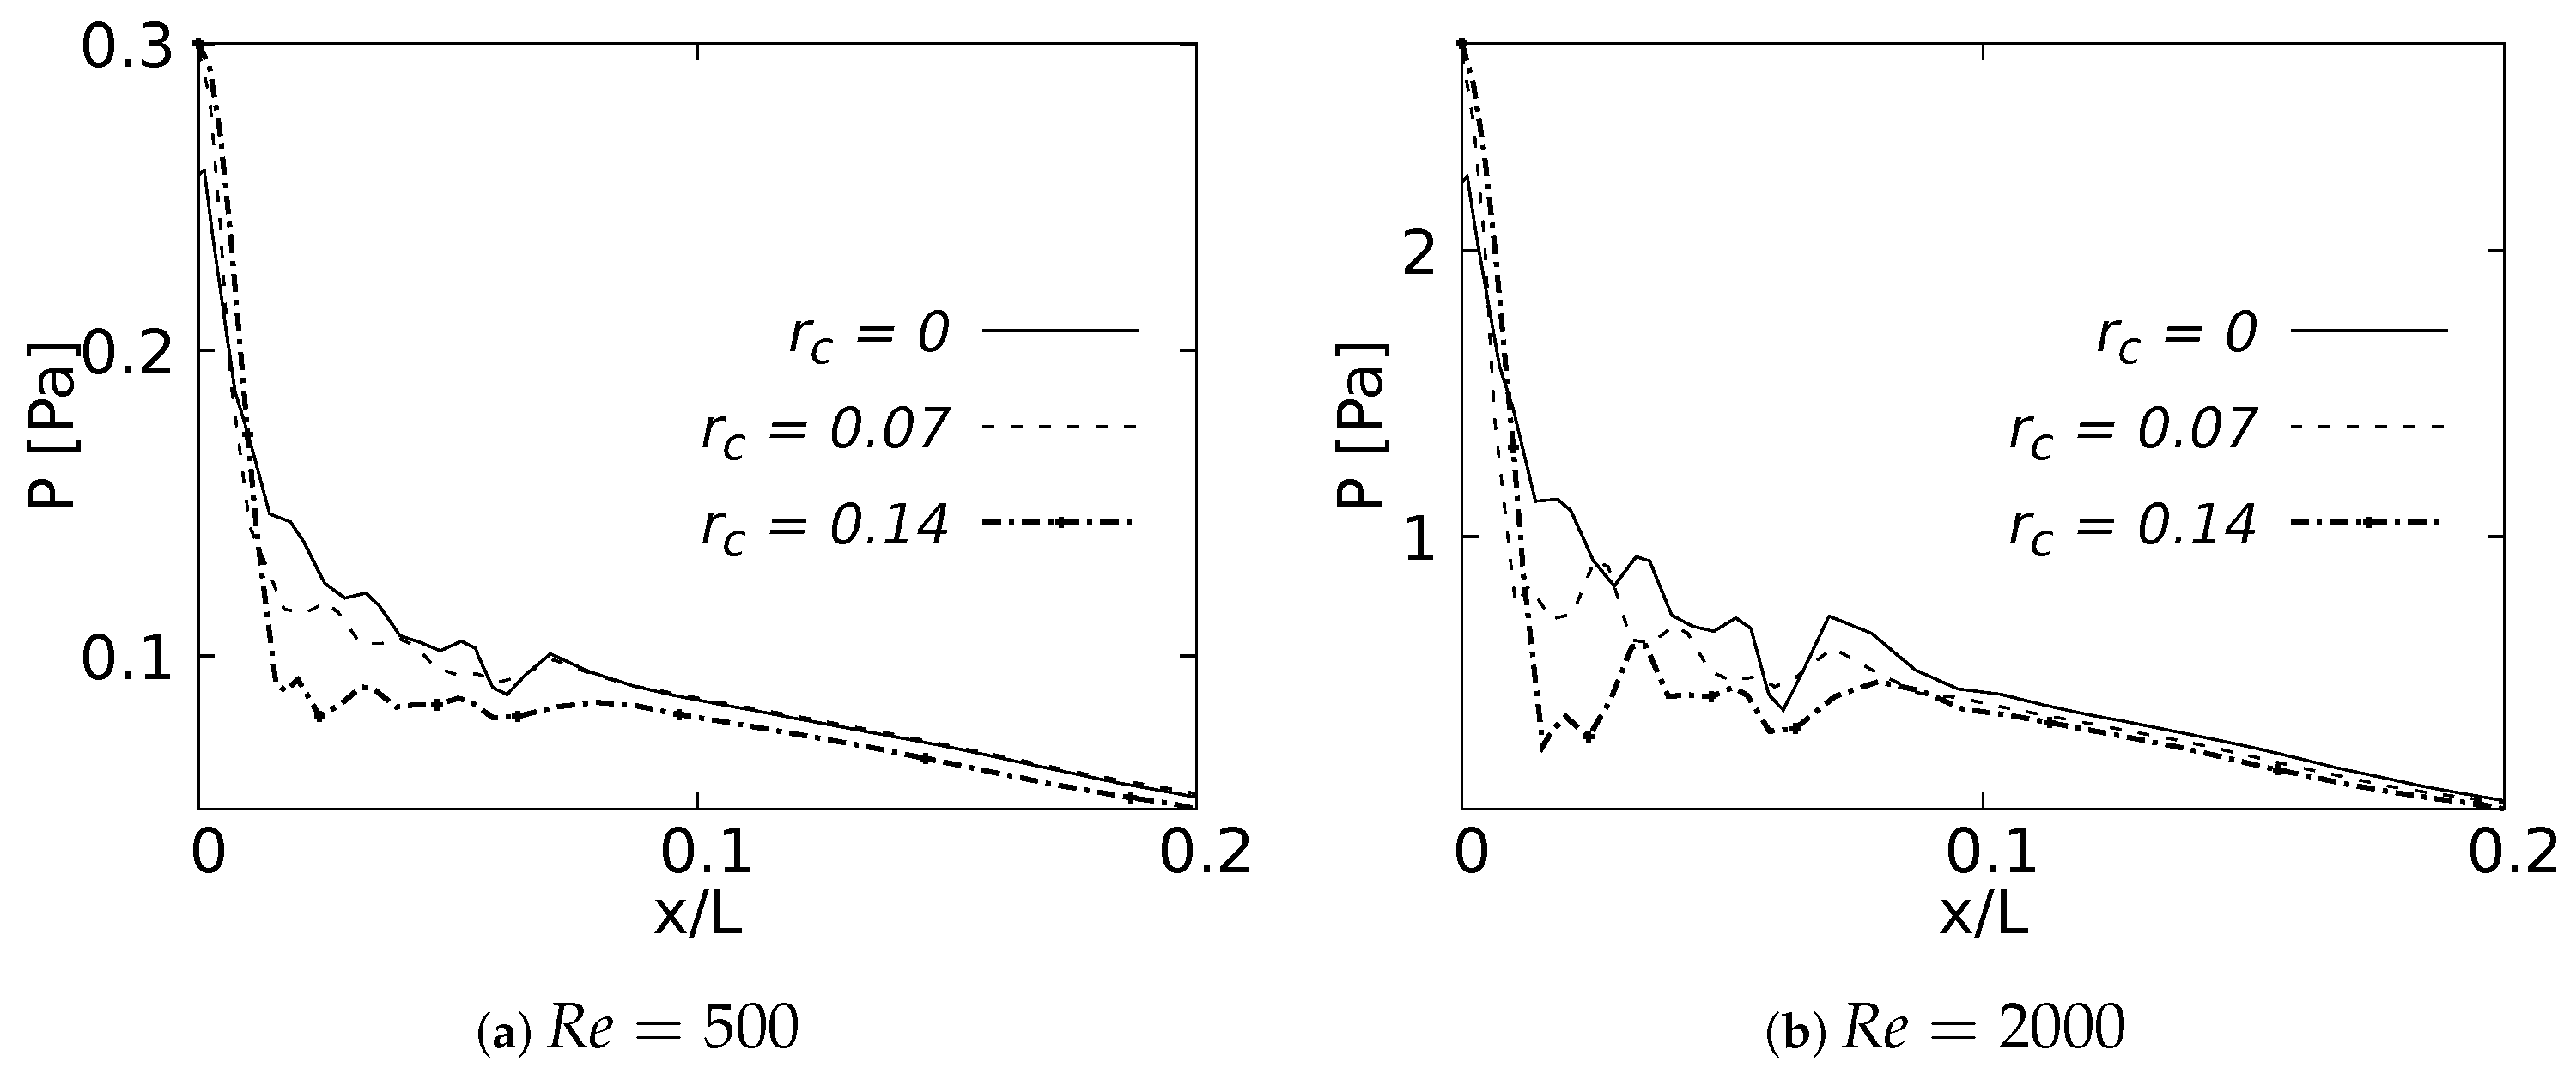
4.3. Pressure Behavior

The pressure drop across the LMB branch for the selected RRCs is shown in Figure 28 for flows at Re = 500 and Re = 2000 . These curves were built using a normalized length x/L, which was measured over the branch inner wall. The plots show only 20% of the length, since beyond this point the curves did not show any CRR-derived variation. The maximum peak pressure was located exactly at the bifurcation point and was higher as the CRR increased. At the same time, it could be observed that the pressure drop was also higher for larger CRRs and smaller for a straight junction. This effect was evident in the two Reynolds numbers analyzed. The maximum of this local pressure increase between the radius of r c = 0 and r c = 0.14 was up to 20% for the bifurcation point.

4.4. Wall Shear Stresses

As with the pressure drop, the wall shear stress behavior was measured on the internal wall of the branch and expressed using the normalized length x/L. These curves were plotted up to 50% of the length, since after this point the effects were negligible. Figure 29a shows how the maximum WSS for Re = 500 was developed by the bifurcation with straight joint r c = 0 . As expected, this point acted as a kind of stress concentrator. The location of the WSS maximum moved away from the carina in the downstream direction as the CRR increased and the joint became smoother. This displacement tendency of the maximum WSS was also observed for Re = 2000 , as illustrated in Figure 29b. The decrease of the WSS between the rounding radius of r c = 0 and r c = 0.14 was up to 400 % at the bifurcation point. Although the WSS was still higher for the straight joint at the exact point of the carina, in this case the maximum WSS was developed by the geometry with radius r c = 0.14 . These results were in line with the velocity profiles in the sagittal plane. The increase of the rounding radius generated a higher flow acceleration and, therefore, a higher accumulation of wall shear stresses.

5. Discussion and Conclusions

The present numerical study aimed to produce an assessment of the effect of bifurcation angle (BA) and the carina rounding radius (CRR) on the behavior of the flow through synthetic respiratory airway models. The main focus was to detail and quantify the influence of these morphological parameters on the respiratory process, examining both the inhalation and exhalation stages. Numerical experiments were performed on airway models set up for three different angles and three rounding radii, using two symmetrical models (Weibel et al. [28] for BA analysis and Lee et al. [35] model for CRR). The respiratory mechanisms of human inhalation and exhalation were decoupled and, hence, considered as independent processes. Analysis of the results derived from the variations of the bifurcation angle indicated a remarkable influence of this morphological parameter on the flow behavior through the airways. For the inhalation stage, the narrowing of the velocity profile in the coronal plane, with a tendency towards the inner wall of the airway, became more pronounced as the BA increased. In turn, this variation in BA drove the acceleration near the walls of the branches in the profiles measured in the sagittal plane. A particular relationship between the vortical structures and the velocity and vorticity profiles was identified in the following: the coincidence in the location of the peak velocity profile, the minimum vorticity magnitude and the saddle point seen through the secondary flow patterns. This behavior was observed for the different flow velocities analyzed. Moreover, a local pressure growth was generated by gradients at the bifurcation points. This local growth had a greater magnitude for the larger BAs, with a magnitude difference of approximately 20% between the largest and smallest angles. At the same time, it is noteworthy that the larger angle impacted on the decrease of wall shear stresses developed near the bifurcation, reducing the maximum shear value between explored angles by almost 70%. The variation of the BA also had a noticeable effect on the velocity profiles in the exhalation stage. The mirror symmetry around the branch axis in both the coronal and sagittal planes was the most notable feature in these profiles. As the flow velocity increased from Re = 500 to Re = 2000 , an acceleration near the branch walls was evident. This acceleration was greater for the lower BAs in the sagittal plane and for the higher BAs in the coronal plane. Wall shear stress for this stage exhibited a particular increase in the first half of the branch for all cases. This behavior might be related to the resistance and oscillations produced by the changes in the cross sectional area as the flow was transported through the branches. The relationship between the V-W profiles and the vortical structures was also observed at exhalation. In fact, this coincidence in the location of the vortical structures was present in all existing velocity peaks. Contrary to the results obtained at the inhalation stage, the effect of the BA variations on the behavior of the pressure flow was almost unnoticeable.
As with the BA, the results obtained in the CRR analysis showed a noticeable impact on the flow. The increase in the CRR caused a greater acceleration of the flow observed in the velocity profiles over the sagittal plane. In turn, it also slightly influenced the narrowing of the profile toward the inner walls of the airways measured in the coronal plane. The variation of this morphological parameter also had an impact on the flow rotation. As the radius increased, the rotation observed through the vorticity curves on the coronal plane was greater. The relationship of flow patterns to velocity and vorticity profiles was also evidenced by variations in the CRR. The carina was the point of interest for the analysis of pressure drop and wall shear stress. When the bifurcation was considered as a straight junction (with CRR equal to 0), the maximum pressure at the carina decreased and the WSS was at its maximum. With the increase of the CRR, i.e., the smoothing of the junction, the pressure drop increased by approximately 20% between the largest and smallest CRR, and the maximum WSS reduced by up to 400%. In turn, the maximum shear stress moved away downstream of the carina (exact point of attachment) as the rounding radius became larger.

Author Contributions

Conceptualization, A.S.E.-M. and C.A.D.-D.; Formal analysis, A.S.E.-M. and C.A.D.-D.; Investigation, A.S.E.-M.; Methodology, A.S.E.-M.; Resources, C.A.D.-D. and D.A.G.-A.; Software, A.S.E.-M.; Supervision, C.A.D.-D. and D.A.G.-A.; Validation, A.S.E.-M. and C.A.D.-D.; Writing—original draft, A.S.E.-M.; Writing—review & editing, C.A.D.-D. and D.A.G.-A. All authors have read and agreed to the published version of the manuscript.

Funding

This research received no external funding.

Data Availability Statement

Not applicable.

Acknowledgments

The work was technically supported by the investigation group GNUM (Grupo de Modelado y Metodos Numericos en Ingenieria) of the Universidad Nacional de Colombia.

Conflicts of Interest

The authors declare no conflict of interest.

Nomenclature

The following nomenclature was used in this manuscript:
DBranch diameter [mm]
RBranch radius [mm]
LBranch length [mm]
r c Dimensionless rounding radius
yGrid length in the normal direction of the wall [m]
UInlet velocity [m/s]
U m a x Maximun velocity [m/s]
U a v e Average velocity [m/s]
u τ Friction velocity [m/s]
pFluid pressure [Pa]
R e Reynolds number
ρ fluid density [kg/m 3 ]
ν kinematic viscosity [m 2 / s ]
μ Dynamic viscosity [Pa.s]

Abbreviations

The following abbreviations were used in this manuscript:
CFDComputational Fluids Dynamics
WSSWall Shear Stress
BABifurcation angle
CRRCarina rounding radius
TRATrachea
RMBRight Main Bronchus
LMBLeft Main Bronchus
RUBRight Upper Lobar Bronchus
LUBLeft Upper Lobar Bronchus
RIBRight Intermediate Bronchus
LLBLeft Lower Lobar Bronchus

References

  1. West, J.B. Respiratory Physiology: The Essentials, 9th ed.; Lippincott Williams & Wilkins: Philadelphia, PA, USA, 2012. [Google Scholar]
  2. Minnich, D.J.; Mathisen, D.J. Anatomy of the trachea, carina, and bronchi. Thorac. Surg. Clin. 2007, 17, 571–585. [Google Scholar] [CrossRef] [PubMed]
  3. Singhal, S.; Henderson, R.; Horsfield, K.; Harding, K.; Cumming, G. Morphometry of the human pulmonary arterial tree. Circ. Res. 1973, 33, 190–197. [Google Scholar] [CrossRef] [PubMed] [Green Version]
  4. Haskin, P.H.; Goodman, L. Normal tracheal bifurcation angle: A reassessment. Am. J. Roentgenol. 1982, 139, 879–882. [Google Scholar] [CrossRef] [PubMed]
  5. Alavi, S.M.; Keats, T.E.; O’Brien, W.M. The angle of tracheal bifurcation: Its normal mensuration. Am. J. Roentgenol. 1970, 108, 546–549. [Google Scholar] [CrossRef] [PubMed]
  6. Khade, B.; Waheed, A.R.; Yadav, N.; Diwan, C. Study of sub carinal angle of human trachea by computerized tomography. Int. J. Anat. Res. 2016, 4, 2828–2832. [Google Scholar] [CrossRef]
  7. Christou, S.; Chatziathanasiou, T.; Angeli, S.; Koullapis, P.; Stylianou, F.; Sznitman, J.; Kassinos, S.C. Anatomical variability in the upper tracheobronchial tree: Sex-based differences and implications for personalized inhalation therapies. J. Appl. Physiol. 2021, 130, 678–707. [Google Scholar] [CrossRef]
  8. Sahni, D.; Batra, Y.K.; Rajeev, S. Anatomical dimensions of trachea, main bronchi, subcarinal and bronchial angles in fetuses measured ex vivo. Pediatr. Anesth. 2006, 18, 1029–1034. [Google Scholar]
  9. Chen, J.; Putman, C.E.; Hedlund, L.W.; Dahmash, N.; Roberts, L. Widening of the subcarinal angle by pericardial effusion. Am. J. Roentgenol. 1982, 139, 883–887. [Google Scholar] [CrossRef]
  10. Lin, C.; Lee, J.-H.; Hsieh, C.-M. The correlation between subcarinal angle and left atrial volume. Acta Cardiol. Sin. 2012, 28, 332–336. [Google Scholar]
  11. Murray, J.; Brown, A.; Anagnostou, E.; Senior, R. Widening of the tracheal bifurcation on chest radiographs: Value as a sign of left atrial enlargement. AJR. Am. J. Roentgenol. 1995, 164, 1089–1092. [Google Scholar] [CrossRef] [Green Version]
  12. Horsfield, K.; Dart, G.; Olson, D.E.; Filley, G.F.; Cumming, G. Models of the human bronchial tree. J. Appl. Physiol. 1971, 31, 207–217. [Google Scholar] [CrossRef]
  13. Martonen, T.; Yang, Y.; Xue, Z. Effects of carinal ridge shapes on lung airstreams. Aerosol Sci. Technol. 1994, 21, 119–136. [Google Scholar] [CrossRef] [Green Version]
  14. Xu, X.; Wu, J.; Weng, W.; Fu, M. Investigation of inhalation and exhalation flow pattern in a realistic human upper airway model by PIV experiments and CFD simulations. Biomech. Model. Mechanobiol. 2020, 19, 1679–1695. [Google Scholar] [CrossRef]
  15. Faizal, W.M.; Ghazali, N.N.N.; Khor, C.Y.; Badruddin, I.A.; Zainon, M.Z.; Yazid, A.A.; Razi, R.M. Computational fluid dynamics modelling of human upper airway: A review. Comput. Methods Programs Biomed. 2020, 196, 105627. [Google Scholar] [CrossRef]
  16. Tran, T.M.; Huh, S.; Kim, S.; Cui, X.; Choi, S. Numerical investigation of the effect of tracheostomy on flow and particle transport characteristics in human airways. Phys. Fluids 2022, 34, 121901. [Google Scholar] [CrossRef]
  17. Choi, S.; Yoon, S.; Jeon, J.; Zou, C.; Choi, J.; Tawhai, M.H.; Lin, C.L. 1D network simulations for evaluating regional flow and pressure distributions in healthy and asthmatic human lungs. J. Appl. Physiol. 2019, 127, 122–133. [Google Scholar] [CrossRef]
  18. Zhang, W.; Xiang, Y.; Lu, C.; Ou, C.; Deng, Q. Numerical modeling of particle deposition in the conducting airways of asthmatic children. Med. Eng. Phys. 2020, 76, 40–46. [Google Scholar] [CrossRef] [PubMed]
  19. Hariprasad, D.S.; Sul, B.; Liu, C.; Kiger, K.T.; Altes, T.; Ruppert, K.; Wallqvist, A. Obstructions in the lower airways lead to altered airflow patterns in the central airway. Respir. Physiol. Neurobiol. 2020, 272, 103311. [Google Scholar] [CrossRef] [PubMed]
  20. Kadota, K.; Matsumoto, K.; Uchiyama, H.; Tobita, S.; Maeda, M.; Maki, D.; Tozuka, Y. In silico evaluation of particle transport and deposition in the airways of individual patients with chronic obstructive pulmonary disease. Eur. J. Pharm. Biopharm. 2022, 174, 10–19. [Google Scholar] [CrossRef] [PubMed]
  21. Zobaer, T.; Sutradhar, A. Modeling the effect of tumor compression on airflow dynamics in trachea using contact simulation and CFD analysis. Comput. Biol. Med. 2021, 135, 104574. [Google Scholar] [CrossRef] [PubMed]
  22. Morita, K.; Takeishi, N.; Wada, S.; Hatakeyama, T. Computational fluid dynamics assessment of congenital tracheal stenosis. Pediatr. Surg. Int. 2022, 38, 1769–1776. [Google Scholar] [CrossRef] [PubMed]
  23. Kim, Y.; Tong, Z.; Chan, H.; Yang, R. CFD modelling of air and particle flows in different airway models. J. Aerosol Sci. 2019, 134, 14–28. [Google Scholar] [CrossRef]
  24. Piemjaiswang, R.; Shiratori, S.; Chaiwatanarat, T.; Piumsomboon, P.; Chalermsinsuwan, B. Computational fluid dynamics simulation of full breathing cycle for aerosol deposition in trachea: Effect of breathing frequency. J. Taiwan Inst. Chem. Eng. 2019, 97, 66–79. [Google Scholar] [CrossRef]
  25. Hassani, K.; Khorramymehr, S. In silico investigation of sneezing in a full real human upper airway using computational fluid dynamics method. Comput. Methods Programs Biomed. 2019, 177, 203–209. [Google Scholar]
  26. Ren, S.; Li, W.; Wang, L.; Shi, Y.; Cai, M.; Hao, L.; Luo, Z. Numerical analysis of airway mucus clearance effectiveness using assisted coughing techniques. Sci. Rep. 2020, 10, 1–10. [Google Scholar] [CrossRef] [Green Version]
  27. Mason, E.C.; Wu, Z.; McGhee, S.; Markley, J.; Koenigs, M.; Onwuka, A.; Zhao, K. Computational fluid dynamic modeling reveals nonlinear airway stress during trachea development. J. Pediatr. 2021, 238, 324–328. [Google Scholar] [CrossRef]
  28. Weibel, E.R.; Cournand, A.F.; Richards, D.W. Morphometry of the Human Lung, 1st ed.; Springer: Berlin/Heidelberg, Germany, 1963. [Google Scholar]
  29. Hofmann, W. Modelling inhaled particle deposition in the human lung: A review. J. Aerosol Sci. 2011, 42, 693–724. [Google Scholar] [CrossRef]
  30. Islam, M.S.; Paul, G.; Ong, H.X.; Young, P.M.; Gu, Y.T.; Saha, S.C. A review of respiratory anatomical development, air flow characterization and particle deposition. Int. J. Environ. Res. Public Health 2020, 17, 380. [Google Scholar] [CrossRef] [Green Version]
  31. Lai, T.C.; Morsi, Y.S.; Das, S.; Owida, A. Numerical analysis of particle deposition in asymmetrical human upper airways under different inhalation cycles. J. Mech. Med. Biol. 2013, 13, 1350068. [Google Scholar] [CrossRef]
  32. Tsega, E.G.; Katiyar, V.K.; Gupta, P. Numerical Simulation of Transport and Deposition of Dust Particles in Human Tracheobronchial Airways. Int. J. Biomed. Sci. Eng. 2019, 7, 8. [Google Scholar] [CrossRef]
  33. Balashazy, I.; Heistracher, T.; Hofmann, W. Air flow and particle deposition patterns in bronchial airway bifurcations: The effect of different CFD models and bifurcation geometries. J. Aerosol Med. 1996, 9, 287–301. [Google Scholar] [CrossRef]
  34. Horsfield, K.; Cumming, G. Angles of branching and diameters of branches in the human bronchial tree. Bull. Math. Biophys. 1967, 29, 245–259. [Google Scholar] [CrossRef] [PubMed]
  35. Lee, D.; Park, S.S.; Ban-Weiss, G.A.; Fanucchi, M.V.; Plopper, C.G.; Wexler, A.S. Bifurcation model for characterization of pulmonary architecture. Anat. Rec. 2008, 291, 379–389. [Google Scholar] [CrossRef] [PubMed]
  36. Liu, Y.; So, R.; Zhang, C. Modeling the bifurcating flow in a human lung airway. J. Biomech. 2002, 35, 465–473. [Google Scholar] [CrossRef]
  37. Comer, J.K.; Kleinstreuer, C.; Kim, C.S. Flow structures and particle deposition patterns in double-bifurcation airway models. Part 2. Aerosol transport and deposition. J. Fluid Mech. 2001, 435, 55–80. [Google Scholar] [CrossRef]
  38. Fresconi, F.E.; Prasad, A.K. Secondary velocity fields in the conducting airways of the human lung. J. Biomech. Eng. 2007, 129, 722–732. [Google Scholar] [CrossRef]
  39. Yang, X.; Liu, Y.; So, R.; Yang, J. The effect of inlet velocity profile on the bifurcation COPD airway flow. Comput. Biol. Med. 2006, 36, 181–194. [Google Scholar] [CrossRef]
  40. Yu, G.; Zhang, Z.; Lessmann, R. Computer simulation of the flow field and particle deposition by diffusion in a 3-D human airway bifurcation. Aerosol Sci. Technol. 1996, 25, 338–352. [Google Scholar] [CrossRef]
  41. Zhang, Z.; Kleinstreuer, C.; Kim, C.S. Effects of curved inlet tubes on air flow and particle deposition in bifurcating lung models. J. Biomech. 2001, 34, 659–669. [Google Scholar] [CrossRef]
  42. Zhao, Y.; Lieber, B.B. Steady inspiratory flow in a model symmetric bifurcation. Trans. ASME-K-J. Biomech. Eng. 1994, 116, 488–496. [Google Scholar] [CrossRef]
  43. Zhao, Y.; Lieber, B.B. Steady expiratory flow in a model symmetric bifurcation. J. Biomech. Eng. 1994, 116, 318–323. [Google Scholar] [CrossRef]
  44. Adler, K.; Brücker, C. Dynamic flow in a realistic model of the upper human lung airways. Exp. Fluids 2007, 43, 411. [Google Scholar] [CrossRef]
  45. Bauer, K.; Brücker, C. The influence of airway tree geometry and ventilation frequency on airflow distribution. J. Biomech. Eng. 2015, 137, 081001. [Google Scholar] [CrossRef] [PubMed]
  46. Wall, W.A.; Rabczuk, T. Fluid–structure interaction in lower airways of CT-based lung geometries. Int. J. Numer. Methods Fluids 2008, 57, 653–675. [Google Scholar] [CrossRef]
  47. Wang, Y.; Liu, Y.; Sun, X.; Yu, S.; Gao, F. Numerical analysis of respiratory flow patterns within human upper airway. Acta Mech. Sin. 2009, 25, 737–746. [Google Scholar] [CrossRef]
  48. Koombua, K.; Pidaparti, R.M.; Longest, P.W.; Ward, K.R. Computational analysis of fluid characteristics in rigid and flexible human respiratory airway models. Eng. Appl. Comput. Fluid Mech. 2008, 2, 185–194. [Google Scholar] [CrossRef] [Green Version]
  49. Duque-Daza, C.A.; Ramirez-Pastran, J.; Lain, S. Influence of particle mass fraction over the turbulent behaviour of an incompressible particle-laden flow. Fluids 2020, 6, 374. [Google Scholar] [CrossRef]
  50. Wang, W.; Dai, Z.; Li, J.; Zhou, L. A hybrid Laplace transform finite analytic method for solving transport problems with large Peclet and Courant numbers. Comput. Geosci. 2009, 49, 182–189. [Google Scholar] [CrossRef]
  51. Liu, W.; Sun, H.; Lai, D.; Xue, Y.; Kabanshi, A.; Hu, S. Performance of fast fluid dynamics with a semi-Lagrangian scheme and an implicit upwind scheme in simulating indoor/outdoor airflow. Build. Environ. 2022, 207, 108477. [Google Scholar] [CrossRef]
  52. Calay, R.; Kurujareon, J.; Holdø, A.E. Numerical simulation of respiratory flow patterns within human lung. Respir. Physiol. Neurobiol. 2002, 130, 201–221. [Google Scholar] [CrossRef]
  53. Schroter, R.; Sudlow, M. Flow patterns in models of the human bronchial airways. Respir. Physiol. 1969, 7, 341–355. [Google Scholar] [CrossRef] [PubMed]
  54. Van Ertbruggen, C.; Hirsch, C.; Paiva, M. Anatomically based three-dimensional model of airways to simulate flow and particle transport using computational fluid dynamics. J. Appl. Physiol. 2005, 98, 970–980. [Google Scholar] [CrossRef] [PubMed] [Green Version]
  55. Corieri, P. Experimental and Numerical Investigation of Flows in Bifurcations within Lung Airways. Ph.D. Thesis, von Karman Institute for Fluid Dynamics, Université Libre de Bruxelles and Rheinisch-Westfälische Technische Hochschule Aachen, Brussels, Belgium, 1994. [Google Scholar]
  56. Han, F.; Liu, Y.; Lan, Q.; Li, W.; Wang, Z. CFD investigation on secondary flow characteristics in double-curved subsea pipelines with different spatial structures. J. Mar. Sci. Eng. 2022, 10, 1264. [Google Scholar] [CrossRef]
  57. Dean, W.R. Note on the motion of fluid in a curved pipe. Lond. Edinb. Dublin Philos. Mag. J. Sci. 1927, 4, 208–223. [Google Scholar] [CrossRef]
  58. Pedley, T.; Schroter, R.; Sudlow, M. Energy losses and pressure drop in models of human airways. Respir. Physiol. 1970, 9, 371–386. [Google Scholar] [CrossRef] [PubMed]
  59. Pedley, T.; Schroter, R.; Sudlow, M. Flow and pressure drop in systems of repeatedly branching tubes. J. Fluid Mech. 1971, 46, 365–383. [Google Scholar] [CrossRef]
  60. Wang, X.-Q.; Mujumdar, A.S.; Yap, C. Effect of bifurcation angle in tree-shaped microchannel networks. J. Appl. Phys. 2007, 102, 073530. [Google Scholar] [CrossRef]
  61. Green, A.S. Modelling of peak-flow wall shear stress in major airways of the lung. J. Biomech. 2004, 37, 661–667. [Google Scholar] [CrossRef]
  62. Nucci, G.; Suki, B.; Lutchen, K. Modeling airflow-related shear stress during heterogeneous constriction and mechanical ventilation. J. Appl. Physiol. 2003, 95, 348–356. [Google Scholar] [CrossRef] [Green Version]
  63. Xia, G.; Tawhai, M.H.; Hoffman, E.A.; Lin, C.-L. Airway wall stiffening increases peak wall shear stress: A fluid-structure interaction study in rigid and compliant airways. Ann. Biomed. Eng. 2010, 38, 1836–1853. [Google Scholar] [CrossRef] [Green Version]
Figure 1. Geometric parameters of Weibel model [28].
Fluids 08 00078 g001
Figure 2. Bifurcation model geometry proposed by Lee et al. [35].
Fluids 08 00078 g002
Figure 3. Computational grid for (a) BA’s study and (b) CRR’s study.
Fluids 08 00078 g003
Figure 4. Grid detail near the branch wall.
Fluids 08 00078 g004
Figure 5. Comparison of the axial velocity profiles with Zhao & Lieber experiments for inhalation [42] and exhalation [43]. (a) Inhalation at coronal plane, (b) Inhalation at sagittal plane, (c) Exhalation at coronal plane, (d) Exhalation at sagittal plane.
Fluids 08 00078 g005
Figure 6. Indicative scheme of the zones and points wherefrom the results were reported.
Fluids 08 00078 g006
Figure 7. Velocity profiles on coronal plane.
Fluids 08 00078 g007
Figure 8. Velocity profiles on sagittal plane.
Fluids 08 00078 g008
Figure 9. Velocity profiles at exhalation stage for TRA branch.
Fluids 08 00078 g009
Figure 10. Comparison of coherent structures for different Reynolds numbers. Inhalation stage with BA = 55 . 9 .
Fluids 08 00078 g010
Figure 11. Comparison of coherent structures for different BA’s. Inhalation stage at Re = 2000 .
Fluids 08 00078 g011
Figure 12. V-W profile and secondary flow patterns for inhalation stage.
Fluids 08 00078 g012
Figure 13. Comparison of coherent structures for different Reynold numbers. Exhalation stage with BA = 55 . 9 .
Fluids 08 00078 g013
Figure 14. Comparison of coherent structures for different BAs. Exhalation stage at Re = 2000 .
Fluids 08 00078 g014
Figure 15. V-W profile and secondary flow patterns for exhalation stage.
Fluids 08 00078 g015
Figure 16. Pressure drops across the axial axes of the branches.
Fluids 08 00078 g016
Figure 17. Pressure drops across the axial axes of the branches at exhalation stage.
Fluids 08 00078 g017
Figure 18. Wall Shear Stress on inner wall for inhalation.
Fluids 08 00078 g018
Figure 19. Wall Shear Stress on outer wall for exhalation.
Fluids 08 00078 g019
Figure 20. Velocity profiles on coronal plane at 20 % of the LMB length.
Fluids 08 00078 g020
Figure 21. Velocity profiles on coronal plane at 50 % of the LMB length.
Fluids 08 00078 g021
Figure 22. Velocity profiles on sagittal plane. Taken at 20 % of the LMB length.
Fluids 08 00078 g022
Figure 23. Velocity profiles on sagittal plane. Taken at 50 % of the LMB length.
Fluids 08 00078 g023
Figure 24. Comparison of coherent structures for different Reynolds numbers. Inhalation stage with r c = 0 .
Fluids 08 00078 g024
Figure 25. Comparison of coherent structures for different CRR’s. Inhalation stage at Re = 2000 .
Fluids 08 00078 g025
Figure 26. Vorticity profile on coronal plane at 20 % of the LMB length.
Fluids 08 00078 g026
Figure 27. V-W profile at coronal plane and secondary flow patterns in LMB airway.
Fluids 08 00078 g027
Figure 28. Pressure drop across the airways axial line.
Fluids 08 00078 g028
Figure 29. Wall Shear Stress on inner wall for inhalation.
Fluids 08 00078 g029
Table 1. Weibel’s model parameters in the first three generations.
AIRWAYD (mm)L (mm)
TRA18120
LMB/RMB1247.6
LUB/RUB/LLB/RIB8.341.5
Table 2. Subcarinal angles reported by Haskin & Goodman [4].
AGE [YEARS]ANGLE [ ]
21–3064.2
31–4058.9
41–5061.9
51–6063.1
61–+55.9
All ages60.8
Table 3. Model Parameters values for CRR study.
BranchD (mm)Len. (mm) α ( ) Rd (mm)
TRA16803581.5
LMB/RMB1470
Disclaimer/Publisher’s Note: The statements, opinions and data contained in all publications are solely those of the individual author(s) and contributor(s) and not of MDPI and/or the editor(s). MDPI and/or the editor(s) disclaim responsibility for any injury to people or property resulting from any ideas, methods, instructions or products referred to in the content.

