

Conceptual Design of a UVC-LED Air Purifier to Reduce Airborne Pathogen Transmission—A Feasibility Study
 , and
, and 
Abstract
:1. Introduction
1.1. Motivation and Aims
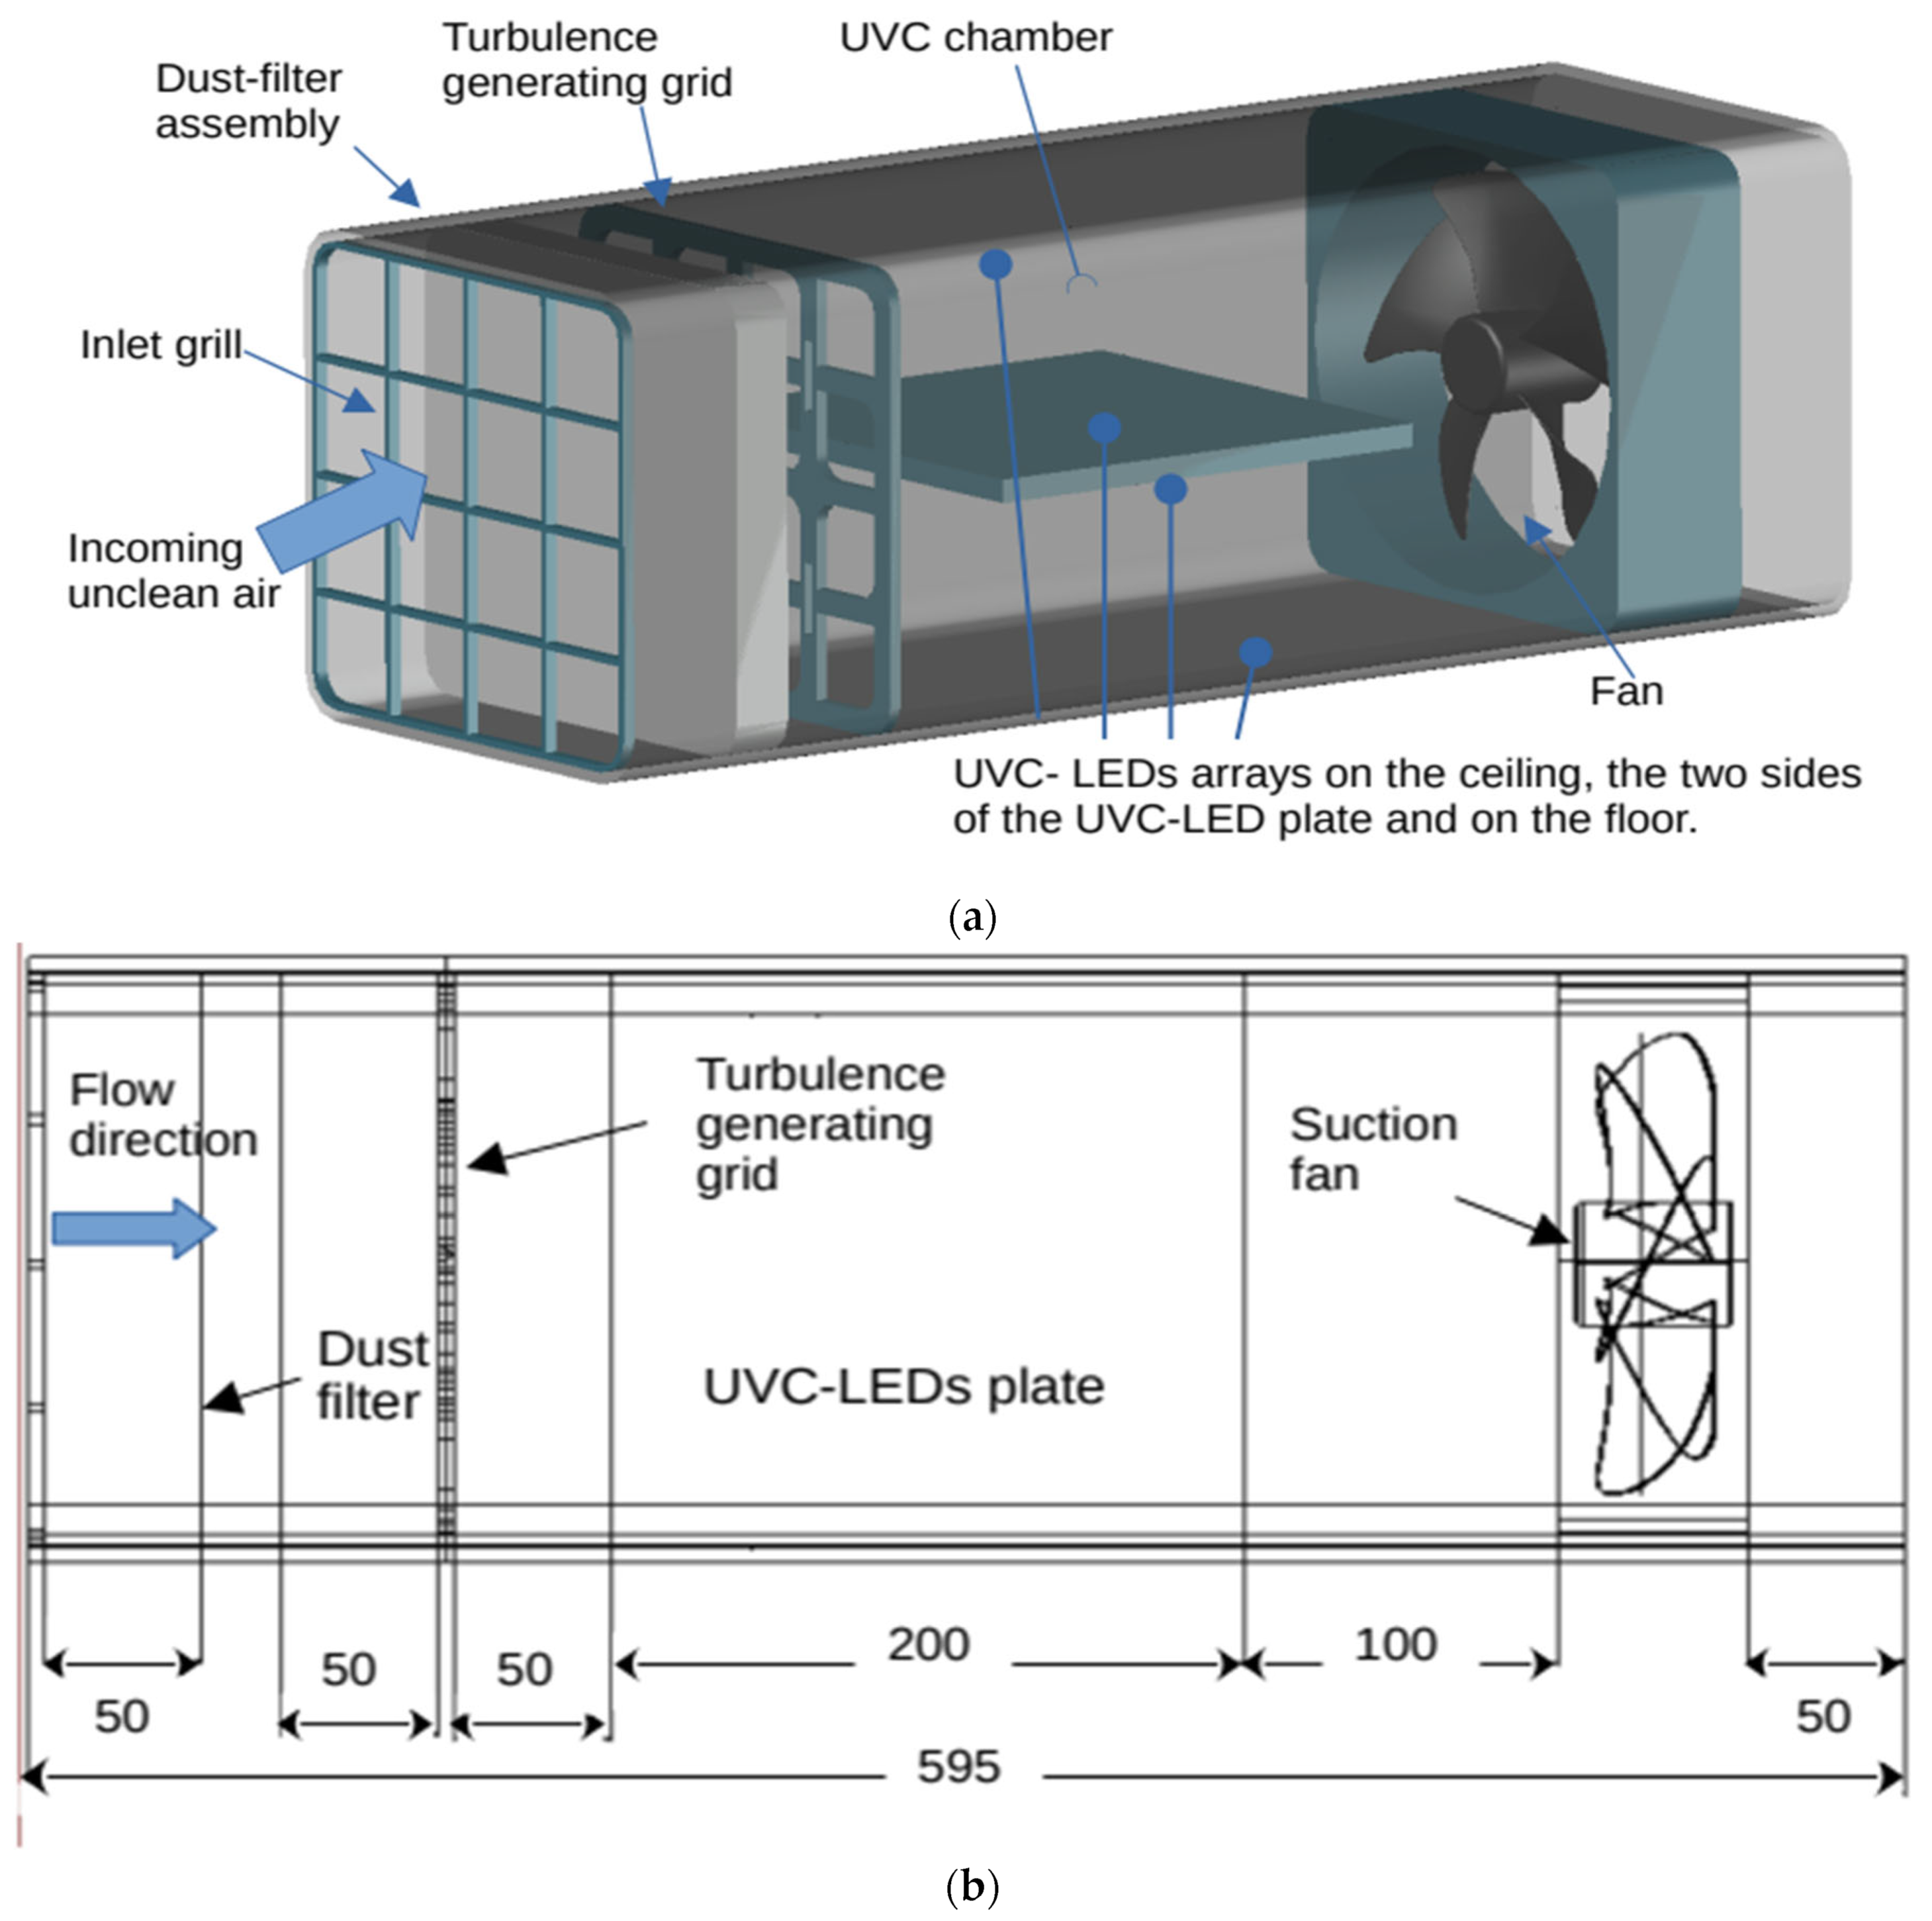
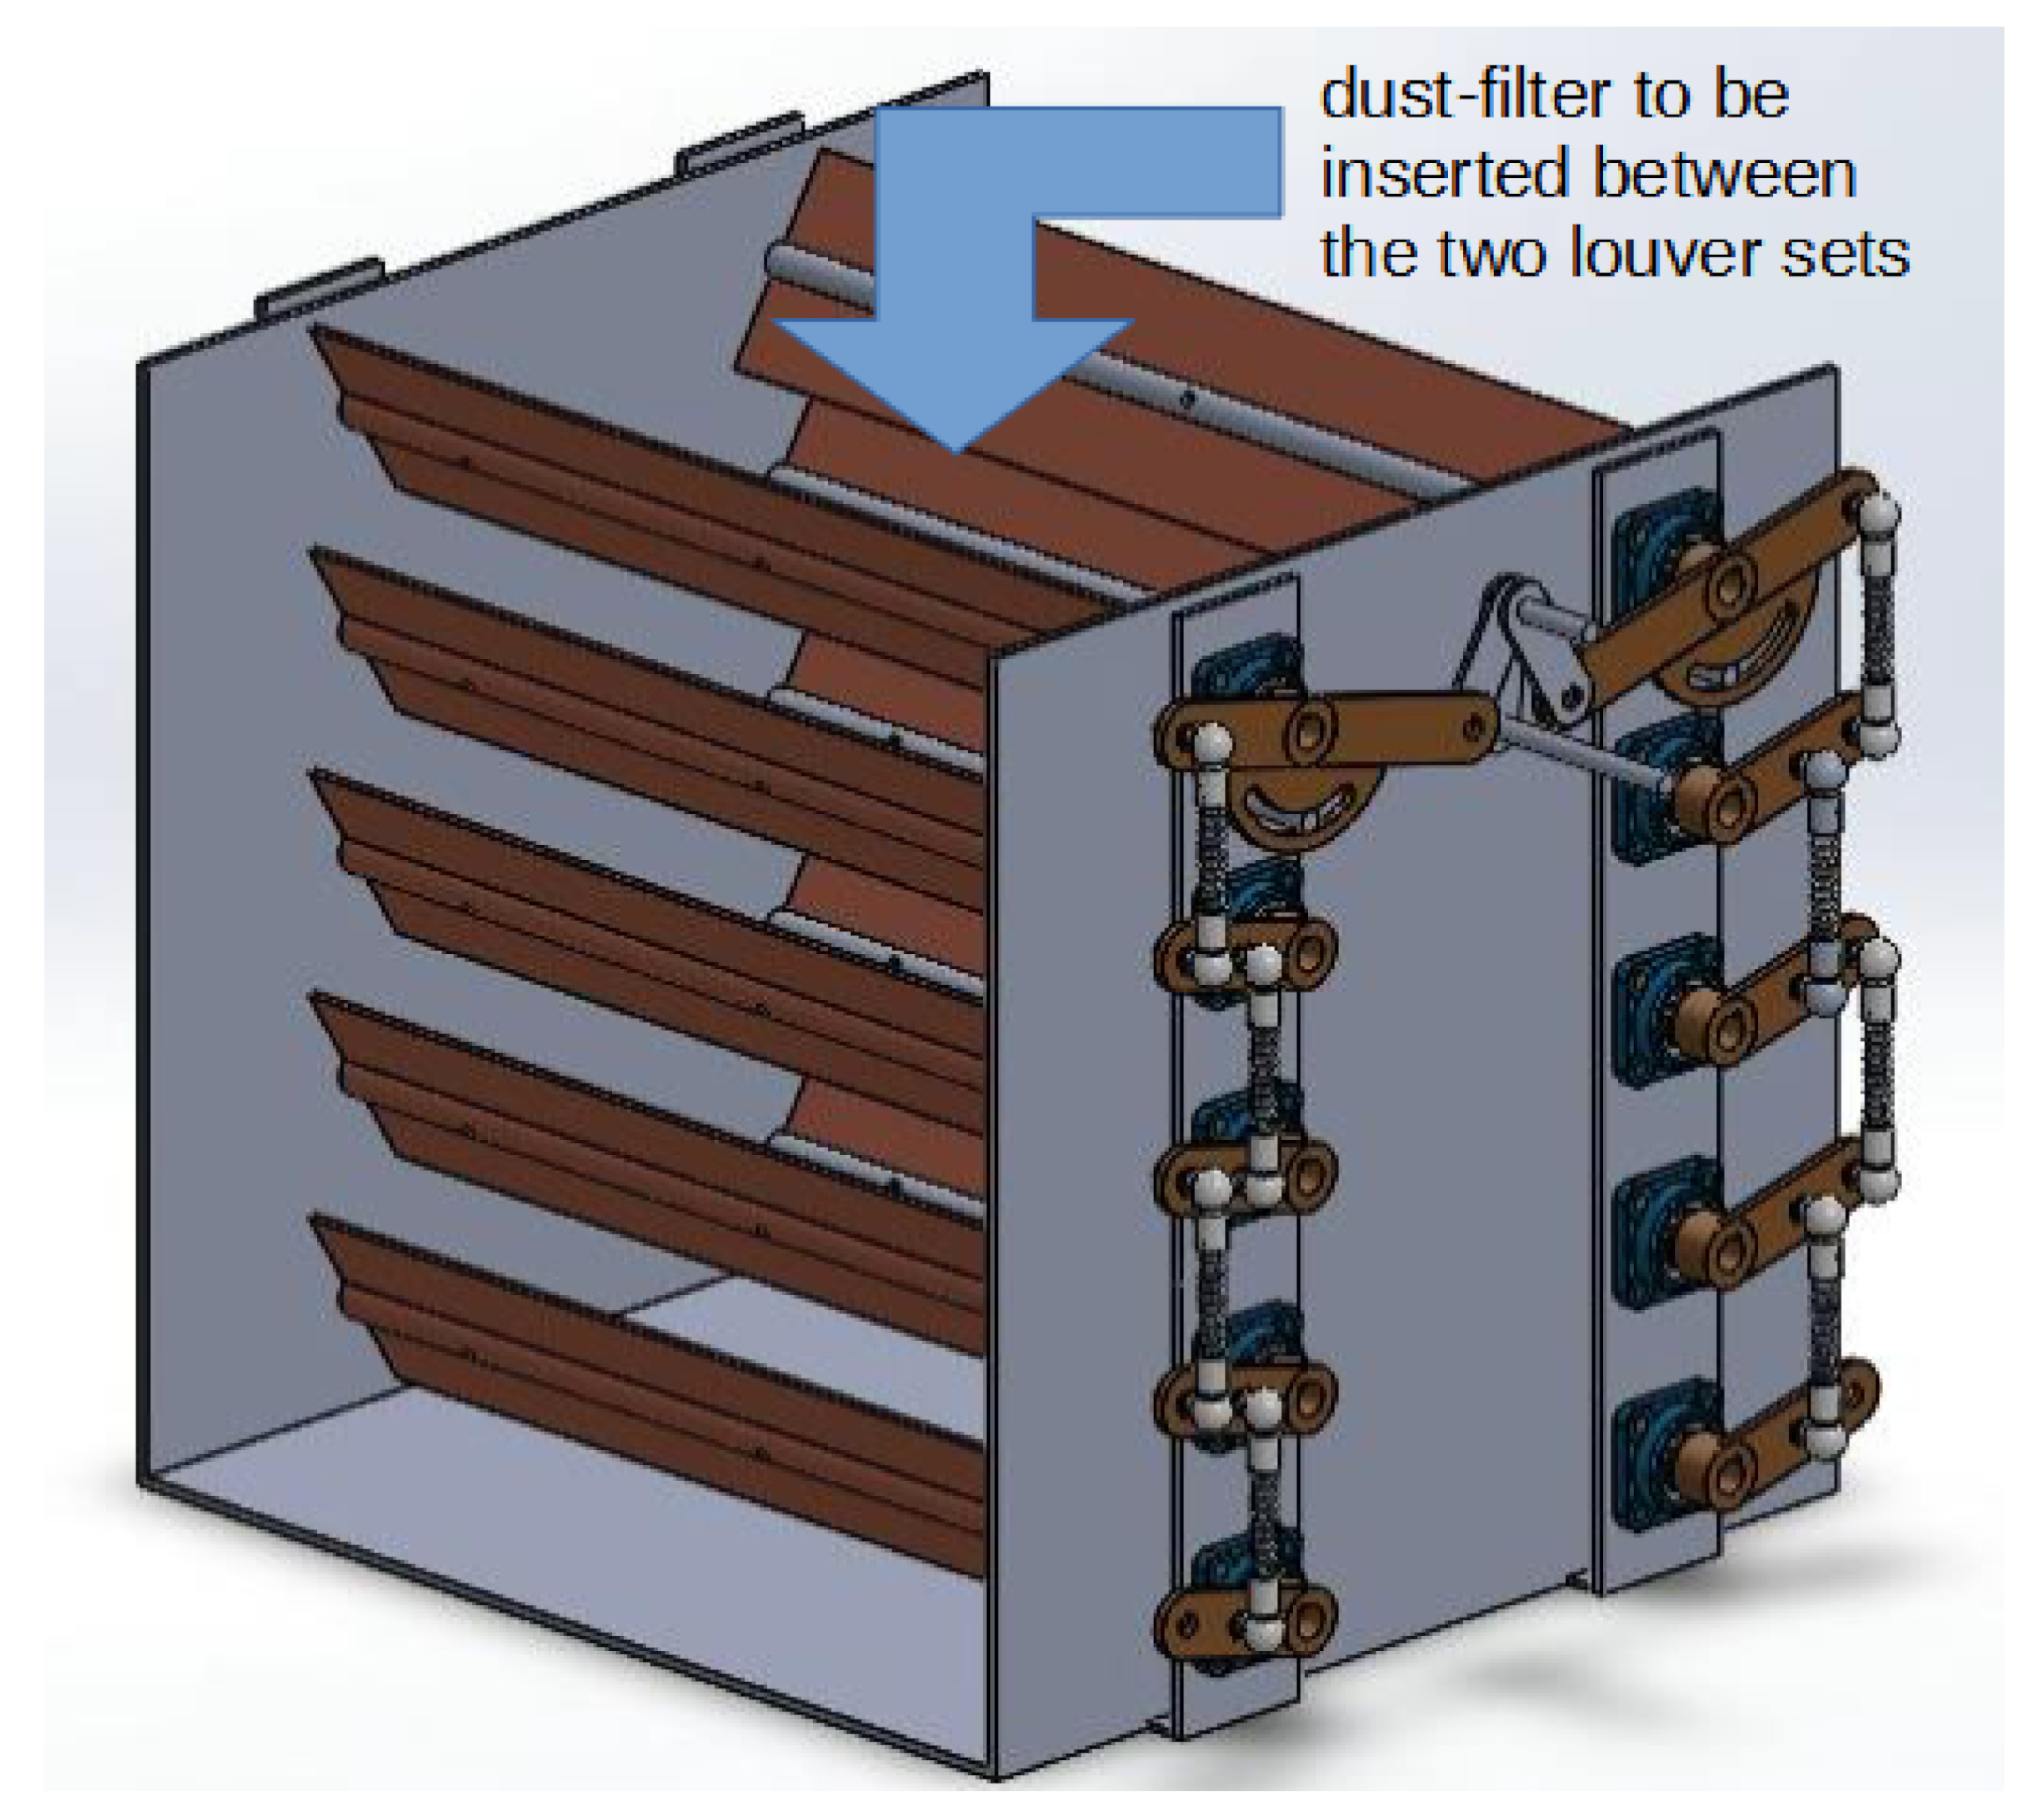
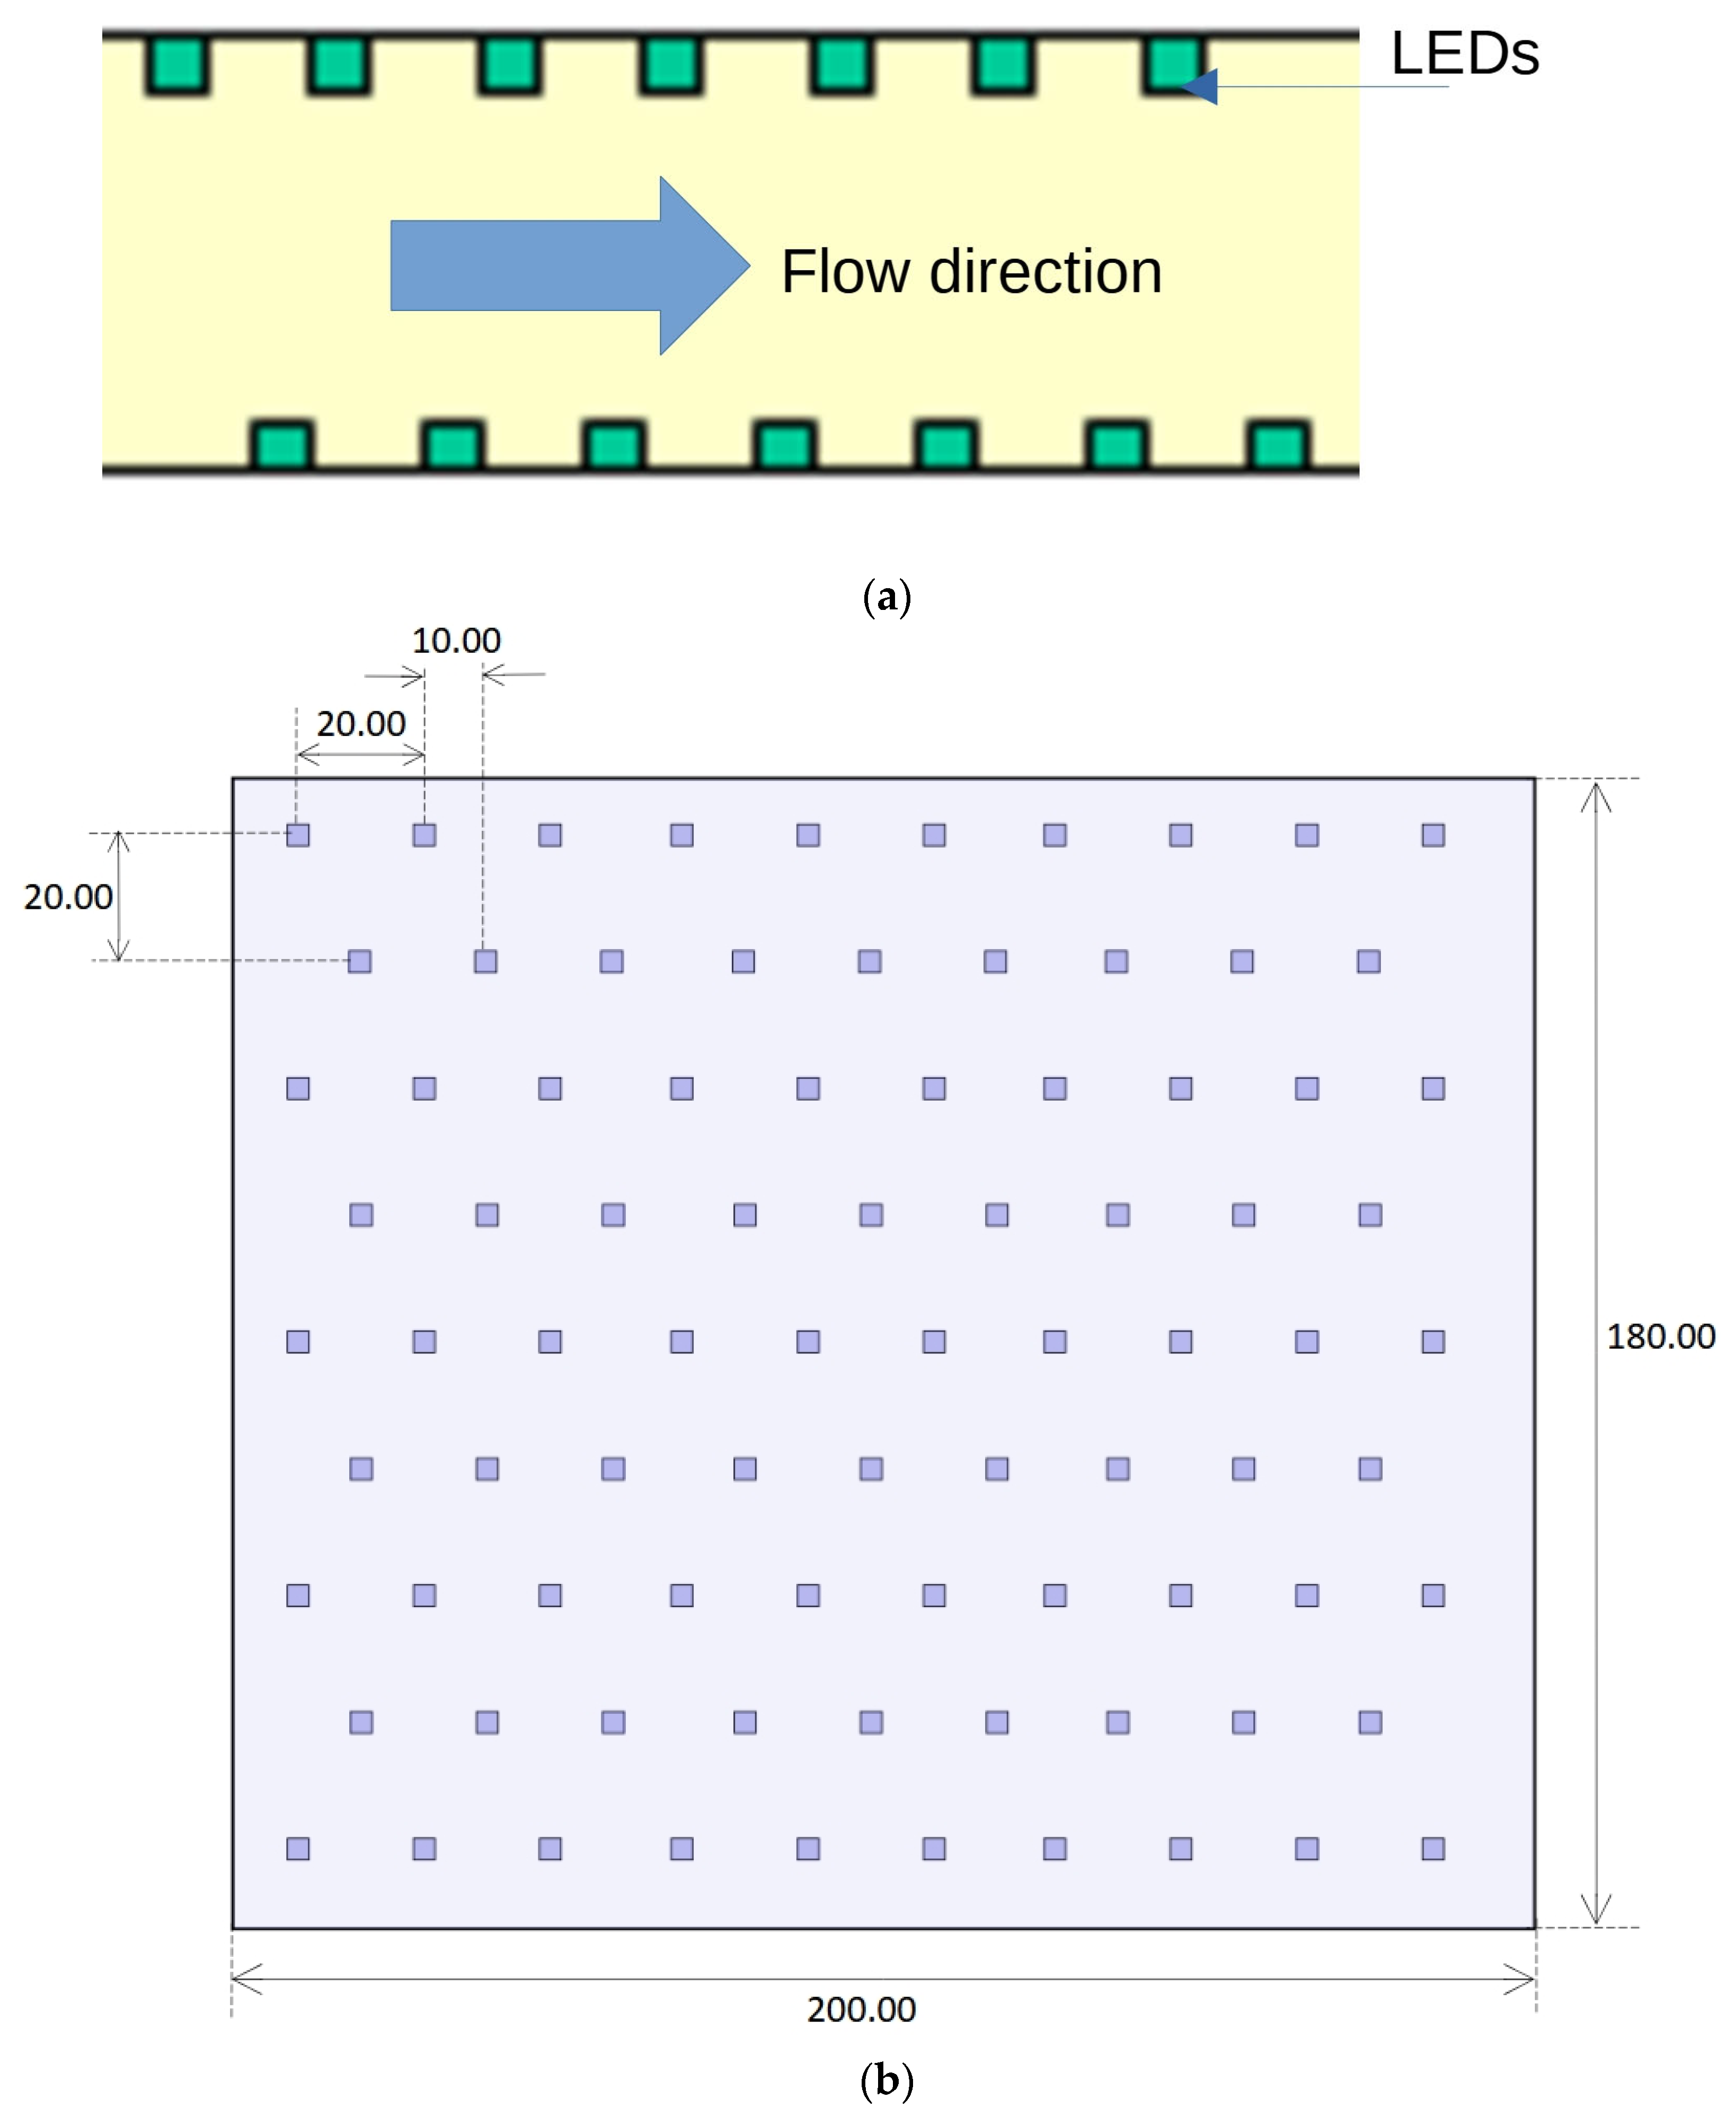
1.2. The Conceptual Design
2. Methodology
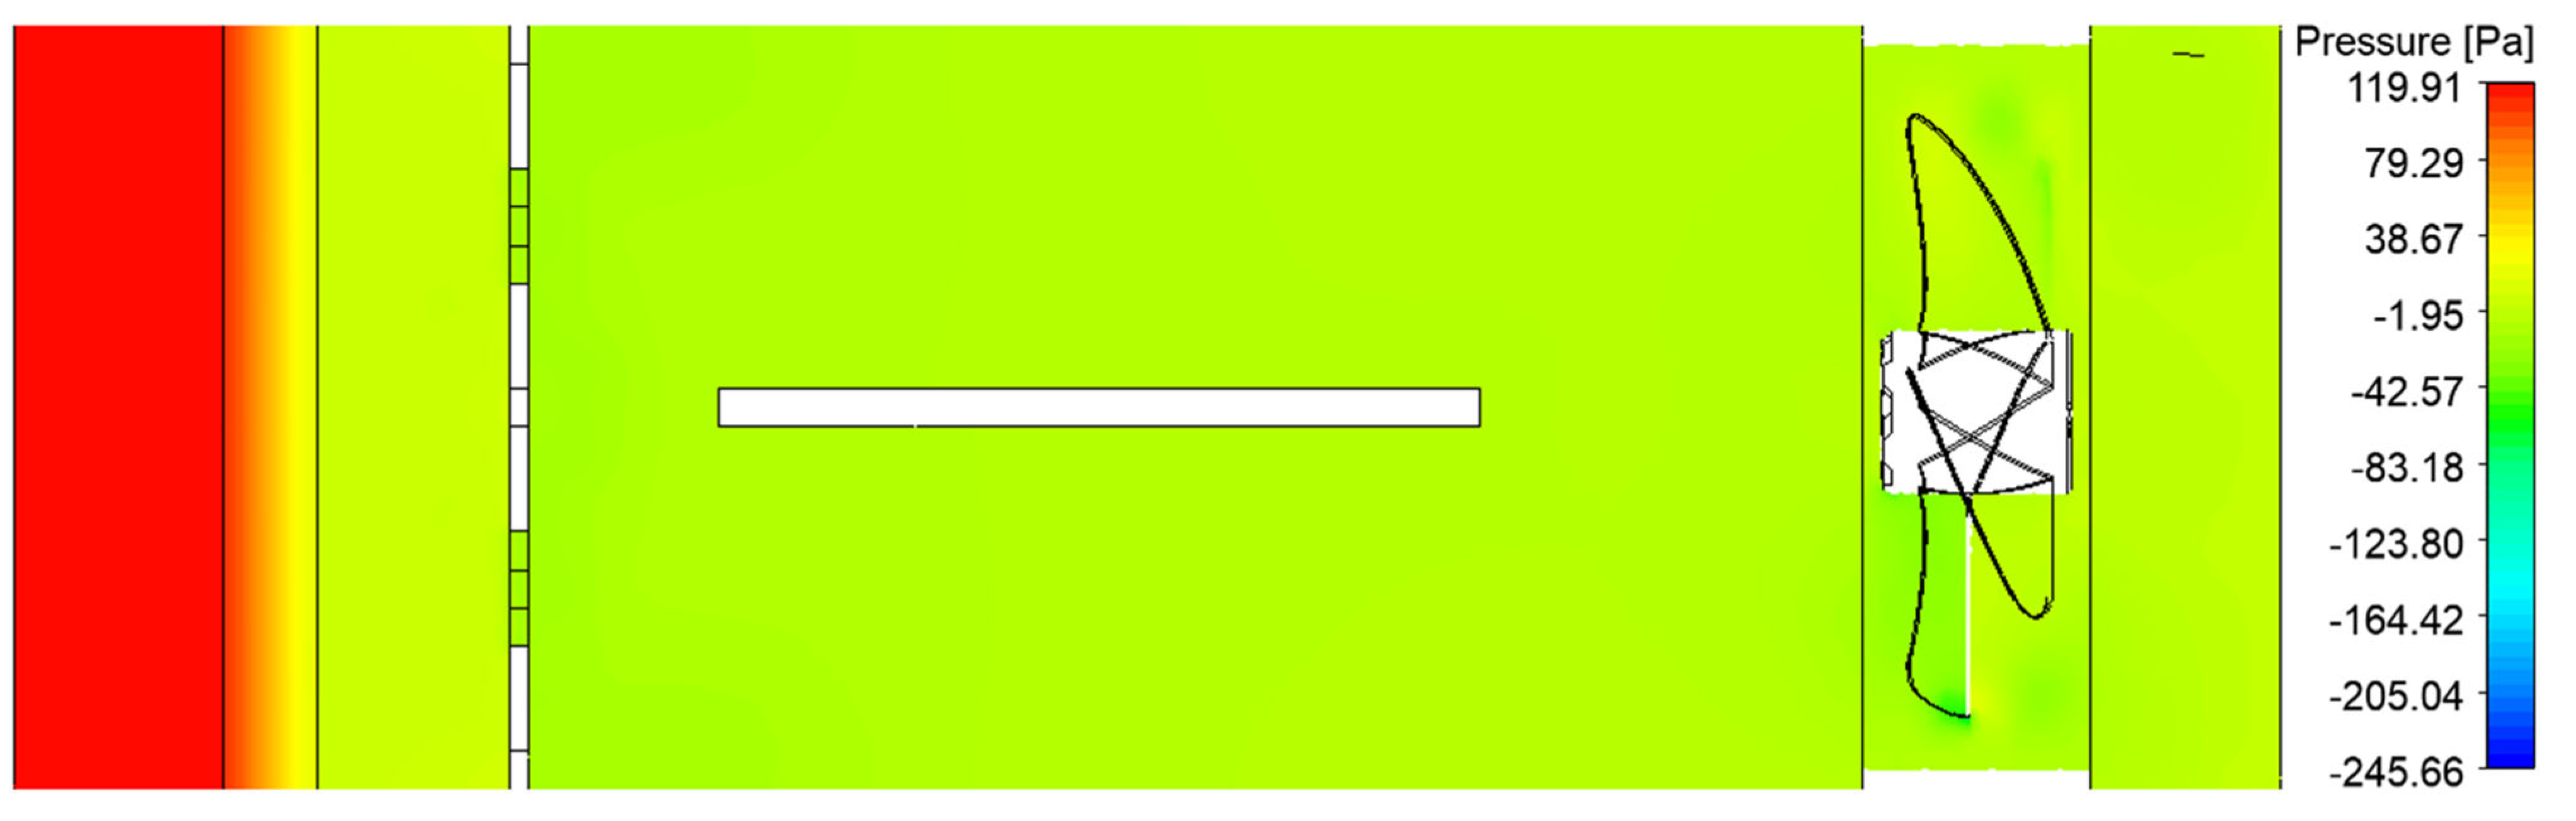
2.1. Aerodynamic Methodology
2.2. UVC Disinfection Methodology
3. Results and Discussion
4. Conclusions
Author Contributions
Funding
Data Availability Statement
Acknowledgments
Conflicts of Interest
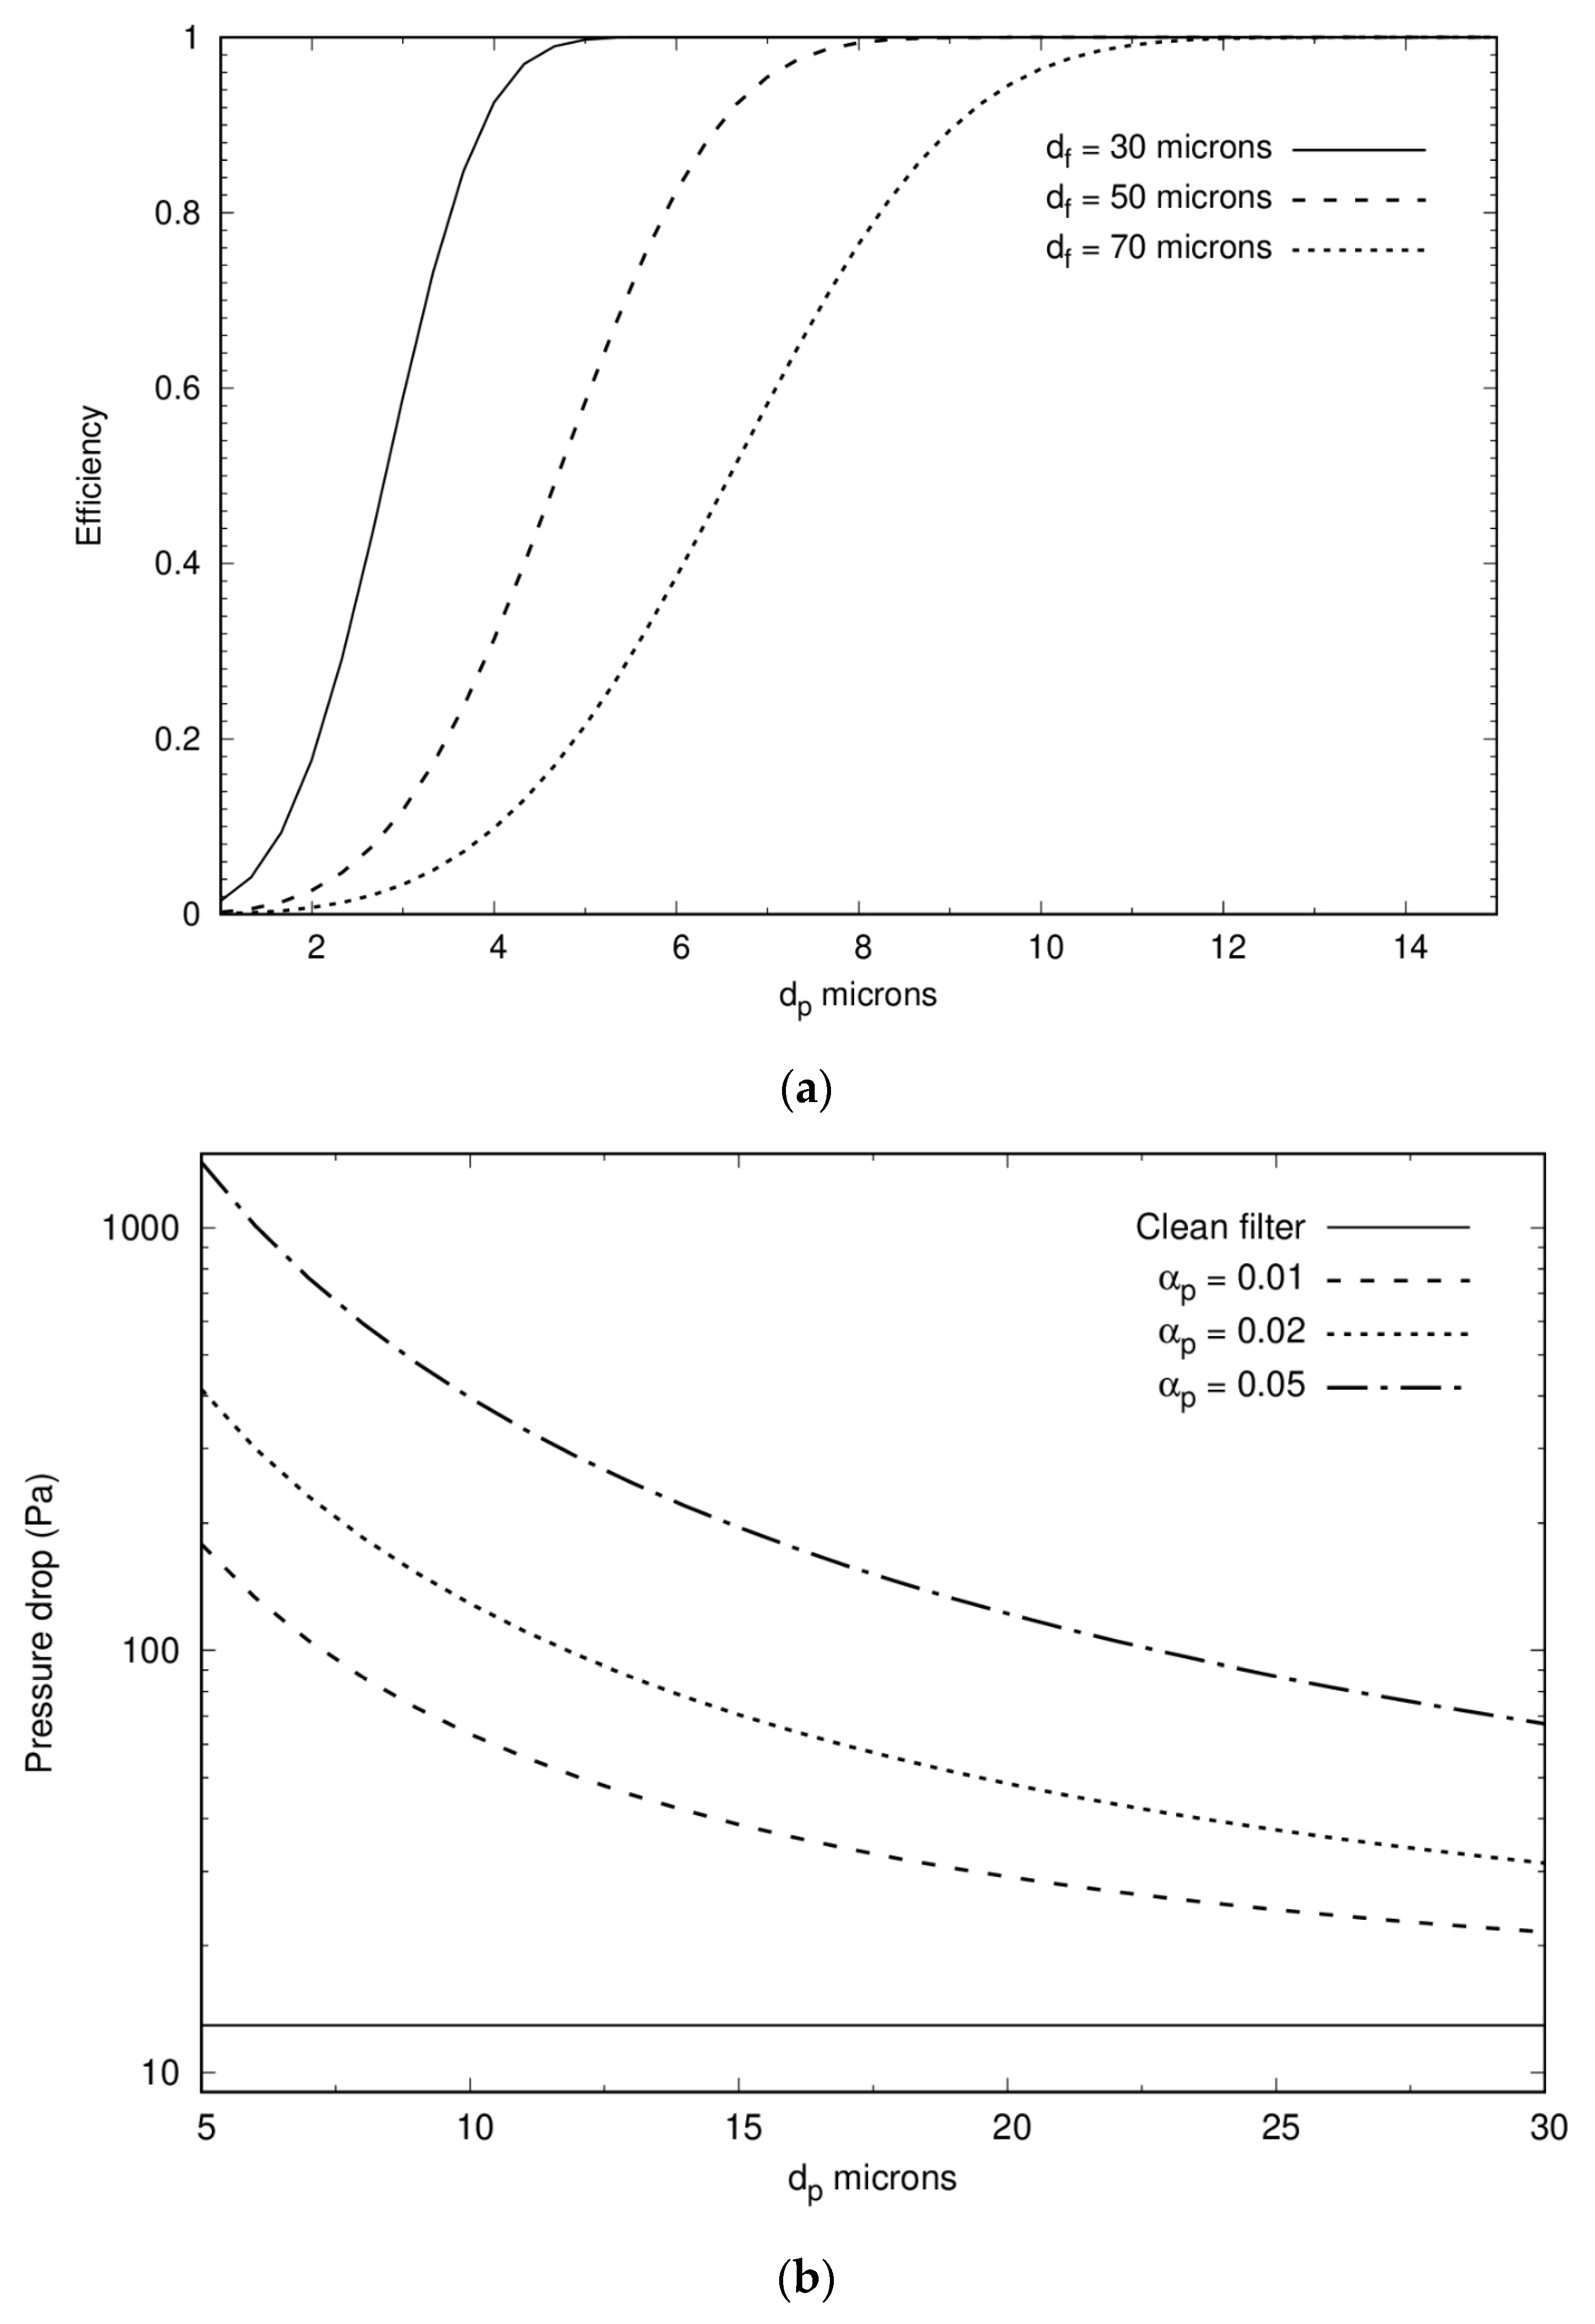
Appendix A. Dust-Filter Efficiencies
References
- Zhang, R.; Li, Y.; Zhang, A.L.; Wang, Y.; Molina, M.J. Identifying airborne transmission as the dominant route for the spread of COVID-19. Proc. Natl. Acad. Sci. USA 2020, 117, 14857–14863. [Google Scholar] [CrossRef]
- Miller, S.L.; Nazaroff, W.W.; Jimenez, J.L.; Boerstra, A.; Buonanno, G.; Dancer, S.J.; Kurnitski, J.; Marr, L.C.; Morawska, L.; Noakes, C. Transmission of SARS-CoV-2 by inhalation of respiratory aerosol in the Skagit Valley Chorale superspreading event. Indoor Air 2021, 31, 314–323. [Google Scholar] [CrossRef] [PubMed]
- Beggs, C.B.; Noakes, C.J.; Sleigh, P.A.; Fletcher, L.A.; Siddiqi, K. The transmission of tuberculosis in confined spaces: An analytical review of alternative epidemiological models. Int. J. Tuberc. Lung Dis. 2003, 7, 1015–1026. [Google Scholar] [PubMed]
- Escombe, A.R.; Moore, D.A.; Gilman, R.H.; Navincopa, M.; Ticona, E.; Mitchell, B.; Noakes, C.; Martinez, C.; Sheen, P.; Ramirez, R.; et al. Upper-room ultraviolet light and negative air ionization to prevent tuberculosis transmission. PLoS Med. 2009, 6, e1000043. [Google Scholar] [CrossRef] [Green Version]
- Bloch, A.B.; Orenstein, W.A.; Ewing, W.M.; Spain, W.H.; Mallison, G.F.; Herrmann, K.L.; Hinman, A.R. Measles outbreak in a paediatric practice: Airborne transmission in an office setting. Paediatrics 1985, 75, 676–683. [Google Scholar] [CrossRef]
- Yan, J.; Grantham, M.; Pantelic, J.; Bueno de Mesquita, P.J.; Albert, B.; Liu, F.; Ehrman, S.; Milton, D.K.; Emit Consortium. Infectious virus in exhaled breath of symptomatic seasonal influenza cases from a college community. Proc. Natl. Acad. Sci. USA 2018, 115, 1081–1086. [Google Scholar] [CrossRef] [Green Version]
- Houben, R.M.; Dodd, P.J. The global burden of latent tuberculosis infection: A re-estimation using mathematical modelling. PLoS Med. 2016, 13, e1002152. [Google Scholar] [CrossRef] [PubMed] [Green Version]
- World Health Organisation. Global Tuberculosis Report 2021; WHO: Geneva, Switzerland, 2021.
- Greenhalgh, T.; Jimenez, J.L.; Prather, K.A.; Tufekci, Z.; Fisman, D.; Schooley, R. Ten scientific reasons in support of airborne transmission of SARS2-CoV-2. Lancet 2021, 397, 1603–1605. [Google Scholar] [CrossRef] [PubMed]
- Beggs, C.B.; Avital, E.J. Upper-room ultraviolet air disinfection might help to reduce COVID-19 transmission in buildings: A feasibility study. PeerJ 2020, 8, 10196. [Google Scholar] [CrossRef]
- Beggs, C.B.; Avital, E.J. A psychometric model to assess the biological decay of the SARS-CoV-2 virus in aerosols. PeerJ 2021, 9, 11024. [Google Scholar] [CrossRef]
- Seminara, G.; Carli, B.; Forni, G.; Fuzzi, S.; Mazzino, A.; Rinaldo, A. Biological fluid dynamics of airborne COVID-19 infection. Rend. Lincei. Sci. Fis. Nat. 2020, 31, 505–537. [Google Scholar] [CrossRef]
- Morawska, L.; Tang, J.W.; Bhanfleth, W.; Bluyssen, P.M.; Boerstra, A.; Buonanno, G.; Cao, J.; Dancer, S.; Floto, A.; Franchimon, F.; et al. How can airborne transmission of COVID-19 indoors be minimised? Environ. Int. 2020, 142, 105832. [Google Scholar] [CrossRef] [PubMed]
- Xie, X.; Li, Y.; Chwang, A.T.; Ho, P.L.; Seto, W.H. How far droplets can move in indoor environments--revisiting the Wells evaporation-falling curve. Indoor Air 2007, 17, 211–225. [Google Scholar] [CrossRef] [PubMed]
- Stadnyski, V.; Bax, C.F.; Bax, A.; Anfinrud, P. The airborne lifetime of small speech droplets and their potential importance in SARS2-CoV-2 transmission. Proc. Natl. Acad. Sci. USA 2020, 117, 11875–11877. [Google Scholar] [CrossRef] [PubMed]
- Anghel, L.; Popovici, C.G.; Statescu, C.; Sascău, R.; Verde, M.; Ciocan, V.; Șerban, I.-L.; Mărănducă, M.A.; Hudi, S.-V.; Țurcanu, F.-E. Impact of HVAC-System on the dispersion of infectious aerosols in a cardiac intensive care unit. Int. J. Environ. Res. Public Health 2020, 17, 6582. [Google Scholar] [CrossRef] [PubMed]
- Beggs, C.B.; Shepherd, S.J.; Kerr, K.G. Potential for airborne transmission of infection in the waiting areas of healthcare premises: Stochastic analysis using a Monte Carlo model. BMC Infect. Dis. 2010, 10, 247. [Google Scholar] [CrossRef] [PubMed] [Green Version]
- Butler, M.B.; Sloof, D.; Peters, C.; Gouliouris, T.; Thaxter, R.; Keevil, V.L.; Beggs, C.B. Impact of supplementary air filtration on aerosols and particulate matter in a UK hospital ward: A case study. J. Hosp. Infect. 2023. online ahead of print. [Google Scholar] [CrossRef]
- Beggs, C.B. A quantitative method for evaluating the photoreactivation of ultraviolet damaged microorganisms. Photochem. Photobiol. Sci. 2002, 1, 431–437. [Google Scholar] [CrossRef]
- First, M.W.; Nardell, E.A.; Chaisson, W.; Riley, R. Guidelines for the application of upper-room ultraviolet germicidal irradiation for preventing transmission of airborne contagion-Part I: Basic principles. Tran-Am. Soc. Heat. Refrig. Air-Cond. Eng. 1999, 105, 869–876. [Google Scholar]
- Davidson, B.L. Bare-bulb upper-room germicidal ultraviolet-c (GUV) indoor air disinfection for COVID-19. Photochem. Photobiol. 2021, 97, 524–526. [Google Scholar] [CrossRef]
- Qjao, Y.; Yang, M.; Marabella, I.A.; McGee, D.A.J.; Aboubakr, H.; Goyal, S.; Hogan, C.J., Jr.; Olson, B.A.; Torremorell, M. Greater then 3-Log reduction in viable coronavirus aerosol concentration in ducted Ultraviolet-C (UV-C) Systems. Environ. Sci. Technol. 2021, 55, 4174–4182. [Google Scholar]
- Cullen, A.P. Photokeratitis and other phototoxic effects on the cornea and conjunctiva. Int. J. Toxicol. 2002, 21, 455–464. [Google Scholar] [CrossRef] [PubMed]
- Harrison, G.I.; Young, A.R. Ultraviolet radiation-induced erythema in human skin. Methods 2002, 28, 14–19. [Google Scholar] [CrossRef] [PubMed]
- Burridge, H.C.; Bhagat, R.K.; Stettler, M.E.; Kumar, P.; De Mel, I.; Demis, P.; Hart, A.; Johnson-Llambias, Y.; King, M.-F.; Klymenko, O.; et al. The ventilation of buildings and other mitigating measures for COVID-19: A focus on wintertime. Proc. R. Soc. A 2021, 477, 20200855. [Google Scholar] [CrossRef]
- Inagaki, H.; Saito, A.; Sugiyama, H.; Okabayashi, T.; Fujimoto, S. Rapid inactivation of SARS-CoV-2 with deep-UV LED irradiation. Emerg. Microbes Infect. 2020, 9, 1744–1747. [Google Scholar] [CrossRef]
- World Health Organisation. Roadmap to Improve and Ensure Indoor Ventilation in the Contextr of COVID-19; World Health Organisation: Geneva, Switzerland, 2021.
- Basu, S. Computational characterization of inhaled droplet transport to the nasopharynx. Sci. Rep. 2021, 11, 6652. [Google Scholar] [CrossRef] [PubMed]
- Thomas, D.; Penicot, P.; Contal, P.; Leclerc, D.; Vendel, J. Clogging of fibrous filters by solid aerosol particles experimental and modelling study. Chem. Eng. Sci. 2001, 56, 3549–3561. [Google Scholar] [CrossRef]
- Shou, D.; Fan, J.; Ye, L.; Zhnag, H.; Qian, X.; Zhang, Z. Inverse problem of air filtration of nanoparticles: Optical quality factors of fibrous filters. J. Nano Mater. 2015, 2015, 1683912. [Google Scholar] [CrossRef] [Green Version]
- Kurian, T.; Fransson, J.H.M. Grid-generated turbulence revisited. Fluid Dyn. Res. 2009, 41, 021403. [Google Scholar] [CrossRef]
- Schlichting, H. Boundary Layer Theory; McGraw Hill: New York, NY, USA, 2018. [Google Scholar]
- Yan, Y.; Avital, E.; Williams, J.; Cui, J. CFD analysis for the performance of micro-vortex generator on aerofoil and vertical axis turbine. J. Renew. Sustain. Energy 2019, 11, 043302. [Google Scholar] [CrossRef]
- Menter, F.R. Improved Two-Equation k-Omega Turbulence Models for Aerodynamic Flows; NASA Technical Memorandum TM-103975; Technical Report; NASA: Ames, CA, USA, 1992. [Google Scholar]
- Pritchard, D.C. Lighting, 6th ed.; Routledge: New York, NY, USA, 1999. [Google Scholar]
- Batchelor, G.K. An Introduction to Fluid Dynamics; Cambridge University Press: Cambridge, UK, 1992. [Google Scholar]
- Southery, A.; Fox, M.; Yeomans, T.; Mitchell, B. A comparison of the characteristics of ISO fine test dust versus real household dust. In Proceedings of the 12th International Conference on Indoor Air Quality and Climate, Austin, TX, USA, 5–10 June 2011. [Google Scholar]
- Younis, B.A.; Yang, T.H. Computational modeling of ultraviolet disinfection. Water Sci. Technol. 2010, 62, 1872–1878. [Google Scholar] [CrossRef] [PubMed]
- Kulick, J.D.; Fessler, J.R.; Eaton, S.K. Particle response and turbulence modification in fully developed channel flow. J. Fluid Mech. 1994, 277, 109–139. [Google Scholar] [CrossRef]
- Abuhegazy, M.; Talaat, K.; Anderoglu, O.; Poroseva, S.V. Numerical investigation of aerosol transport in a classroom with relevance to COVID-19. Phys. Fluids 2020, 32, 103311. [Google Scholar] [CrossRef] [PubMed]
- Gilkeson, C.A.; Noakes, C.J.; Khan, M.A.I. Computational fluid dynamics modelling and optimisation of an upper-room ultraviolet germicidal irradiation system in a naturally ventilated hospital ward. Indoor Built Environ. 2014, 23, 449–466. [Google Scholar] [CrossRef] [Green Version]
- Pope, S.B. Turbulent Flows; Cambridge University Press: Cambridge, UK, 2003. [Google Scholar]
- Shen, X.; Avital, E.; Zhao, Q.; Gao, J.; Li, X.; Paul, G.; Korakianitis, T. Surface curvature effects on the tonal noise performance of a low Reynolds number aerofoil. Appl. Acoust. 2017, 125, 34–40. [Google Scholar] [CrossRef]


| Pathogen | Z (m2/J) |
|---|---|
| SARS-CoV-2 | 0.377 |
| Mycobacterium tuberculosis | 0.472 |
| Influenza A | 0.270 |
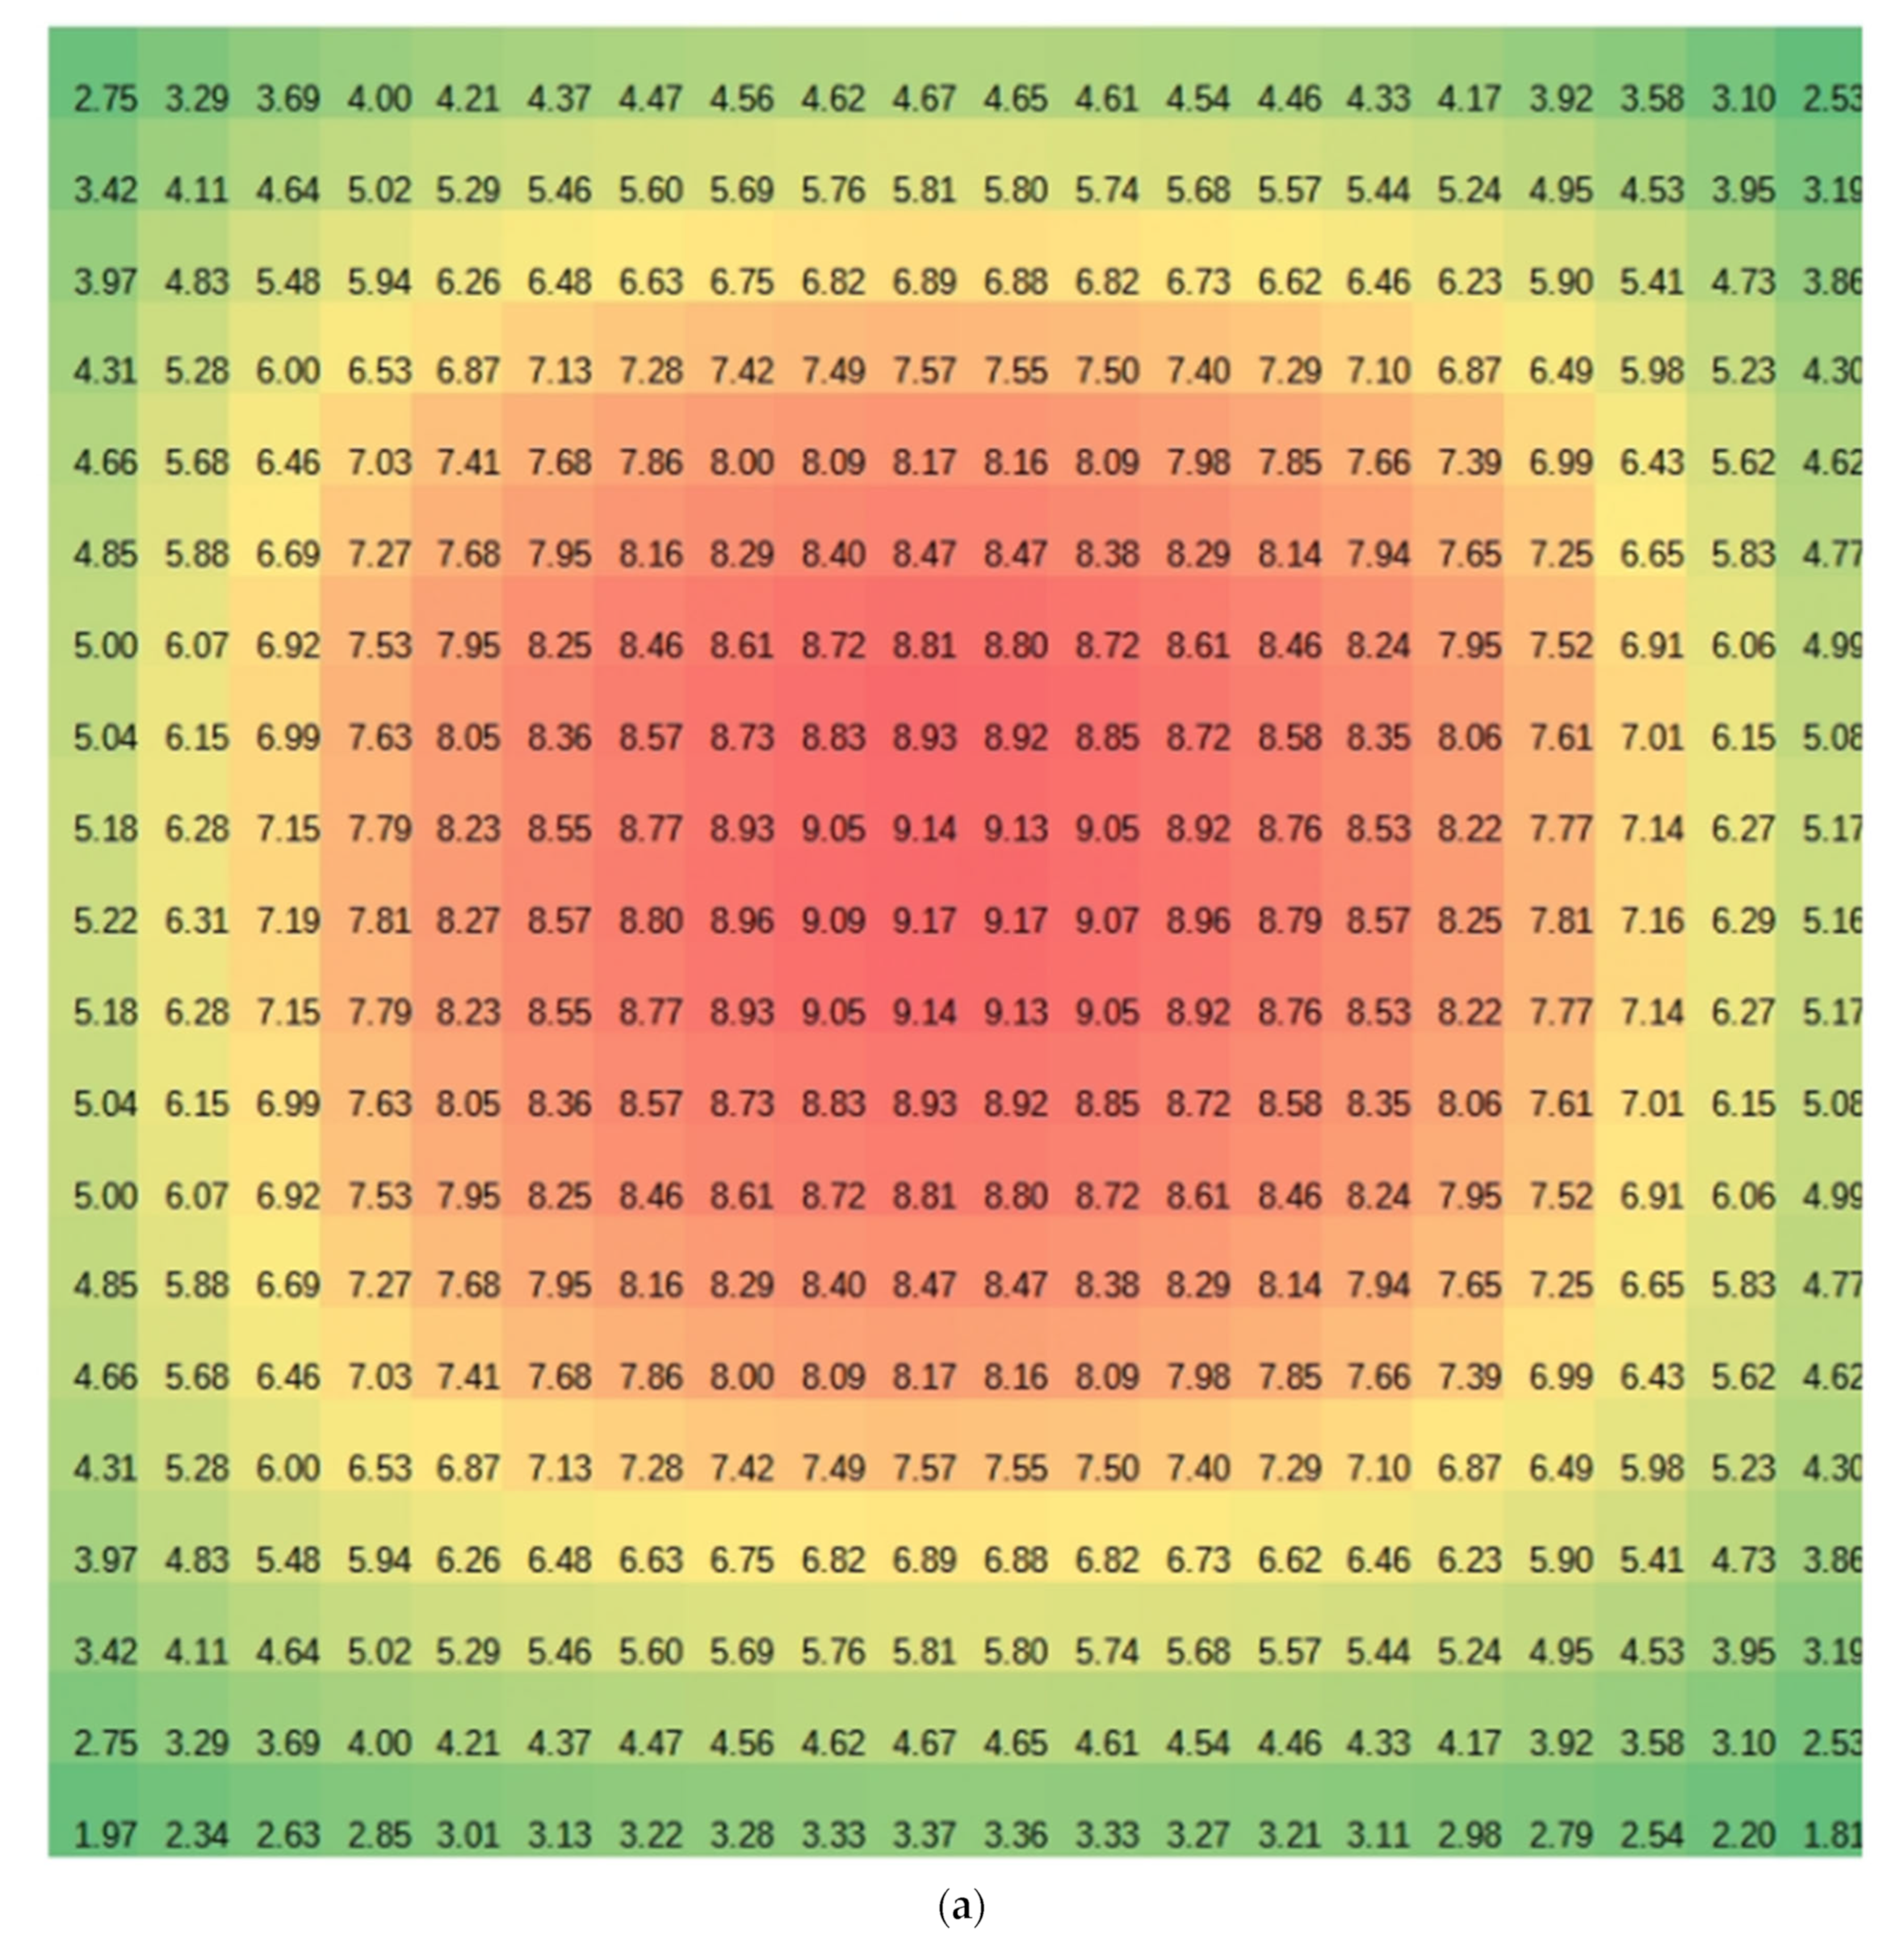
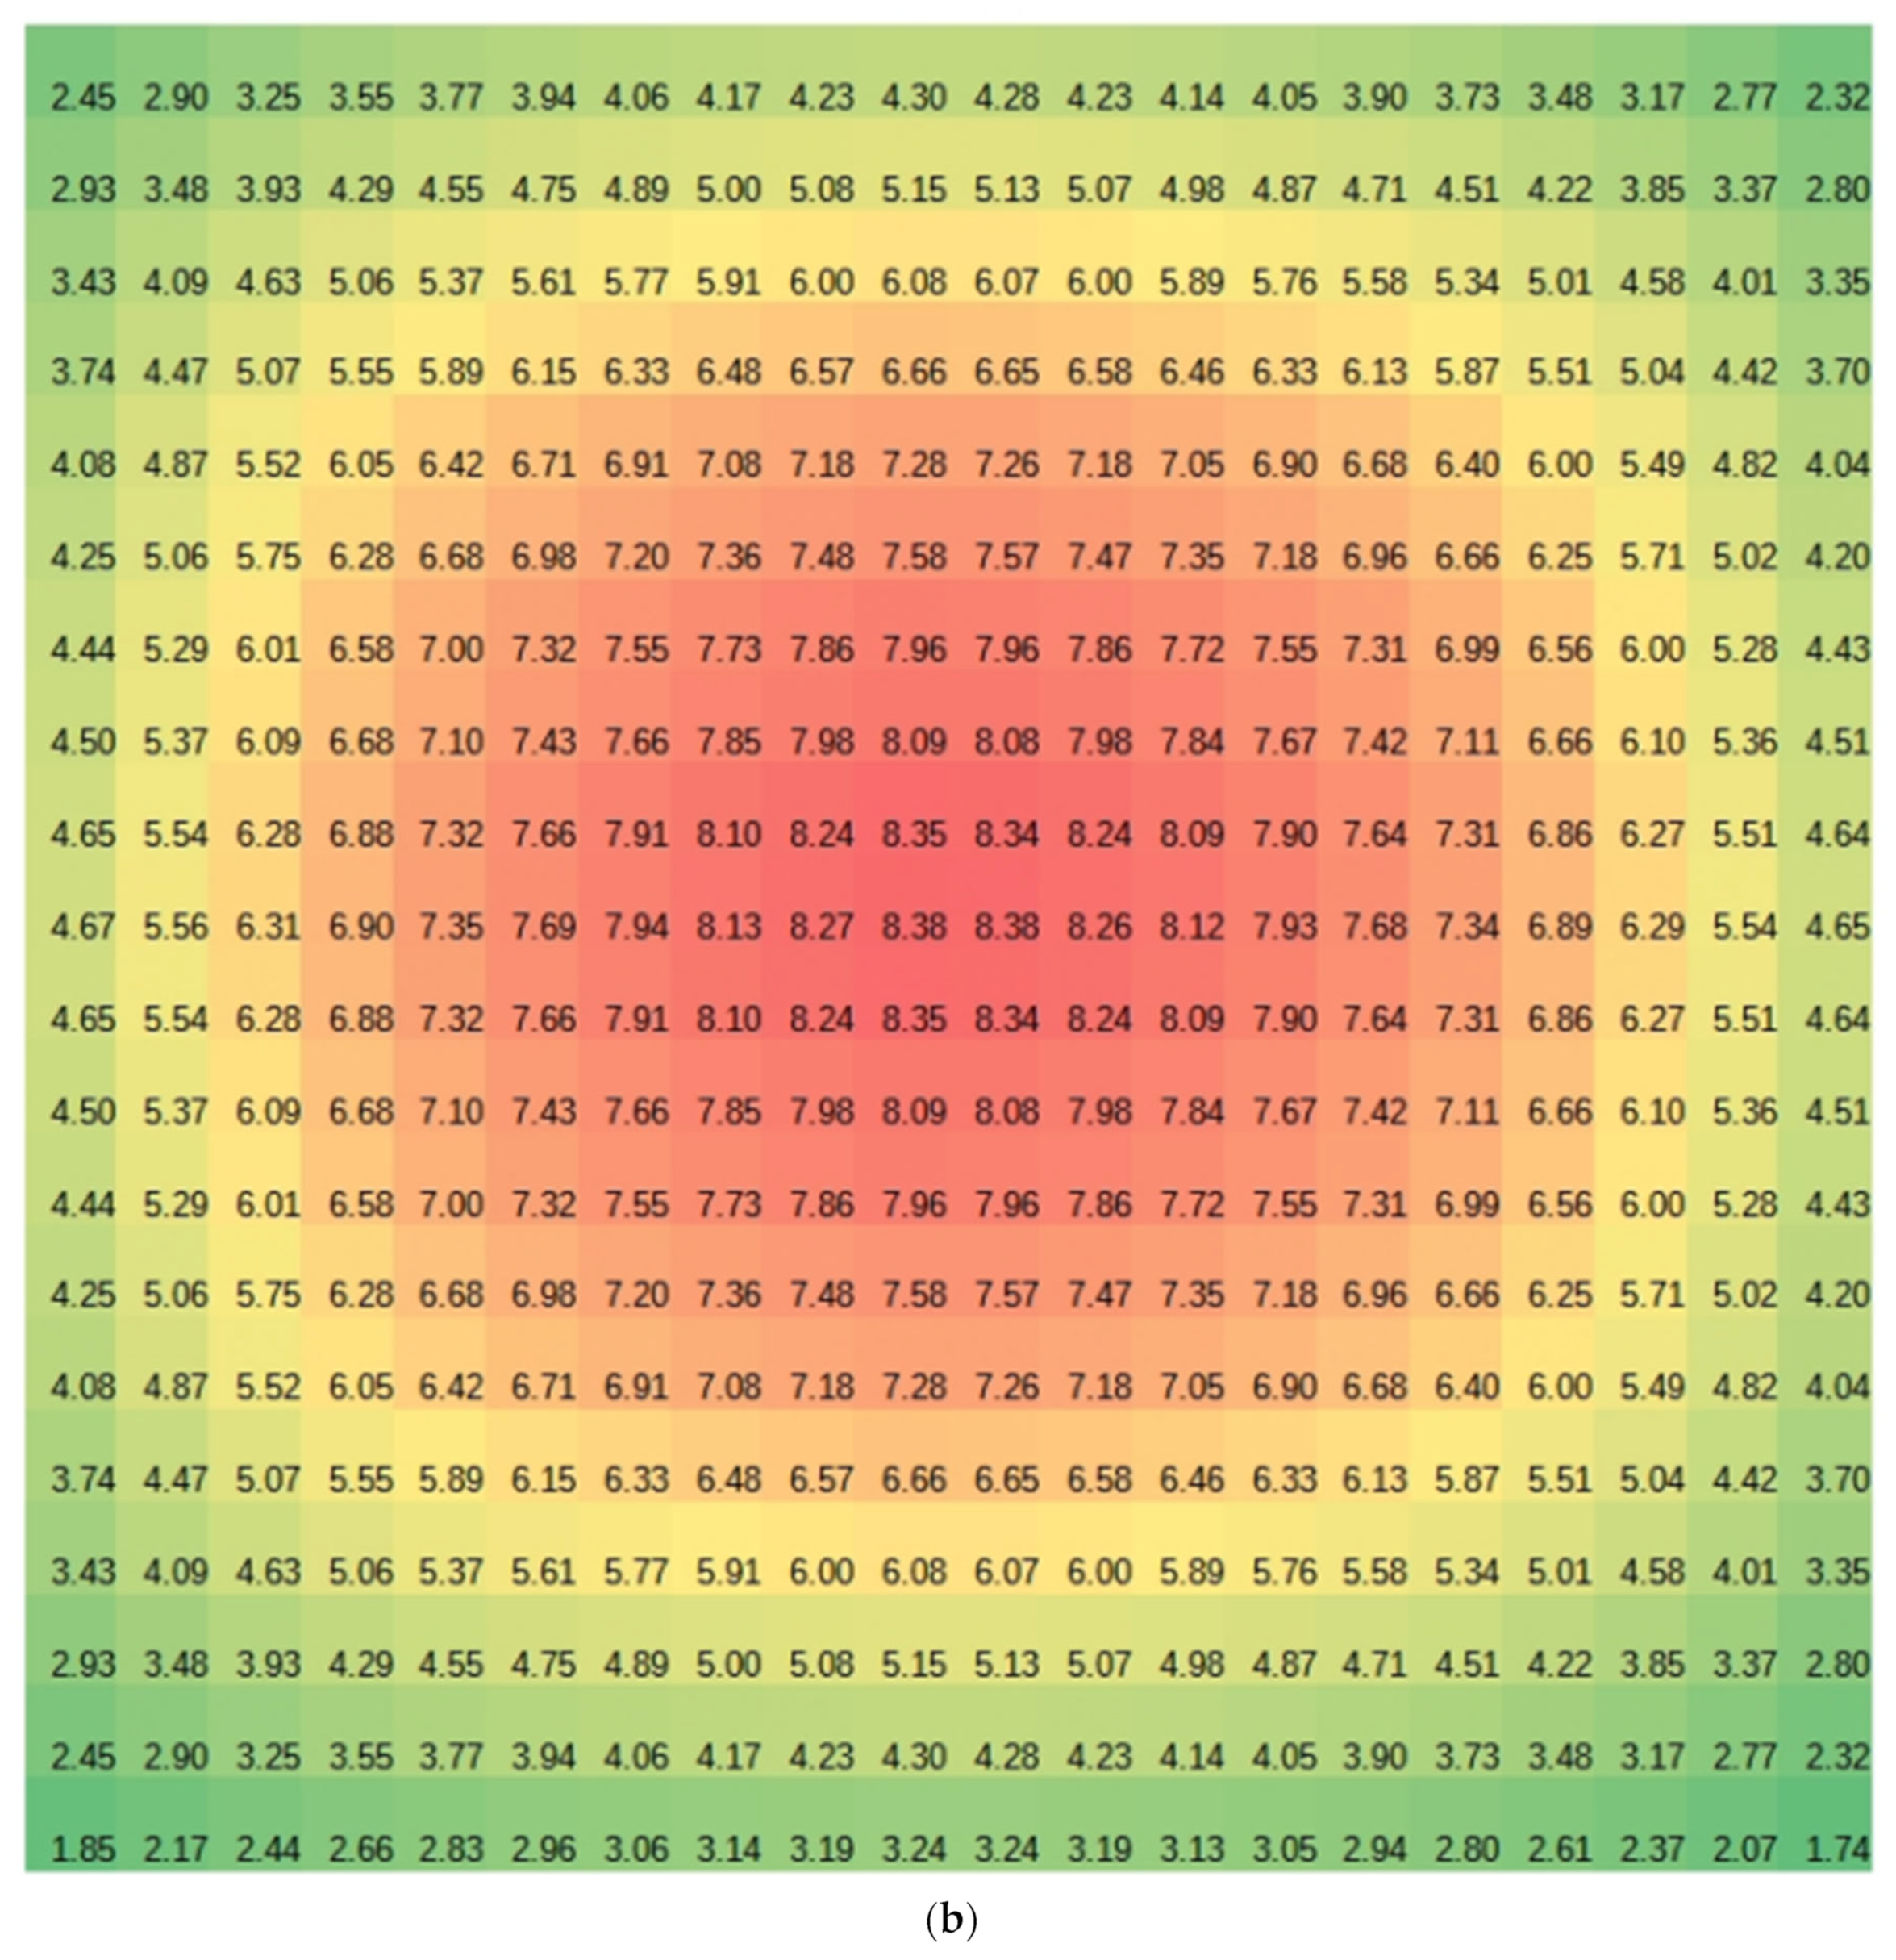
| Distance from Top LED Plate (cm) | Irradiance by Top LED Plate | Irradiance by Bottom LED Plate | Total Irradiance |
|---|---|---|---|
| 1 | 9.82 | 3.52 | 13.34 |
| 2 | 8.38 | 3.98 | 12.36 |
| 3 | 7.34 | 4.48 | 11.82 |
| 4 | 6.47 | 5.06 | 11.53 |
| 5 | 5.72 | 5.72 | 11.44 |
| 6 | 5.06 | 6.47 | 11.53 |
| 7 | 4.48 | 7.34 | 11.82 |
| 8 | 3.98 | 8.38 | 12.36 |
| 9 | 3.52 | 9.82 | 13.34 |
Disclaimer/Publisher’s Note: The statements, opinions and data contained in all publications are solely those of the individual author(s) and contributor(s) and not of MDPI and/or the editor(s). MDPI and/or the editor(s) disclaim responsibility for any injury to people or property resulting from any ideas, methods, instructions or products referred to in the content. |
© 2023 by the authors. Licensee MDPI, Basel, Switzerland. This article is an open access article distributed under the terms and conditions of the Creative Commons Attribution (CC BY) license (https://creativecommons.org/licenses/by/4.0/).
Share and Cite
Kapse, S.; Rahman, D.; Avital, E.J.; Venkatesan, N.; Smith, T.; Cantero-Garcia, L.; Motallebi, F.; Samad, A.; Beggs, C.B. Conceptual Design of a UVC-LED Air Purifier to Reduce Airborne Pathogen Transmission—A Feasibility Study. Fluids 2023, 8, 111. https://doi.org/10.3390/fluids8040111
Kapse S, Rahman D, Avital EJ, Venkatesan N, Smith T, Cantero-Garcia L, Motallebi F, Samad A, Beggs CB. Conceptual Design of a UVC-LED Air Purifier to Reduce Airborne Pathogen Transmission—A Feasibility Study. Fluids. 2023; 8(4):111. https://doi.org/10.3390/fluids8040111
Chicago/Turabian StyleKapse, Saket, Dena Rahman, Eldad J. Avital, Nithya Venkatesan, Taylor Smith, Lidia Cantero-Garcia, Fariborz Motallebi, Abdus Samad, and Clive B. Beggs. 2023. "Conceptual Design of a UVC-LED Air Purifier to Reduce Airborne Pathogen Transmission—A Feasibility Study" Fluids 8, no. 4: 111. https://doi.org/10.3390/fluids8040111