Kinematic and Dynamic Scaling of Copepod Swimming


Abstract
:
1. Introduction
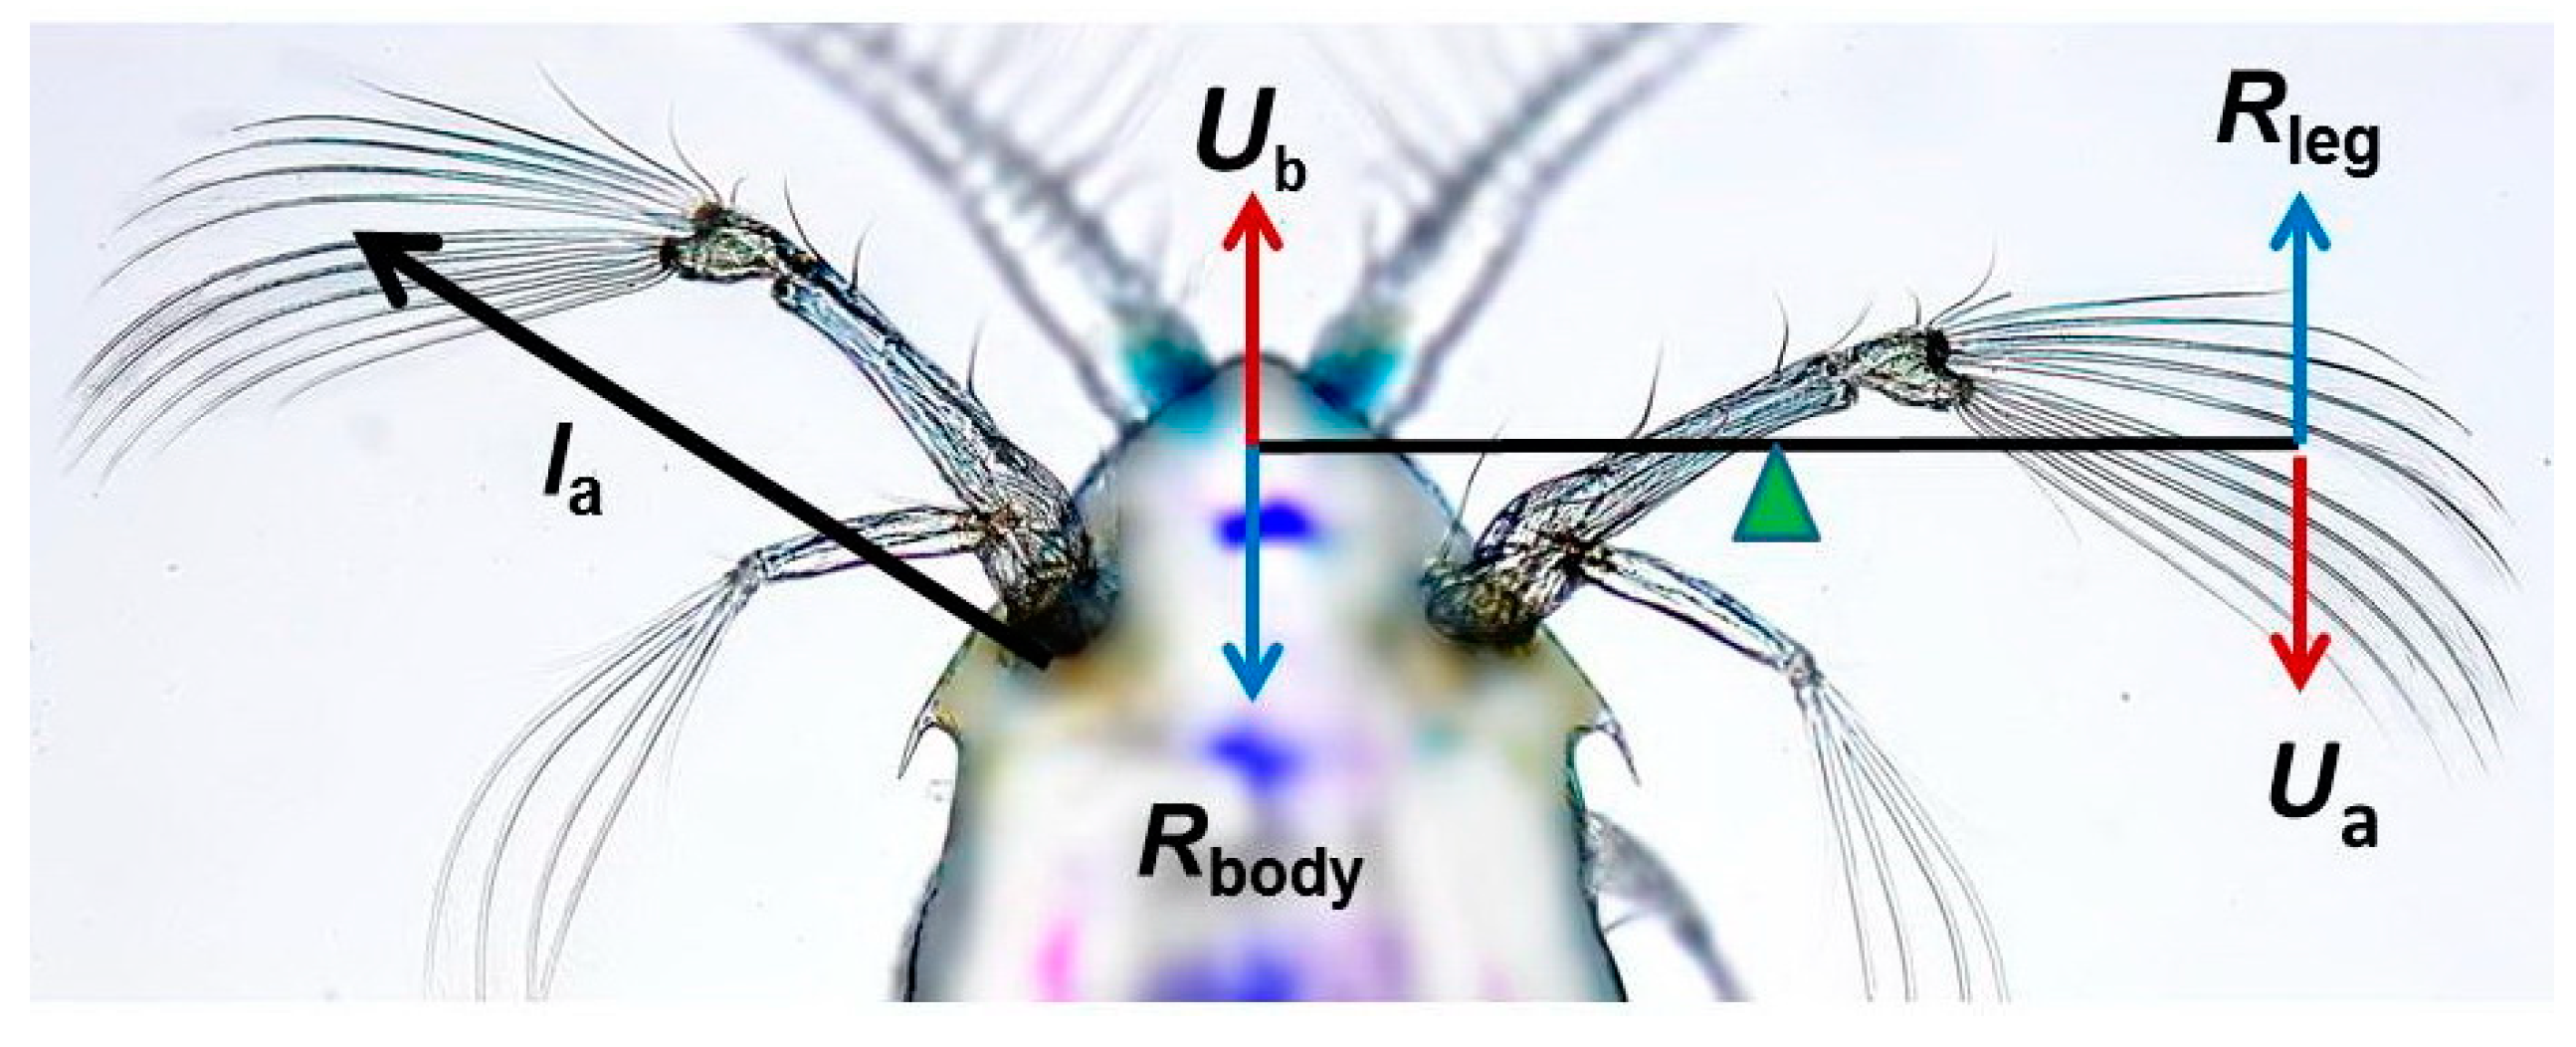
2. Locomotor Function of Appendages
2.1. Cruise Swimming
2.2. Jump Swimming
3. Scaling of Swimming Kinematics
3.1. Cruising of Calanoid Copepods
3.2. Kinematic Analysis of Escape Reaction
3.2.1. Instantaneous and Average Speed of Escape Reaction
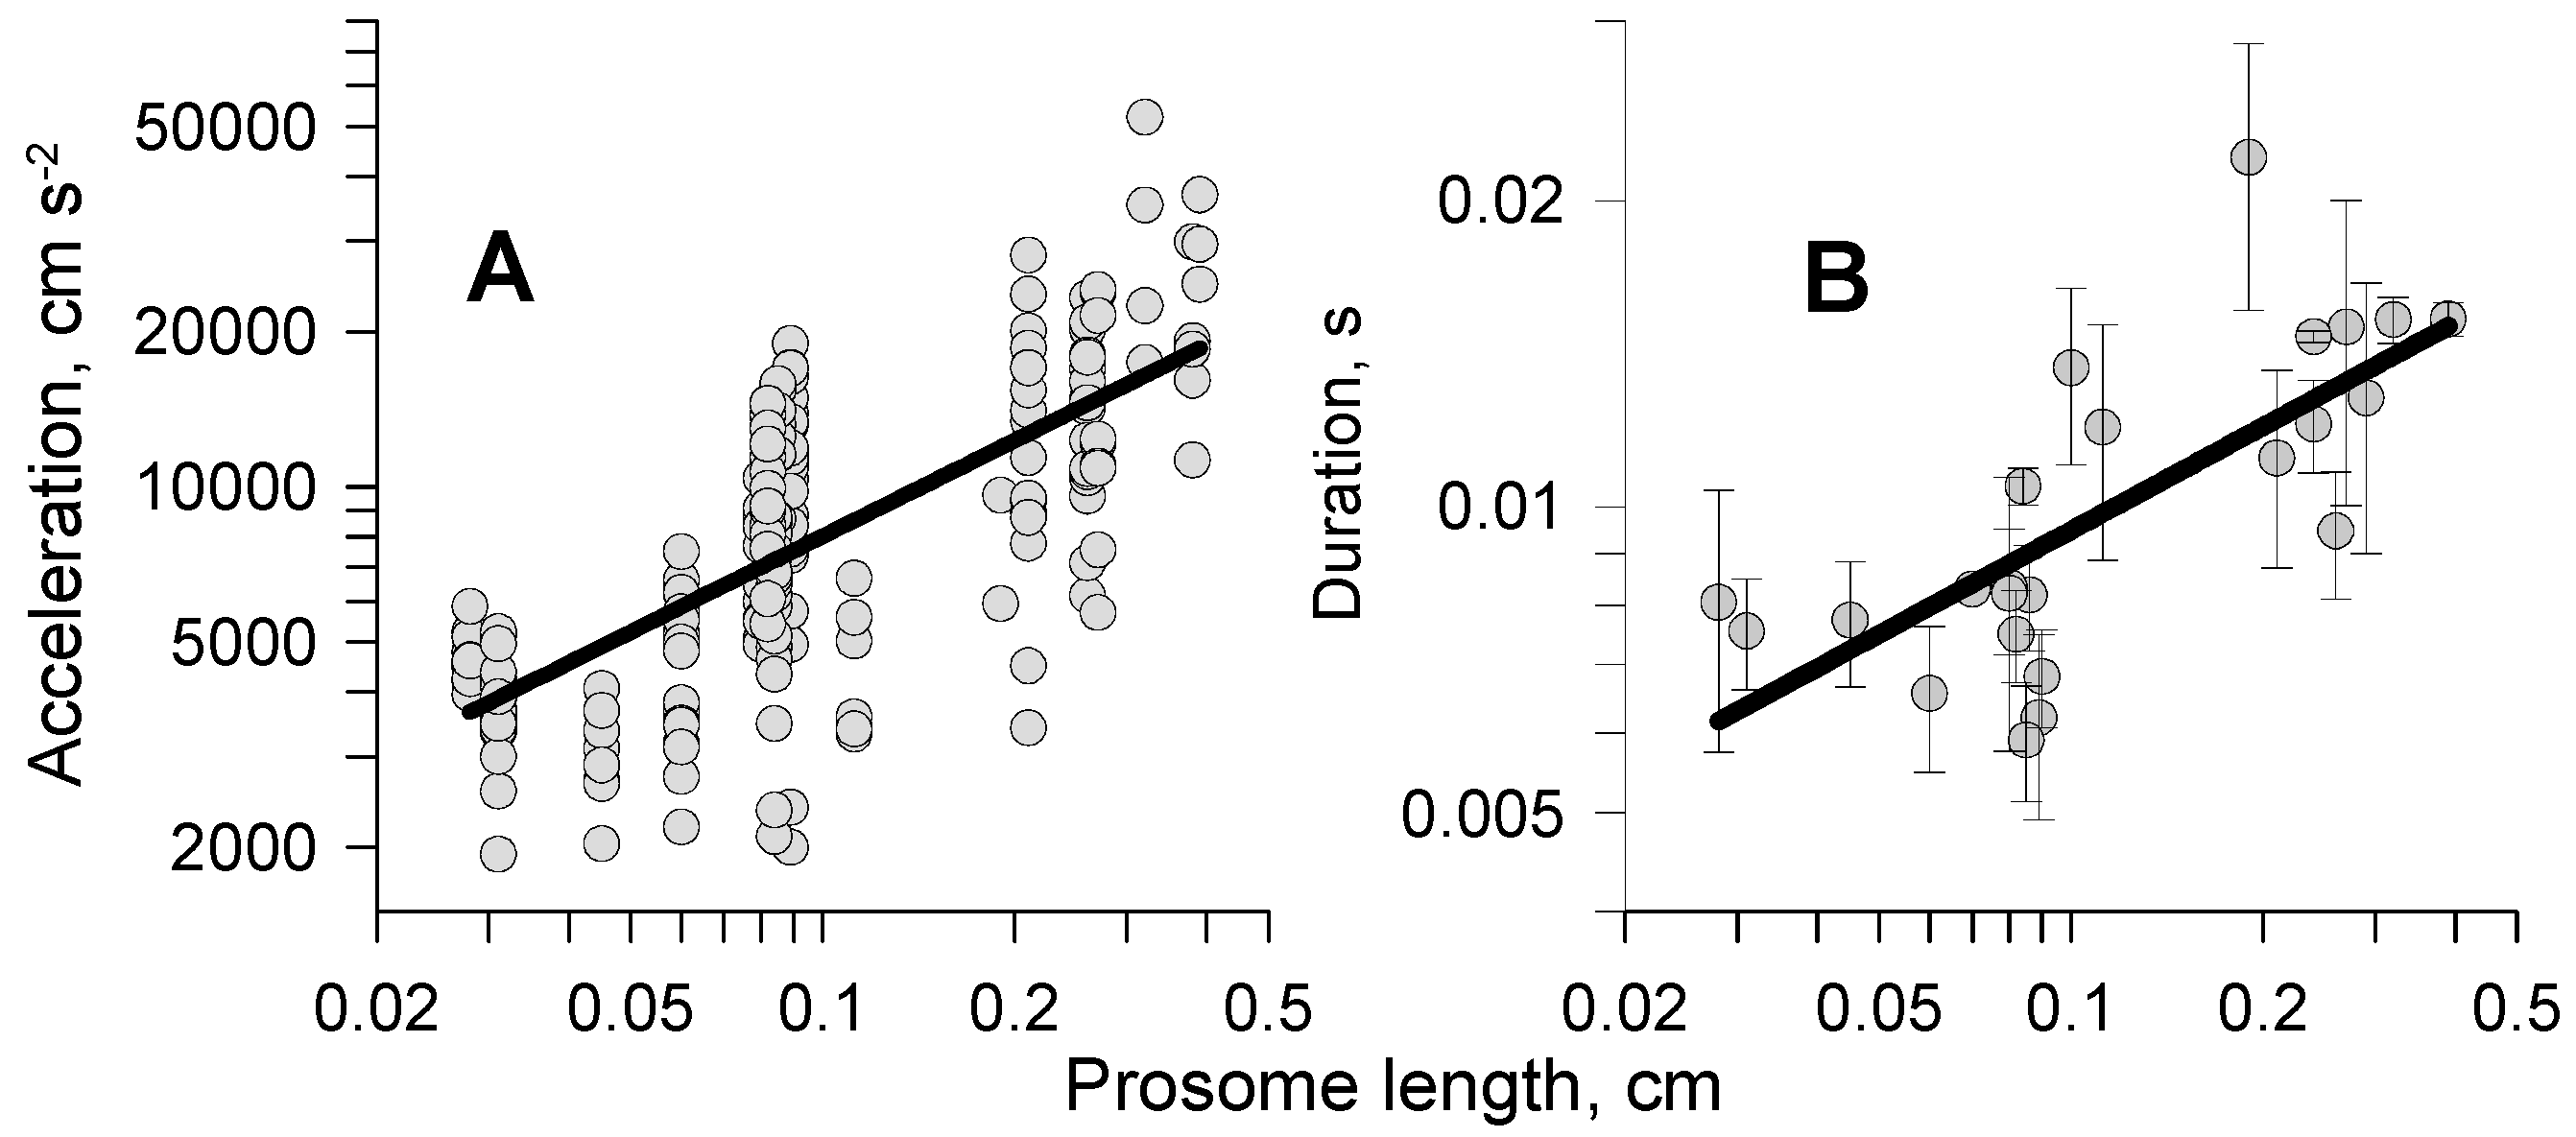
3.2.2. Acceleration and Time Scale Features
3.2.3. Distance of Kicks
4. Force Estimation and Size Scaling
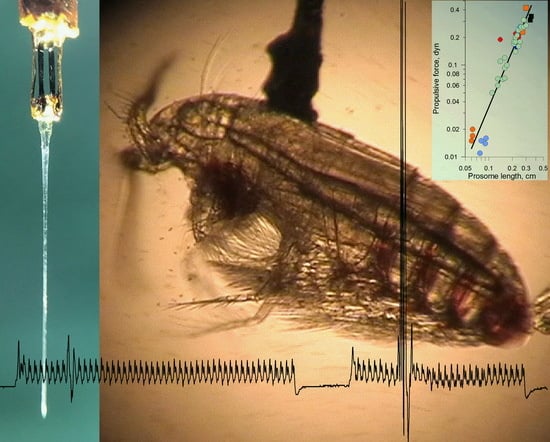
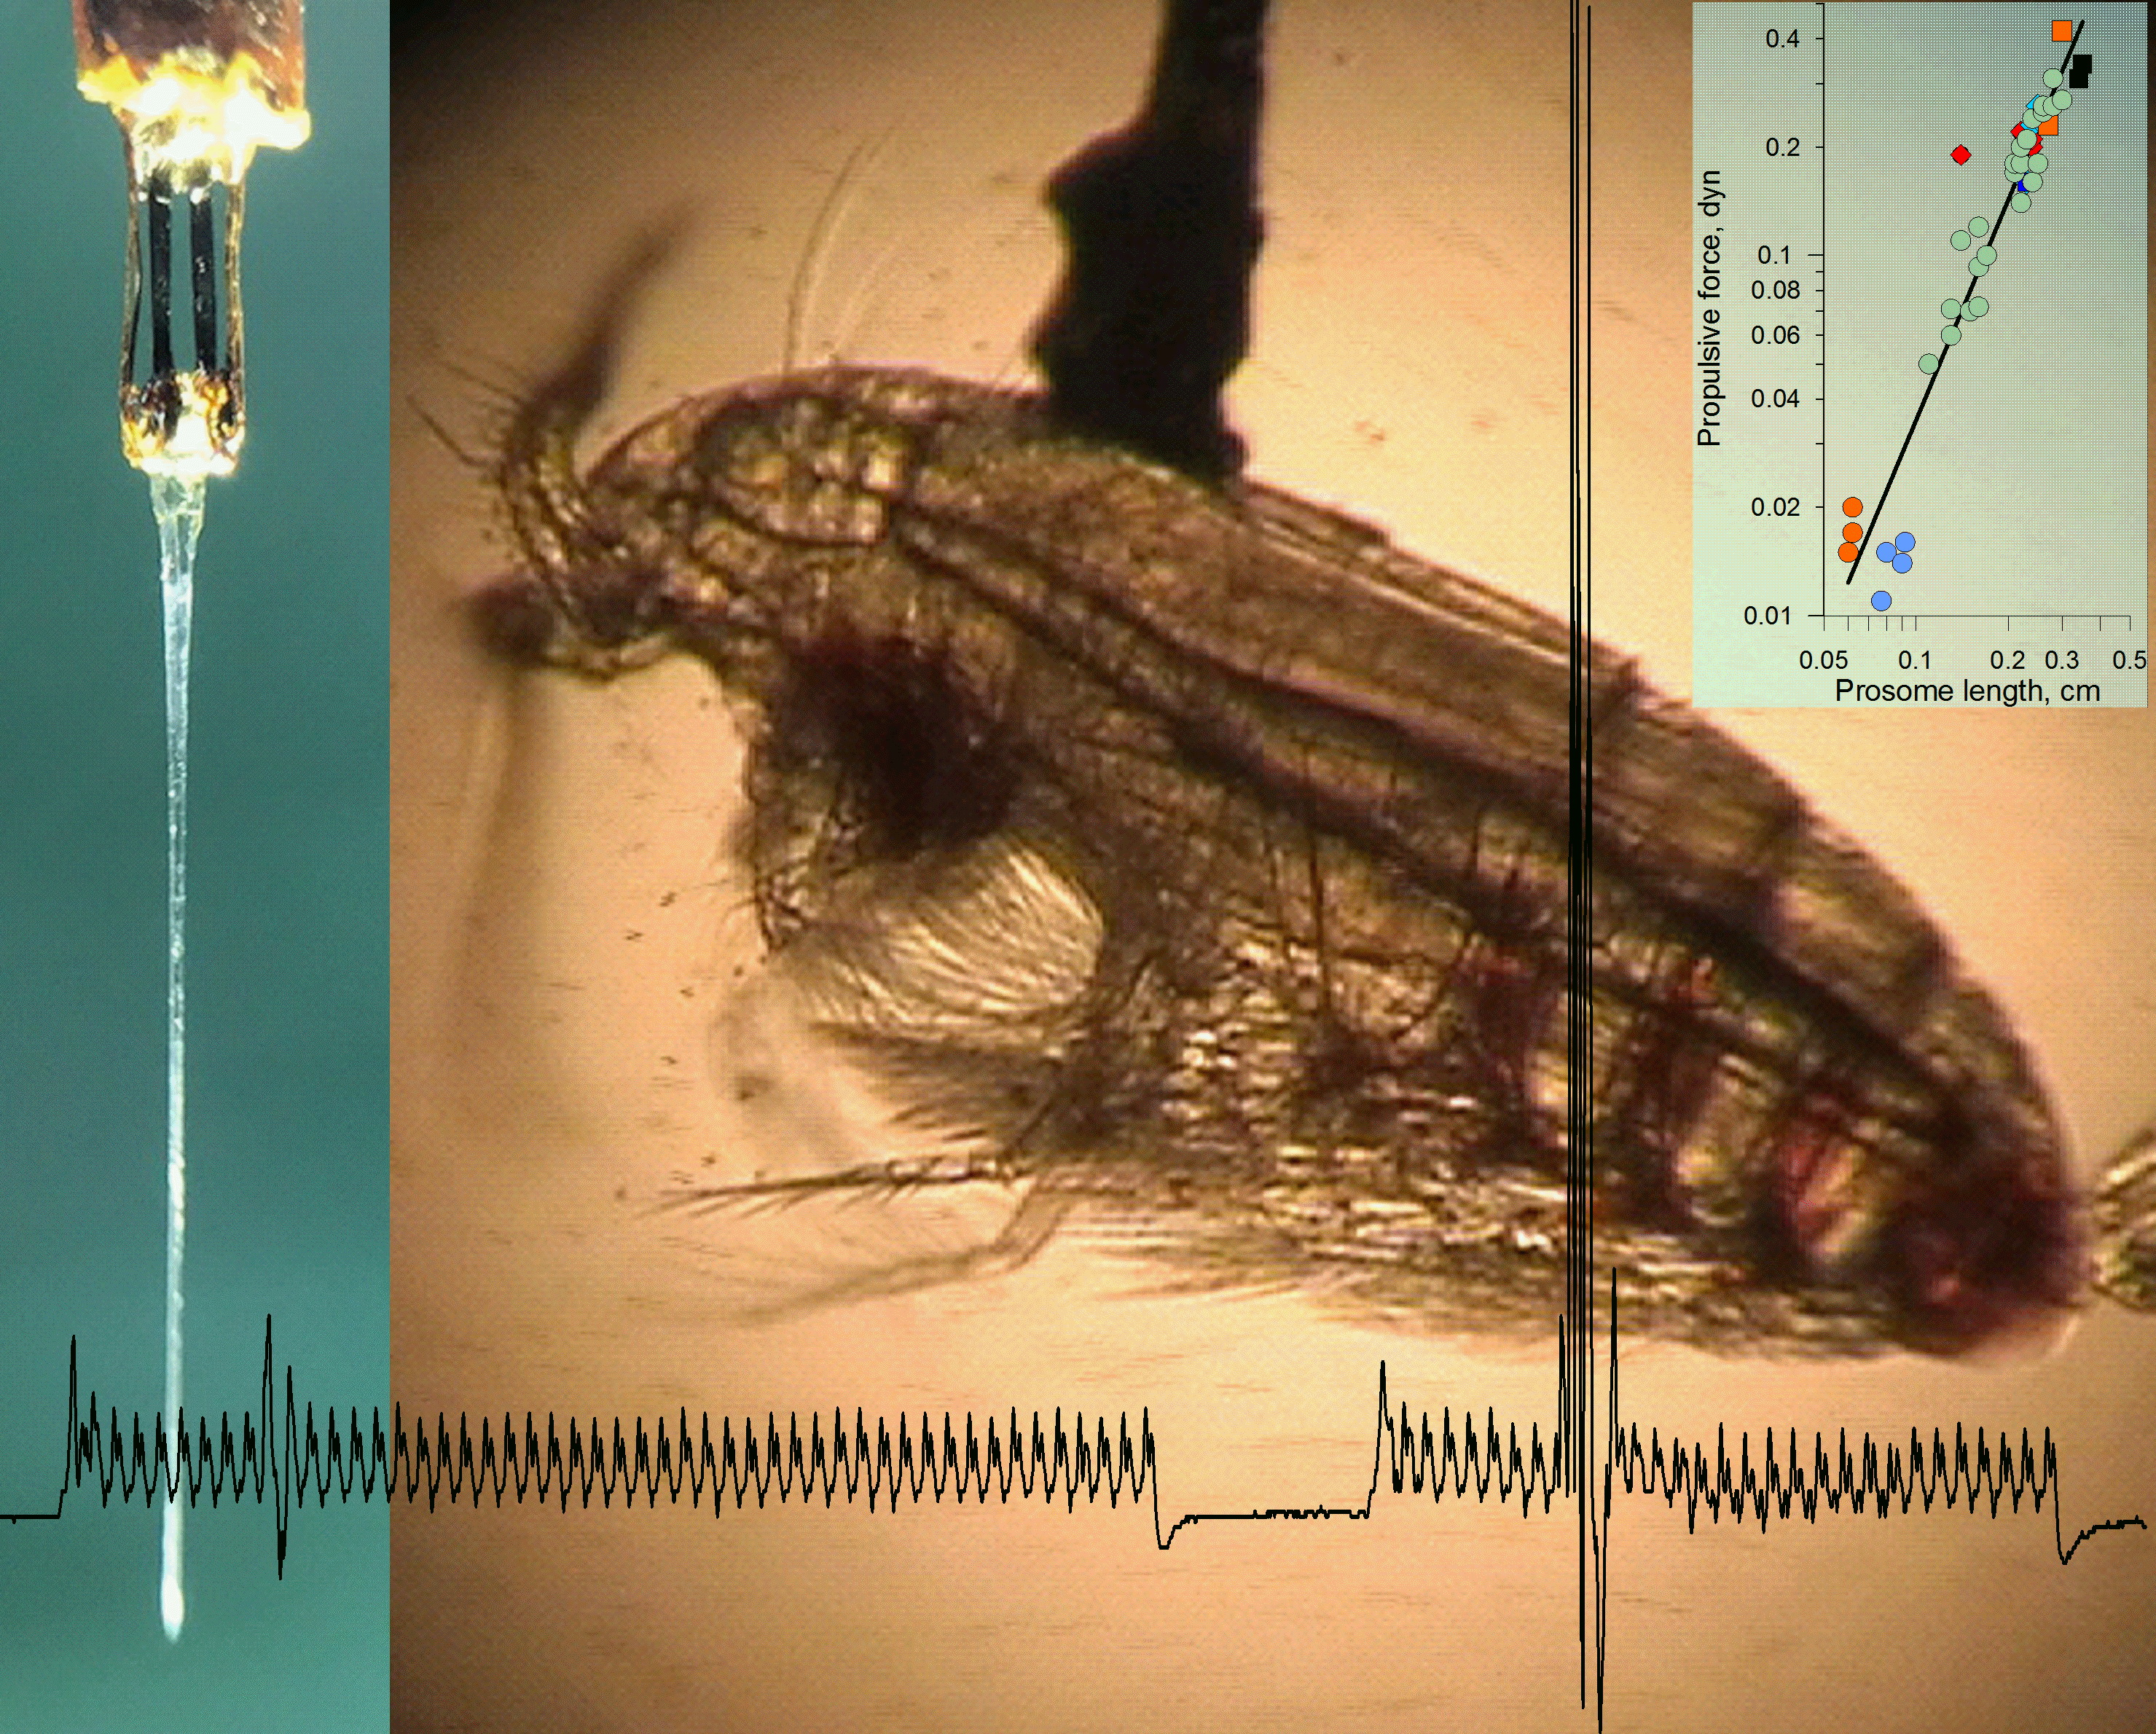
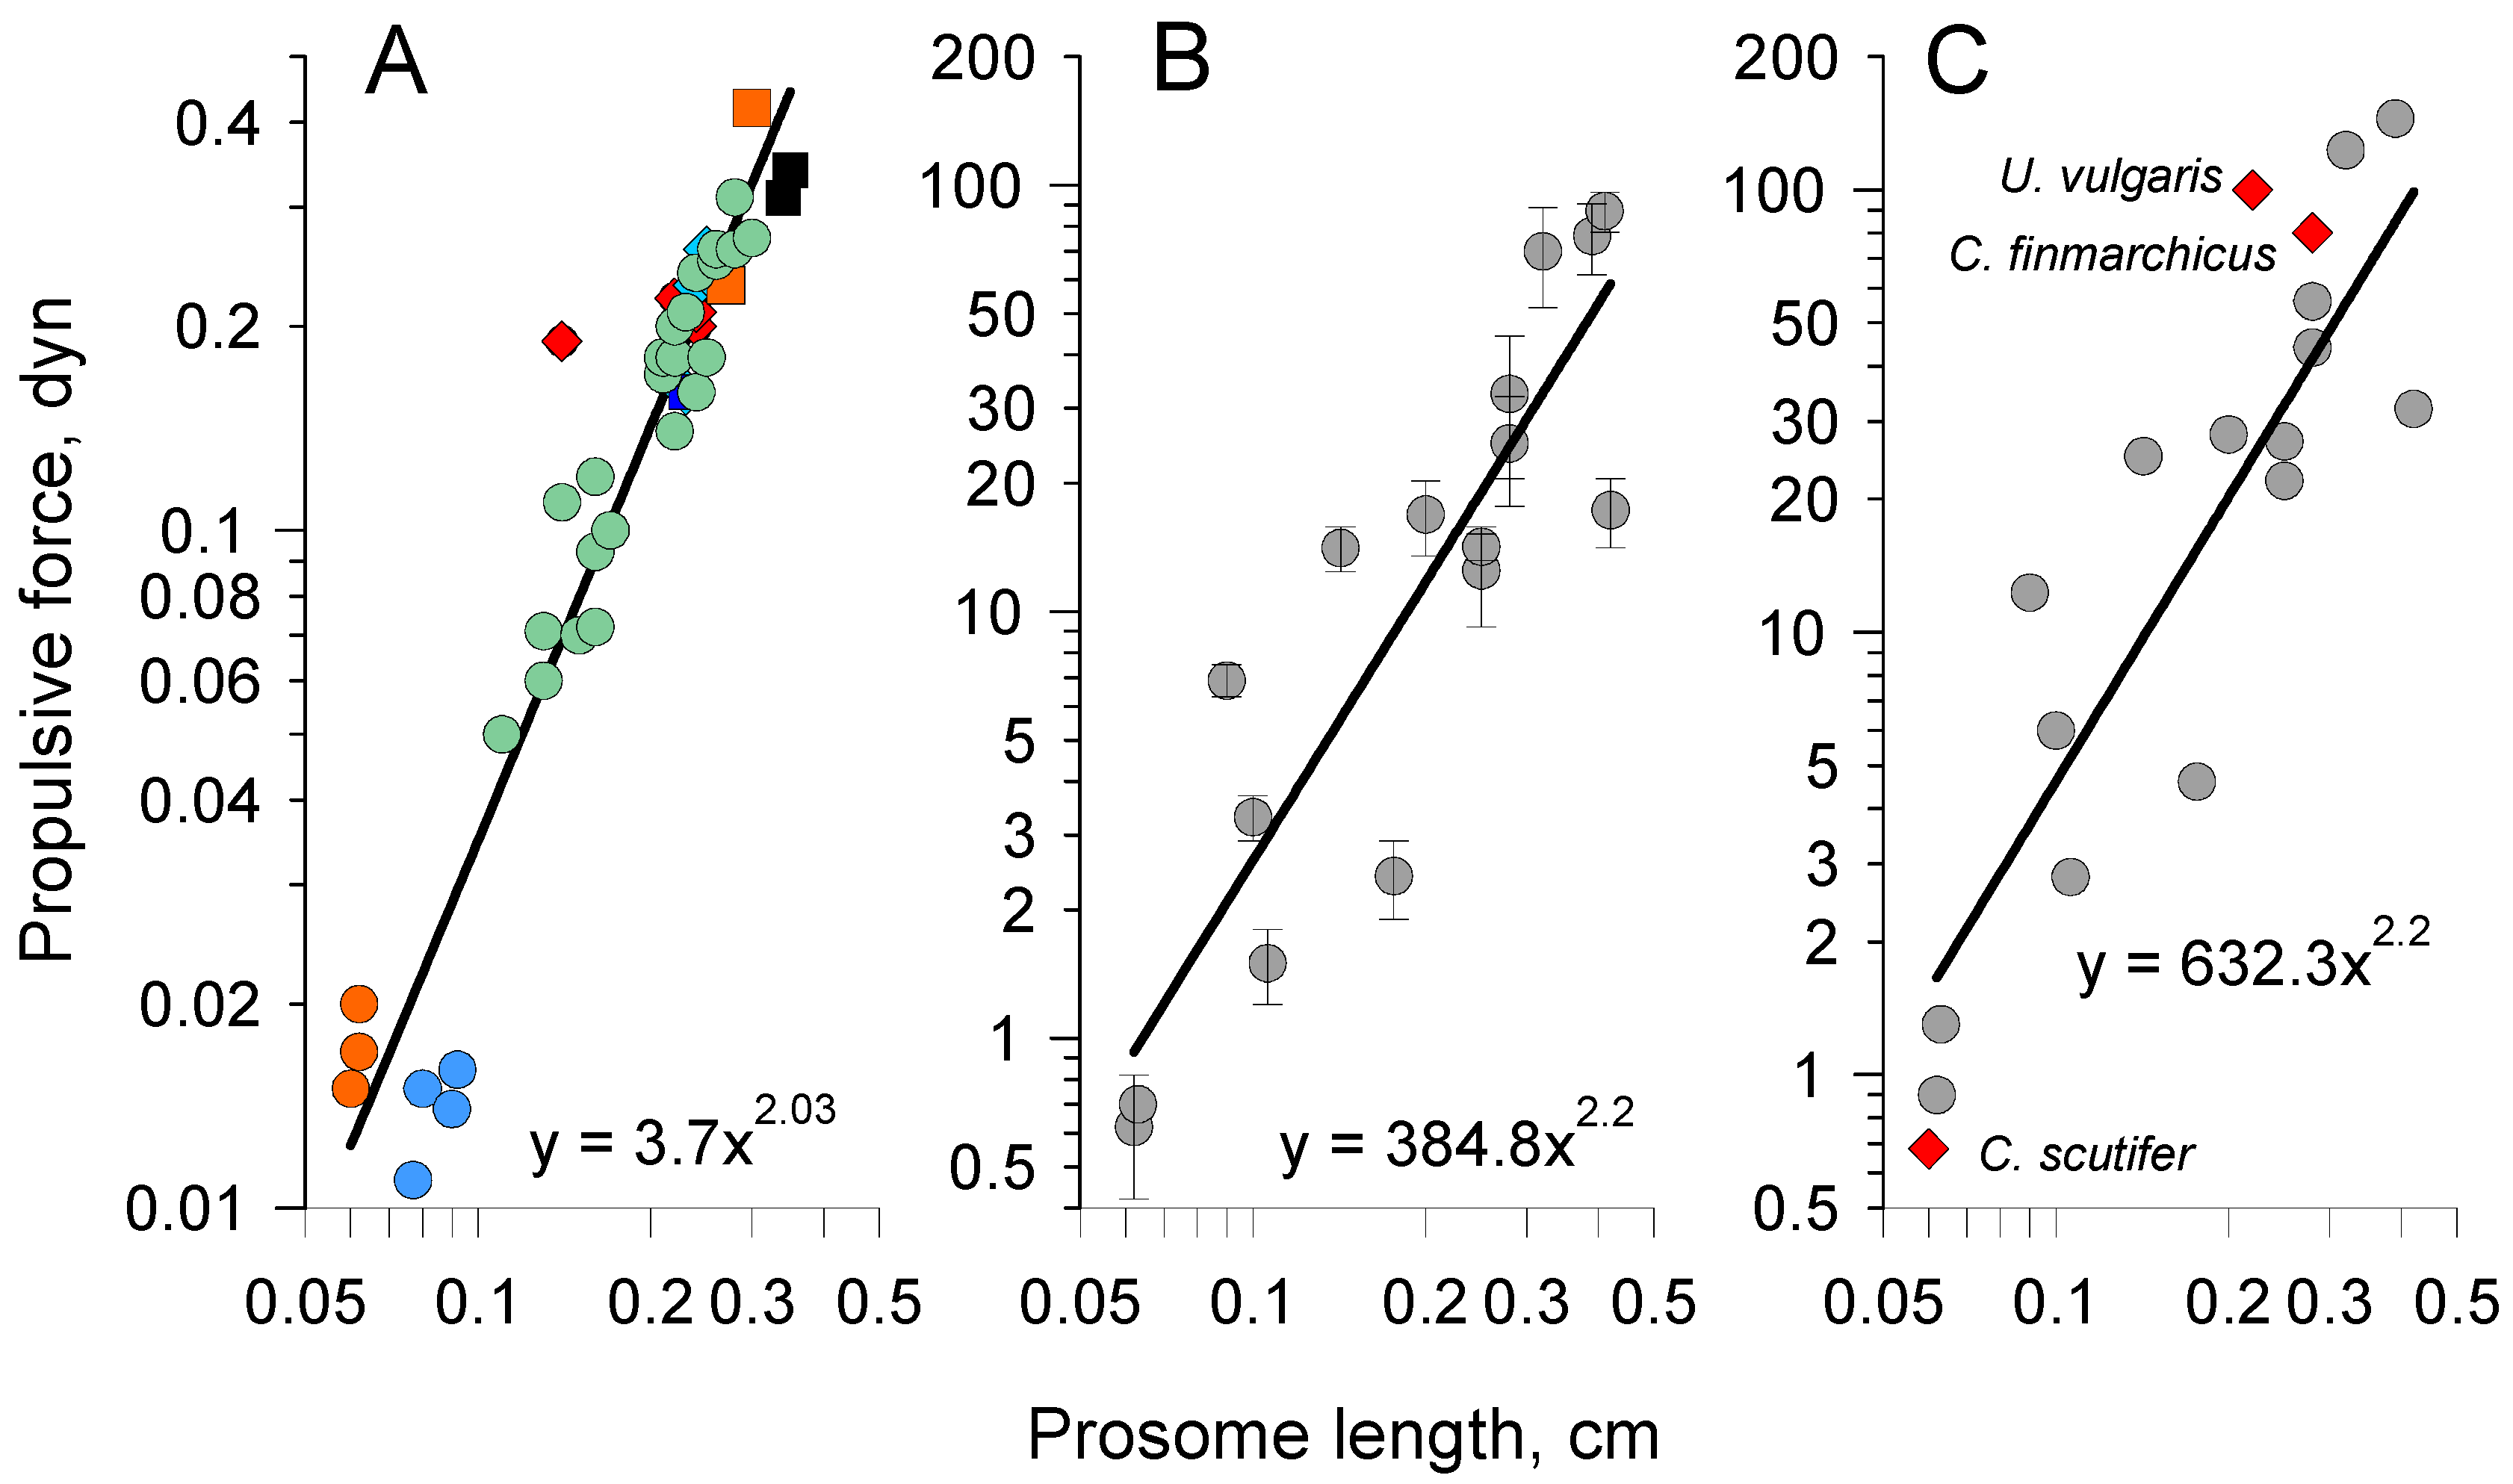
4.1. Force Production in Copepods Tethered to Force Sensor
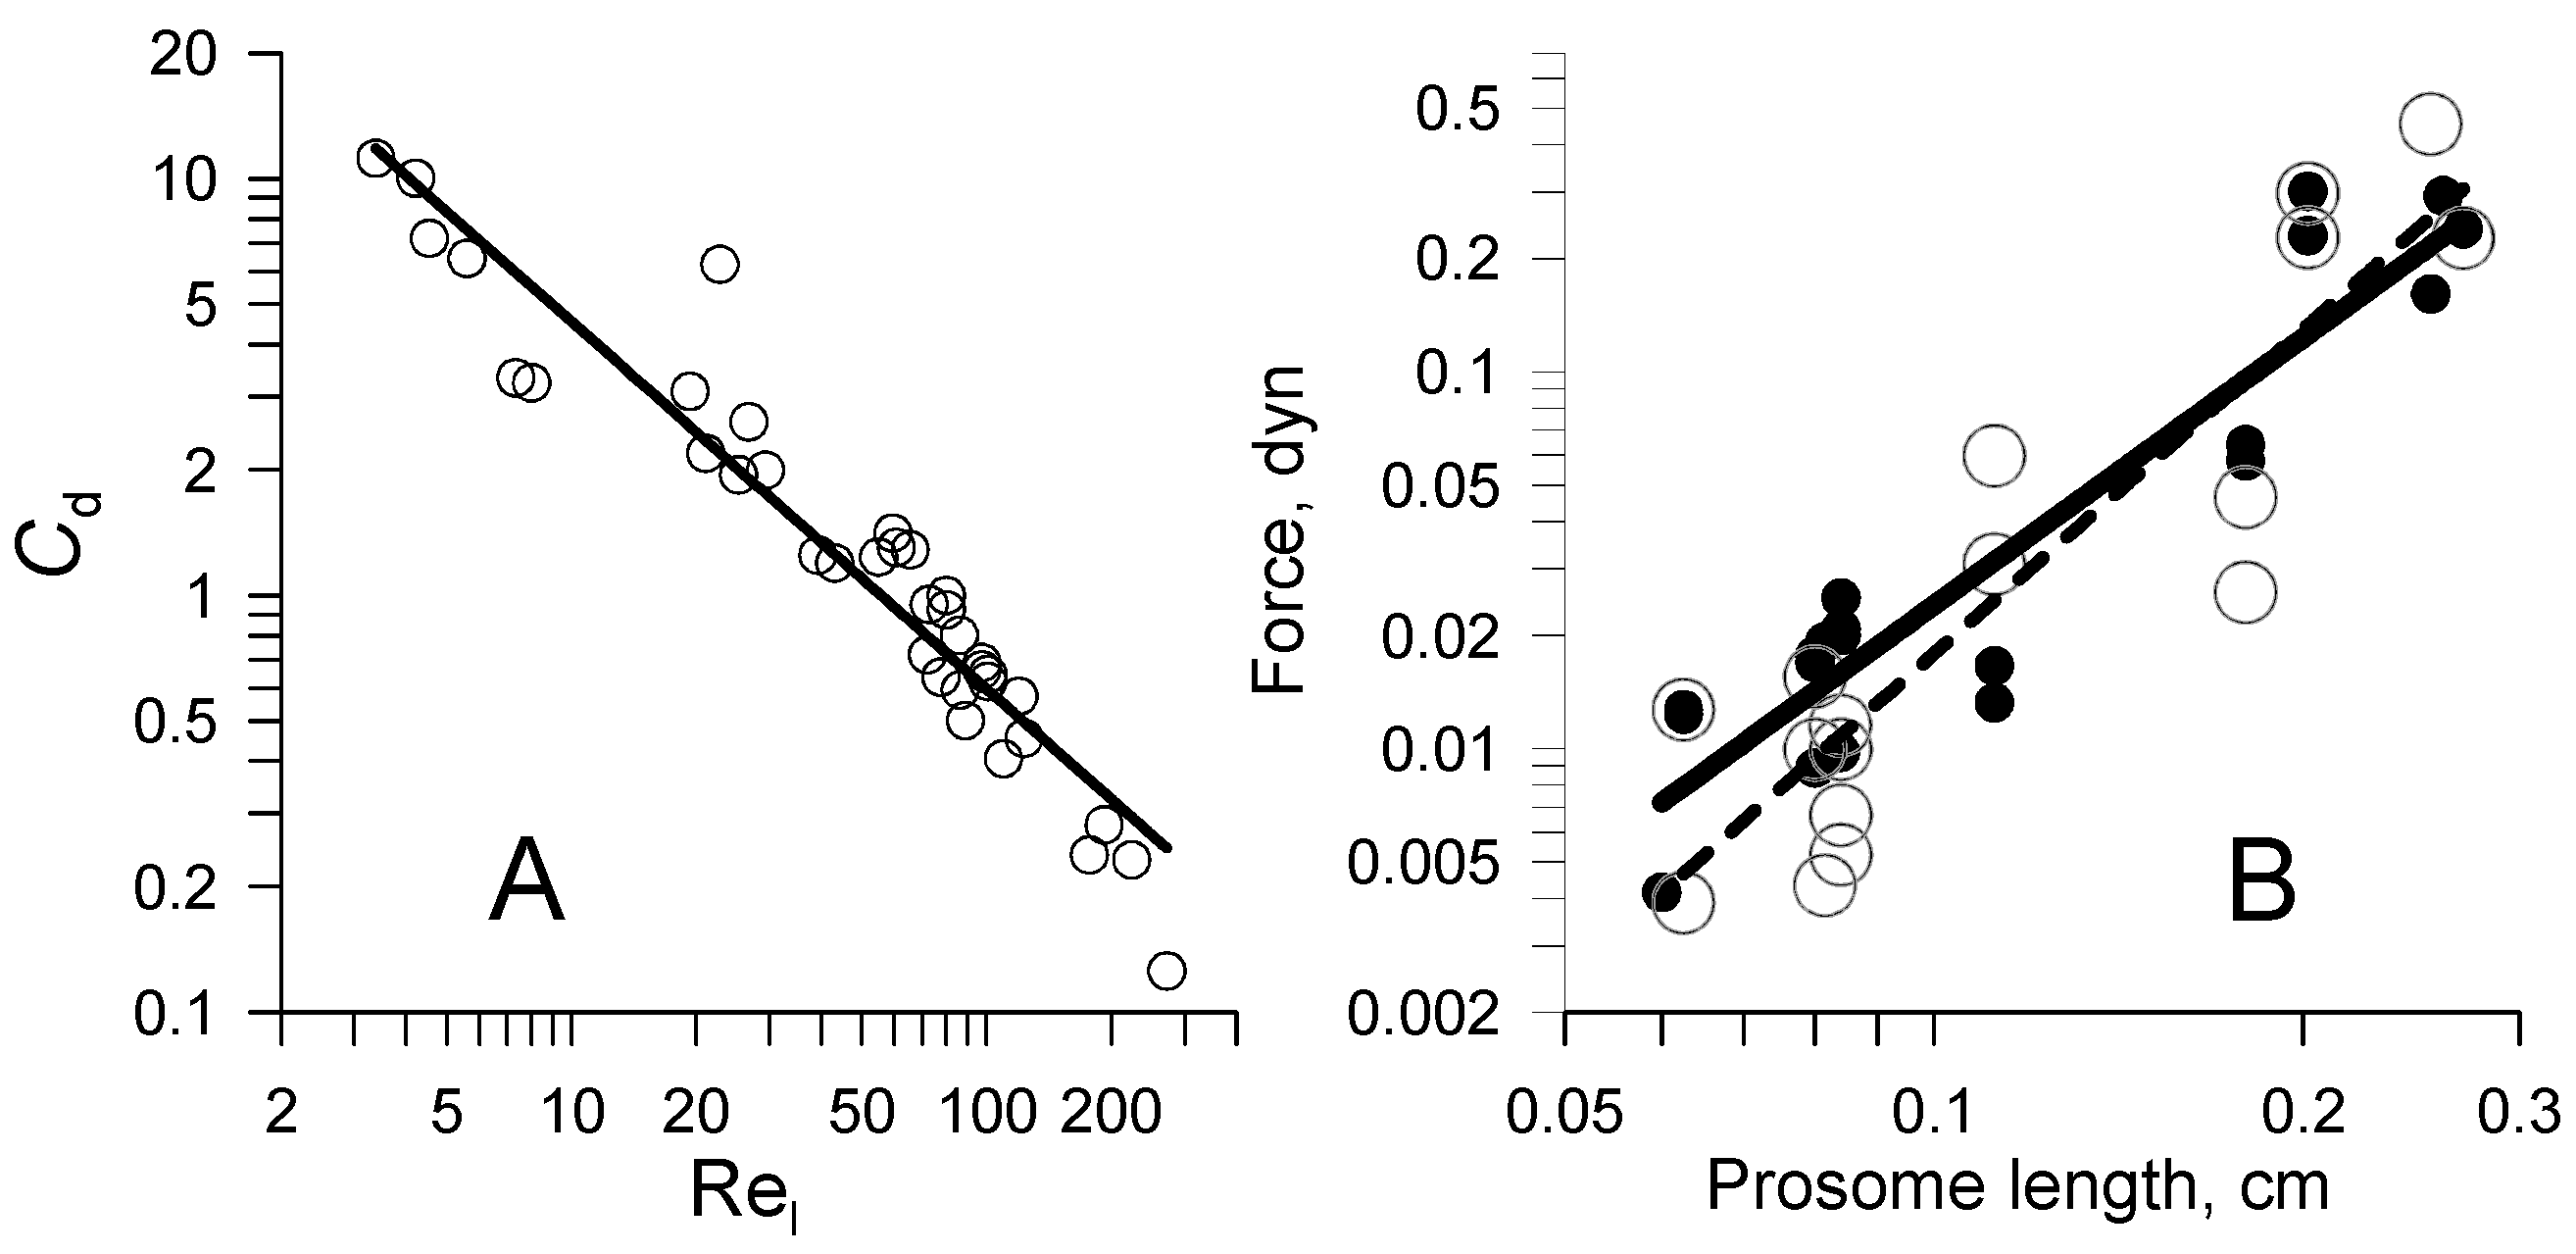
4.2. Drag on Falling Models and Specimens
4.3. Detailed Analytical Model of Cruising Locomotion
4.4. Analytical Model of Escape Reaction
5. Discussion and Conclusions
5.1. Scaling of Kinematic and Mechanical Parameters of Cruising
5.2. Scaling of Kinematic and Mechanical Parameters of Escape Reaction
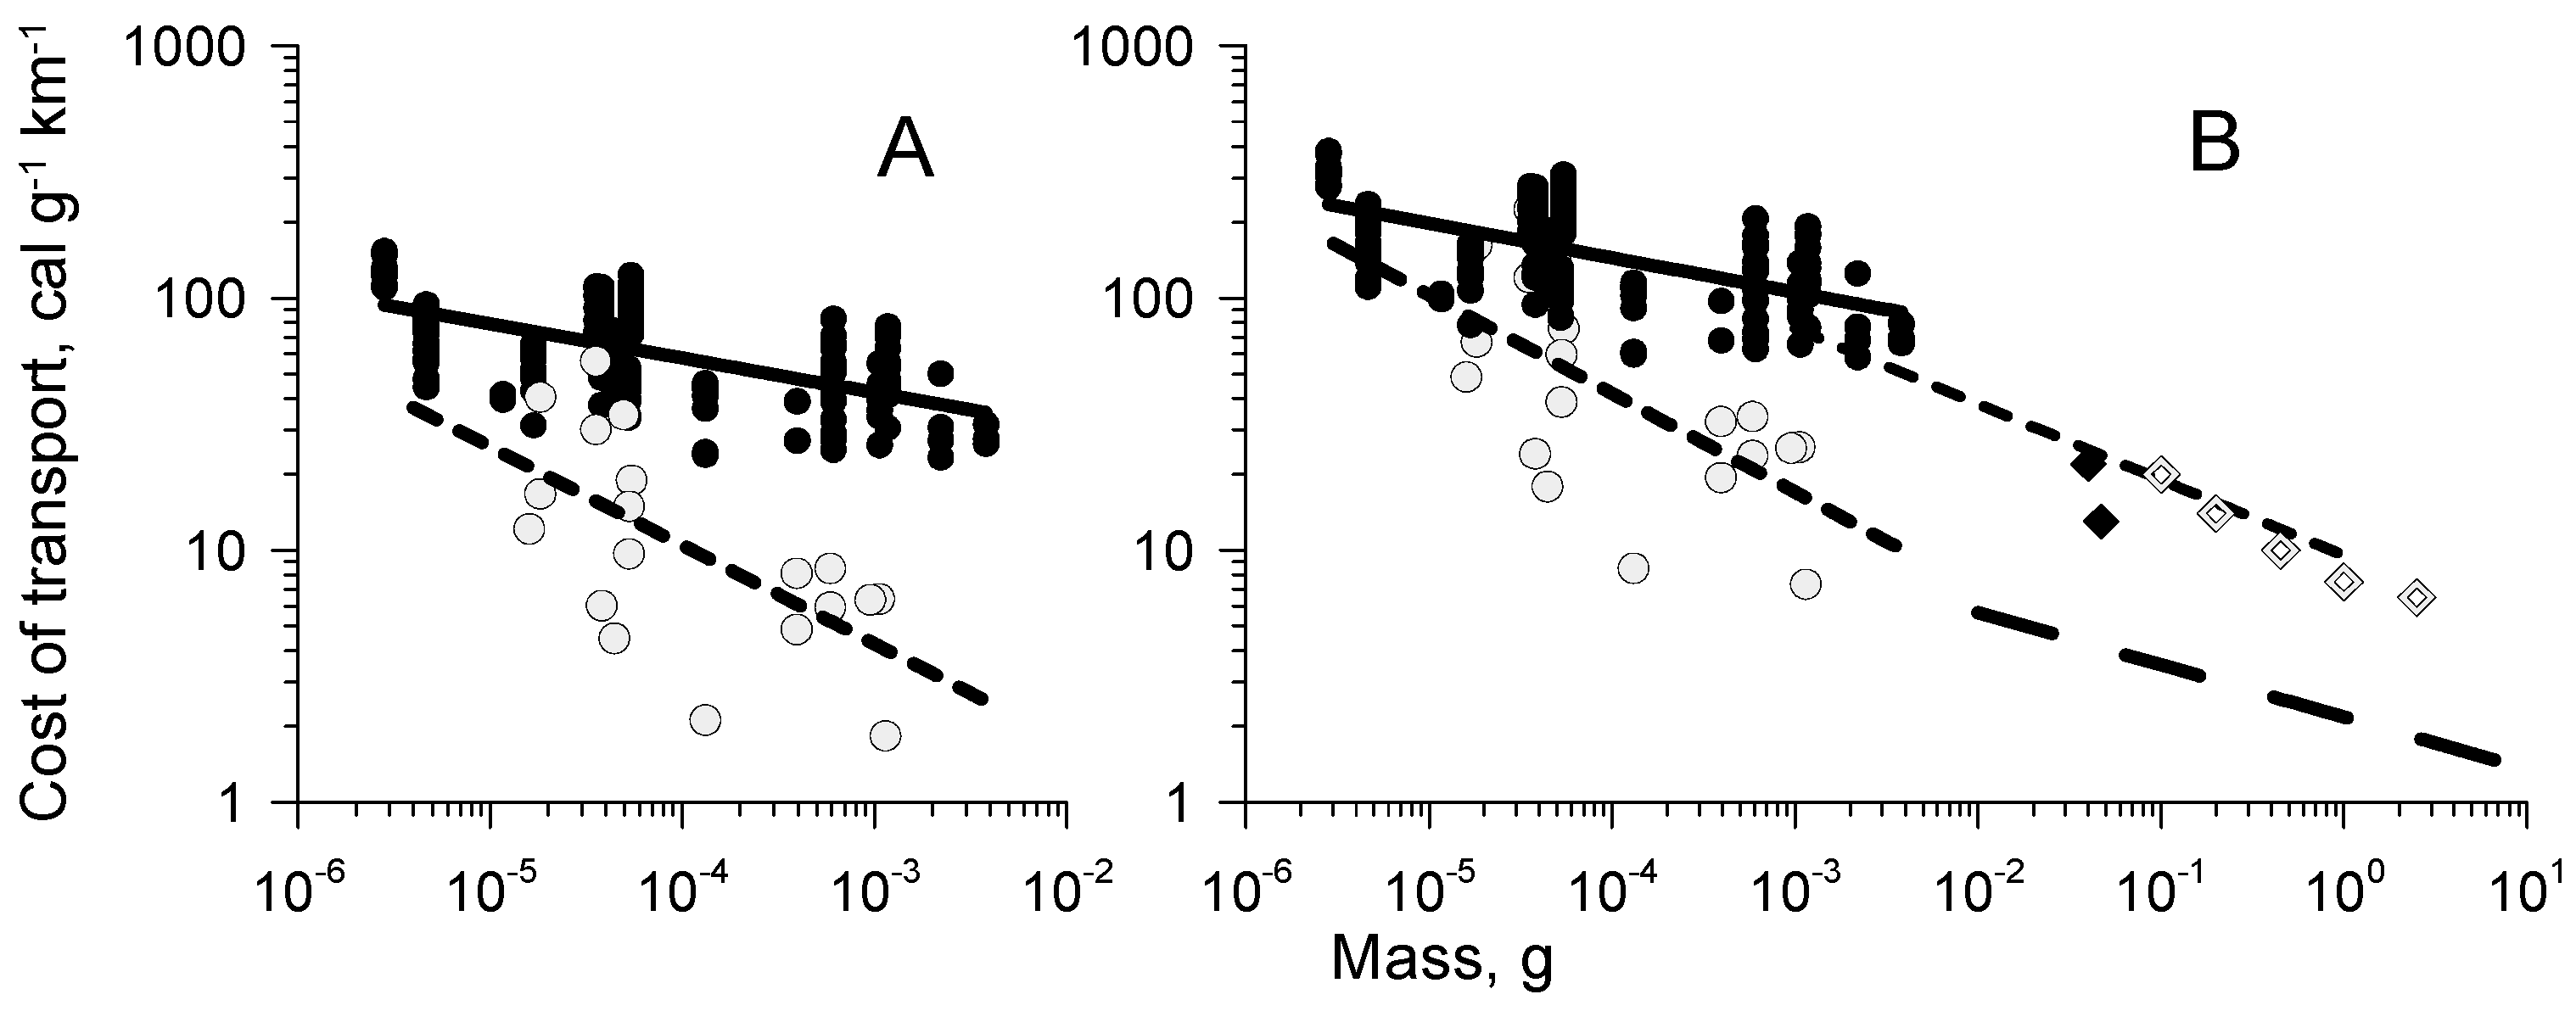
5.3. Cost of Transport during Cruising and Jumping
Supplementary Materials
Author Contributions
Funding
Acknowledgments
Conflicts of Interest
References
- Huys, R.; Boxshall, G.A. The Orders of Copepods. In Copepod Evolution; The Ray Society: London, UK, 1991; p. 159. [Google Scholar]
- Ho, J.-S. Copepod phylogeny: A reconsideration of Huys & Boxshall’s ‘parsimony versus homology’. Hydrobiologia 1994, 292–293, 31–39. [Google Scholar]
- Cannon, H.G. On the feeding mechanism of the copepods Calanus finmarchicus and Diaptomus gracialis. Br. J. Exp. Biol. 1928, 6, 131–144. [Google Scholar]
- Storch, O.; Pfisterer, O. Der Fangapparat von Diaptomus. J. Comp. Physiol. A 1925, 3, 330–376. [Google Scholar] [CrossRef]
- Lowndes, A.G. The swimming and feeding of certain calanoid copepods. Proc. Zool. Soc. Lond. 1935, 3, 687–715. [Google Scholar] [CrossRef]
- Gauld, D.T. The swimming and feeding of planktonic copepods. In Some Contemporary Studies in Marine Science; Barnes, H., Ed.; Allen and Unwin: London, UK, 1966; pp. 313–333. [Google Scholar]
- Petipa, T.S. Idem. In Trophodynamics of Copepods in Marine Plankton Communities; “Nauk. Dumka” Press: Kiev, Ukraine, 1981; p. 241. [Google Scholar]
- Koehl, M.A.R.; Strickler, J.R. Copepod feeding currents: Food capture at low Reynolds number. Limnol. Oceanogr. 1981, 26, 1061–1073. [Google Scholar] [CrossRef] [Green Version]
- Price, H.J.; Paffenhofer, G.-A. Capture of small cells by the copepod Eucalanus elongatus. Limnol. Oceanogr. 1986, 31, 189–194. [Google Scholar] [CrossRef]
- Svetlichny, L.S. Filming, tensometry and energy estimation of swimming by mouth appendages in Calanus helgolandicus (Crustacea, Copepoda). Zool. J. 1991, 70, 23–29. (In Russian) [Google Scholar]
- Rosenberg, G.G. Filmed observations of filter feeding in the marine plankton copepod Acartia clausii. Lirnnol. Oceanogr. 1980, 25, 738–742. [Google Scholar]
- Svetlichny, L.S. Locomotor function of mouth appendages in copepods: Its kinematics. Ekol. Morya 1993, 44, 84–91. (In Russian) [Google Scholar]
- Borg, C.M.A.; Bruno, E.; Kiørboe, T. The Kinematics of Swimming and Relocation Jumps in Copepod Nauplii. PLoS ONE 2012, 7, e47486. [Google Scholar] [CrossRef] [Green Version]
- Storch, O. Die Schwimmbewegung der Copepoden, auf Grund von Mikro-Zeitlupenaufnahmen analysiert. Verh Dtsch Zool Ges 1929, 4, 118–129. [Google Scholar]
- Strickler, J.R.; Bal, A.K. Setae of the first antennae of the copepod Cyclops scutifer (Sars): Their structure and importance. Proc. Natl. Acad. Sci. USA 1973, 70, 2656–2659. [Google Scholar] [CrossRef] [PubMed] [Green Version]
- Petipa, T.S. Methods of movement and food capture in Calanus helgolandicus (Claus). In Biology and Distribution of the Plankton of the South Seas; “Nauka” Press: Moscow, Russia, 1967; pp. 37–57. [Google Scholar]
- Van Duren, L.A.; Stamhuis, E.J.; Videler, J.J. Copepod feeding currents: Flow patterns, filtration rates and energetics. J. Exp. Biol. 2003, 206, 255–267. [Google Scholar] [CrossRef] [PubMed] [Green Version]
- Van Duren, L.A.; Videler, J.J. The trade-off between feeding, mate seeking and predator avoidance in copepods: Behavioural responses to chemical cues. J. Plankt. Res. 1996, 18, 805–818. [Google Scholar] [CrossRef]
- Buskey, E.J.; Lenz, P.H.; Hartline, D.K. Escape behavior of planktonic copepods in response to hydrodynamic disturbances: High-speed video analysis. Mar. Ecol. Prog. Ser. 2002, 235, 135–146. [Google Scholar] [CrossRef] [Green Version]
- Burdick, D.S.; Lenz, P.H.; Hartline, D.K. Escape strategies in co-occurring calanoid copepods. Limnol. Oceanog. 2007, 52, 2373–2385. [Google Scholar] [CrossRef]
- Waggett, R.J.; Buskey, E.J. Escape reaction performance of myelinated and non-myelinated calanoid copepods. J. Exp. Mar. Biol. Ecol. 2008, 361, 111–118. [Google Scholar] [CrossRef]
- Kiørboe, T.; Andersen, A.; Langlois, V.; Jakobsen, H.H. Unsteady motion: Escape jumps in copepods, their kinematics and energetics. J. R. Soc. Interface 2010, 7, 1591–1602. [Google Scholar] [CrossRef] [Green Version]
- Morris, M.J.; Gust, G.; Torres, J.J. Propulsion efficiency and cost of transport for copepods: A hydromechanical model of crustacean swimming. Mar. Biol. 1985, 86, 283–295. [Google Scholar] [CrossRef]
- Morris, M.J.; Kohlhage, K.; Gust, G. Mechanics and energetics of swimming in the small copepod Acanthocyclops robustus (Cyclopoida). Mar. Biol. 1990, 107, 83–91. [Google Scholar] [CrossRef]
- Van Duren, L.A.; Videler, J.J. Escape from viscosity: The kinematics and hydrodynamics of copepod foraging and escape swimming. J. Exp. Biol. 2003, 206, 269–279. [Google Scholar] [CrossRef] [PubMed] [Green Version]
- Yen, J.; Sanderson, B.; Strickler, J.R.; Okubo, A. Feeding currents and energy dissipation by Euchaeta rimana, a subtropical pelagic copepod. Limnol. Oceanogr. 1991, 36, 362–369. [Google Scholar] [CrossRef]
- Catton, K.B.; Webster, D.R.; Brown, J.; Yen, J. Quantitative analysis of tethered and free-swimming copepodid flow fields. J. Exp. Biol. 2007, 210, 299–310. [Google Scholar] [CrossRef] [Green Version]
- Jiang, H.; Kiørboe, T. The fluid dynamics of swimming by jumping in copepods. J. R. Soc. Interface 2011, 8, 1090–1103. [Google Scholar] [CrossRef] [Green Version]
- Svetlichny, L.S. Morphology and functional parameters of body muscles of Calanus helgolandicus (Copepoda, Calanoida). Zool. J. 1988, 67, 23–30. (In Russian) [Google Scholar]
- Svetlichny, L.S. Speed, force and energy expenditure in the movement of copepods. Oceanology 1987, 27, 497–502. [Google Scholar]
- Svetlichny, L.S. Escape reaction in the copepod Calanus helgolandicus. Zool. J. 1986, 65, 506–515. (In Russian) [Google Scholar]
- Svetlichny, L.S. Locomotor function of mouth appendages in copepods: Hydromechanical and energetic similarity. Ekol. Morya 1993, 44, 91–99. (In Russian) [Google Scholar]
- Alcaraz, M.; Strickler, J.R. Locomotion in copepods: Pattern of movements and energetics of Cyclops. Hydrobiologia 1988, 167, 404–414. [Google Scholar]
- Lenz, P.H.; Hartline, D.K. Reaction times and force production during escape behavior of a calanoid copepod, Undinula vulgaris. Mar. Biol. 1999, 133, 249–258. [Google Scholar] [CrossRef] [Green Version]
- Lenz, P.H.; Hower, A.E.; Hartline, D.K. Temperature compensation in the escape response of a marine copepod, Calanus finmarchicus (Crustacea). Biol. Bull. 2005, 209, 75–85. [Google Scholar] [CrossRef] [PubMed] [Green Version]
- Kiørboe, T.; Saiz, E.; Tiselius, P.; Andersen, K.H. Adaptive feeding behavior and functional responses in pelagic copepods. Limnol. Oceanogr. 2018, 63, 308–321. [Google Scholar] [CrossRef] [Green Version]
- Lewis, A.G.; Johnson, C.; Allen, S.E. Calanoid copepod thoracic legs-surface area vs. body size and potential swimming ability, a comparison of eight species. Crustaceana 2010, 83, 695–713. [Google Scholar] [CrossRef] [Green Version]
- Kurbatov, B.V.; Svetlichny, L.S. Kinematics and hydrodynamical resistance of Calanus helgolandicus (Claus) thoracic limbs. Ekol. Morya 1982, 10, 75–81, (Russian with English summary). [Google Scholar]
- Rader, B.W. Rhincalanus Cornutus (Copepoda): Trunk Skeletomusculature. Trans. Am. Microsc. Soc. 1970, 89, 75–99. [Google Scholar] [CrossRef]
- Boxshall, G.A. The comparative anatomy of two copepods, a predatory calanoid and a particle-feeding mormonilloid. Phil. Trans. R. Soc. Lond. 1985, 311, 303–377. [Google Scholar]
- Pringle, J.W.S. Insect Flight; Cambridge University Press: Cambridge, UK, 1957; p. 132. [Google Scholar]
- Kiørboe, T.; Jiang, H.; Colin, S.P. Danger of zooplankton feeding: The fluid signal generated by ambush-feeding copepods. Proc. R. Soc. B Boil. Sci. 2010, 277, 3229–3237. [Google Scholar] [CrossRef]
- Svetlichny, L.; Larsen, P.S.; Kiørboe, T. Swim and fly: Escape strategy in neustonic and planktonic copepods. J. Exp. Biol. 2018, 221, jeb167262. [Google Scholar] [CrossRef] [Green Version]
- Strickler, J.R. Swimming of planktonic Cyclops species (Copepoda, Crustacea): Pattern, movements and their control. In Swimming and Flying in Nature; Wu, T.T., Brokaw, C.J., Brennan, C., Eds.; Plenum Press: New York, NY, USA, 1975; pp. 599–613. [Google Scholar]
- Mauchline, J. The biology of calanoid copepods. In Advances in Marine Biology; Blaxter, J.H.S., Southward, A.J., Tyler, P.A., Eds.; Academic Press: Cambridge, MA, USA, 1998; p. 710. [Google Scholar]
- Borazjani, I.; Sotiropoulos, F.; Malkiel, E.; Katz, J. On the role of copepod antennae in the production of hydrodynamic force during hopping. J. Exp. Biol. 2010, 213, 3019–3035. [Google Scholar] [CrossRef] [Green Version]
- Kiørboe, T. Mate finding, mating, and population dynamics in a planktonic copepod Oithona davisae: There are too few males. Limnol. Oceanogr. 2007, 52, 1511–1522. [Google Scholar] [CrossRef]
- Kiørboe, T. Optimal swimming strategies in mate searching pelagic copepods. Oecologia 2008, 155, 179–192. [Google Scholar] [CrossRef]
- Pavlova, E.V. The Movement and Metabolism of Marine Planktonic Organisms; Naukova Dumka: Kiev, Ukraine, 1987; p. 212. (In Russian) [Google Scholar]
- Swift, M.C.; Fedorenko, A.Y. Some aspects of prey capture by Chaoborus larvae. Limnol. Oceanogr. 1975, 20, 418–426. [Google Scholar] [CrossRef]
- Price, H.J.; Paffenhofer, G.-A.; Strickler, J.R. Modes of cell capture in calanoid copepods. Limnol. Oceanogr. 1983, 28, 116–123. [Google Scholar] [CrossRef]
- Cowles, T.J.; Strickler, J.R. Characterization of feeding activity patterns in the planktonic copepod Centropages typicus Krøyer under various food conditions. Limnol. Oceanogr. 1983, 2, 106–115. [Google Scholar] [CrossRef]
- Chen, M.R.; Hwang, J.S. The swimming behavior of the calanoid copepod Calanus sinicus under different food concentrations. Zool. Stud. 2018, 57, 13. [Google Scholar] [CrossRef]
- Gill, C.W.; Crisp, D.I. The effect of size and temperature on the frequency of limb beat of Temora longicornis Miller (Crustacea: Copepoda). J. Exp. Mar. Biol. Ecol. 1985, 86, 185–196. [Google Scholar] [CrossRef]
- Castel, J.; Veiga, J. Distribution and retention of the copepodEurytemora affinis hirundoides in a turbid estuary. Mar. Biol. 1990, 107, 119–128. [Google Scholar] [CrossRef]
- Bundy, M.H.; Paffenhöfer, G.A. Analysis of flow fields associated with freely swimming calanoid copepods. Mar. Ecol. Progr. Ser. 1996, 133, 99–113. [Google Scholar] [CrossRef] [Green Version]
- Yen, J. Directionality and swimming speeds in predator-prey and male–female interactions of Euchaeta rimana, a subtropical marine copepod. Bull. Mar. Sci. 1988, 43, 395–403. [Google Scholar]
- Buskey, E.J.; Hartline, D.K. High-speed video analysis of the escape responses of the copepod Acartia tonsa to shadows. Biol. Bull. 2003, 240, 28–37. [Google Scholar] [CrossRef]
- Hartline, D.K.; Buskey, E.J.; Lenz, P.H. Rapid jumps and bioluminescence elicited by controlled hydrodynamic stimuli in a mesopelagic copepod, Pleuromamma xipias. Biol. Bull. 1999, 197, 132–143. [Google Scholar] [CrossRef] [PubMed]
- Svetlichny, L.S. Correlation between locomotion parameters and body size at rush swimming in copepods. J. Gen. Biol. 1988, 49, 401–408. (In Russian) [Google Scholar]
- Lenz, P.H.; Hower, A.E.; Hartline, D.K. Force production during pereiopod power strokes in Calanus finmarchicus. J. Mar. Sys. 2004, 49, 133–144. [Google Scholar] [CrossRef]
- Buskey, E.J.; Lenz, P.H.; Hartline, D.K. Sensory perception, neurobiology, and behavioral adaptations for predator avoidance in planktonic copepods. Adapt. Behav. 2012, 20, 57–66. [Google Scholar] [CrossRef]
- Bradley, C.J.; Strickler, J.R.; Buskey, E.J.; Lenz, P.H. Swimming and escape behavior in two species of calanoid copepods from nauplius to adult. J. Plank. Res. 2013, 35, 49–65. [Google Scholar] [CrossRef] [Green Version]
- Waggett, R.J. Ecological, Biomechanical and Neurological Correlates of Escape Behavior in Calanoid Copepods. Ph.D. Thesis, University of Texas, Austin, TX, USA, 2005. [Google Scholar]
- Catton, K.B.; Webster, D.R.; Yen, J. The effect of fluid viscosity, habitat temperature, and body size on the flow disturbance of Euchaeta. Limnol. Oceanogr. Fluids Environ. 2012, 2, 80–92. [Google Scholar] [CrossRef]
- Tanaka, Y. High-speed imaging in copepod behavior. In Copepods: Diversity, Habitat, and Behavior; Seuront, L., Ed.; Nova Publishers: Hauppauge, NY, USA, 2014; pp. 145–156. [Google Scholar]
- Tuttle, L.J.; Robinson, H.E.; Takagi, D.; Strickler, J.R.; Lenz, P.H.; Hartline, D.K. Going with the flow: Hydrodynamic cues trigger directed escapes from a stalking predator. J. R. Soc. Interface 2019, 16, 20180776. [Google Scholar] [CrossRef] [Green Version]
- Svetlichny, L.S.; Svetlichny, A.S. Measurements of locomotion parameters of copepods fixed to a force element. Okeanologia 1986, 26, 856–857. (In Russian) [Google Scholar]
- Alexander, R.M. The maximum forces exerted by animals. J. Exp. Biol. 1985, 115, 231–238. [Google Scholar]
- Dol’nik, V.R. Allometry of morphology, function, and energy of homoiothermal animal and its physical control. Zh. Obshch. Biol. 1982, 43, 435–454. [Google Scholar]
- Shuleykin, V.V.; Lukyanova, V.S.; Stas, I.I. Comparative dynamics of marine animals. Proc. USSR Acad. Sci. 1939, 22, 424–429. (In Russian) [Google Scholar]
- Svetlichny, L.S.; Stepanov, V.N. On the results of modelling the passive movements in Calanus helgolandicus. Biol. Morya 1975, 33, 61–64. [Google Scholar]
- Stepanov, V.N.; Svetlichny, L.S. Research into the Hydromechanical Characteristics of Planktonic Copepods; Naukova Dumka: Kiev, Ukraine, 1981; p. 126. (In Russian) [Google Scholar]
- Svetlichny, L.S. Hydrodynamic resistance of motionless copepods during their passive sinking in water. Oceanology 1983, 23, 104–108. [Google Scholar]
- Happel, J.; Brenner, H. Low Reynolds Number Hydrodynamics with Special Applications to Particulate Media; Prentice-Hall: Englewood Cliffs, NJ, USA, 1965; p. 553. [Google Scholar]
- Haury, L.; Weihs, D. Energetically efficient swimming behavior of negatively buoyant zooplankton. Limnol. Oceanogr. 1976, 6. [Google Scholar] [CrossRef]
- Emlet, R.B. Flow fields around ciliated larvae: Effects of natural and artificial tethers. Mar. Ecol. Prog. Ser. 1990, 63, 211–225. [Google Scholar] [CrossRef]
- Schmidt-Nielsen, K. Scaling: Why is Animal Size So Important? Cambridge University Press: Cambridge, UK, 1984; p. 241. [Google Scholar]
- Jiang, H.; Kiørboe, T. Propulsion efficiency and imposed flow fields of a copepod jump. J. Exp. Biol. 2011, 214, 476–486. [Google Scholar] [CrossRef] [Green Version]
- Murphy, D.W.; Webster, D.R.; Yen, J. A high-speed tomographic PIV system for measuring zooplanktonic flow. Limnol. Oceanogr. Methods 2012, 10, 1096–1112. [Google Scholar] [CrossRef] [Green Version]
- Svetlichny, L.; Hubareva, E. Salinity tolerance of alien copepods Acartia tonsa and Oithona davisae in the Black Sea. J. Exp. Mar. Biol. Ecol. 2014, 461, 201–208. [Google Scholar] [CrossRef]
- Svetlichny, L.; Hubareva, E.; Isinibilir, M. Comparative trends in respiration rates, sinking and swimming speeds of copepods Pseudocalanus elongatus and Acartia clausi with comments on the cost of brooding strategy. J. Exp. Mar. Biol. Ecol. 2017, 488, 24–31. [Google Scholar] [CrossRef]
- Svetlichny, L.S.; Hubareva, E.S.; Erkan, F.; Gucu, A.C. Physiological and behavioral aspects of Calanus euxinus female (Copepoda, Calanoida) during vertical migration across temperature and oxygen gradients. Mar. Biol. 2000, 137, 963–971. [Google Scholar] [CrossRef]
- Larsen, P.S.; Madsen, C.V.; Riisgård, H.U. Effect of temperature and viscosity on swimming velocity of the copepod Acartia tonsa, brine shrimp Artemia salina and rotifer Brachionus plicatilis. Aquat. Biol. 2008, 4, 47–54. [Google Scholar] [CrossRef] [Green Version]
- Svetlichny, L.; Hubareva, E.; Khanaychenko, A.; Uttieri, M. Salinity and temperature tolerance of the Asian copepod Pseudodiaptomus marinus recently introduced into the Black Sea: Sustainability of its invasiveness? J. Exp. Zool. A Ecol. Integr. Physiol. 2019, 331, 416–426. [Google Scholar] [PubMed]
- Marden, J.H. Scaling of maximum net force output by motors used for locomotion. J. Exp. Biol. 2005, 208, 1653–1664. [Google Scholar] [CrossRef] [PubMed] [Green Version]
- Bejian, A.; Marden, J.H. Unifying constructal theory for scale effects in running, swimming and flying. J. Exp. Biol. 2006, 209, 238–248. [Google Scholar] [CrossRef] [PubMed] [Green Version]
- Ivlev, V. Energy consumption during the motion of shrimps. Zool. Zh. 1963, 42, 1465–1471. (In Russian) [Google Scholar]
- Torres, J.J.; Childress, J.J. Relationship of oxygen consumption to swimming speed in Euphausia pacifica. Mar. Biol. 1983, 74, 79–86. [Google Scholar] [CrossRef]
- Bagshaw, C.R. Muscle Contraction. Outline Studies in Biology; Chapman and Hall: London, UK, 1982; p. 127. [Google Scholar]
- Gorshkov, V.G. Power and rate of locomotion in animals of different sizes. J. Gen. Biol. 1983, 44, 661–678. (In Russian) [Google Scholar]


| a | acceleration |
| c | hydrodynamic shape factor |
| Cd | coefficient of drag |
| Ct | energy consumption per unit body mass and time |
| D | diameter of body |
| D | duration |
| E | energy |
| F | frequency of beat |
| K | empirical constant |
| la | effective length of second antenna |
| L | prosome length |
| M | body mass |
| N | power, energy per unit time |
| Re | Reynols tal, ρLU/µ |
| Rd | drag force |
| Rp | propulsive force |
| S | sectional area of body |
| S | distance |
| Sloc | locomotor step length |
| U | body speed |
| Ua | circular speed of second antenna |
| Greek | |
| α | angle of second antenna beat |
| µ | dynamic viscosity |
| ν | kinematic viscosity, µ/ρ |
| ρ | density |
| Subscripts | |
| att | attached, tethered to force sensor |
| cr | cruising, free |
| d | drag |
| esc | escape jump |
| kick | kick, jump |
| max | maximal |
| mean | mean |
| min | minimal |
| p | propulsion |
| st | stroke phase |
| Species | L (cm) | nind/nm | F (Hz) | U (cm s−1) | Sloc (cm) | Source |
|---|---|---|---|---|---|---|
| Paracalanus parvus | 0.063 | 8/56 | 63.9 ± 12.4 | 0.31 ± 0.15 | 0.005 | Present data |
| -”- | 3/8 | 75.9 ± 5.3 | 0.8 ± 0.25 | 0.011 | ||
| Acartia tonsa | 0.084 | 8/86 | 77.8 ± 4.6 | 0.33 ± 0.4 | 0.004 | |
| -”- | 4/32 | 66.0 ± 5.1 | 0.4 ± 0.6 | 0.006 | ||
| Centropages ponticus | 0.084 | 6/34 | 69.0 ± 8 | 0.45 ± 0.13 | 0.007 | |
| Pseudocalanus elongatus | 0.084 | 7/24 | 41.8 ± 7.3 | 0.56 ± 0.27 | 0.013 | |
| Euritemora affinis | 0.08 | 2/54 | 68.4 ± 3.2 | 0.64 ± 0.29 | 0.009 | |
| -”- | 1/3 | 66.7 ± 2.4 | 0.45 ± 0.13 | 0.007 | ||
| Centropages typicus | 0.112 | 11/109 | 39.6 ± 4.1 | 0.81 ± 0.38 | 0.020 | |
| -”- | 1/4 | 42.7 ± 1.3 | 1.37 ± 0.33 | 0.032 | ||
| Limnocalanus macrurus | 0.18 | 4/40 | 41.7 ± 5.5 | 0.84 ± 0.09 | 0.020 | |
| -”- | 1/5 | 39.7 ± 4.3 | 0.53 ± 0.01 | 0.013 | ||
| Pontella mediterranea | 0.20 | 5/26 | 23.4 ± 1.2 | 3.1 ± 0.57 | 0.132 | |
| -”- | 2/8 | 26.3 ± 1.7 | 2.5 ± 0.8 | 0.153 | ||
| Calanus helgolandicus | 0.27 | 7/82 | 36.0 ± 2.7 | 2.16 ± 0.45 | 0.060 | |
| -”- | 4/9 | 41.3 ± 5.2 | ||||
| Anomalocera patersoni | 0.25 | 3/38 | 26.4 ± 10.1 | 3.5 ± 1.7 | 0.133 | |
| -”- | 6/26 | 21.3 ± 4.1 | ||||
| Pseudodiaptomus marinus | 0.082 | 5/39 | 80.4 ± 6.8 | 0.24 ± 0.06 | 0.003 | |
| Paracalanus parvus | 0.06 | 63.0 ± 6 | 0.35 ± 0.05 | 0.006 | [32] | |
| 0.063 | 72.3 ± 4 | |||||
| Pseudocalanus elongatus | 0.08 | 45.2 ± 5 | 0.48 ± 0.17 | 0.011 | ||
| Centropages ponticus | 0.086 | 64.0 ± 1 | ||||
| Acartia clausi | 0.095 | 51.7 ± 10 | ||||
| Pontella mediterranea | 0.24 | 27 ± 3 | ||||
| Calanus helgolandicus | 0.26 | 39.1 ± 5 | 2.69 ± 0.1 | 0.068 | ||
| Neocalanus gracilis | 0.25 | 28.0 ± 2 | ||||
| Euchirella messinensis | 0.35 | 29.1 | ||||
| Euchaeta marina | 0.3 | 55.0 ± 5 | ||||
| Pleuromamma abdominalis | 0.23 | 37 ± 3 | ||||
| Phaenna spinifera | 0.14 | 59.5 ± 3 | ||||
| Calanus helgolandicus | 0.27 | 3.2 | [49] | |||
| Rhincalanus nasutus | 0.5 | 0.59 | ||||
| Euchirella curticauda | 0.36 | 2 | ||||
| Euchaeta marina | 0.33 | 2.5 | ||||
| Scolecthrix sp, | 0.18 | 1.1 | ||||
| Anomalocera patersoni | 0.31 | 5.32 | ||||
| Diaptomus kenai | 0.18 | 0.5 ± 0.1 | [50] | |||
| Diaptomus tyrelli | 0.08 | 0.05 | ||||
| Diaptomus hesperus | 0.15 | 50 | 0.31 | 0.006 | ||
| Eucalanus pileatus | 0.14 | 18 | [51] | |||
| Paracalanus parvus | 0.07 | 83 | ||||
| Centropages typicus | 0.14 | 55 | [52] | |||
| Calanus sinicus | 0.23 | 1.14 | [53] | |||
| Temora longocornis | 0.09 | 32. ± 3 | [54] | |||
| Eurytemora hirundoides | 0.084 | 0.34 | [55] | |||
| Acartia granii (females) | 0.101 | 0.33 ± 0.5 | [48] | |||
| Temora longicornis (females) | 0.074 | 0.14 ± 0.19 | ||||
| Temora stylifera (females) | 0.107 | 0.33 ± 0.35 | ||||
| Pseudocalanus elongatus (females) | 0.079 | 0.2 ± 0.26 | ||||
| Acartia granii (males) | 0.088 | 0.34 ± 0.84 | ||||
| Temora longicornis (males) | 0.068 | 0.3 ± 0.23 | ||||
| Temora stylifera (males) | 0.099 | 0.72 ± 0.46 | ||||
| Pseudocalanus elongatus (males) | 0.064 | 0.28 ± 0.3 | ||||
| Temora longicornis | 0.085 | 40.7 ± 8 | 0.48 ± 0.9 | [17] | ||
| Centropages velificatus | 0.12 | 0.7 | [56] | |||
| Paracalanus aculeatus | 0.1 | 0.2 | ||||
| Euchaeta rimana | 0.25 | 0.75 ± 0.04 | [57] |
| Species | Lpr, cm | N | Umax, cm s−1 | Ukick, cm s−1 | Dkick, s | Skick, cm | Source |
|---|---|---|---|---|---|---|---|
| Oithona davisae | 0.028 | 41 | 17.5 ± 6.3 | 10.0 ± 3.7 | 0.0081 ± 0.0023 | 0.065 ± 0.016 | Present data |
| Oithona nana | 0.031 | 25 | 21.4 ± 2.5 | 10.1 ± 1.2 | 0.0076 ± 0.0009 | 0.074 ± 0.012 | |
| Oithona similis | 0.045 | 35 | 12.1 ± 2.3 | 0.0077 ± 0.0011 | 0.093 ± 0.014 | ||
| Paracalanus parvus | 0.06 | 30 | 20.8 ± 3.9 | 11.9 ± 2.5 | 0.0066 ± 0.0011 | 0.077 ± 0.013 | |
| Pseudodiaptomus marinus | 0.082 | 17 | 56.6 ± 7.7 | 31.9 ± 3.9 | 0.0075 ± 0.0008 | 0.238 ± 0.033 | |
| Eurytemora affinis | 0.08 | 13 | 38.7 ± 5.2 | 21.9 ± 2.7 | 0.0083 ± 0.0012 | 0.182 ± 0.028 | |
| Acartia clausi | 0.089 | 29 | 48.3 ± 9.9 | 28.1 ± 6.0 | 0.0062 ± 0.0013 | 0.170 ± 0.039 | |
| Acartia tonsa | 0.085 | 9 | 54.5 ± 4.4 | 30.2 ± 3.2 | 0.0059 ± 0.0008 | 0.176 ± 0.022 | |
| Centropages ponticus | 0.084 | 5 | 27.2 ± 8.1 | 16.9 ± 4.7 | 0.0105 ± 0.0004 | 0.177 ± 0.052 | |
| Pseudocalanus elongatus | 0.086 | 17 | 36.0 ± 4.5 | 19.8 ± 2.8 | 0.0082 ± 0.0010 | 0.163 ± 0.037 | |
| Centropages typicus | 0.112 | 14 | 39.8 ± 6.1 | 22.1 ± 5.4 | 0.0120 ± 0.0031 | 0.256 ± 0.051 | |
| Limnocalanus macrurus | 0.19 | 18 | 55.1 ± 11.6 | 25.5 ± 4.7 | 0.0220 ± 0.0065 | 0.544 ± 0.108 | |
| Pontella mediterranea | 0.21 | 19 | 74.2 ± 24.6 | 44.0 ± 14.6 | 0.0112 ± 0.0025 | 0.469 ± 0.135 | |
| Anomalocera patersoni | 0.26 | 18 | 88.01 ± 8.9 | 57.1 ± 13.7 | 0.0095 ± 0.0014 | 0.532 ± 0.102 | |
| Calanus helgolandicus | 0.27 | 16 | 73.81 ± 8.3 | 45.8 ± 15.4 | 0.0150 ± 0.0050 | 0.629 ± 0.110 | |
| Oncaea conifera | 0.08 | 6 | 14.7 ± 2.4 | 0.0082 ± 0.0025 | 0.204 ± 0.021 | [29] | |
| Corycaeus limbatus | 0.07 | 4 | 11.3 | 0.0083 | 0.095 | ||
| Pseudocalanus elongatus | 0.09 | 9 | 36.4 ± 6.1 | 21.2 ± 4.7 | 0.0068 ± 0.0007 | 0.142 ± 0.025 | |
| Undinopsis similis | 0.10 | 4 | 9.7 ± 3.5 | 0.0137 ± 0.0027 | 0.134 ± 0.013 | ||
| Pleuromamma abdominalis | 0.24 | 10 | 25.0 ± 1.9 | 0.0147 ± 0.0002 | 0.386 ± 0.042 | ||
| Euchaeta media | 0.24 | 5 | 18.3 ± 1.8 | 0.0121 ± 0.0013 | 0.220 ± 0.029 | ||
| -‘’- | 0.29 | 3 | 36.1 ± 2.2 | 0.0128 ± 0.0038 | 0.432 ± 0.047 | ||
| Euchirella messinensis | 0.32 | 4 | 83.8 ± 22.0 | 41.5 ± 4.3 | 0.0153 ± 0.0008 | 0.708 ± 0.026 | |
| -‘’- | 0.39 | 3 | 116.0 ± 6.8 | 71.5 ± 4.5 | 0.0153 ± 0.0006 | 1.112 ± 0.105 | |
| Anomalocera patersoni | 0.38 | 5 | 102.9 ± 14.6 | 64.9 ± 8.3 | 0.0061 ± 0.0010 | 0.404 ± 0.108 | |
| Oithona davisae | 0.03 | 68 | 19.8 ± 4.2 | 10.1 ± 2.1 | 0.0074 | 0.075 ± 0.016 | [22,28] |
| Acartia tonsa | 0.074 | 59 | 37.8 ± 9.6 | 24.1 ± 5.3 | 0.0076 | 0.185 ± 0.024 | |
| Calanus finmarchicus | 0.30 | 75.6 | 0.013 | ||||
| Acartia tonsa | 0.083 | 55 | 44.6 ± 15 | 25.6 ± 10 | [19,21,58] | ||
| Acartia lilljeborgii | 0.103 | 56 | 48.6 ± 11.7 | 23.2 ± 7.6 | |||
| Temora turbinata | 0.074 | 49 | 46.3 ± 5.3 | 25.3 ± 3.3 | |||
| Paracalanus parvus | 0.066 | 30 | 40.7 ± 2.9 | 22.7 ± 2.0 | |||
| Temora turbinata | 0.074 | 21.5 ± 5.5 | 10.3 ± 5.6 | [64] | |||
| Centropages furcatus | 0.10 | 20.8 ± 1.7 | 11.5 ±1.6 | ||||
| Subeucalanus pileatus | 0.205 | 45.3 ± 3.2 | 25.6 ± 2.5 | ||||
| Pontella marplatensis | 0.23 | 47.7 ± 17.2 | 24.3 ± 9.4 | ||||
| Parvocalanus crassirostris | 0.039 | 17 | 0.0034 ± 0.004 | 0.13 ± 0.01 | [63] | ||
| Eurytemora affinis | 0.077 | 34.2 ± 4.4 | 18.1 ± 10.2 | 0.0101 ± 0.001 | 0.21 ± 02 | ||
| Acartia hudsonica | 0.075 | 14 | 38.7 ± 10.0 | [20] | |||
| Tortanus discaudatus | 0.122 | 21 | 53.6 ± 5.7 | ||||
| Centropages hamatus | 0.099 | 9 | 38.6 ± 2.8 | ||||
| Temoralongicornis | 0.059 | 4 | 26.2 ± 2.8 | ||||
| Euchaeta elongata | 0.41 | 8 | 31.4 ± 4.8 | [65] | |||
| Euchaeta rimana | 0.24 | 7 | 27.6 ± 3.2 | ||||
| Paraeuchaeta elongata | 0.40 | 120 | [66] | ||||
| Calanus pacificus | 0.22 | 7 | 53 ± 7 | ||||
| Bestiolina similis | 0.054 | 26.3 ± 5.5 | [67] |
| Species | Lpr, cm | Propulsion Force, Dyn | Source | ||
|---|---|---|---|---|---|
| Cruising | Escape Reaction | ||||
| Mean Integrated | Mean Integrated | Maximum Force | |||
| Paracalanus parvus | 0.062 | 0.018 ± 0.004 (2) | 0.62 ± 0.2 (7) | 0.9 | [32,60] |
| Acartia clausi | 0.063 | 0.7 (2) | 1.3 | ||
| -”- | 0.106 | 1.5 ± 0.3 (4) | 2.8 | ||
| Pseudocalanus elongatus | 0.085 | 0.014 ± 0.0022 (4) | |||
| Calanus helgolandicus | 0.18 | 0.081 ± 0.02 (8) | 2.4 ± 0.5 (4) | 4.6 | |
| -”- | 0.25 | 0.019 ± 0.03 (7) | 12.5 ± 3.3 (14) | 22 | |
| -”- | 0.28 | 0.23 ± 0.04 (7) | 24.8 ± 7.1 (8) | 44 | |
| -”- | 0.28 | 0.28 ± 0.03 (3) | 32.4 ± 11.9 (12) | 56 | |
| Pontella mediterranea | 0.2 | 0.22 ± 0.013 (4) | 16.9 ± 3.4 (6) | 28 | |
| Undinopsis similis | 0.1 | 3.3 ± 0.4 (4) | 6 | ||
| Scolecithrix Bradyi | 0.09 | 6.9 ± 0.6 (4) | 12.3 | ||
| Phaenna spinifera | 0.14 | 0.19 (1) | |||
| Nannocalanus minor | 0.14 | 14.1 ± 1.7 (3) | 25 | ||
| Pleuromamma abdominalis | 0.25 | 0.22 ± 0.04 (4) | 14.2 ± 1 (11) | 27 | |
| Eucalanus attenuatus | 0.42 | 17.3 ± 3.2 (6) | 32 | ||
| Euchaeta marina | 0.32 | 0.37 ± 0.08 (2) | |||
| Euchirella messinensis | 0.32 | 0.34 (1) | 70 ± 18.4 (4) | 123 | |
| -”- | 0.39 | 76 ± 14.4 (3) | 145 | ||
| -”- | 0.41 | 87 ± 9.3 (4) | 159 | ||
| Cyclops scutifer | 0.06 | 0.68 | [33] | ||
| Undinula vulgaris | 0.22 | 125 | [34] | ||
| Calanus finmarchicus | 0.28 | 80 | [61] | ||
| Quantity and Condition | Cruising | Escape Jump | ||||||
|---|---|---|---|---|---|---|---|---|
| Free Swimming | Attached Locomotion | Free Swimming | Attached Locomotion | |||||
| m | Figure | m | Figure | m | Figure | m | Figure | |
| Body speed, U | 1.4 | Figure 4 | 0.7 | Figure 7 | ||||
| Drag force, Rd | 2.82 | Figure 14 | 2.15 | Figure 17A | ||||
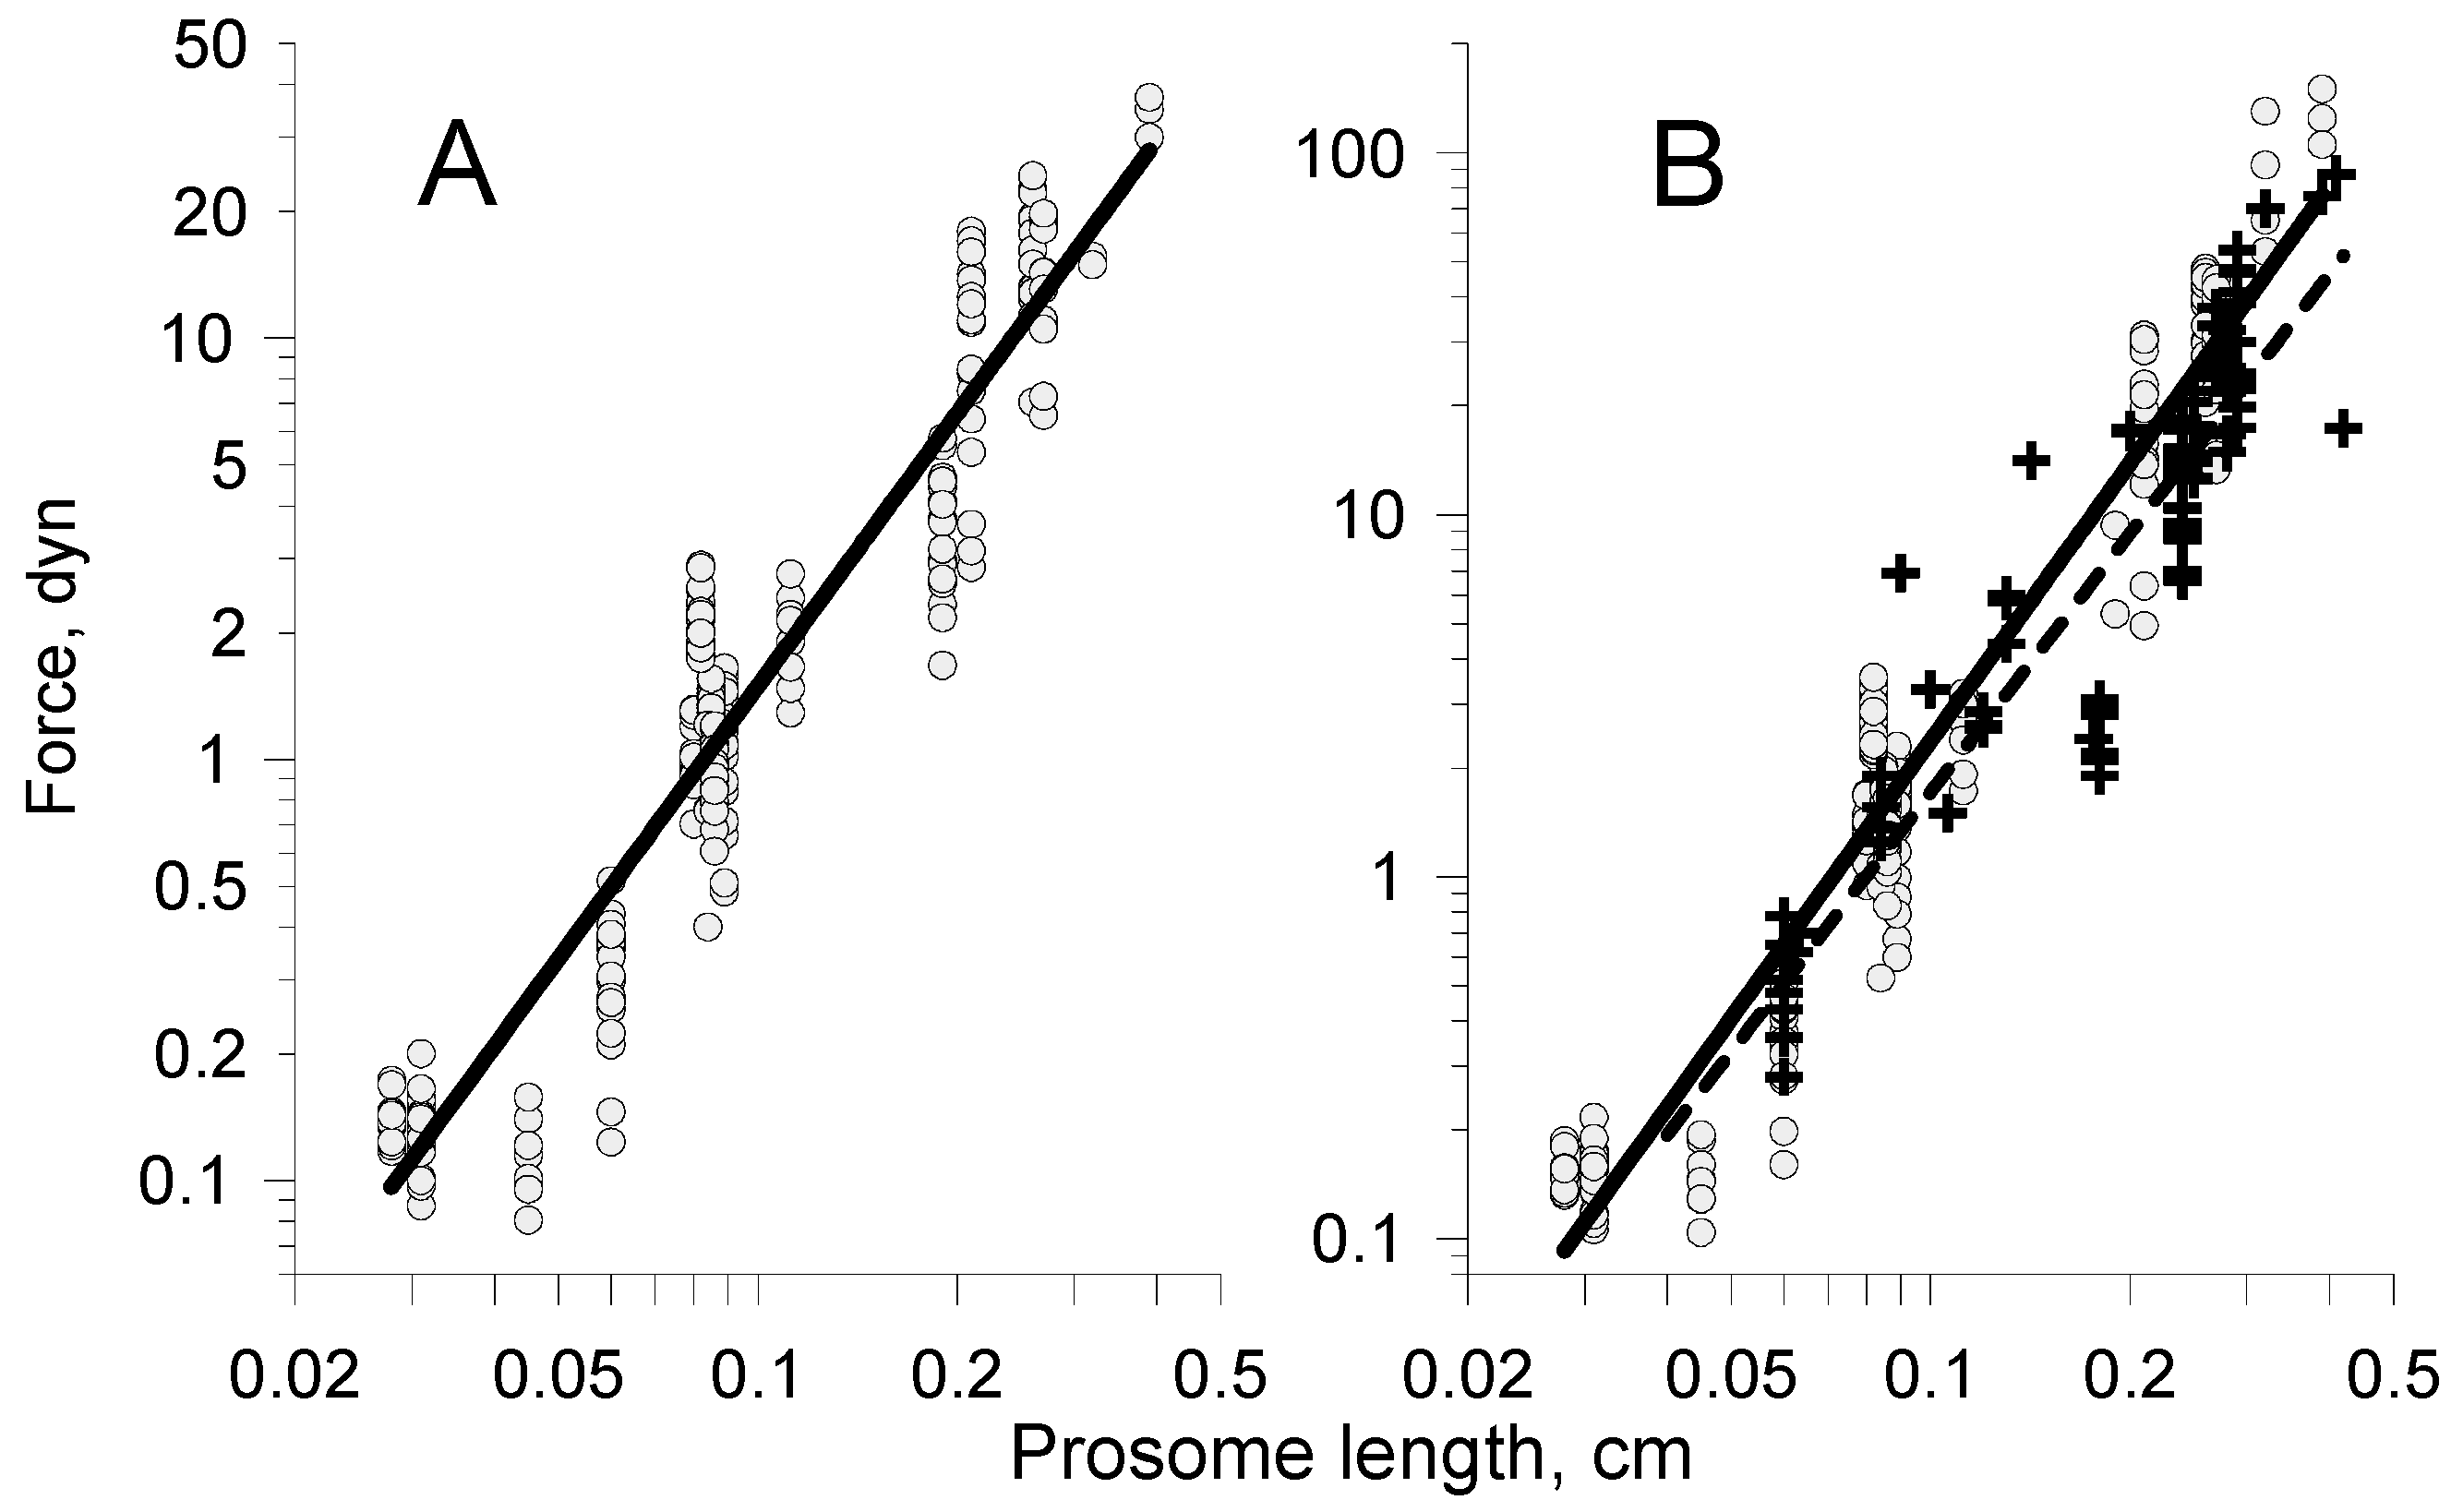
| Propulsive force, Rp | 2.36 | Figure 15 | 2.06 | Figure 11A | 2.55 | Figure 17B | 2.2 | Figure 11B |
| Power | 3.1 | Figure 16 | 3.04 | Figure 16 | 3.05 | Figure 18 | 2.94 | Figure 18 |
© 2020 by the authors. Licensee MDPI, Basel, Switzerland. This article is an open access article distributed under the terms and conditions of the Creative Commons Attribution (CC BY) license (http://creativecommons.org/licenses/by/4.0/).
Share and Cite
Svetlichny, L.; Larsen, P.S.; Kiørboe, T. Kinematic and Dynamic Scaling of Copepod Swimming. Fluids 2020, 5, 68. https://doi.org/10.3390/fluids5020068
Svetlichny L, Larsen PS, Kiørboe T. Kinematic and Dynamic Scaling of Copepod Swimming. Fluids. 2020; 5(2):68. https://doi.org/10.3390/fluids5020068
Chicago/Turabian StyleSvetlichny, Leonid, Poul S. Larsen, and Thomas Kiørboe. 2020. "Kinematic and Dynamic Scaling of Copepod Swimming" Fluids 5, no. 2: 68. https://doi.org/10.3390/fluids5020068