
Dielectric Study on Supramolecular Gels by Fiber Structure Formation from Low-Molecular-Weight Gelator/Water Mixtures
 , and
, and 
Abstract
:1. Introduction
2. Results and Discussion
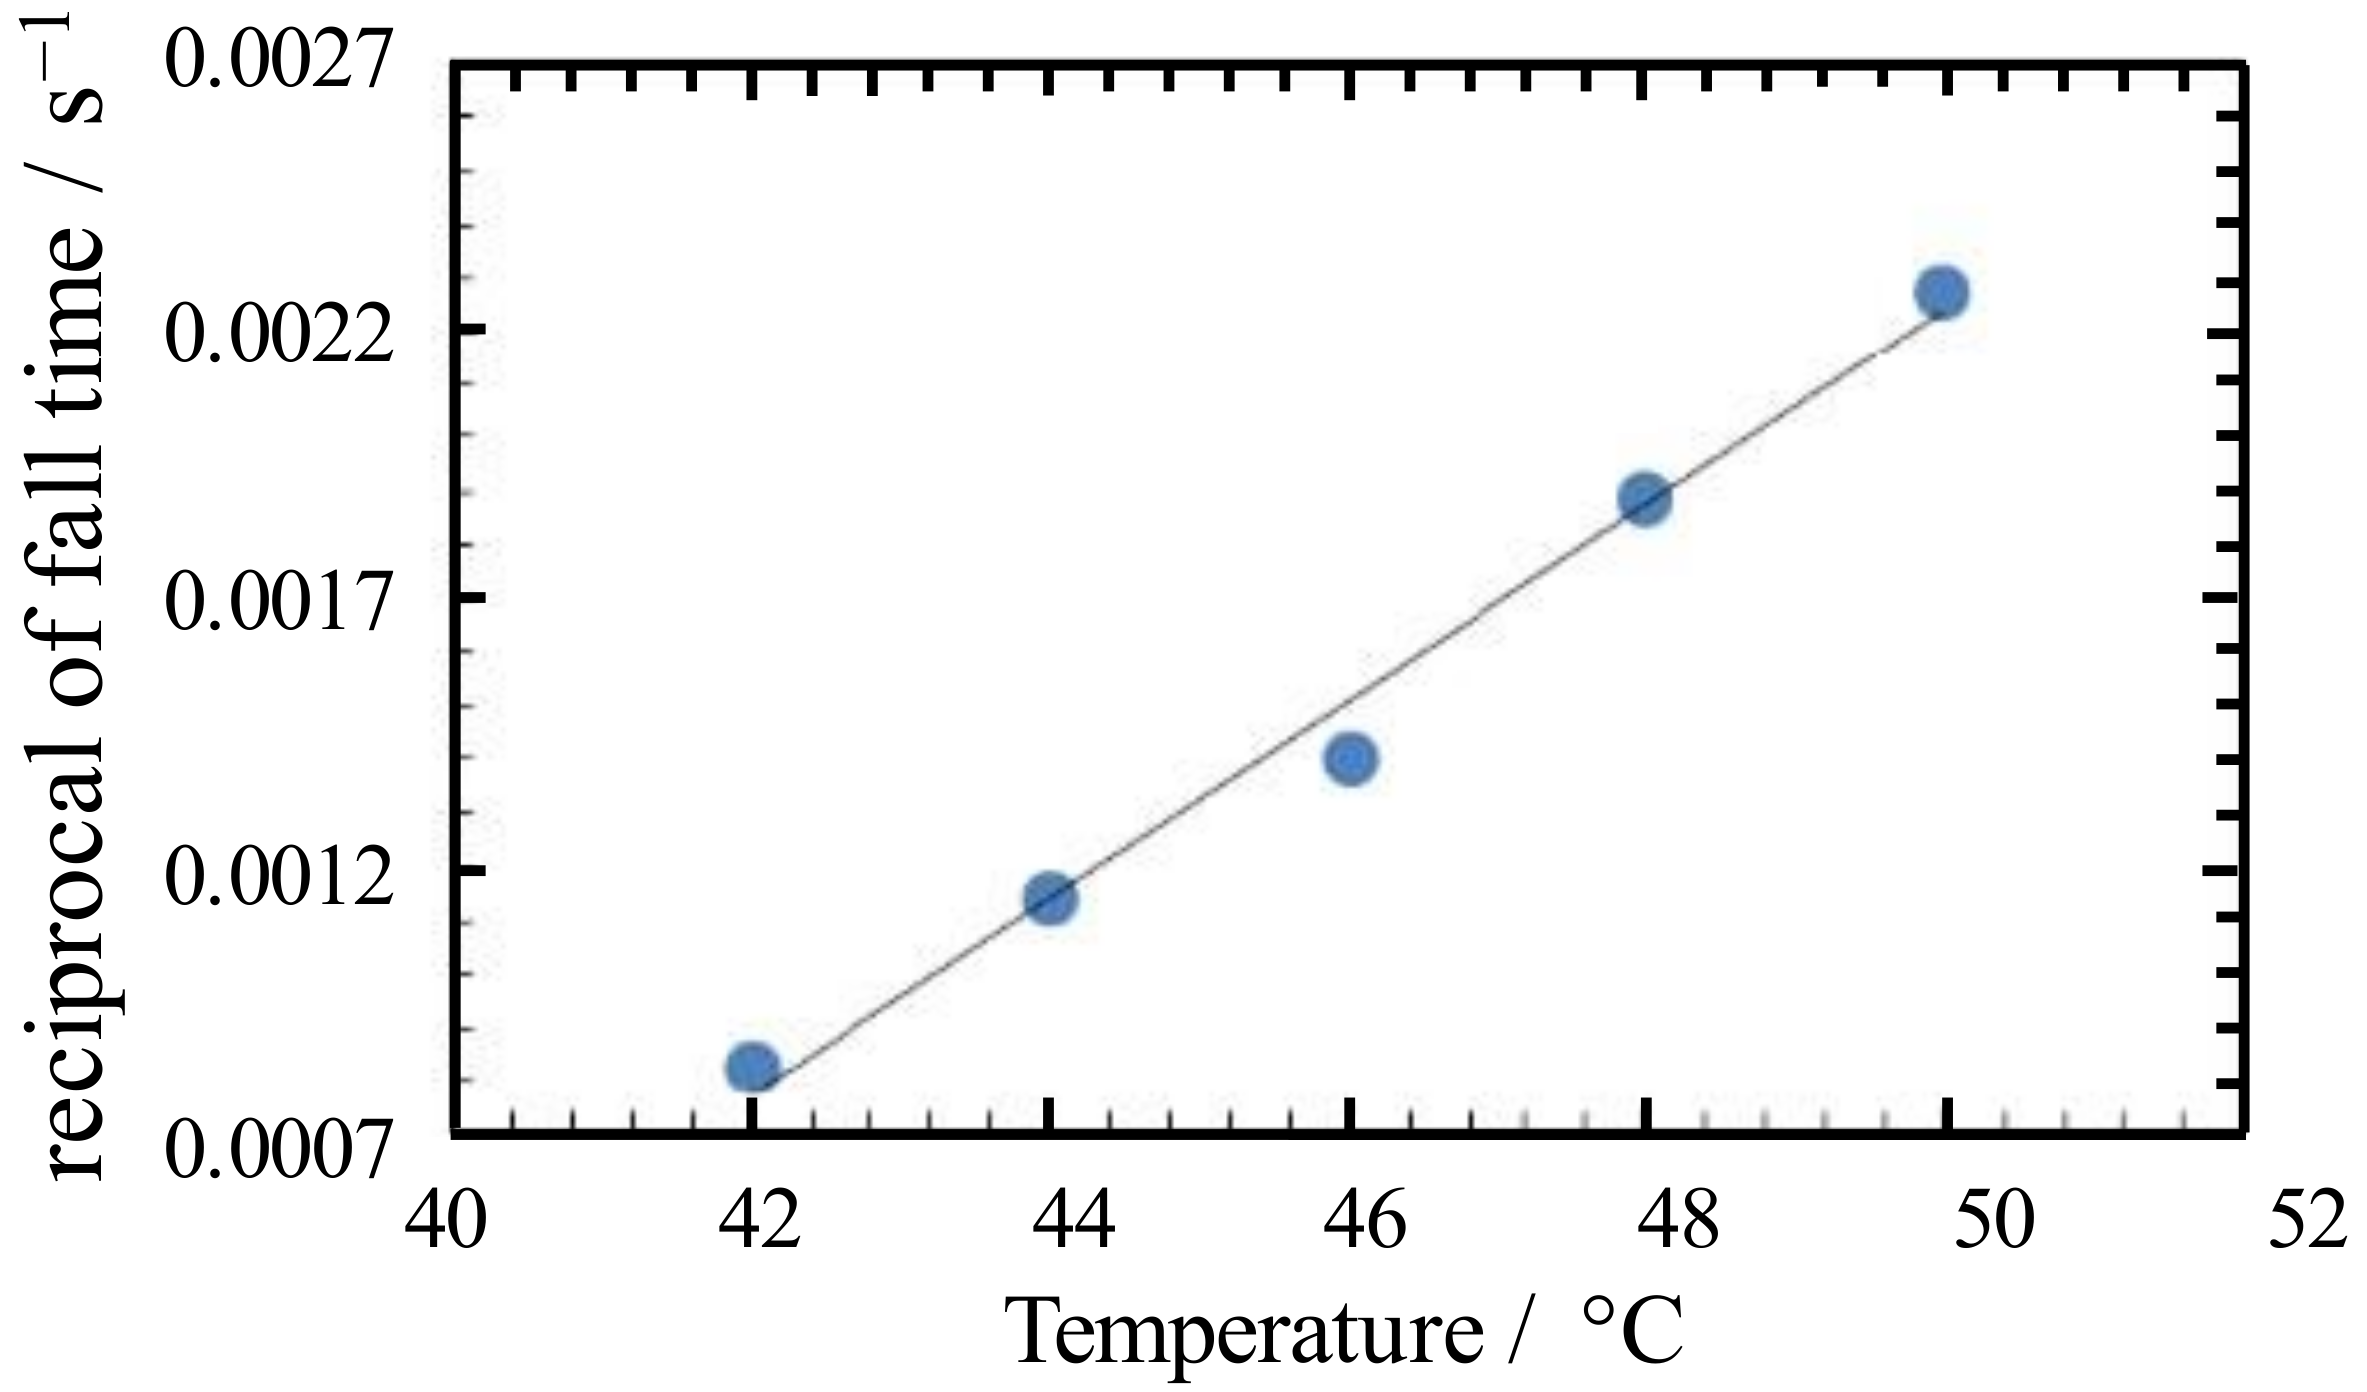
2.1. Determination of the Sol–Gel Transition Temperature
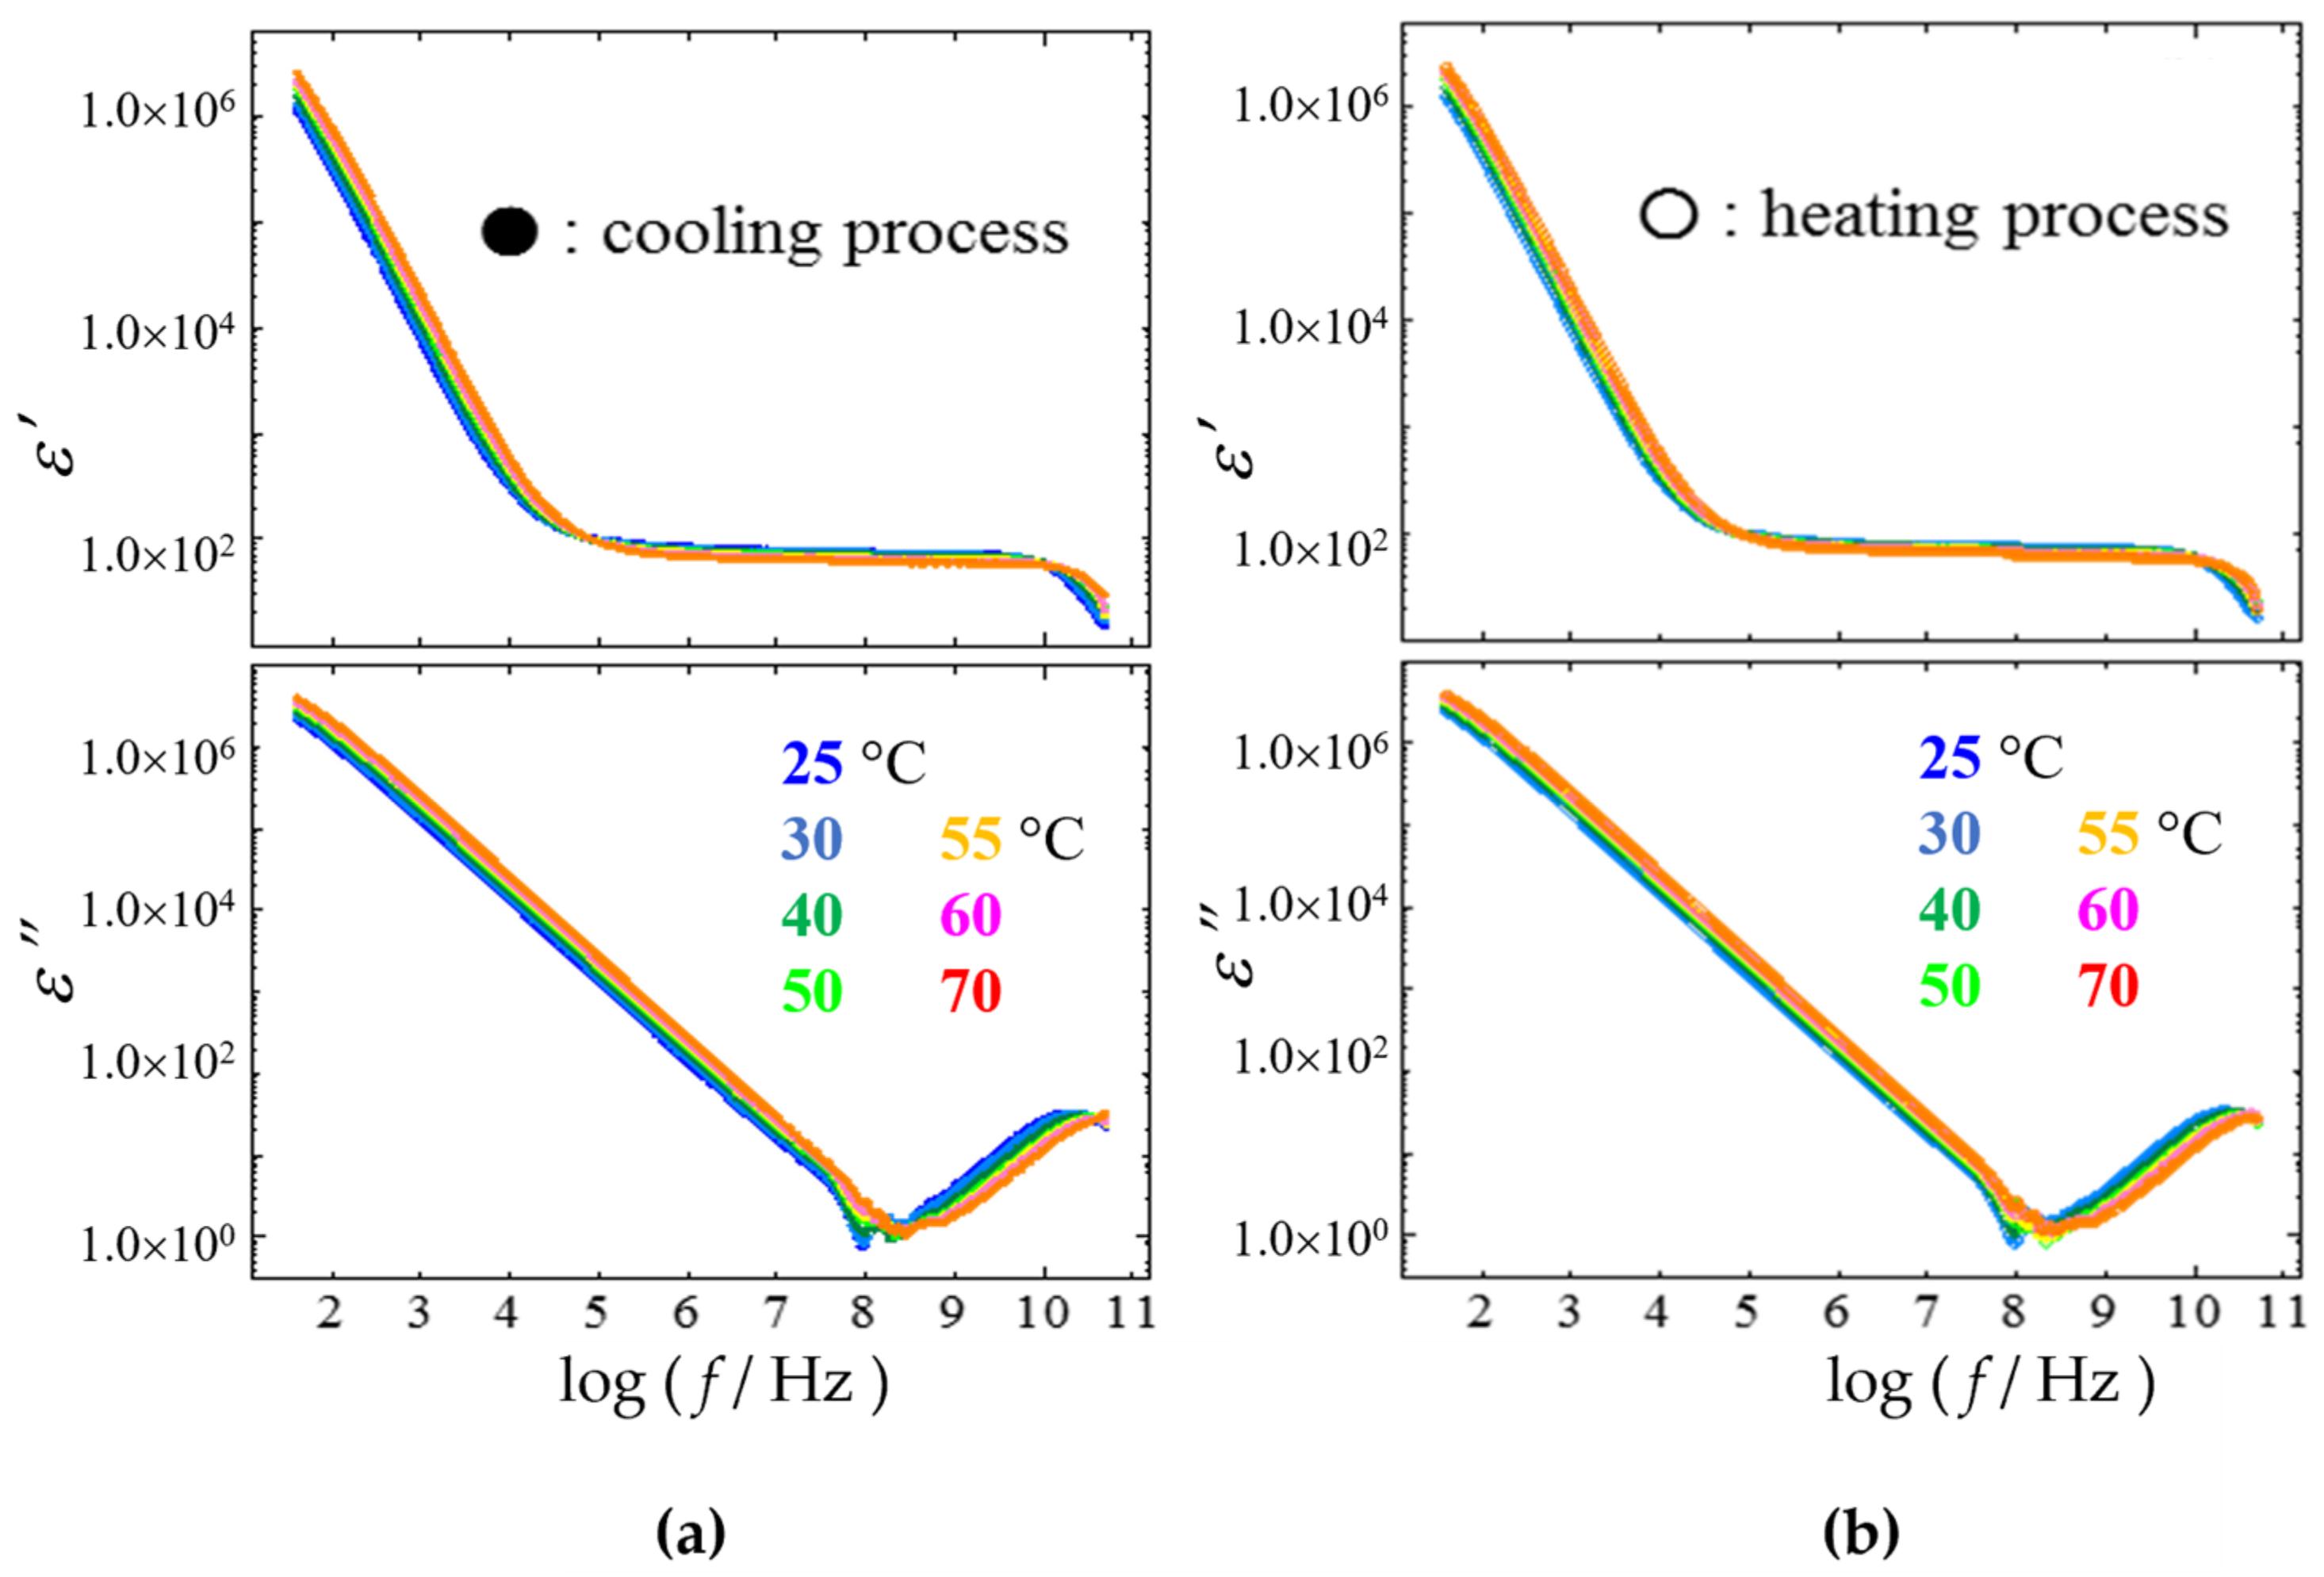
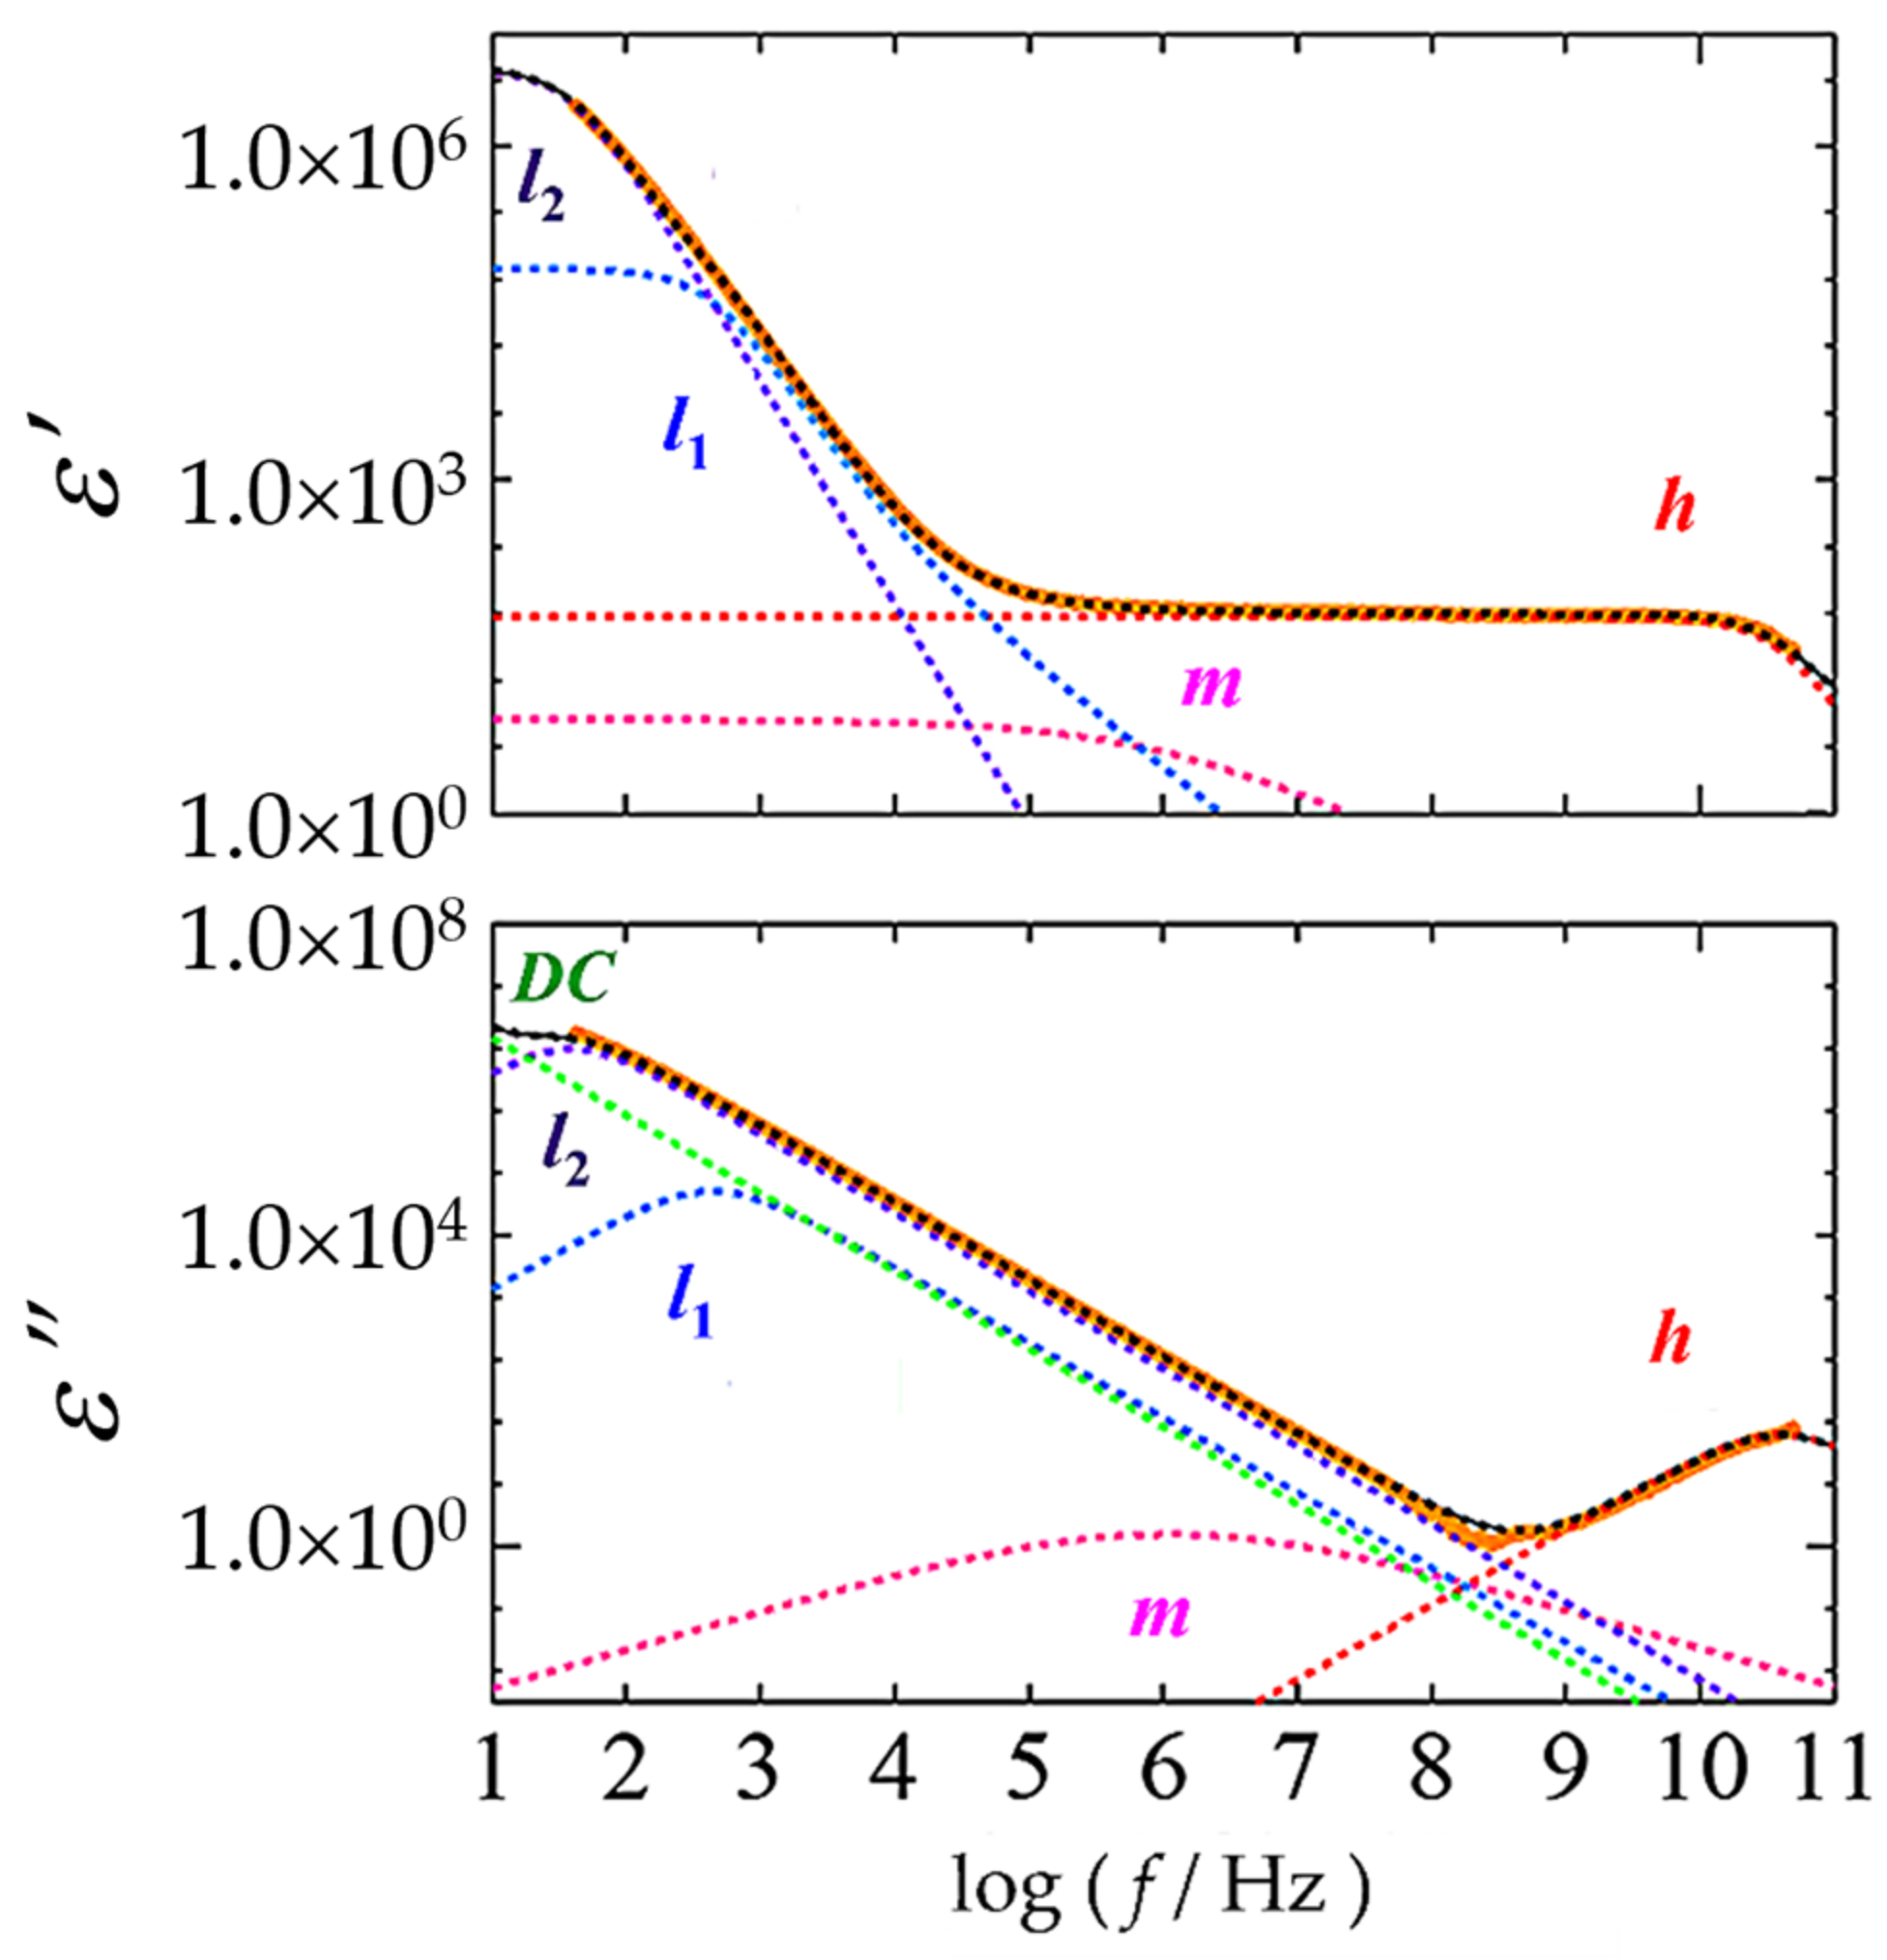
2.2. Dielectric Relaxation Curves
2.3. Relaxation Parameter Analysis
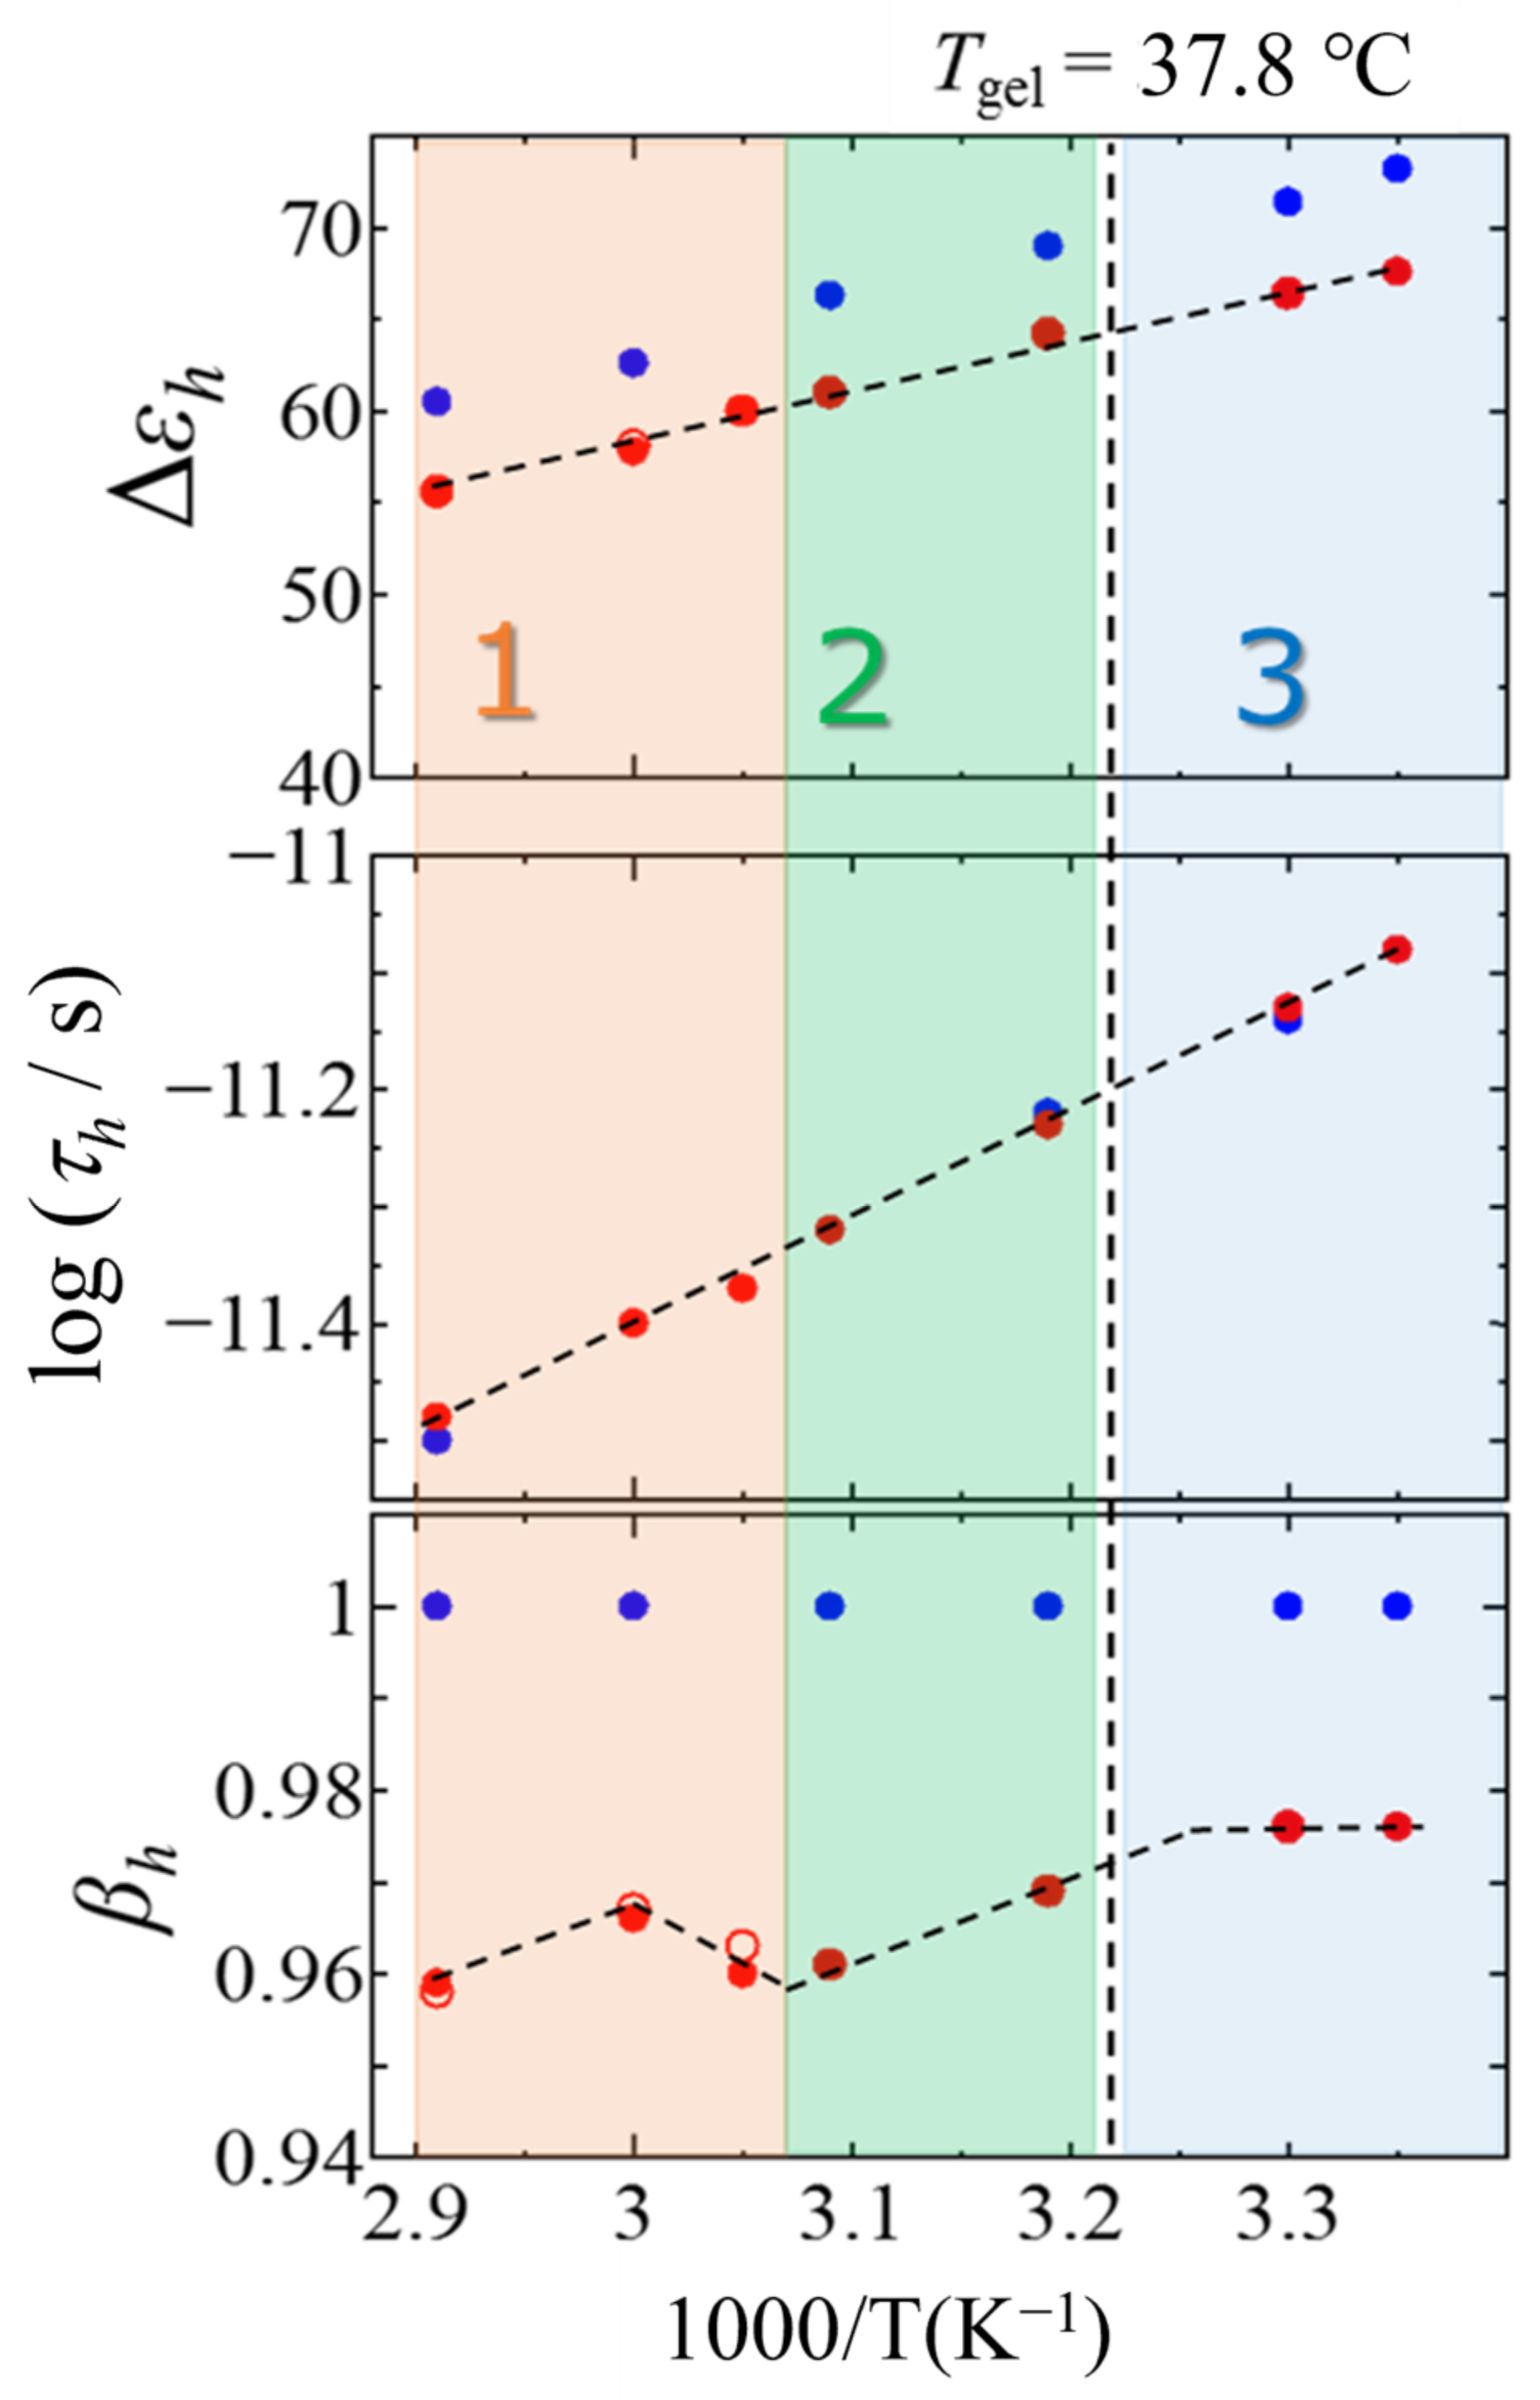
2.3.1. h-Process
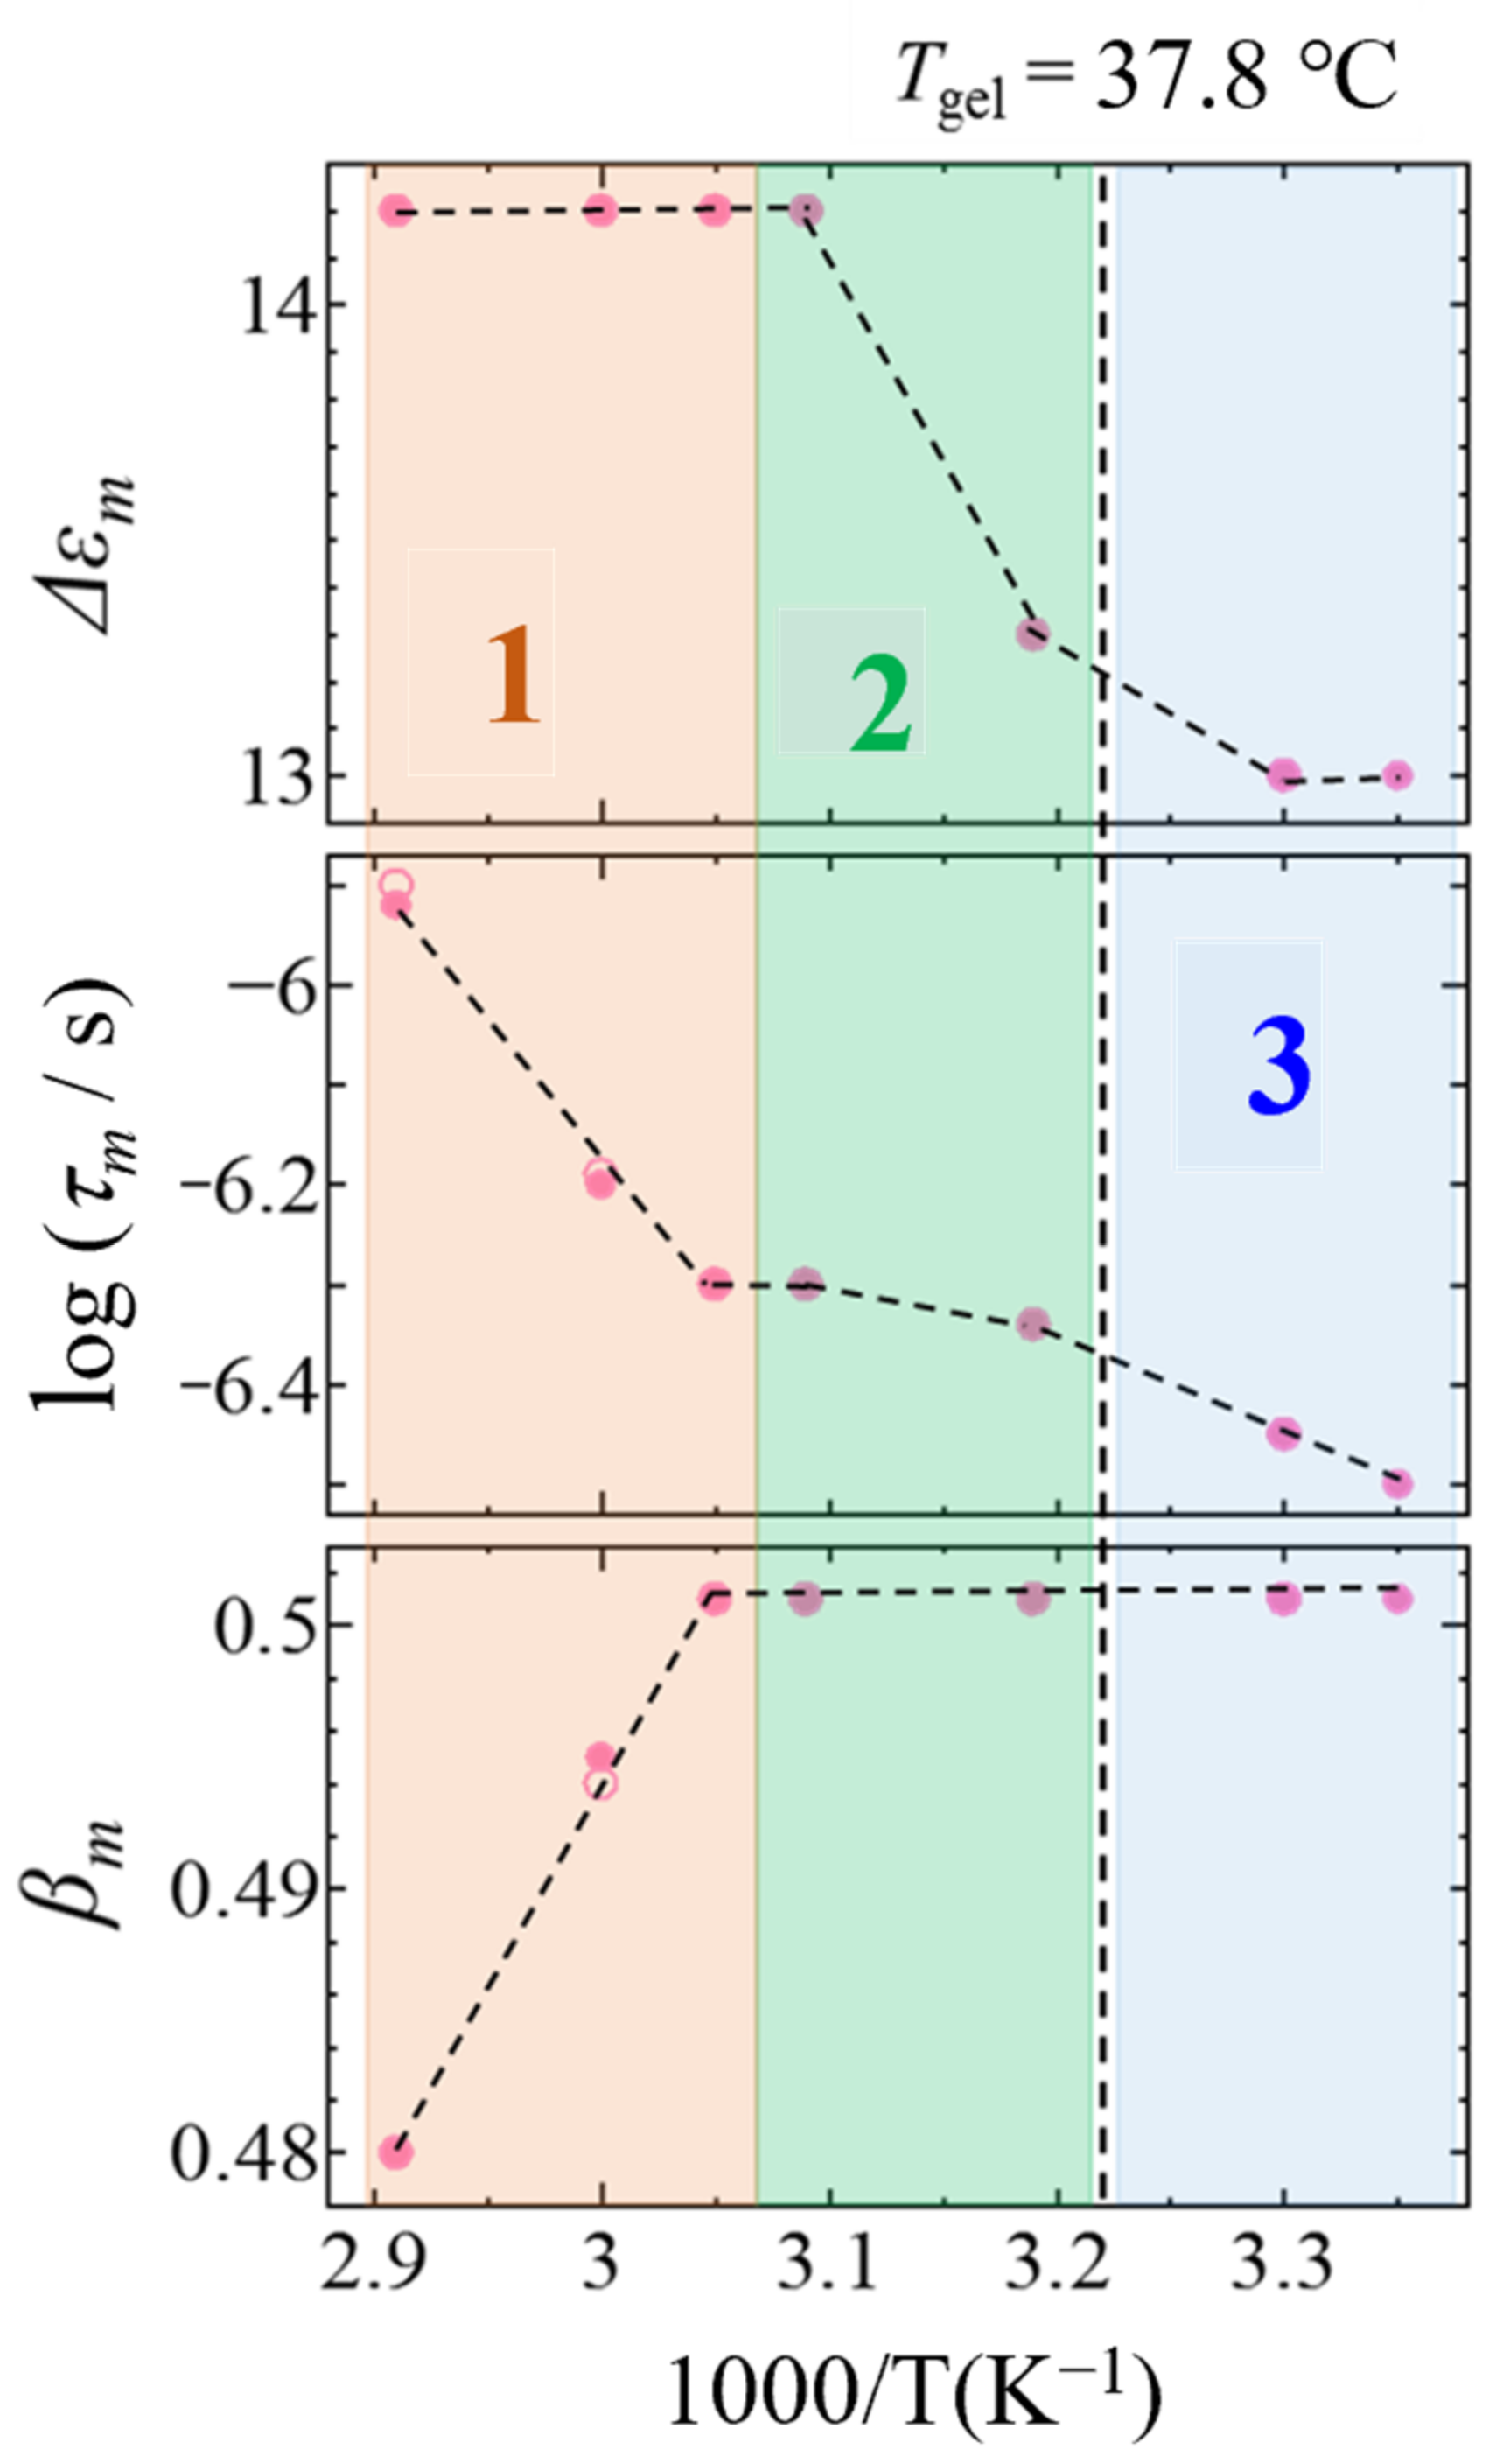
2.3.2. m-Process
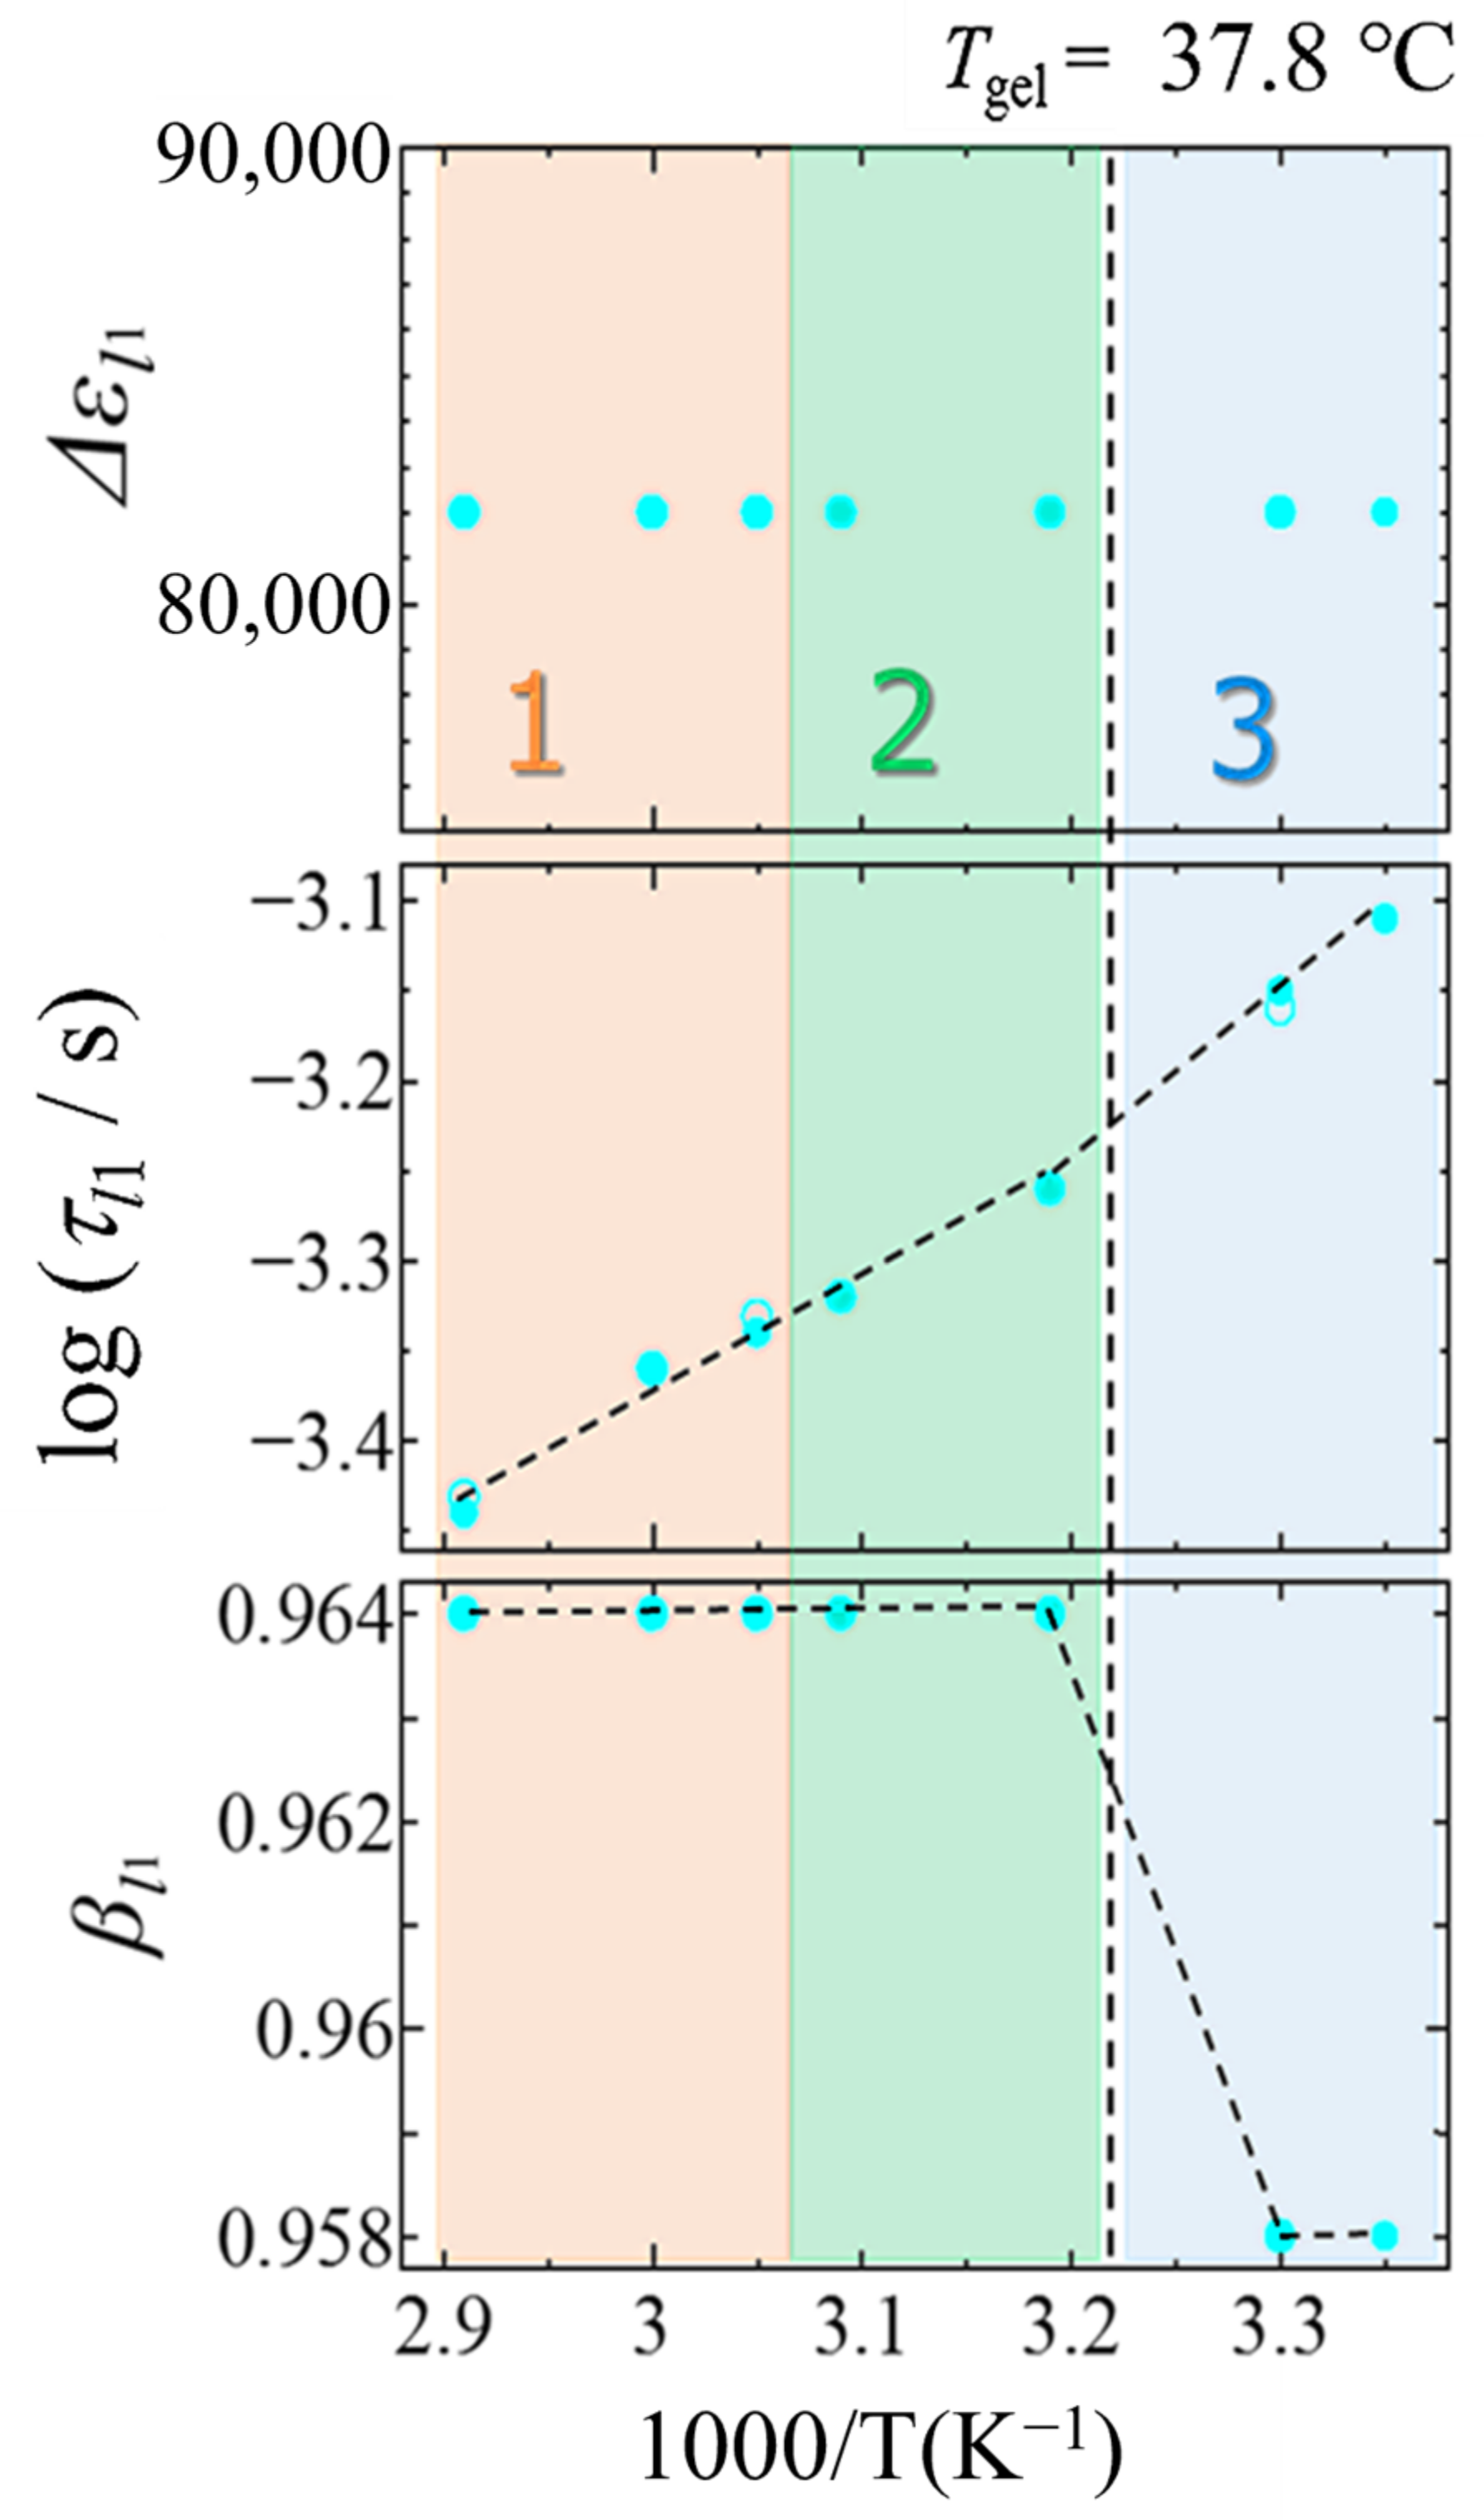
2.3.3. l1-Process
3. Conclusions
4. Materials and Methods
4.1. Sample Preparations
4.2. Sol–Gel Transition Temperature Measurement
4.3. Dielectric Measurement
Author Contributions
Funding
Data Availability Statement
Acknowledgments
Conflicts of Interest
References
- Weiss, R.G. (Ed.) For Example, Molecular Gels—Structure and Dynamics; Royal Society of Chemistry: Cambridge, UK, 2018. [Google Scholar]
- Du, X.; Zhou, J.; Shi, J.; Xu, B. Supramolecular Hydrogelators and Hydrogels: From Soft Matter to Molecular Biomaterials. Chem. Rev. 2015, 115, 13165–13307. [Google Scholar] [CrossRef]
- Estroff, L.A.; Hamilton, A.D. Water Gelation by Small Organic Molecules. Chem. Rev. 2004, 104, 1201–1218. [Google Scholar] [CrossRef]
- Kunitake, T.; Okahata, Y.; Shimomura, M.; Yasunami, S.; Takarabe, K. Formation of stable bilayer assemblies in water from single chain amphiphiles. Relationship between the amphiphile structure and the aggregate morphology. J. Am. Chem. Soc. 1981, 103, 5401–5413. [Google Scholar] [CrossRef]
- Suzuki, M.; Yumoto, M.; Kimura, M.; Shirai, H.; Hanabusa, K. Novel family of low molecular weight hydrogelators based on L-lysine derivatives. Chem. Commun. 2002, 8, 884–885. [Google Scholar] [CrossRef]
- Suzuki, M.; Yumoto, M.; Kimura, M.; Shirai, H.; Hanabusa, K. A family of Low-Molecular-Weight Hydrogelators Based on L-Lysine Derivatives with a Positively Charged Terminal Group. Chem. Eur. J. 2003, 9, 348–354. [Google Scholar] [CrossRef] [PubMed]
- Nakashima, T.; Kimizuka, N. Light-harvesting supramolecular hydrogels assembled from short-legged cationic L-glutamate derivatives and anionic fluorophores. Adv. Mater. 2002, 14, 1113–1116. [Google Scholar] [CrossRef]
- De Loos, M.; Feringa, B.L.; van Esch, J.H. Design and Application of Self-Assembled Low Molecular Weight Hydrogels. Eur. J. Org. Chem. 2005, 2005, 3615–3631. [Google Scholar] [CrossRef]
- Zhang, S. Fabrication of novel biomaterials through molecular self-assembly. Nat. Biotechnol. 2003, 21, 1171–1178. [Google Scholar] [CrossRef]
- Matsumoto, S.; Yamaguchi, S.; Ueno, S.; Komatsu, H.; Ikeda, M.; Ishizuka, K.; Iko, Y.; Tabata, K.; Aoki, H.; Ito, S.; et al. Photo Gel–Sol/Sol–Gel Transition and Its Patterning of a Supramolecular Hydrogel as Stimuli-Responsive Biomaterials. Chem. A Eur. J. 2008, 14, 3977–3986. [Google Scholar] [CrossRef]
- Oda, R.; Huc, I.; Candau, S.J. Gemini surfactants as new, low molecular weight gelators of organic solvents and water. Angew. Chem. Int. Ed. 1998, 37, 2689–2691. [Google Scholar] [CrossRef]
- Wang, G.; Hamilton, A.D. Low molecular weight organogelators for water. Chem. Commun. 2003, 3, 310–311. [Google Scholar] [CrossRef] [PubMed]
- Estroff, L.A.; Hamilton, A.D. Effective Gelation of Water Using a Series of Bis-urea Dicarboxylic Acids. Angew. Chem. Int. Ed. 2000, 39, 3447–3450. [Google Scholar] [CrossRef]
- Kogiso, M.; Hanada, T.; Yase, K.; Shimizu, T. Intralayer hydrogen-bond-directed self-assembly of nano-fibers from dicarboxylic valylvaline bolaamphiphiles. Chem. Commun. 1998, 17, 1791–1792. [Google Scholar] [CrossRef]
- Kogiso, M.; Ohnishi, S.; Yase, K.; Masuda, M.; Shimizu, T. Dicarboxylic Oligopeptide Bolaamphiphiles: Proton-Triggered Self-Assembly of Microtubes with Loose Solid Surfaces. Langmuir 1998, 14, 4978–4986. [Google Scholar] [CrossRef]
- Kohler, K.; Forster, G.; Hauser, A.; Dobner, B.; Heiser, U.F.; Ziethe, F.; Richter, W.; Steiniger, F.; Drechsler, M.; Stettin, H.; et al. Temperature-Dependent Behavior of a Symmetric Long-Chain Bolaamphiphile with Phosphocholine Headgroups in Water: From Hydrogel to Nanoparticles. J. Am. Chem. Soc. 2004, 126, 16804–16813. [Google Scholar] [CrossRef]
- Kiyonaka, S.; Sada, K.; Yoshimura, I.; Shinkai, S.; Kato, N.; Hamachi, I. Semi-wet peptide/protein array using supramolecular hydrogel. Nat. Mater. 2004, 3, 58–64. [Google Scholar] [CrossRef] [PubMed]
- Sangeetha, N.M.; Maitra, U. Supramolecular gels: Functions and uses. Chem. Soc. Rev. 2005, 34, 821–836. [Google Scholar] [CrossRef] [Green Version]
- Penaloza, D.P., Jr.; Shundo, A.; Matsumoto, K.; Ohno, M.; Miyaji, K.; Goto, M.; Tanaka, K. Spatial heterogeneity in the sol–gel transition of a supramolecular system. Soft Matter 2013, 9, 5166–5172. [Google Scholar] [CrossRef]
- Ono, F.; Ichimaru, K.; Hirata, O.; Shinkai, S.; Watanabe, H. Universal Glucose-based Low-molecular-weight Gelators for Both Organic and Aqueous Solvents. Chem. Lett. 2020, 49, 156–159. [Google Scholar] [CrossRef]
- Draper, E.R.; Adams, D.J. Low-Molecular-Weight Gels: The State of the Art. Chem 2017, 3, 390–410. [Google Scholar] [CrossRef] [Green Version]
- Chen, X.M.; Feng, W.J.; Bisoyi, H.K.; Zhang, S.; Chen, X.; Yang, H.; Li, Q.L. Light-activated photodeformable supramolecular dissipative self-assemblies. Nat. Commun. 2022, 13, 3216. [Google Scholar] [CrossRef]
- Miao, Y.; Zhang, J.; Zhang, G.; He, S.; Xu, B. l-Lysine-Based Gelators for the Formation of Gels in Water and Alcohol-Water Mixtures. Gels 2022, 9, 29. [Google Scholar] [CrossRef]
- Hanabusa, K.; Suzuki, M. Development of low-molecular-weight gelators and polymer-based gelators. Polym J. 2014, 46, 776–782. [Google Scholar] [CrossRef]
- He, Y.; Tang, Y.; Zhang, Y.; MacFarlane, L.; Shang, J.; Shi, H.; Xie, O.; Zhao, H.; Manners, I.; Guo, J. Driving forces and molecular interactions in the self-assembly of block copolymers to form fiber-like micelles. Appl. Phys. Rev. 2022, 9, 021301. [Google Scholar] [CrossRef]
- Adams, D.J. Personal Perspective on Understanding Low Molecular Weight Gels. J. Am. Chem. Soc. 2022, 144, 11047–11053. [Google Scholar] [CrossRef]
- Kaatze, U. Measuring the dielectric properties of materials. Ninety-year development from low-frequency techniques to broadband spectroscopy and high-frequency imaging. Meas. Sci. Technol. 2013, 24, 01200. [Google Scholar] [CrossRef]
- Yagihara, S. Chapter 8: Dynamics of water, biomaterials, and skin investigated by means of dielectric relaxation spectroscopy. In Nano/Micro Science and Technology in Biorheology; Kita, R., Dobashi, T., Eds.; Springer: Tokyo, Japan, 2015; pp. 183–213. [Google Scholar] [CrossRef]
- Saito, H.; Kato, S.; Matsumoto, K.; Umino, Y.; Kita, R.; Shinyashiki, N.; Yagihara, S.; Fukuzaki, M.; Tokita, M. Dynamic behaviors of solvent molecules restricted in poly (acryl amide) gels analyzed by dielectric and diffusion NMR spectroscopy. Gels 2018, 4, 56–72. [Google Scholar] [CrossRef] [PubMed] [Green Version]
- Debye, P. Zur theorie der anomalen dispersion im gebiete der langwelligen elektrischen strahlung. Verh. Dtsch. Phys. Ges. 1913, 15, 777–793. [Google Scholar]
- Fröhlich, H. Theory of Dielectrics: Dielectric Constant and Dielectric Loss (Monographs on the Physics and Chemistry of Materials), 2nd ed.; Clarendon Press: Oxford, UK, 1986. [Google Scholar]
- Hill, N.E.; Vaughan, W.E.; Price, A.E.; Davies, M. Dielectric Proper-Ties and Molecular Behaviors; Van Nostrand Reinhold: London, UK, 1969. [Google Scholar]
- McCrum, N.G.; Read, B.E.; Williams, G. Anelastic and Dielectric Effects in Polymeric Solids; Wiley: New York, NY, USA, 1967. [Google Scholar]
- Kremer, F.; Schoenhals, A. (Eds.) Broadband Dielectric Spectroscopy; Springer: Berlin/Heidelberg, Germany, 2002. [Google Scholar]
- Nakano, S.; Ogiso, T.; Kita, R.; Shinyashiki, N.; Yagihara, S.; Yoneyama, M.; Katsumoto, Y. Thermoreversible Gelation of Isotactic-rich Poly(N-isopropylacrylamide) in Water. J. Chem. Phys. 2011, 135, 114930. [Google Scholar] [CrossRef] [PubMed]
- Ishai, P.B.; Talary, M.S.; Caduff, A.; Levy, E.; Feldman, Y. Electrode polarization in dielectric measurements. Meas. Sci. Technol. 2013, 24, 102001. [Google Scholar] [CrossRef]
- Cole, K.S.; Cole, R.H. Dispersion and Absorption in Dielectrics I. Alternating Current Characteristics. J. Chem. Phys. 1941, 9, 341–351. [Google Scholar] [CrossRef] [Green Version]
- Hosoi, Y.; Kita, R.; Shinyashiki, N.; Yagihara, S. Dielectric study of liposome dispersion using statistical analysis of jitter. Trans. Mater. Res. Soc. Japan 2010, 35, 861–864. [Google Scholar] [CrossRef] [Green Version]
- Kundu, S.K.; Choe, S.; Sasaki, K.; Kita, R.; Shinyashiki, N.; Yagihara, S. Relaxation dynamics of liposome in an aqueous solution. Phys. Chem. Chem. Phys. 2015, 17, 18449–18455. [Google Scholar] [CrossRef] [PubMed]
- Yagihara, S.; Kita, R.; Shinyashiki, N.; Saito, H.; Maruyama, Y.; Kawaguchi, T.; Shoji, K.; Saito, T.; Aoyama, T.; Shimazaki, K. Physical Meanings of Fractal Behaviors of Water in Aqueous and Biological Systems with Open-Ended Coaxial Electrodes. Sensors 2019, 19, 2606. [Google Scholar] [CrossRef] [Green Version]
- Miyachi, N.; Iwama, T.; Matsumoto, K.; Imoto, T.; Kashino, T. The low -molecular-weight hydrogelator, “Nanofiber gel”. Fine Chem. 2012, 41, 32–39. [Google Scholar]
- Matsumoto, M. Part 1. Chapter 4: Electrocapillarity and Double Layer Structure. In Electical Phenomena at Interfaces: Fundamentals, Measurements and Applications (Surfactant Science Book 76), 2nd ed.; Ohshima, H., Furusawa, K., Eds.; Marcel Dekker: New York, NY, USA, 1998; pp. 87–99. [Google Scholar]
- Gaudin, T.; Rotureau, P.; Pezron, I.; Fayet, G. Investigating the impact of sugar-based surfactants structure on surface tension at critical micelle concentration with structure-property relationships. J. Col. Interf. Sci. 2018, 516, 162–171. [Google Scholar] [CrossRef]
- Gaudin, T.; Lu, H.; Fayet, G.; Berthauld-Drelich, G.; Rotureau, P.; Pourceau, G.; Wadouachi, A.; Van Hecke, E.; Nesterenko, A.; Pezron, I. Impact of the chemical structure on amphiphilic properties of sugar-based surfactants: A literature overview. Adv. Coll. Inter. Sci. 2019, 270, 87–199. [Google Scholar] [CrossRef]
- Unilever PLC; Unilever NV. Detergent Compositions Comprising Nonionic Glycolipid Surfactants. Patent EP0550278, 7 July 1993. [Google Scholar]
- Kyushu University; Nissan Chemical Industries, Ltd. Aqueous Sodium Ion Secondary Batteries. Patent WO2016129677, 18 August 2016. [Google Scholar]


Disclaimer/Publisher’s Note: The statements, opinions and data contained in all publications are solely those of the individual author(s) and contributor(s) and not of MDPI and/or the editor(s). MDPI and/or the editor(s) disclaim responsibility for any injury to people or property resulting from any ideas, methods, instructions or products referred to in the content. |
© 2023 by the authors. Licensee MDPI, Basel, Switzerland. This article is an open access article distributed under the terms and conditions of the Creative Commons Attribution (CC BY) license (https://creativecommons.org/licenses/by/4.0/).
Share and Cite
Shimizu, K.; Abe, F.; Kishi, Y.; Kita, R.; Shinyashiki, N.; Yagihara, S. Dielectric Study on Supramolecular Gels by Fiber Structure Formation from Low-Molecular-Weight Gelator/Water Mixtures. Gels 2023, 9, 408. https://doi.org/10.3390/gels9050408
Shimizu K, Abe F, Kishi Y, Kita R, Shinyashiki N, Yagihara S. Dielectric Study on Supramolecular Gels by Fiber Structure Formation from Low-Molecular-Weight Gelator/Water Mixtures. Gels. 2023; 9(5):408. https://doi.org/10.3390/gels9050408
Chicago/Turabian StyleShimizu, Kenta, Fumiya Abe, Yasuhiro Kishi, Rio Kita, Naoki Shinyashiki, and Shin Yagihara. 2023. "Dielectric Study on Supramolecular Gels by Fiber Structure Formation from Low-Molecular-Weight Gelator/Water Mixtures" Gels 9, no. 5: 408. https://doi.org/10.3390/gels9050408