
A LC-QTOF Method for the Determination of PEGDE Residues in Dermal Fillers
 , , ,
, , ,
Abstract
:
1. Introduction
2. Results and Discussion
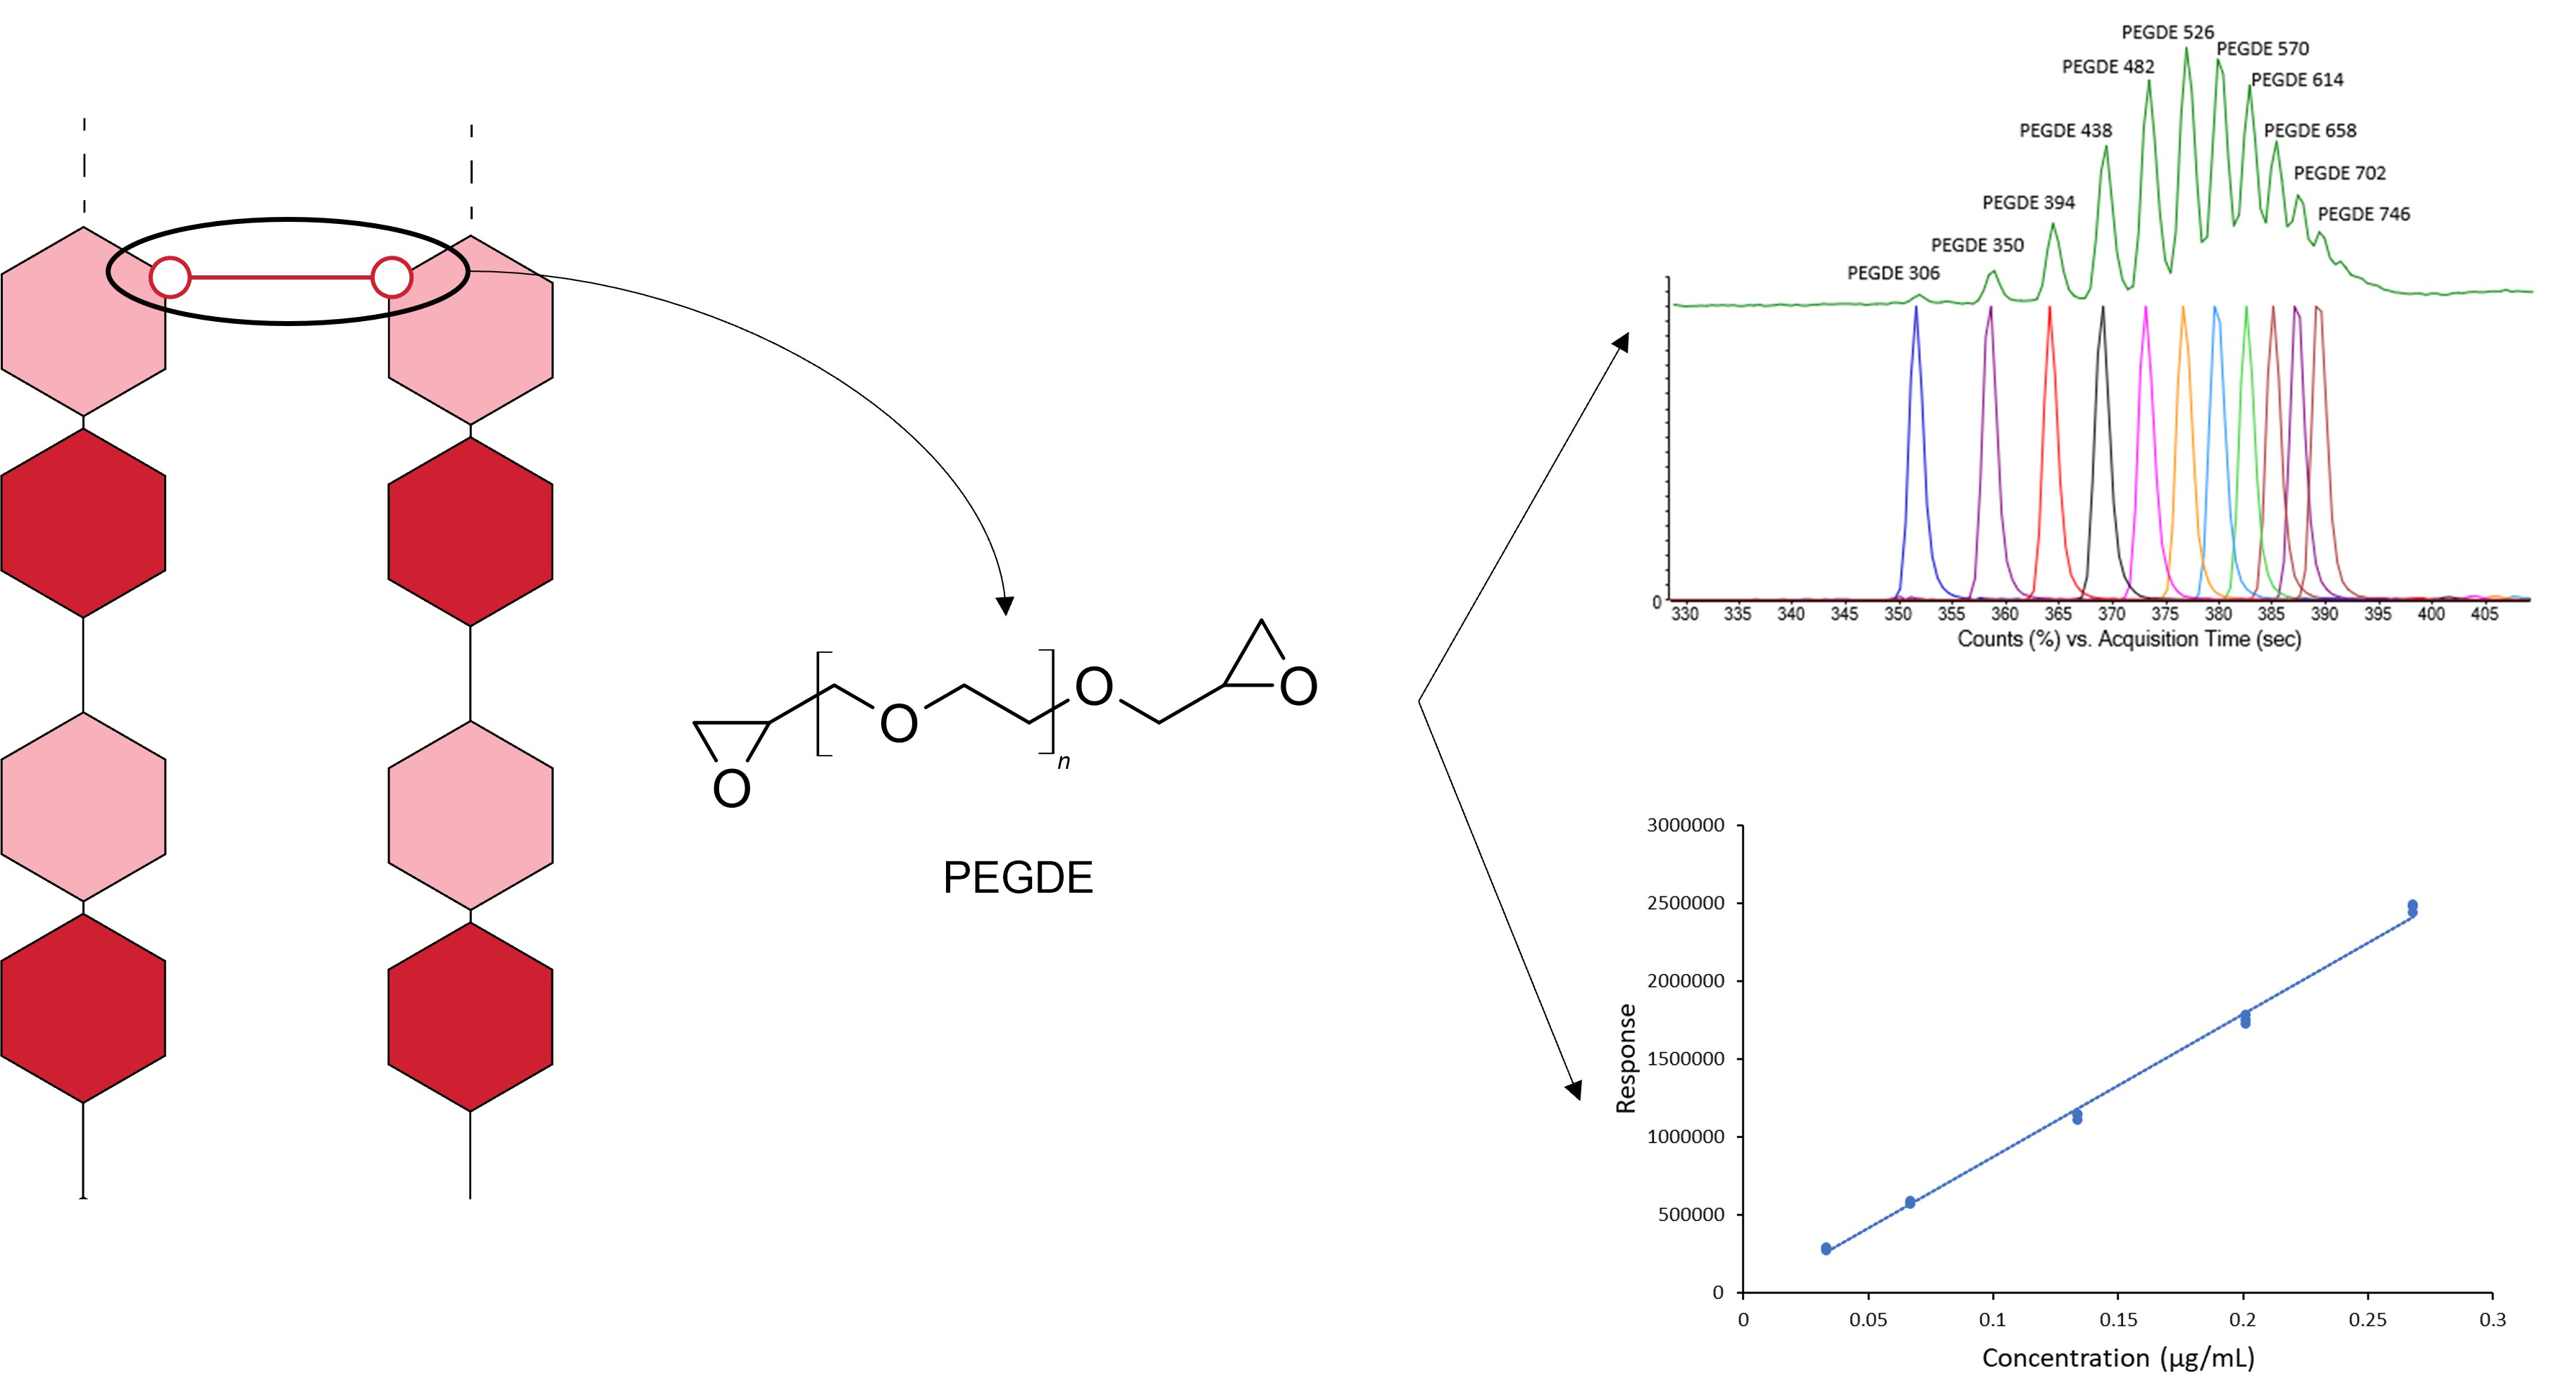
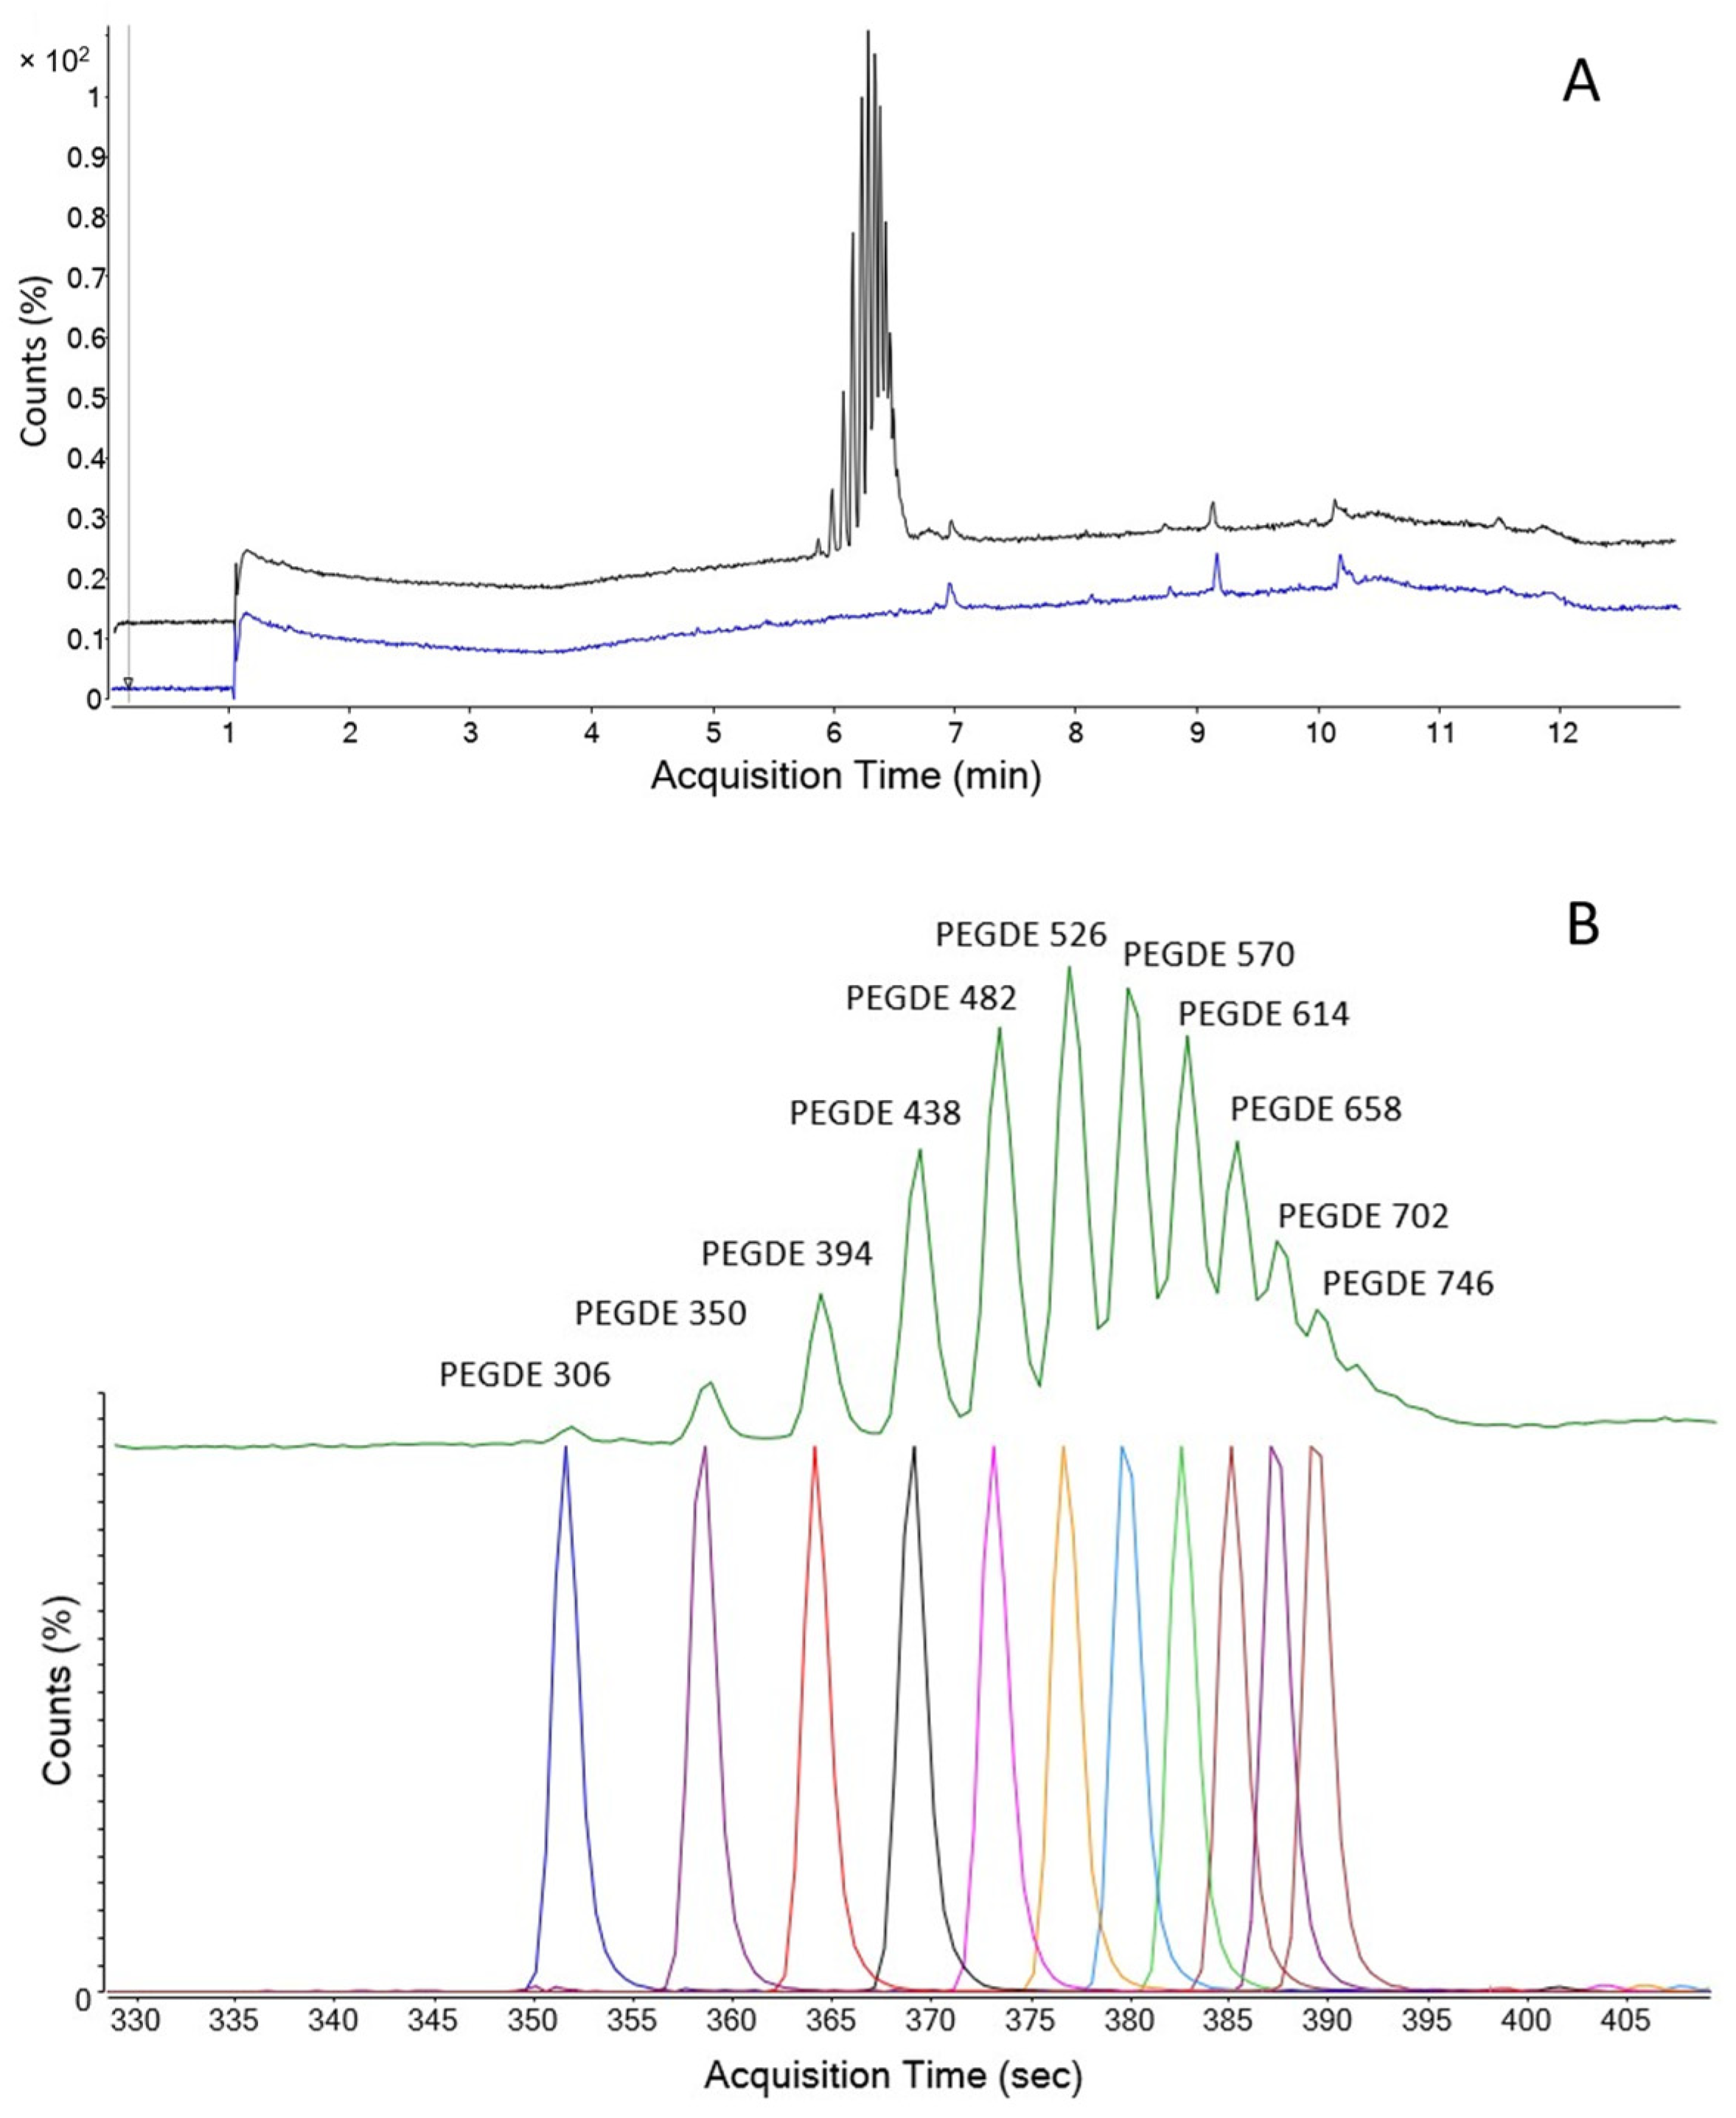
2.1. PEGDE Reference
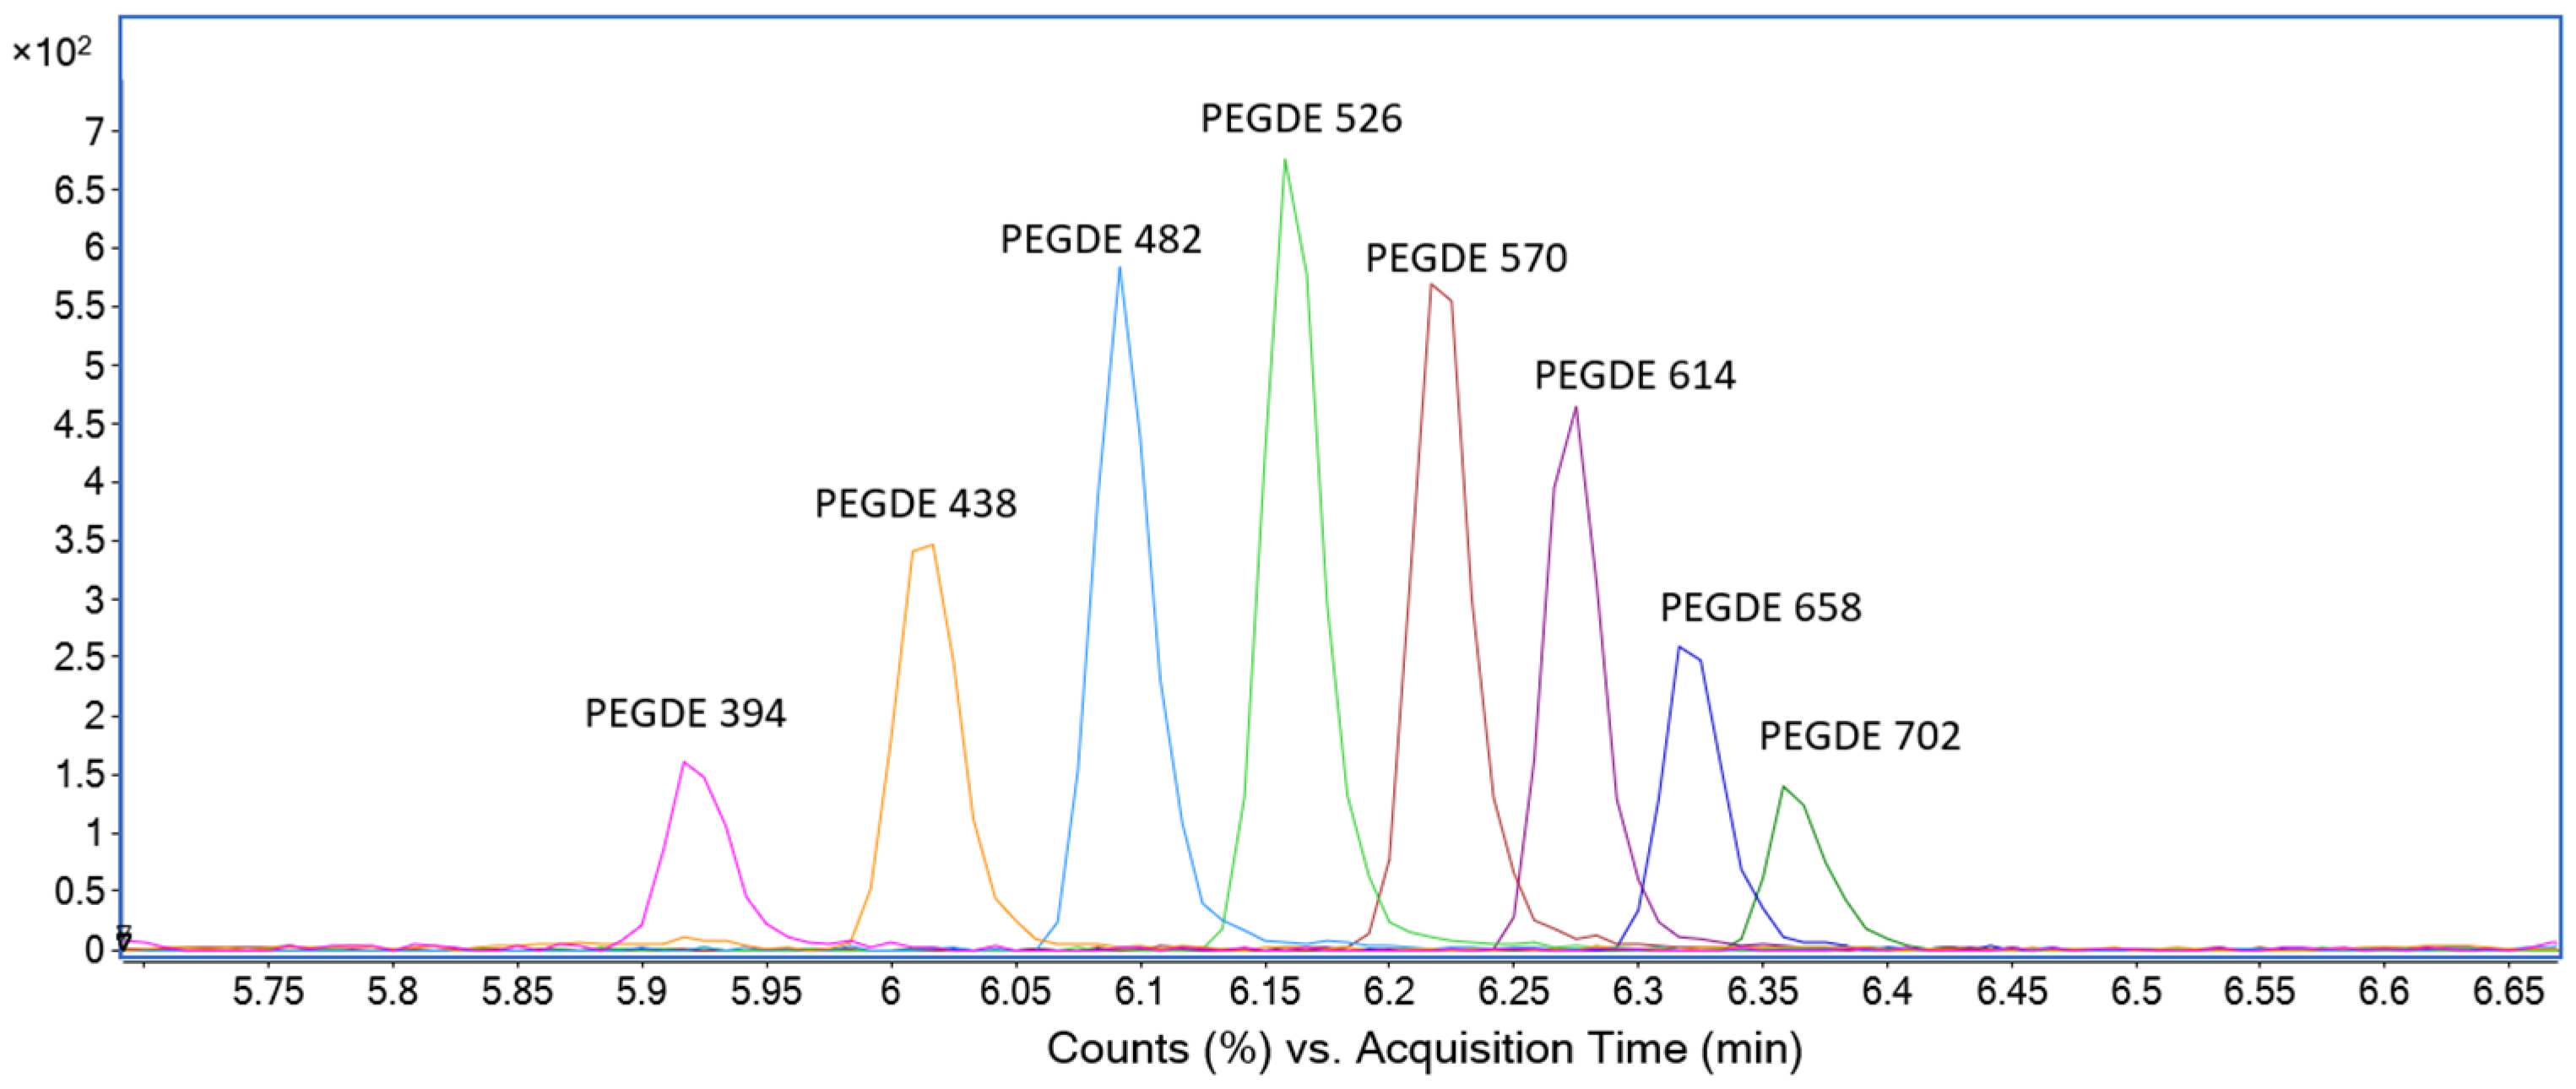
2.2. Target Selection
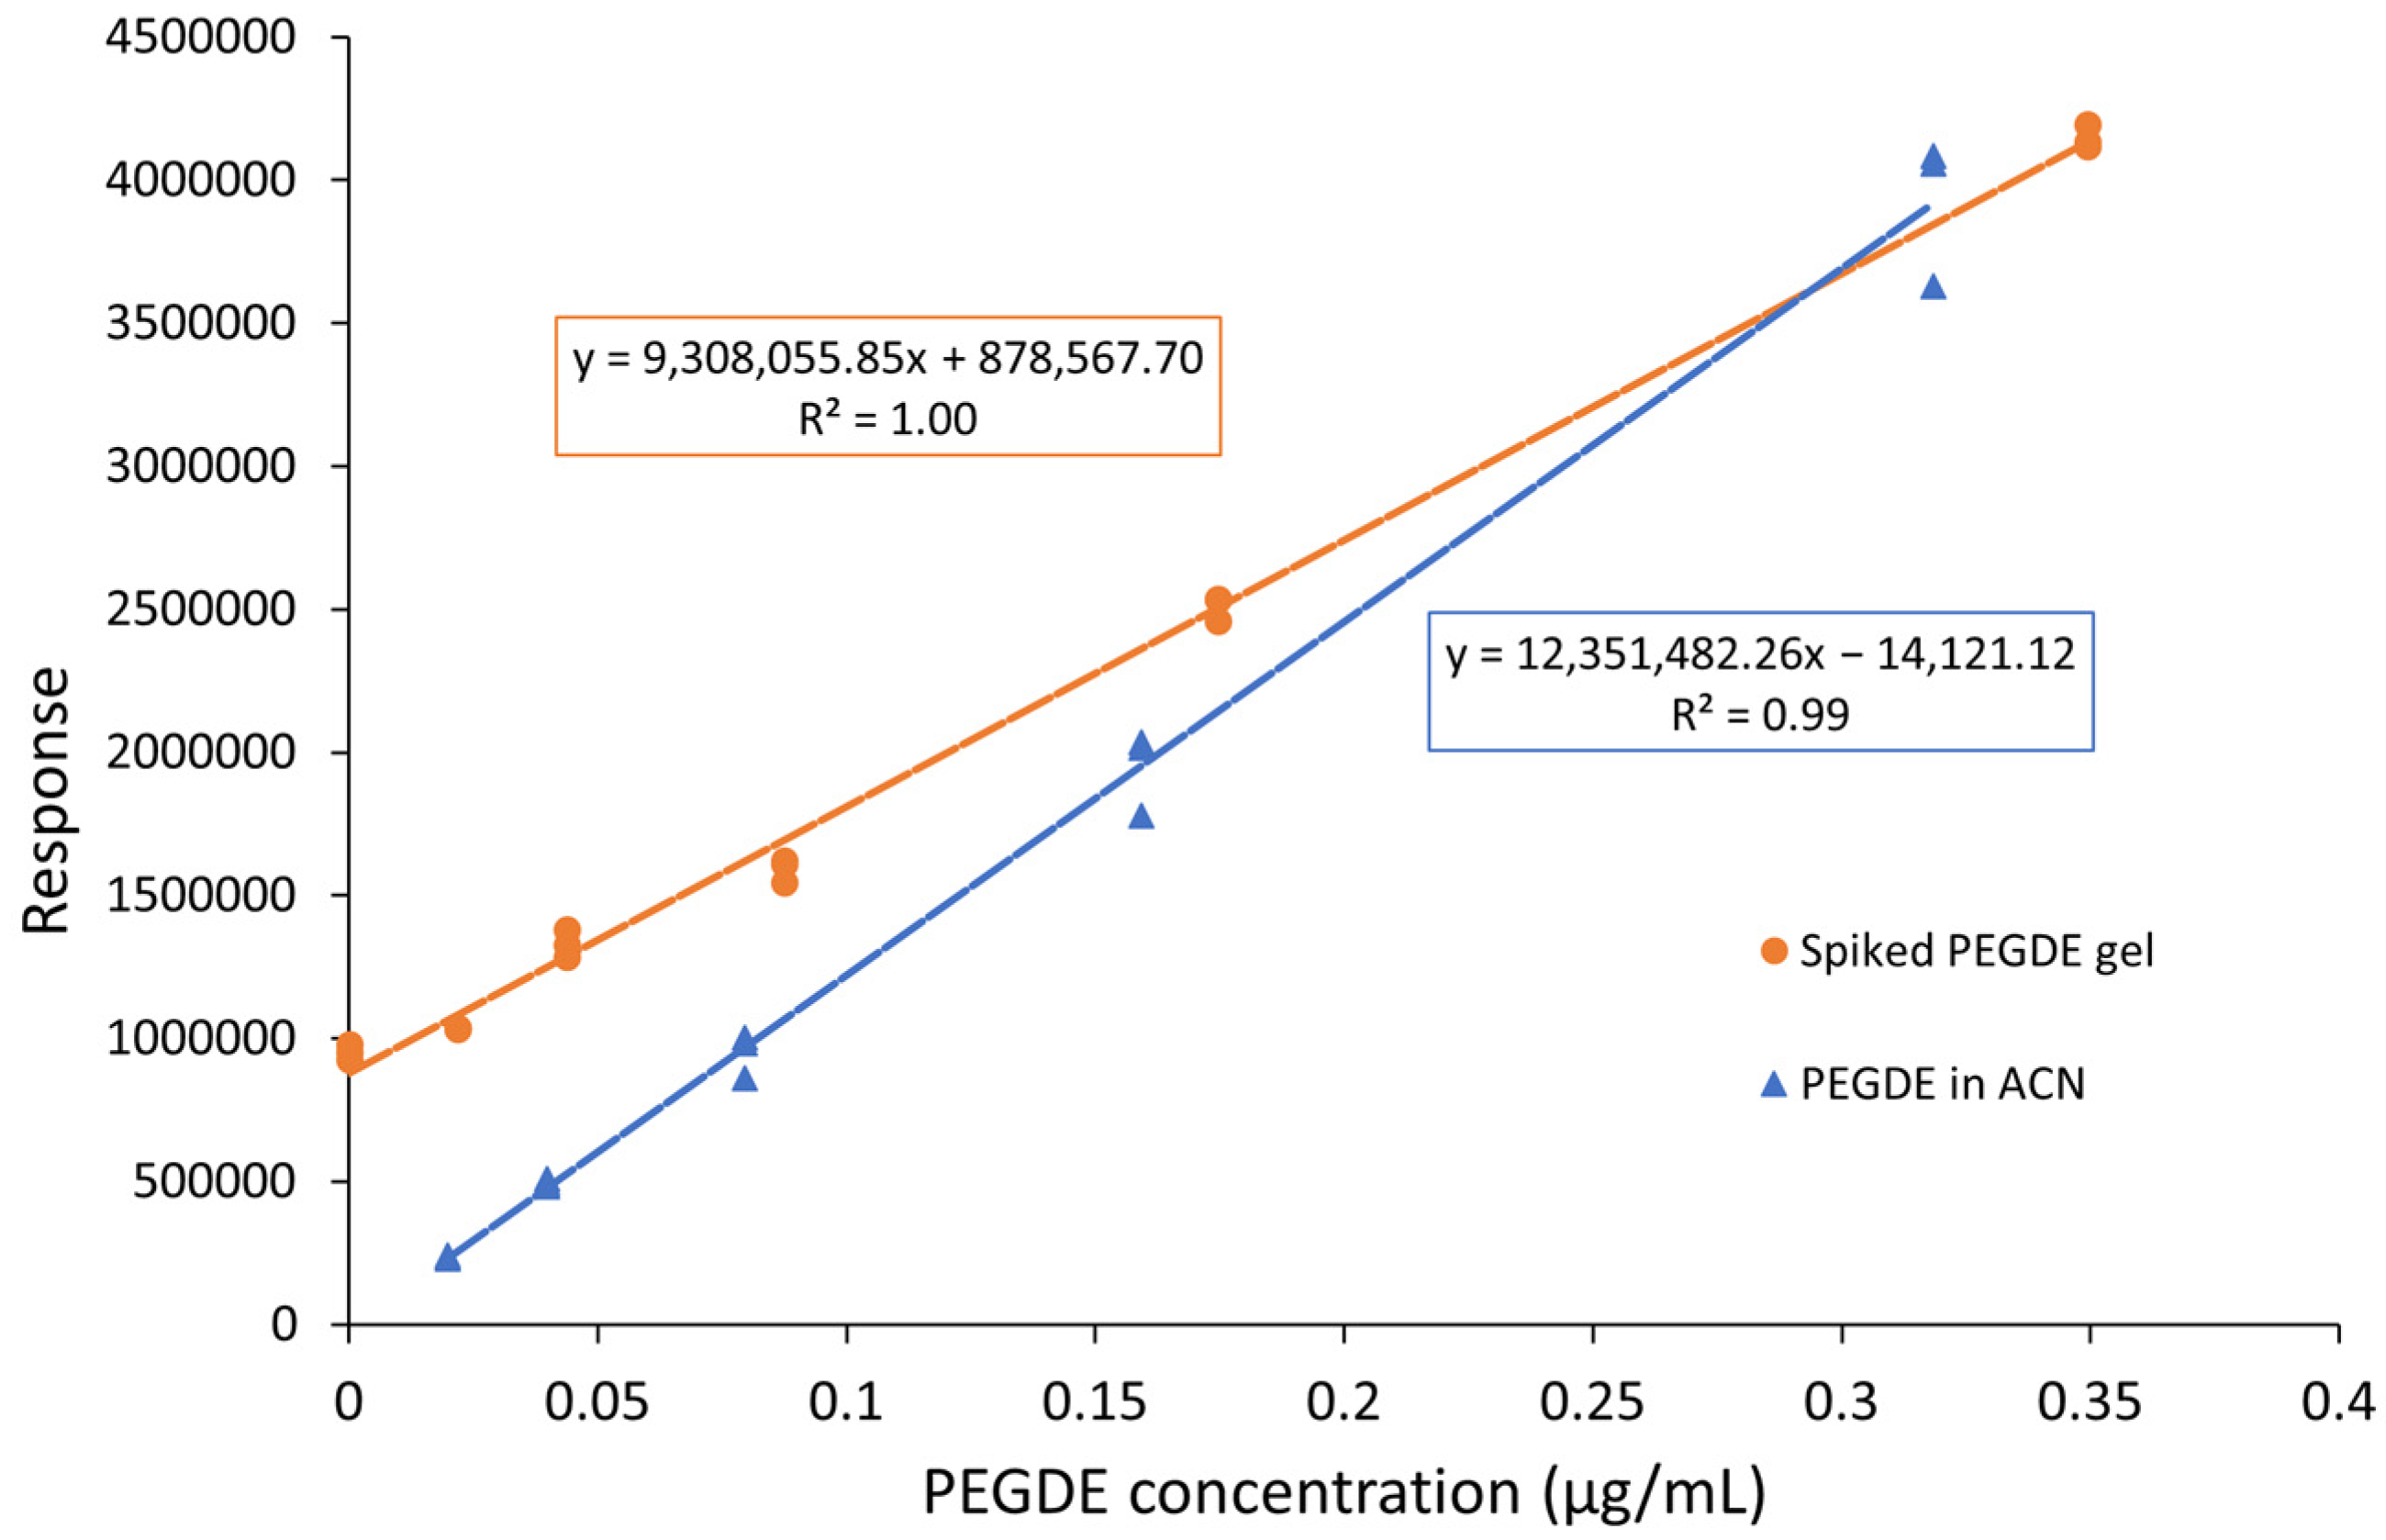
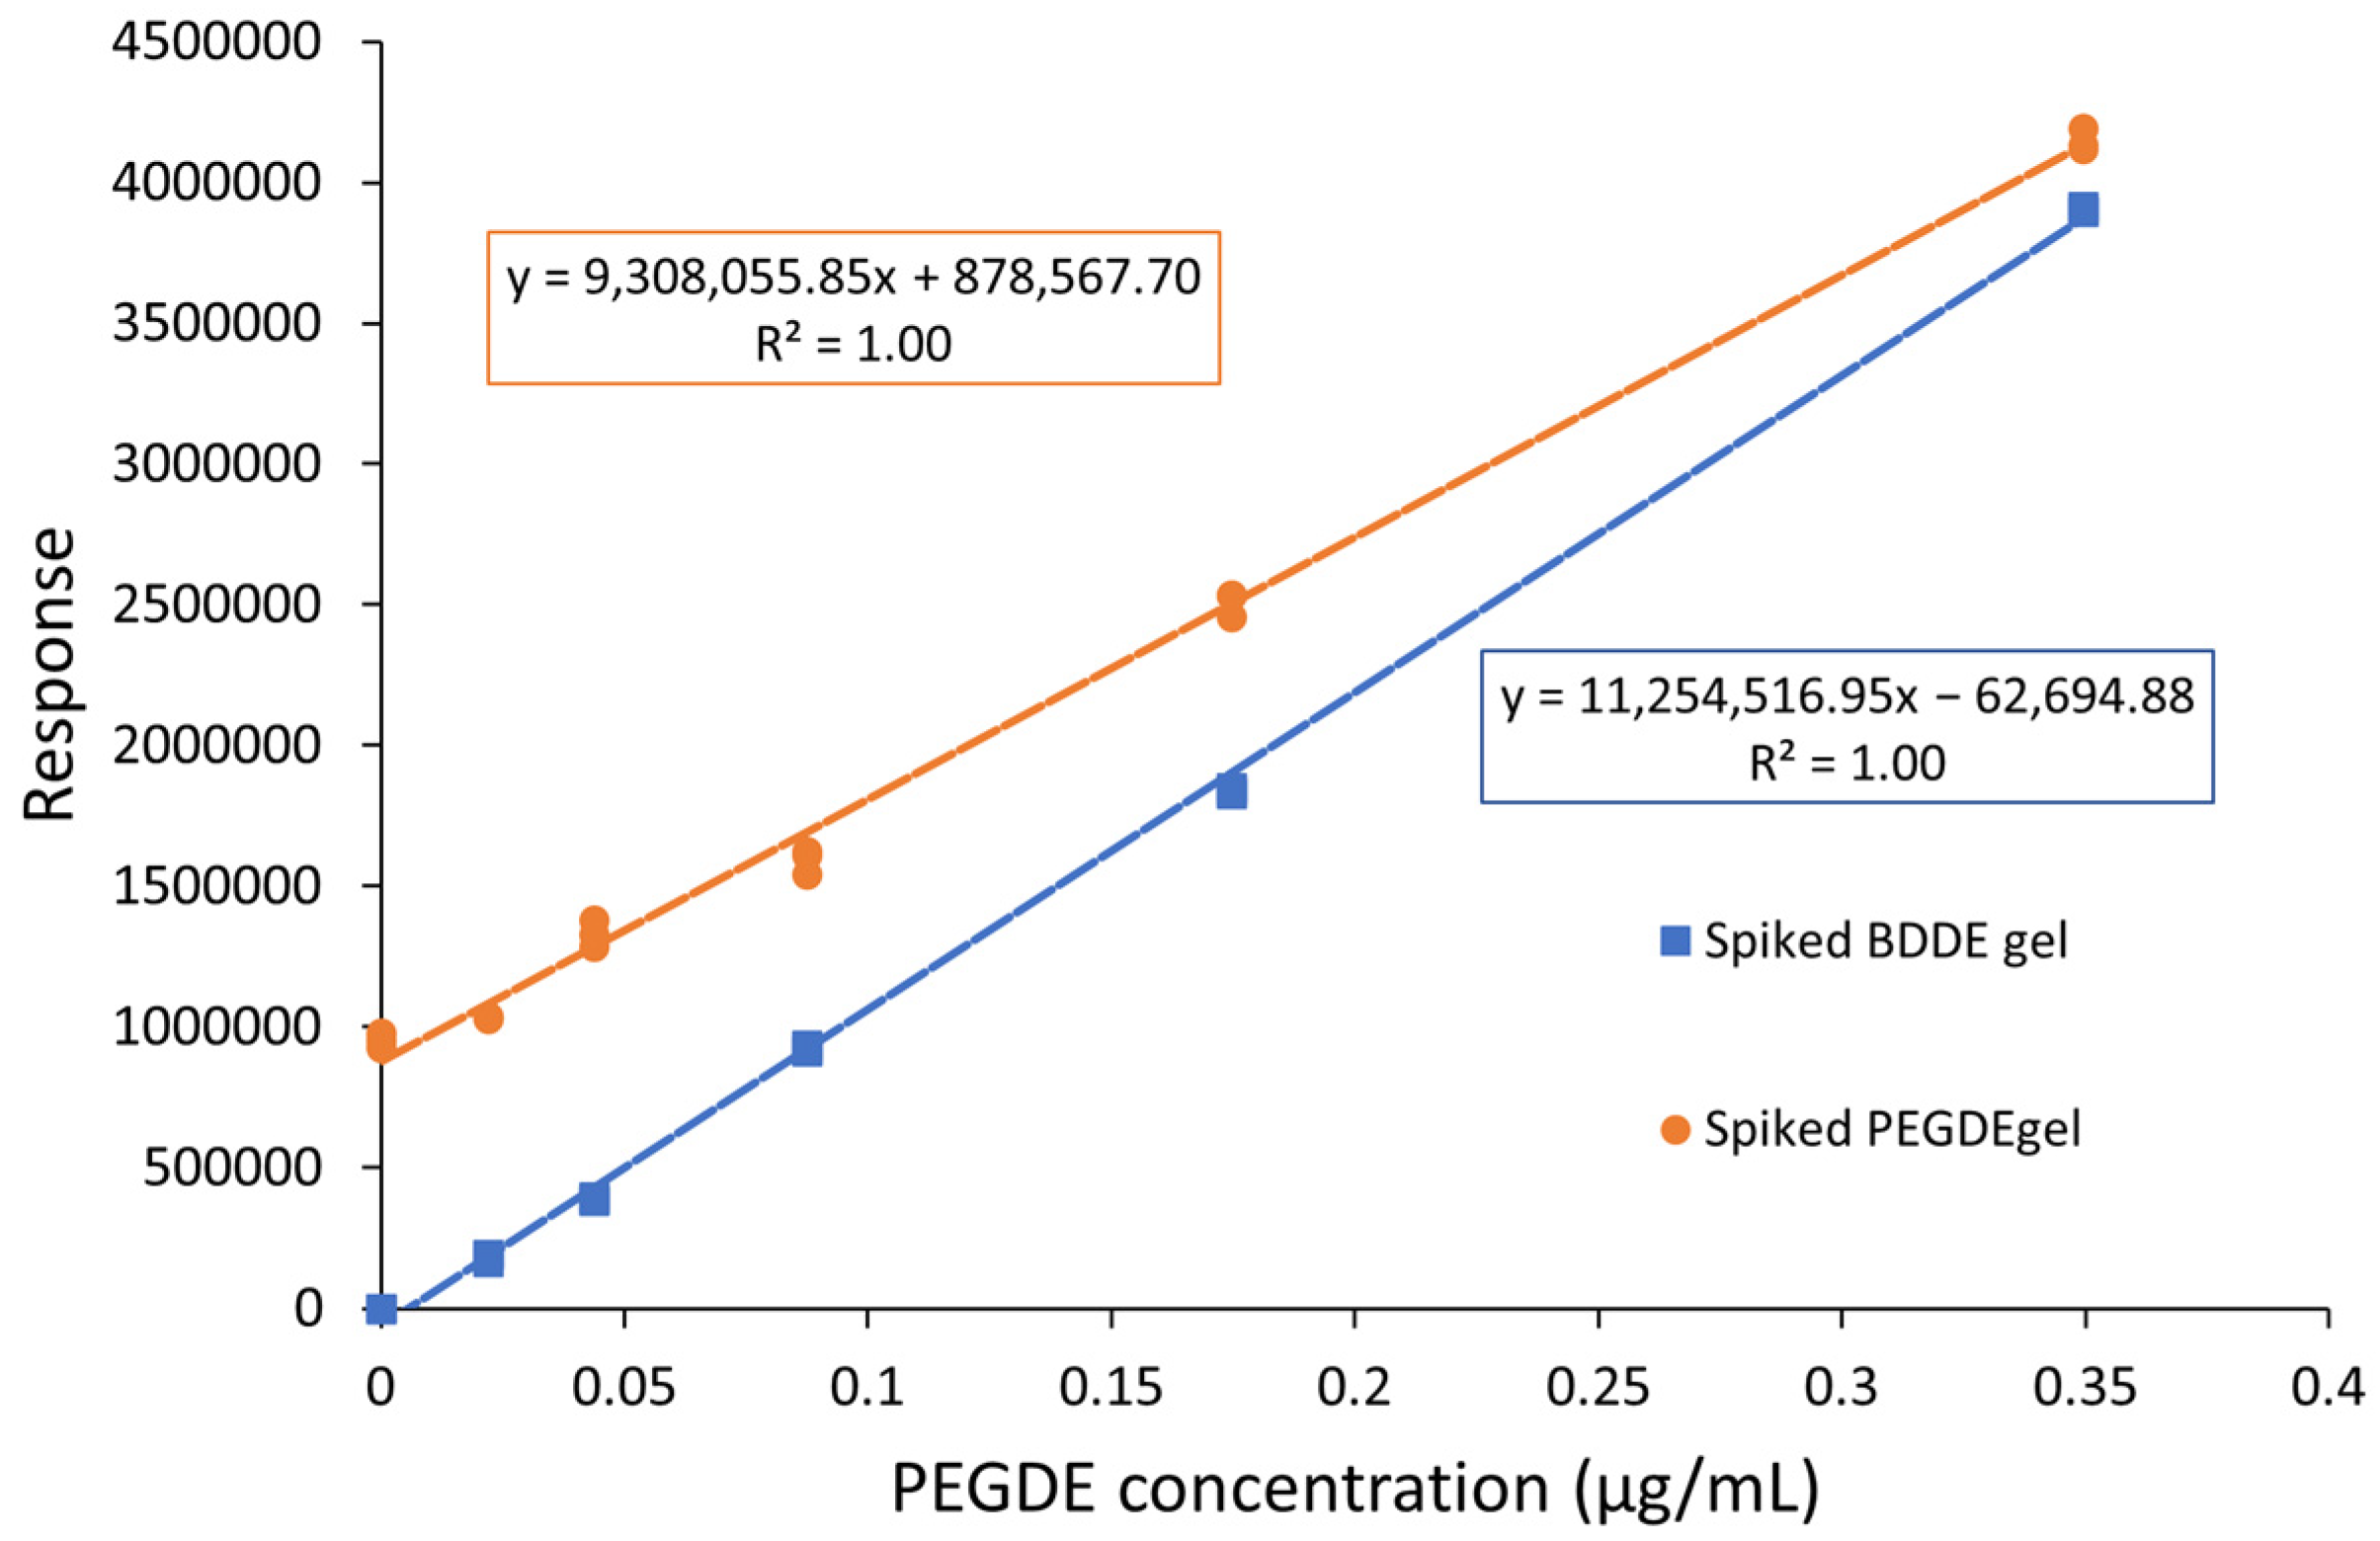
2.3. Matrix Effect
2.4. Method Validation
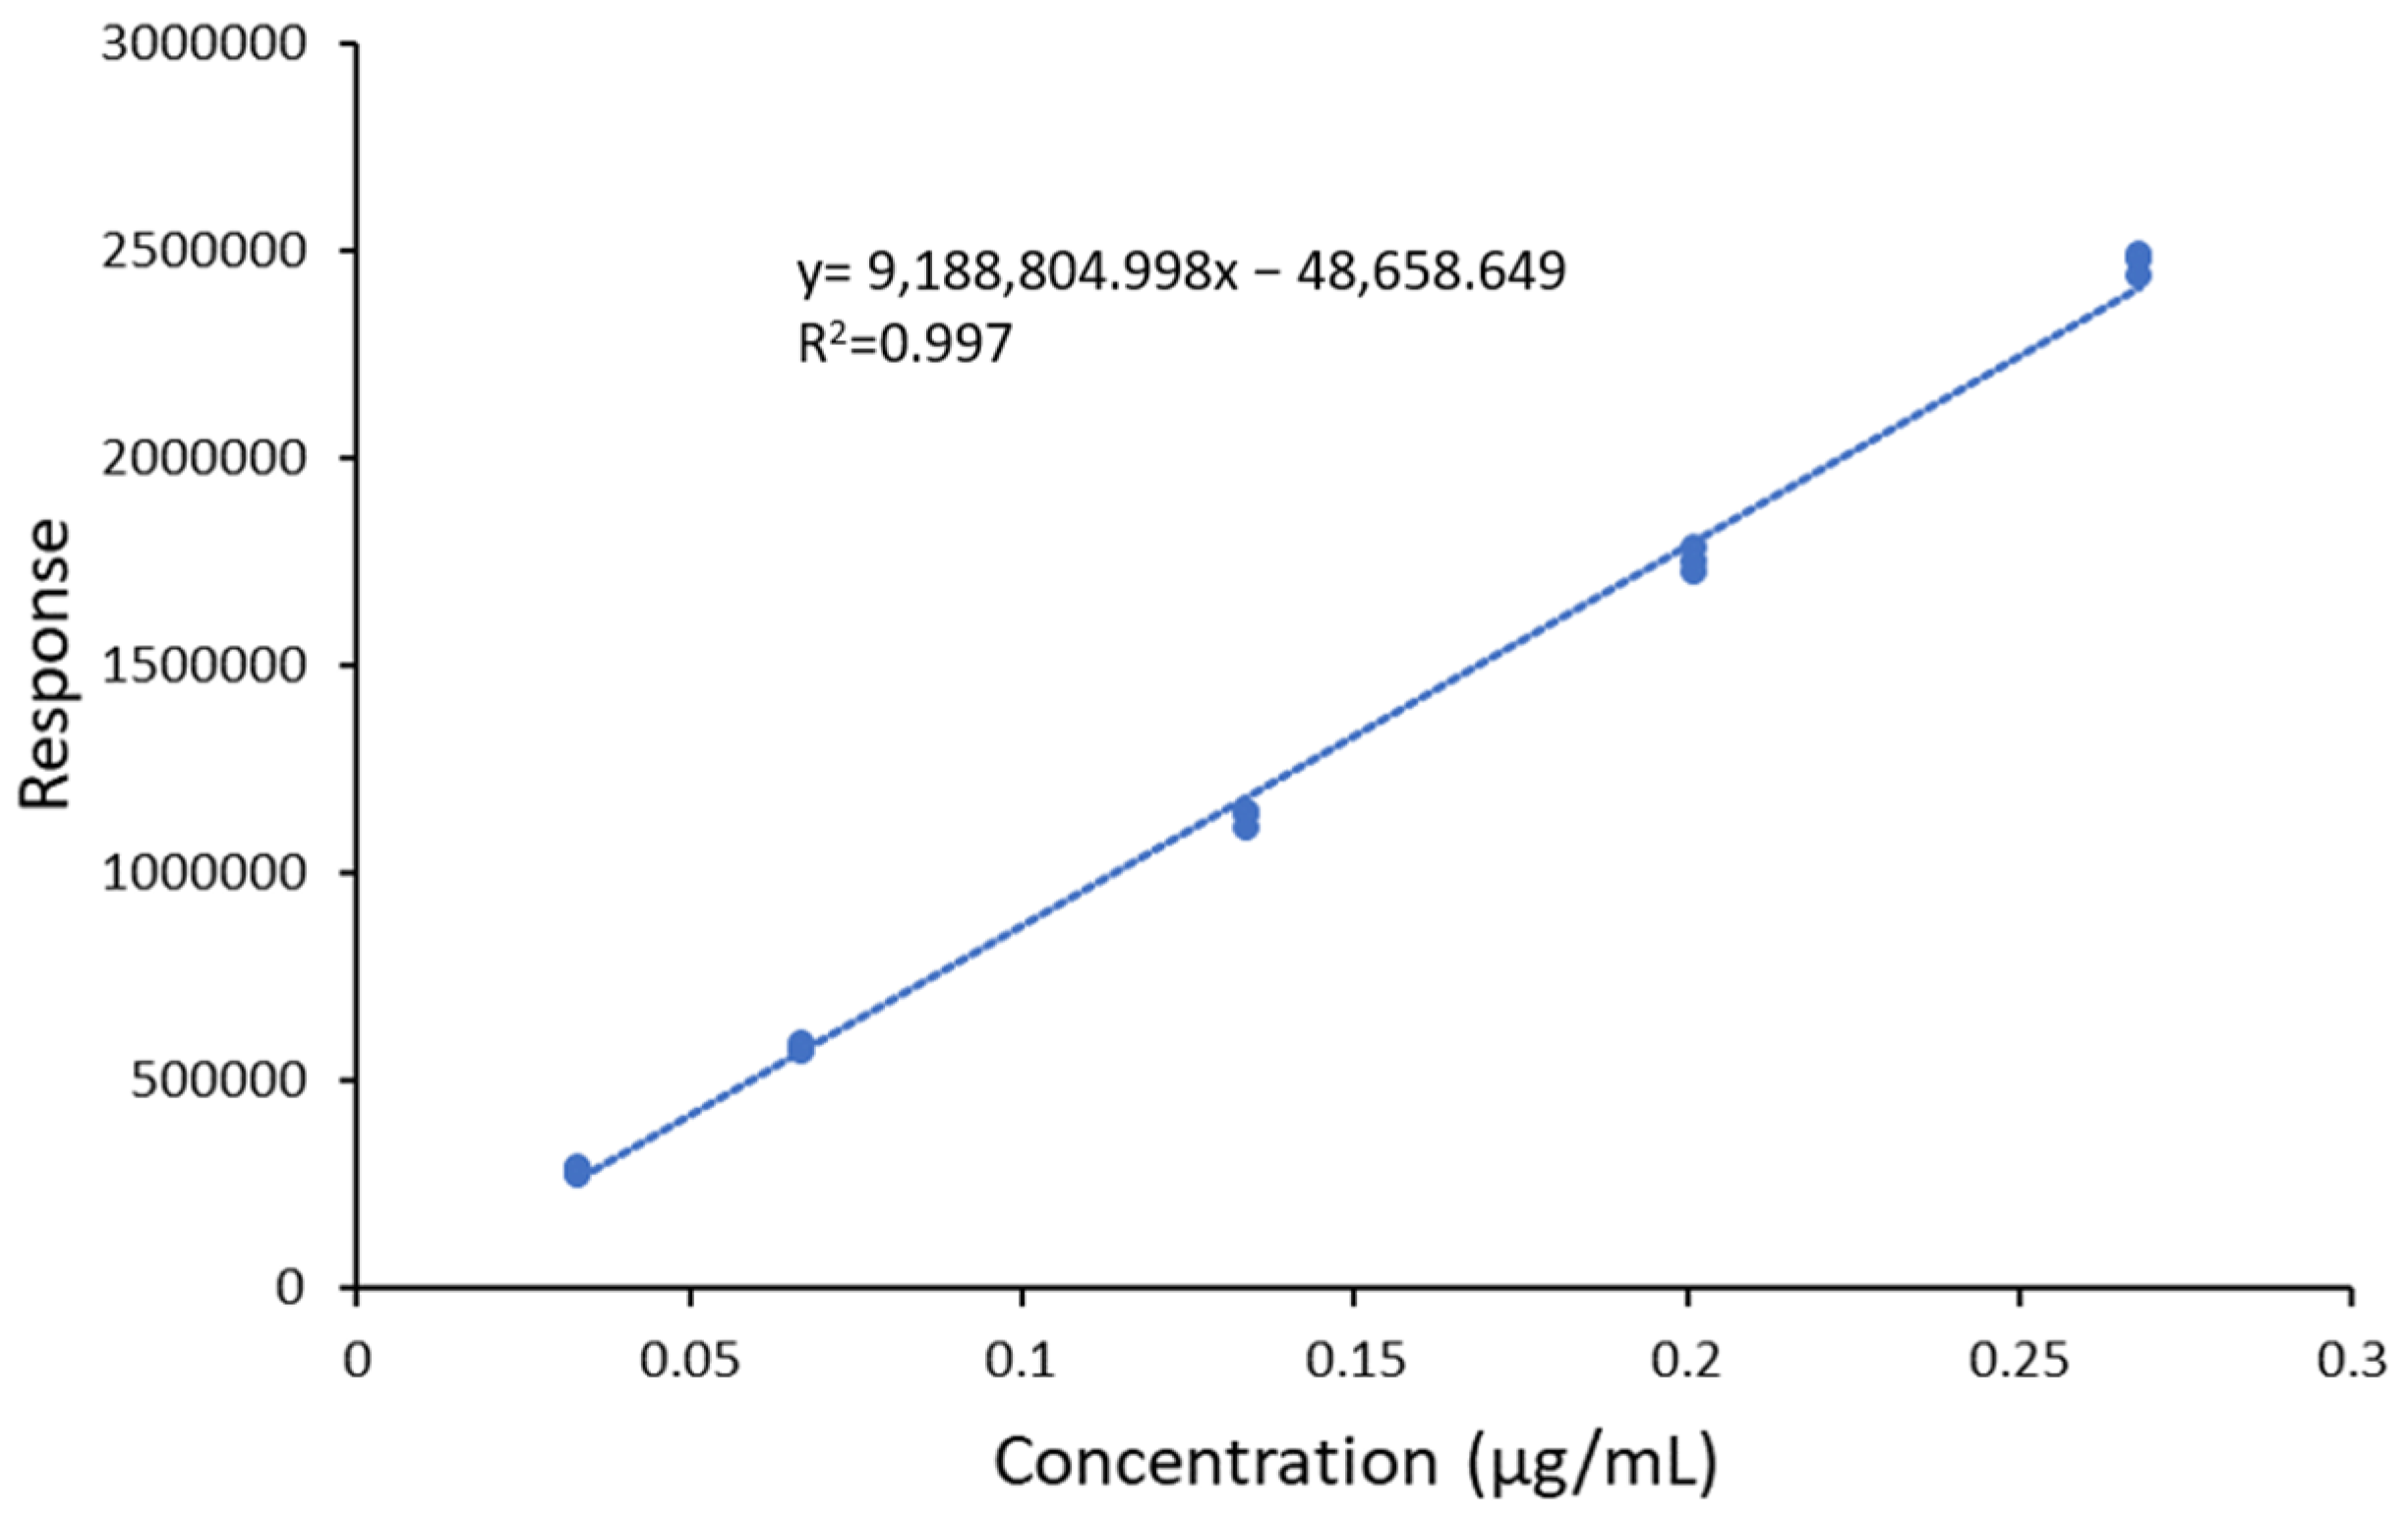
2.4.1. Linearity and Range
2.4.2. LOD and LOQ
2.4.3. Precision
2.4.4. Accuracy
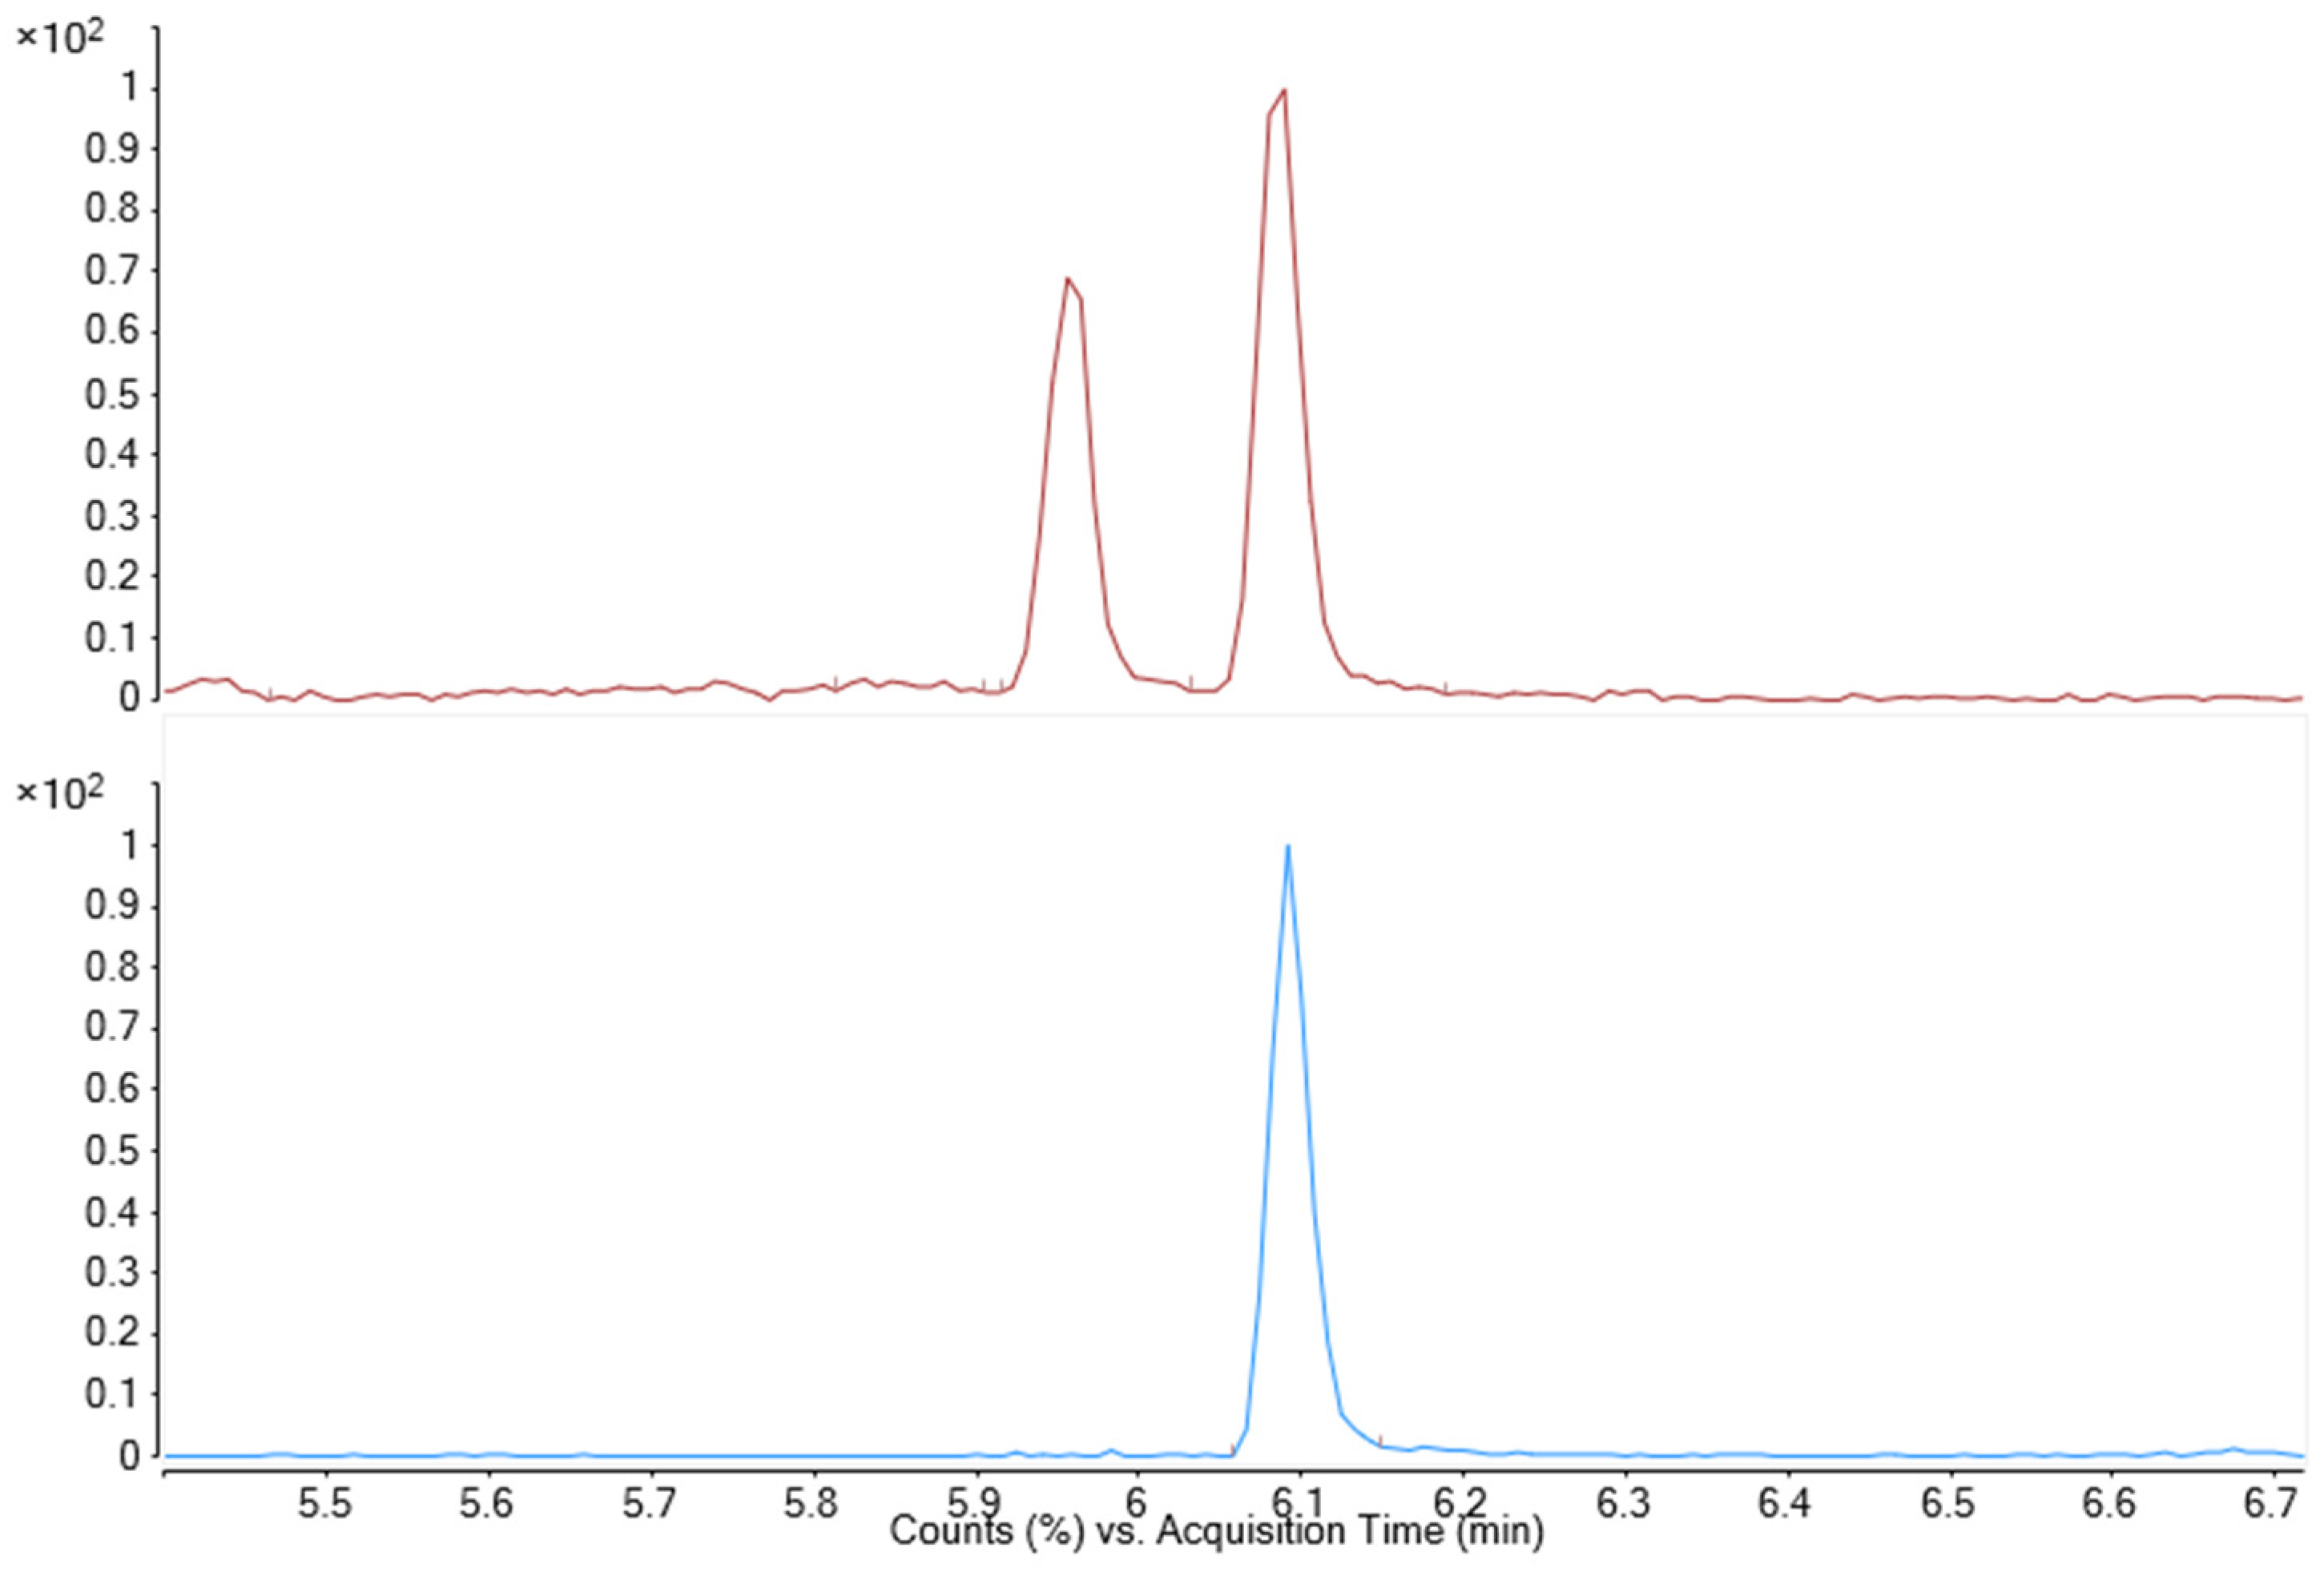
2.4.5. Specificity
3. Conclusions
4. Materials and Methods
4.1. Standards and Reagents
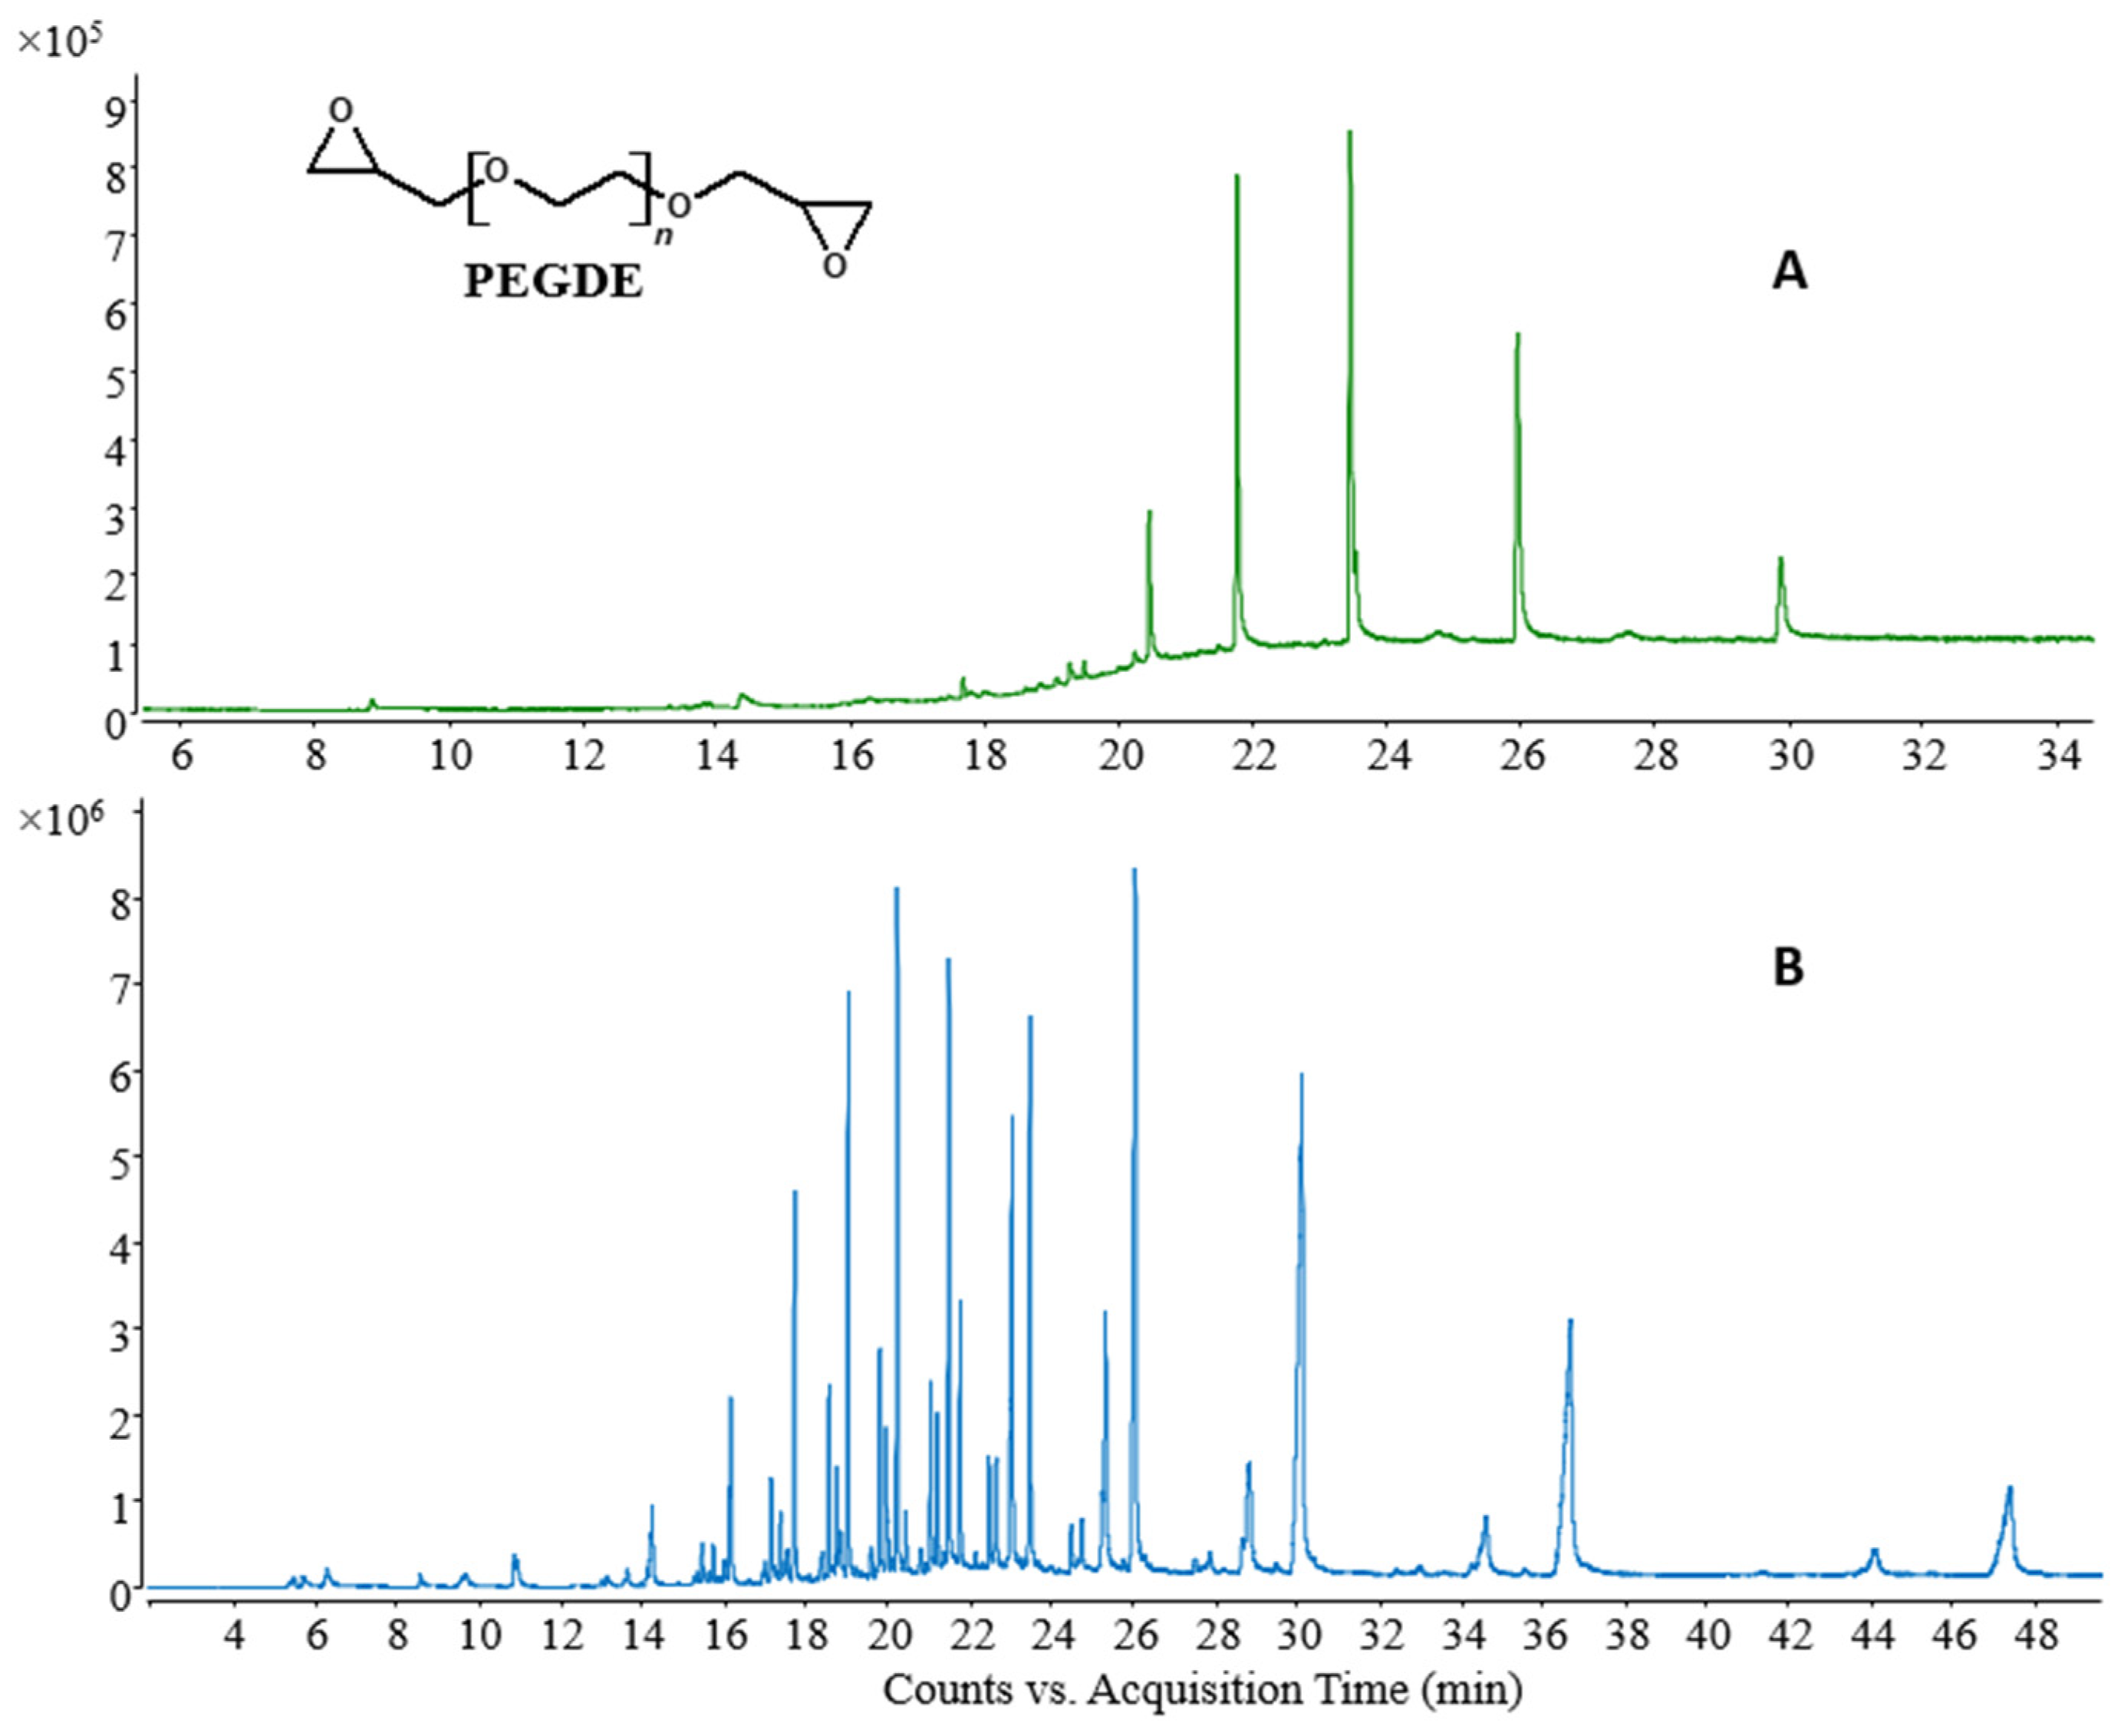
4.2. Py-GC-MS
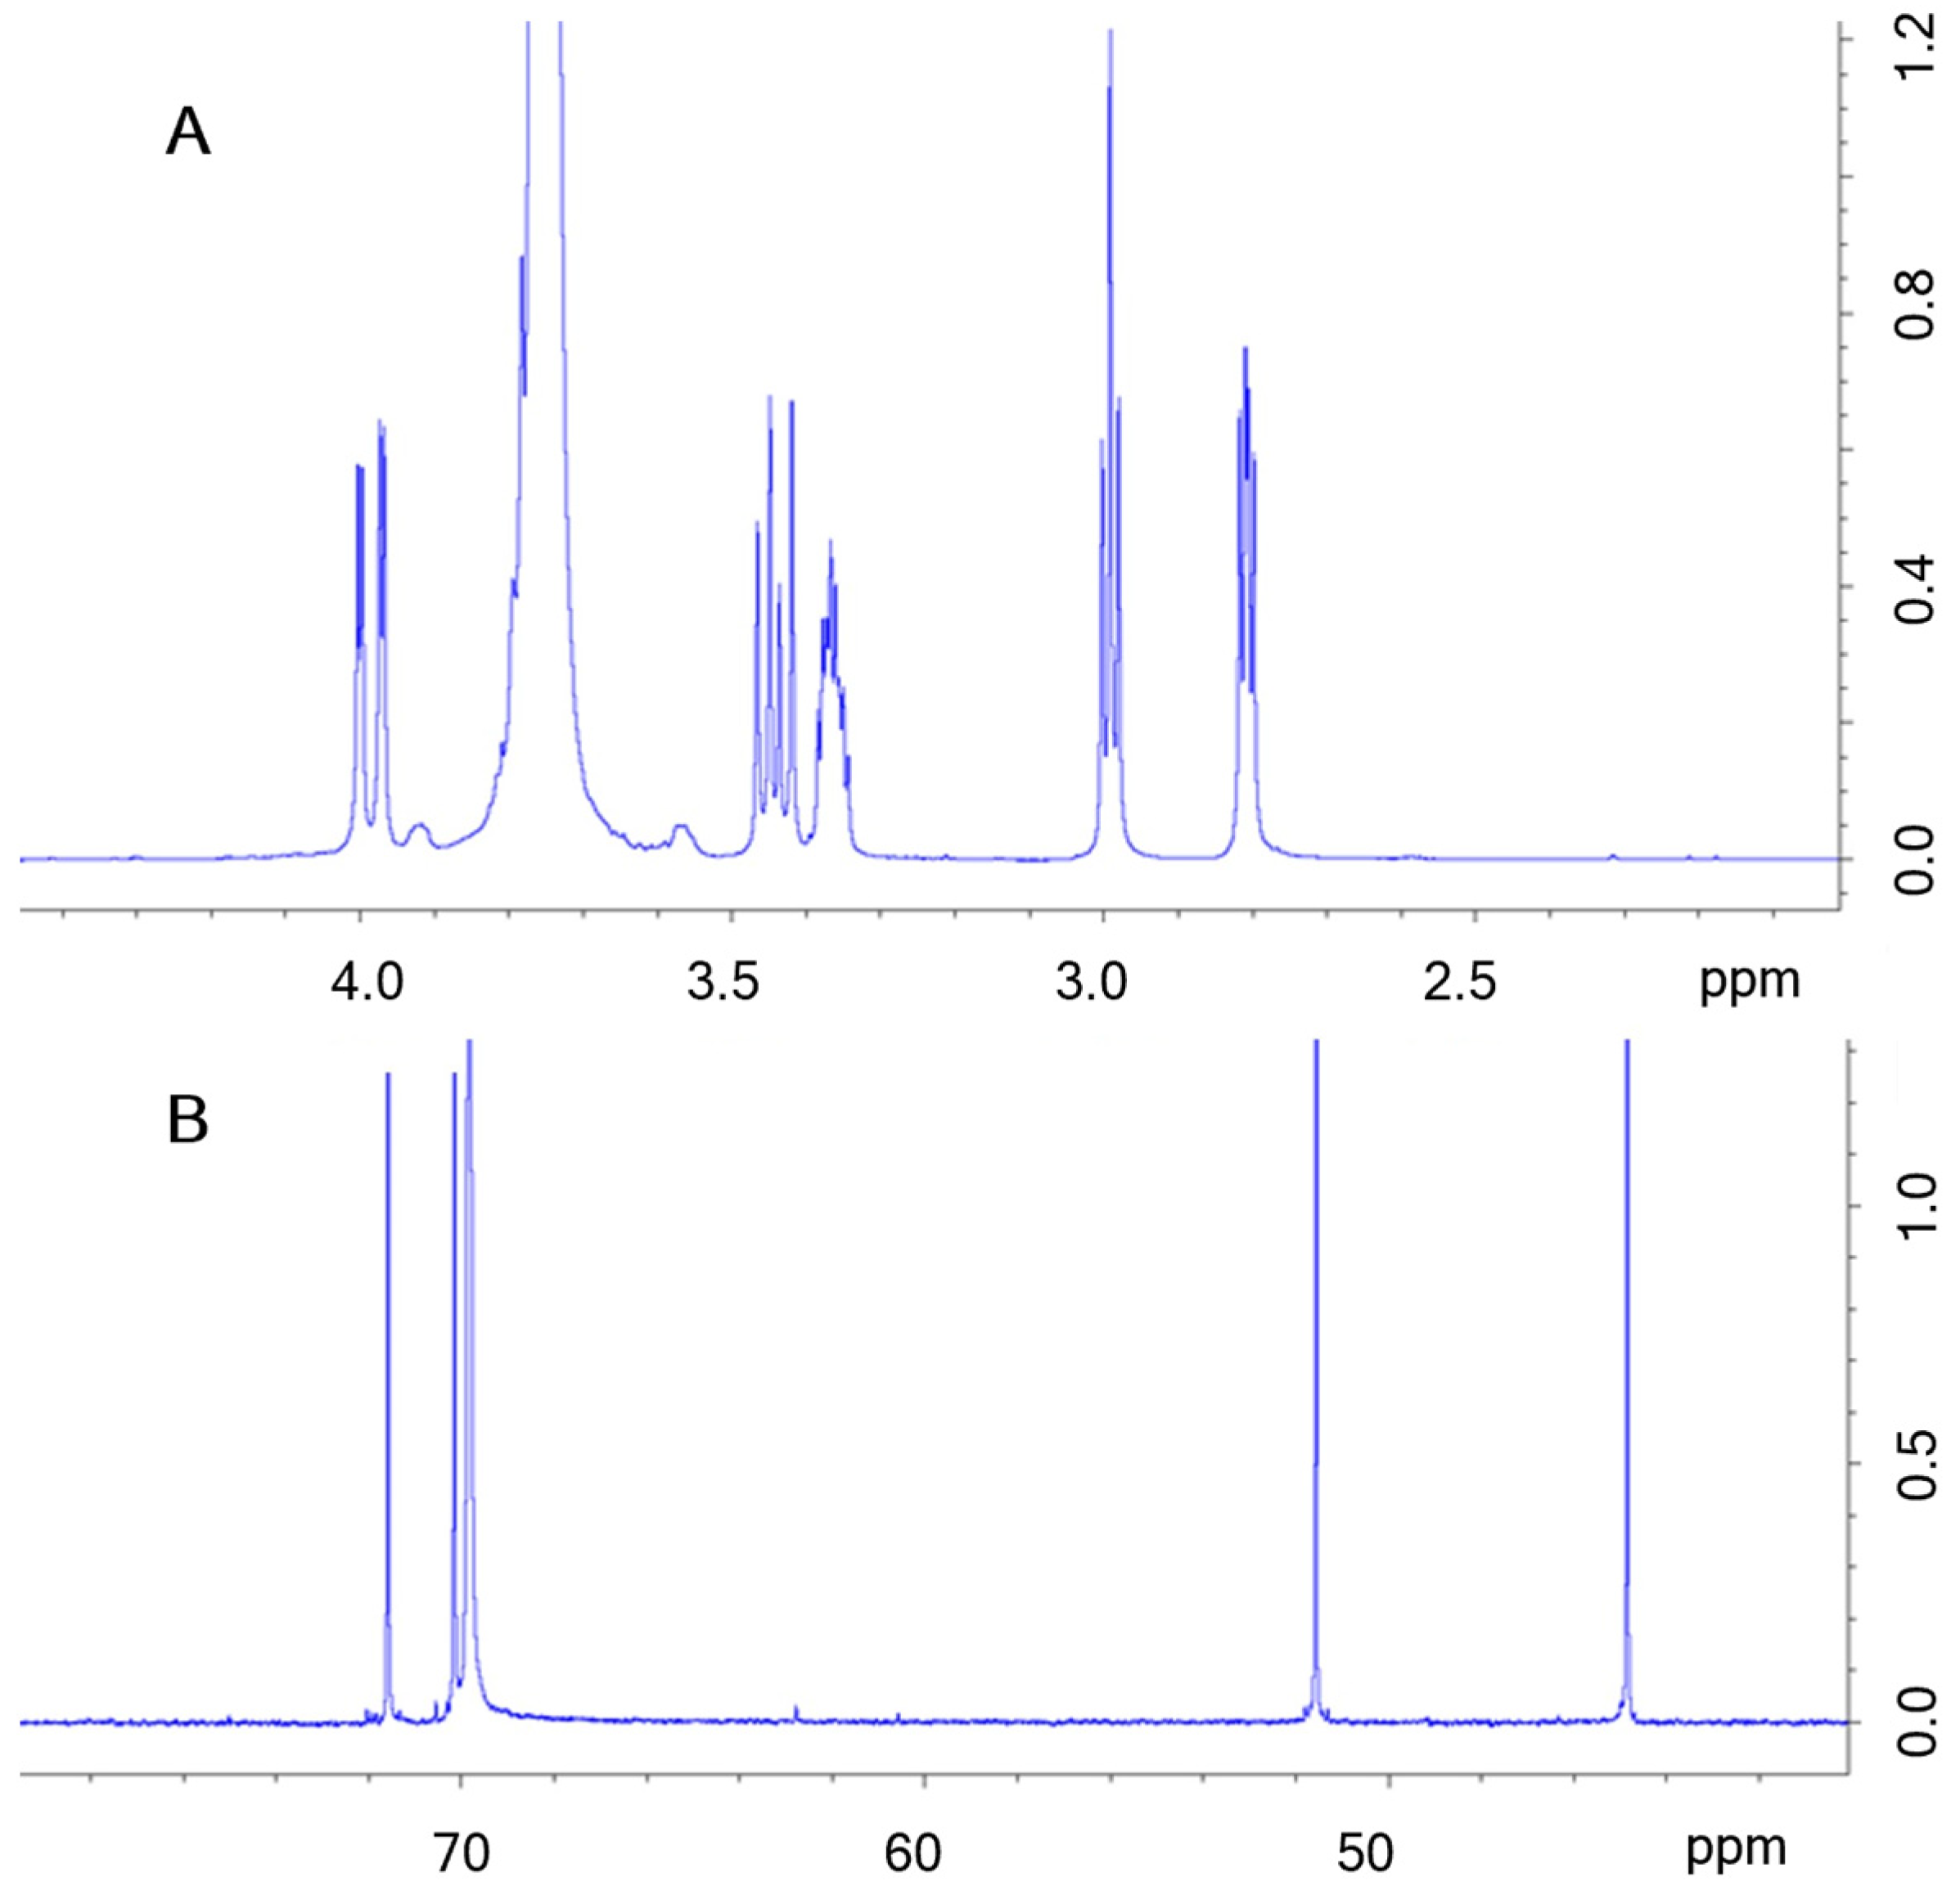
4.3. Nucler Magnetic Resonance Spectra
4.4. Matrix Effect
4.4.1. PEGDE Reference Solutions (Acetonitrile)
4.4.2. Spiked HA-Hydrogels
4.5. Method Validation
4.5.1. BD-HA Calibration Solution
4.5.2. PG-HA Spiked Samples
4.5.3. Sample Preparation and Analytical Conditions
Supplementary Materials
Author Contributions
Funding
Data Availability Statement
Acknowledgments
Conflicts of Interest
References
- Olejnik, A.; Goscianska, J.; Nowak, I. Significance of Hyaluronic Acid in Cosmetic Industry and Aesthetic Medicine. Chemik 2012, 66, 129–135. [Google Scholar]
- Abatangelo, G.; Vindigni, V.; Avruscio, G.; Pandis, L.; Brun, P. Hyaluronic Acid: Redefining Its Role. Cells 2020, 9, 1743. [Google Scholar] [CrossRef]
- Lipko-Godlewska, S.; Bolanča, Ž.; Kalinová, L.; Kermen, I.; Onisak, B.; Papp, I.; Rebrov, M.; Valančienė, G. Whole-Face Approach with Hyaluronic Acid Fillers. Clin. Cosmet. Investig. Dermatol. 2021, 14, 169–178. [Google Scholar] [CrossRef]
- Tezel, A.; Fredrickson, G.H. The Science of Hyaluronic Acid Dermal Fillers. J. Cosmet. Laser Ther. 2008, 10, 35–42. [Google Scholar] [CrossRef]
- Monticelli, D.; Martina, V.; Mocchi, R.; Rauso, R.; Zerbinati, U.; Cipolla, G.; Zerbinati, N. Chemical Characterization of Hydrogels Crosslinked with Polyethylene Glycol for Soft Tissue Augmentation. Open Access Maced. J. Med. Sci. 2019, 7, 1077–1081. [Google Scholar] [CrossRef]
- Mondon, K.; Dadras, M. Influence of the Macro- and/or Microstructure of Cross-Linked Hyaluronic Acid Hydrogels on the Release of Two Model Drugs. J. Glycobiol. 2016, 5, 1–7. [Google Scholar] [CrossRef]
- Gavard Molliard, S.; Bon Bétemps, J.; Hadjab, B.; Topchian, D.; Micheels, P.; Salomon, D. Key Rheological Properties of Hyaluronic Acid Fillers: From Tissue Integration to Product Degradation. Plast. Aesthetic Res. 2018, 5, 17. [Google Scholar] [CrossRef]
- Faivre, J.; Gallet, M.; Tremblais, E.; Trévidic, P.; Bourdon, F. Advanced Concepts in Rheology for the Evaluation of Hyaluronic Acid–Based Soft Tissue Fillers. Dermatol. Surg. 2021, 47, e159–e167. [Google Scholar] [CrossRef] [PubMed]
- Choi, S.; Yoo, M.; Lee, S.Y.; Lee, H.; Son, D.; Jung, J.; Kim, C. Modulation of Biomechanical Properties of Hyaluronic Acid Hydrogels by Crosslinking Agents. J. Biomed. Mater. Res. Part A 2015, 103, 3072–3080. [Google Scholar] [CrossRef]
- Patrick Micheels, M.D.; Didier Sarazin, M.D.; Christian Tran, M.D. Effect of Different Crosslinking Technologies on Hyaluronic Acid Behavior: A Visual and Microscopic Study of Seven Hayluronic Acid Gels. J. Drugs Dermatol. 2016, 15, 600–606. [Google Scholar]
- Guarise, C.; Barbera, C.; Pavan, M.; Panfilo, S.; Beninatto, R.; Galesso, D. HA-Based Dermal Filler: Downstream Process Comparison, Impurity Quantitation by Validated HPLC-MS Analysis, and in Vivo Residence Time Study. J. Appl. Biomater. Funct. Mater. 2019, 17, 1–9. [Google Scholar] [CrossRef]
- Santhanam, S.; Liang, J.; Baid, R.; Ravi, N. Investigating Thiol-Modification on Hyaluronan via Carbodiimide Chemistry Using Response Surface Methodology. J. Biomed. Mater. Res. Part A 2015, 103, 2300–2308. [Google Scholar] [CrossRef]
- Khunmanee, S.; Jeong, Y.; Park, H. Crosslinking Method of Hyaluronic-Based Hydrogel for Biomedical Applications. J. Tissue Eng. 2017, 8, 1–16. [Google Scholar] [CrossRef] [PubMed]
- La Gatta, A.; Ricci, G.; Stellavato, A.; Cammarota, M.; Filosa, R.; Papa, A.; D’Agostino, A.; Portaccio, M.; Delfino, I.; De Rosa, M.; et al. Hyaluronan Hydrogels with a Low Degree of Modification as Scaffolds for Cartilage Engineering. Int. J. Biol. Macromol. 2017, 103, 978–989. [Google Scholar] [CrossRef] [PubMed]
- Yeom, J.; Bhang, S.H.; Kim, B.S.; Seo, M.S.; Hwang, E.J.; Cho, I.H.; Park, J.K.; Hahn, S.K. Effect of Cross-Linking Reagents for Hyaluronic Acid Hydrogel Dermal Fillers on Tissue Augmentation and Regeneration. Bioconjug. Chem. 2010, 21, 240–247. [Google Scholar] [CrossRef] [PubMed]
- De Boulle, K.; Glogau, R.; Kono, T.; Nathan, M.; Tezel, A.; Roca-Martinez, J.X.; Paliwal, S.; Stroumpoulis, D. A Review of the Metabolism of 1,4-Butanediol Diglycidyl Ether-Crosslinked Hyaluronic Acid Dermal Fillers. Dermatol. Surg. 2013, 39, 1758–1766. [Google Scholar] [CrossRef]
- La Gatta, A.; Schiraldi, C.; Papa, A.; D’Agostino, A.; Cammarota, M.; De Rosa, A.; De Rosa, M. Hyaluronan Scaffolds via Diglycidyl Ether Crosslinking: Toward Improvements in Composition and Performance. Carbohydr. Polym. 2013, 96, 536–544. [Google Scholar] [CrossRef]
- Zerbinati, N.; Lotti, T.; Monticelli, D.; Martina, V.; Cipolla, G.; D’Este, E.; Calligaro, A.; Mocchi, R.; Maccario, C.; Sommatis, S.; et al. In Vitro Evaluation of the Sensitivity of a Hyaluronic Acid PEG Cross-Linked to Bovine Testes Hyaluronidase. Open Access Maced. J. Med. Sci. 2018, 6, 20–24. [Google Scholar] [CrossRef]
- Foureman, P.; Mason, J.M.; Valencia, R.; Zimmering, S. Chemical Mutagenesis Testing in Drosophila. X. Results of 70 Coded Chemicals Tested for the National Toxicology-program. Environ. Mol. Mutagen. 1994, 23, 208–227. [Google Scholar] [CrossRef]
- Jeong, C.H.; Kim, D.H.; Yune, J.H.; Kwon, H.C.; Shin, D.M.; Sohn, H.; Lee, K.H.; Choi, B.; Kim, E.S.; Kang, J.H.; et al. In Vitro Toxicity Assessment of Crosslinking Agents Used in Hyaluronic Acid Dermal Filler. Toxicol. Vitr. 2020, 70, 105034. [Google Scholar] [CrossRef]
- Zerbinati, N.; Lotti, T.; Monticelli, D.; Rauso, R.; González-Isaza, P.; D’este, E.; Calligaro, A.; Sommatis, S.; Maccario, C.; Mocchi, R.; et al. In Vitro Evaluation of the Biosafety of Hyaluronic Acid PEG Cross-Linked with Micromolecules of Calcium Hydroxyapatite in Low Concentration. Open Access Maced. J. Med. Sci. 2018, 6, 15–19. [Google Scholar] [CrossRef] [PubMed]
- Fidalgo, J.; Deglesne, P.A.; Arroyo, R.; Sepúlveda, L.; Ranneva, E.; Deprez, P. Detection of a New Reaction By-Product in BDDE Cross-Linked Autoclaved Hyaluronic Acid Hydrogels by LC–MS Analysis. Med. Devices Evid. Res. 2018, 11, 367–376. [Google Scholar] [CrossRef] [PubMed]
- Al-Sibani, M.; Al-Harrasi, A.; Neubert, R.H.H. Characterization of Linear and Chemically Cross-Linked Hyaluronic Acid Using Various Analytical Techniques Including FTIR, ESI-MS, H1 NMR, and SEM. J. Biochem. Anal. Stud. 2018, 3, 1–8. [Google Scholar] [CrossRef]
- Xue, Y.; Chen, H.; Xu, C.; Yu, D.; Xu, H.; Hu, Y. Synthesis of Hyaluronic Acid Hydrogels by Crosslinking the Mixture of High-Molecular-Weight Hyaluronic Acid and Low-Molecular-Weight Hyaluronic Acid with 1,4-Butanediol Diglycidyl Ether. RSC Adv. 2020, 10, 7206–7213. [Google Scholar] [CrossRef] [PubMed]
- Kim, D.J.; Jung, M.Y.; Pak, H.J.; Park, J.H.; Kim, M.; Chuck, R.S.; Park, C.Y. Development of a Novel Hyaluronic Acid Membrane for the Treatment of Ocular Surface Diseases. Sci. Rep. 2021, 11, 2351. [Google Scholar] [CrossRef] [PubMed]


| Name | Formula | M | M + H+ | Quantifiers (M + NH4+) | Qualifiers (M + NH4+ 1+) |
|---|---|---|---|---|---|
| PEGDE 394 | C18H34O9 | 394.2203 | 395.2275 | 412.2541 | 413.2568 |
| PEGDE 438 | C20H38O10 | 438.2465 | 439.2538 | 456.2804 | 457.2831 |
| PEGDE 482 | C22H42O11 | 482.2727 | 483.2800 | 500.3066 | 501.3135 |
| PEGDE 526 | C24H46O12 | 526.2989 | 527.3062 | 544.3328 | 545.3378 |
| PEGDE 570 | C26H50O13 | 570.3251 | 571.3324 | 588.3595 | 589.3612 |
| PEGDE 614 | C28H54O14 | 614.3514 | 615.3586 | 632.3852 | 633.3897 |
| PEGDE 658 | C30H58O15 | 658.3776 | 659.3848 | 676.4114 | 677.4137 |
| PEGDE 702 | C32H62O16 | 702.4038 | 703.4110 | 720.4377 | 721.4410 |
| Name | Retention Time | Average Signal-to-Noise |
|---|---|---|
| PEGDE 394 | 5.92 | 4.1 |
| PEGDE 438 | 6.02 | 9.6 |
| PEGDE 482 | 6.09 | 15.9 |
| PEGDE 526 | 6.17 | 22.5 |
| PEGDE 570 | 6.22 | 24.5 |
| PEGDE 614 | 6.27 | 19.3 |
| PEGDE 658 | 6.32 | 13.8 |
| PEGDE 702 | 6.38 | 7.4 |
| Name | Retention Time | Average Signal-to-Noise |
|---|---|---|
| PEGDE 394 | 5.92 | 13.46 |
| PEGDE 438 | 6.02 | 22.34 |
| PEGDE 482 | 6.09 | 43.02 |
| PEGDE 526 | 6.17 | 33.98 |
| PEGDE 570 | 6.22 | 46.92 |
| PEGDE 614 | 6.27 | 37.26 |
| PEGDE 658 | 6.32 | 25.38 |
| PEGDE 702 | 6.38 | 15.06 |
| Samples | Concentration (µg/mL) | RSD (%) |
|---|---|---|
| Sequence 1 | ||
| BD-HA-SP1-S1 (LOQ) | 0.022 | 6.76 |
| BD-HA-SP2-S1 | 0.044 | 2.11 |
| BD-HA-SP3-S1 | 0.087 | 1.37 |
| BD-HA-SP4-S1 | 0.175 | 0.57 |
| BD-HA-SP5-S1 | 0.349 | 0.26 |
| Sequence 2 | ||
| BD-HA-SP1-S2 (LOQ) | 0.033 | 2.43 |
| BD-HA-SP2-S2 | 0.067 | 1.61 |
| BD-HA-SP3-S2 | 0.134 | 1.71 |
| BD-HA-SP4-S2 | 0.201 | 1.72 |
| BD-HA-SP5-S2 | 0.268 | 1.16 |
| Sample | Weighing | [PEGDE]sample (ppb) |
|---|---|---|
| PG-HA | 1 | 126 |
| 2 | 127 | |
| 3 | 121 | |
| Average | 125 | |
| SD | 3.2 | |
| Sample | [PEGDE]ref (ppb) | Injection | [PEGDE]sample (ppb) | [PEGDE]spiked (ppb) | Recovery (%) |
|---|---|---|---|---|---|
| PG-HA-1 | 67 | 1 | 125 | 149 | 78 |
| 2 | 147 | 77 | |||
| 3 | 145 | 75 | |||
| PG-HA-2 | 134 | 1 | 232 | 90 | |
| 2 | 228 | 88 | |||
| 3 | 225 | 87 | |||
| PG-HA-3 | 268 | 1 | 400 | 102 | |
| 2 | 409 | 104 | |||
| 3 | 407 | 104 |
| Reference | PEGDE Stock Solution (µL) | ACN (µL) | [PEGDE] (µg/mL) |
|---|---|---|---|
| ACN_R1 | 50 | 950 | 0.020 |
| ACN_R2 | 100 | 900 | 0.040 |
| ACN_R3 | 200 | 800 | 0.080 |
| ACN_R4 | 400 | 600 | 0.159 |
| ACN_R5 | 800 | 200 | 0.318 |
| Reference | BD-HA (g) | PEGDE Stock Solution (µL) | ACN (µL) | [PEGDE] (µg/mL) |
|---|---|---|---|---|
| BDDE_SP1 | 0.3360 | 50 | 950 | 0.022 |
| BDDE_SP2 | 0.5714 | 100 | 900 | 0.044 |
| BDDE_SP3 | 0.5095 | 200 | 800 | 0.087 |
| BDDE_SP4 | 0.5223 | 400 | 600 | 0.175 |
| BDDE_SP5 | 0.5239 | 800 | 200 | 0.349 |
| Reference | PG-HA (g) | PEGDE Stock Solution (µL) | ACN (µL) | [PEGDE] (µg/mL) |
|---|---|---|---|---|
| PEGDE_SP1 | 0.4523 | 50 | 950 | 0.022 |
| PEGDE_SP2 | 0.5347 | 100 | 900 | 0.044 |
| PEGDE_SP3 | 0.3986 | 200 | 800 | 0.087 |
| PEGDE_SP4 | 0.4565 | 400 | 600 | 0.175 |
| PEGDE_SP5 | 0.4852 | 800 | 200 | 0.349 |
| Reference | BD-HA (g) | PEGDE Stock Solution (µL) | ACN (µL) | [PEGDE] (ppb) |
|---|---|---|---|---|
| BDD-CAL-1 | 0.5667 | 100 | 900 | 67 |
| BDD-CAL-2 | 0.5411 | 200 | 800 | 134 |
| BDD-CAL-3 | 0.5535 | 400 | 600 | 268 |
| BDD-CAL-4 | 0.5138 | 600 | 400 | 402 |
| BDD-CAL-5 | 0.5001 | 800 | 200 | 536 |
| Reference | PG-HA (g) | PEGDE Stock Solution (µL) | ACN (µL) | [PEGDE] Ref (ppb) |
|---|---|---|---|---|
| PG-SP-1 | 0.4956 | 100 | 900 | 68 |
| PG-SP-2 | 0.5005 | 200 | 800 | 134 |
| PG-SP-3 | 0.4315 | 400 | 600 | 268 |
Disclaimer/Publisher’s Note: The statements, opinions and data contained in all publications are solely those of the individual author(s) and contributor(s) and not of MDPI and/or the editor(s). MDPI and/or the editor(s) disclaim responsibility for any injury to people or property resulting from any ideas, methods, instructions or products referred to in the content. |
© 2023 by the authors. Licensee MDPI, Basel, Switzerland. This article is an open access article distributed under the terms and conditions of the Creative Commons Attribution (CC BY) license (https://creativecommons.org/licenses/by/4.0/).
Share and Cite
Alonci, G.; Boussard, A.; Savona, M.; Cordella, F.; Angelici, G.; Mocchi, R.; Sommatis, S.; Monticelli, D. A LC-QTOF Method for the Determination of PEGDE Residues in Dermal Fillers. Gels 2023, 9, 409. https://doi.org/10.3390/gels9050409
Alonci G, Boussard A, Savona M, Cordella F, Angelici G, Mocchi R, Sommatis S, Monticelli D. A LC-QTOF Method for the Determination of PEGDE Residues in Dermal Fillers. Gels. 2023; 9(5):409. https://doi.org/10.3390/gels9050409
Chicago/Turabian StyleAlonci, Giuseppe, Anna Boussard, Martina Savona, Fabiana Cordella, Gaetano Angelici, Roberto Mocchi, Sabrina Sommatis, and Damiano Monticelli. 2023. "A LC-QTOF Method for the Determination of PEGDE Residues in Dermal Fillers" Gels 9, no. 5: 409. https://doi.org/10.3390/gels9050409