Data Descriptor

Low-Dose Radiation-Induced Transcriptomic Changes in Diabetic Aortic Endothelial Cells

1
Department of Microbiology, College of Science & Technology, Dankook University, Cheonan 31116, Republic of Korea
2
Department of Biological Sciences and Biotechnology, Chungbuk National University, Cheongju 28644, Republic of Korea
3
Divisions of Radiation Biomedical Research, Korea Institute of Radiological and Medical Sciences, Seoul 01812, Republic of Korea
*
Authors to whom correspondence should be addressed.
These authors contributed equally to this work.
Submission received: 3 April 2023 / Revised: 11 May 2023 / Accepted: 16 May 2023 / Published: 18 May 2023

Abstract

:
Low-dose radiation refers to exposure to ionizing radiation at levels that are generally considered safe and not expected to cause immediate health effects. However, the effects of low-dose radiation are still not fully understood, and research in this area is ongoing. In this study, we investigated the alterations in gene expression profiles of human aortic endothelial cells (HAECs) and diabetic human aortic endothelial cells (T2D-HAECs) derived from patients with type 2 diabetes. To this end, we used RNA-seq to profile the transcriptomes of cells exposed to varying doses of low-dose radiation (0.1 Gy, 0.5 Gy, and 2.0 Gy) and compared them to a control group with no radiation exposure. Differentially expressed genes and enriched pathways were identified using the DESeq2 and gene set enrichment analysis (GSEA) methods, respectively. The data generated in this study are publicly available through the gene expression omnibus (GEO) database with the accession number GSE228572. This study provides a valuable resource for examining the effects of low-dose radiation on HAECs and T2D-HAECs, thereby contributing to a better understanding of the potential human health risks associated with low-dose radiation exposure.
Dataset License: CC0

1. Summary

Exposure to low-dose radiation, which involves small amounts of ionizing radiation capable of damaging living cells, is a significant area of research due to its prevalence in medical procedures and everyday life [1]. Transcriptomic studies have proven valuable in understanding the biological effects of low-dose radiation, particularly through the examination of changes in gene expression [2]. By identifying specific genes and pathways that are affected by low-dose radiation, researchers can gain a better understanding of the mechanisms by which ionizing radiation affects cells and tissues. Previous studies have shown that low-dose radiation can have both harmful and beneficial effects on biological systems [3,4,5]. However, the precise genes and associated pathways altered by low-dose radiation and their consequences remain unclear. To gain a better understanding of the effect of low-dose radiation, it remains critical to accurately evaluate its dose-dependent impact on gene expression in various cell lines and animal models, which can be achieved through the utilization of large-scale transcriptome profiling techniques, such as RNA-seq.
Endothelial cells (ECs) play a vital role in vascular health but can be compromised by various cardiovascular risk factors and stimuli, including chronic diseases, metabolic conditions (such as type 2 diabetes mellitus and obesity), smoking, and disturbed blood flow [6]. Type 2 diabetes mellitus is strongly correlated with cardiovascular disease and represents a leading cause of mortality in diabetic patients worldwide [7,8]. Furthermore, radiation exposure has been associated with the development of diabetes [5,9,10]. Interestingly, low-dose radiation shows potential as a therapeutic approach for diabetes-induced cardiopathy by reducing inflammation and preventing pathological remodeling [4,11]. Timely intervention is essential, as the risk of disease escalates with the accumulation of metabolic syndrome characteristics.
Here, we utilized RNA-seq to examine the abundance of known genes in human aortic endothelial cells (HAECs) and primary human aortic endothelial cells derived from patients with type 2 diabetes (T2D-HAECs). To determine the extent of the impact of radiation, the cells were exposed to different radiation doses of 0.1, 0.5, and 2 Gy. DESeq2 was used for differential gene expression analysis with an adjusted p-value of 0.05, comparing each low-dose group to the control group with no radiation exposure. In addition, gene set enrichment analysis (GSEA) was performed to identify pathways that were consistently affected by the radiation. These transcriptomic resources offer valuable insights into the impact of low-dose radiation on gene expression in HAECs and T2D-HAECs, contributing to the current understanding of cellular responses to low-dose radiation.

2. Data Description

2.1. Quality Control Analysis of RNA-seq Data

This dataset comprises transcriptomes from eight samples, including two biological replicates for each of the four conditions: 0 Gy (no radiation), 0.1 Gy, 0.5 Gy, and 2 Gy. Table 1 summarizes the total number of filtered reads that passed a Phred score (sequencing quality) threshold of 20, as well as the percentage of uniquely mapped reads for each sample. The RNA-seq data quality was also evaluated using the transcript integrity number (TIN) score with RSeQC [12] (Table 1). Overall, the quality control analysis indicates that the RNA-seq data demonstrated high quality, without any noticeable anomalies.

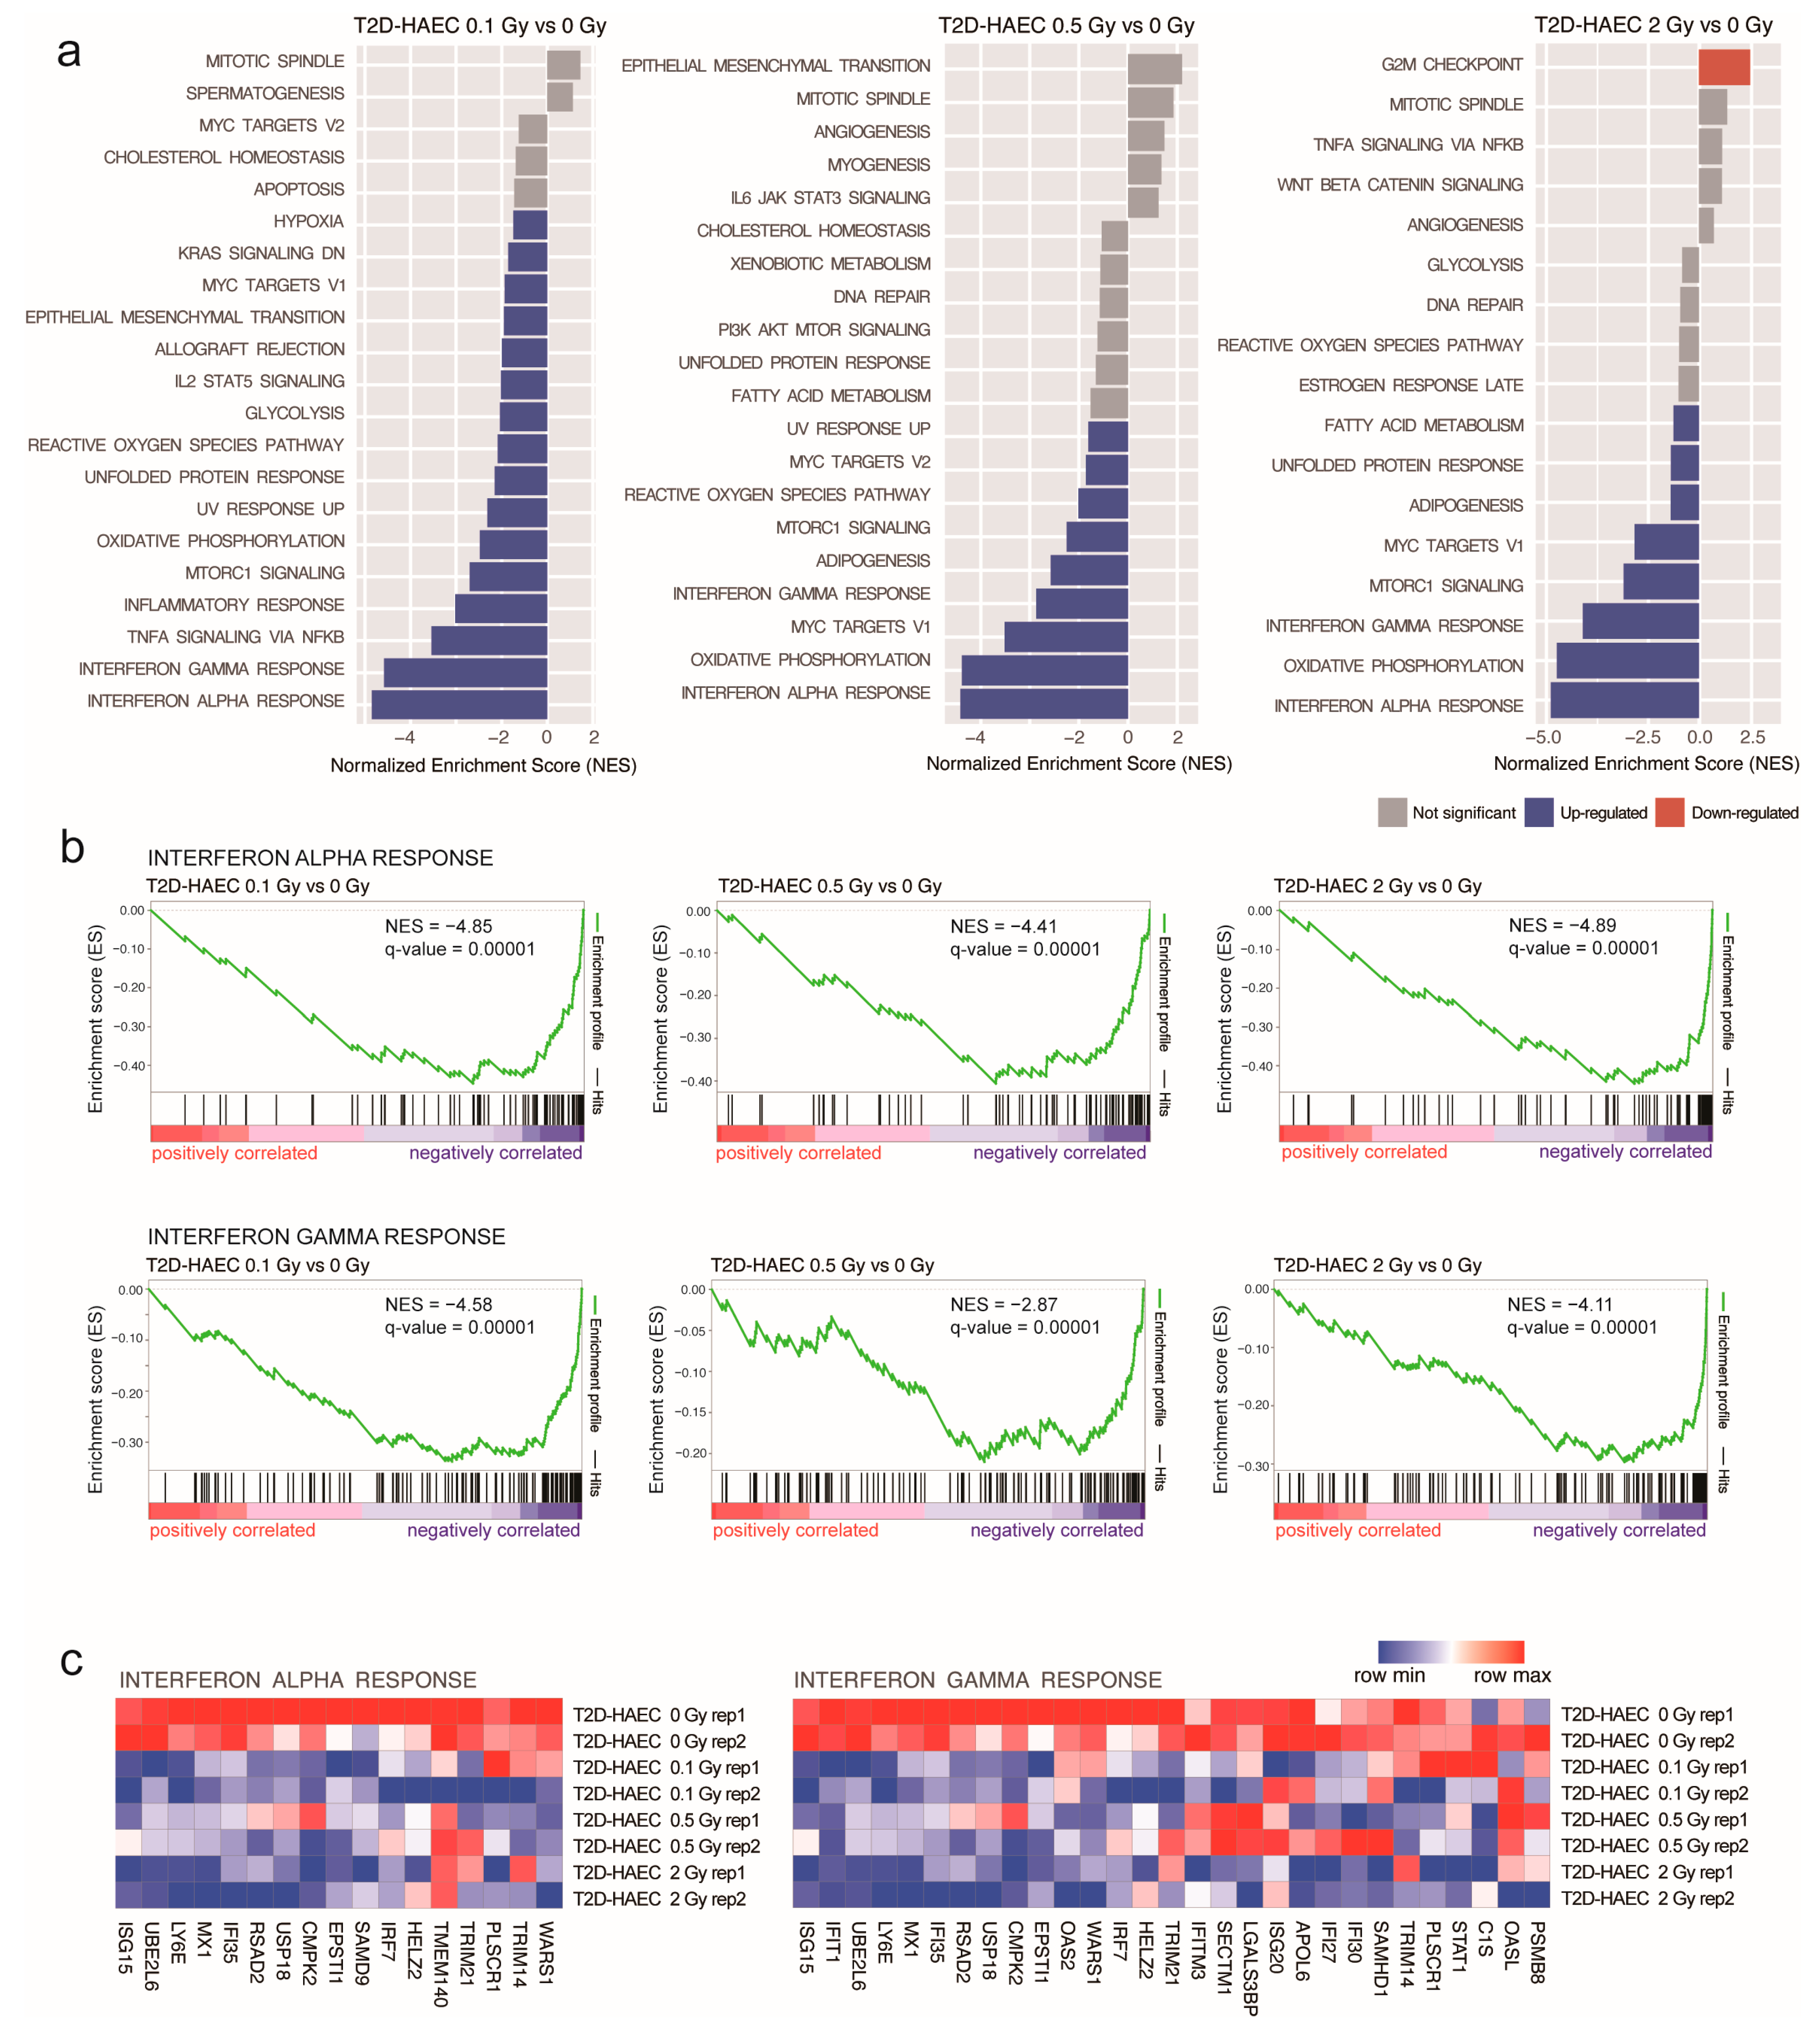
2.2. Differential Gene Expression and Pathway Analyses

We estimated the abundance of all known genes in HAEC and T2D-HAEC cells using StringTie with the transcripts per million (TPM) method [13]. The results can be found in Table S1. To define differentially expressed genes (DEGs) between HAEC and T2D-HAEC cells, as well as within the same cell type across different radiation doses (0.1 Gy, 0.5 Gy, or 2 Gy) compared to the control group (no radiation), we defined genes with an adjusted p-value of less than 0.05 as DEGs. Our analysis revealed a total of 116 differentially expressed genes (DEGs) in T2D-HAEC cells exposed to 0.1 Gy, with 39 genes up-regulated and 77 genes down-regulated. Similarly, T2D-HAEC cells exposed to 0.5 Gy exhibited 133 DEGs, including 68 up-regulated and 65 down-regulated genes. In the case of T2D-HAEC cells exposed to 2 Gy, we observed a total of 220 DEGs, with 109 genes up-regulated and 111 genes down-regulated. On the other hand, HAEC cells exposed to 0.1 Gy displayed 14 DEGs, consisting of 12 up-regulated genes and 2 down-regulated genes. HAEC cells exposed to 0.5 Gy showed 262 DEGs, with 213 genes up-regulated and 49 genes down-regulated. Lastly, HAEC cells exposed to 2 Gy exhibited 351 DEGs, including 185 up-regulated genes and 166 down-regulated genes (Table S2).
To elucidate the pathways associated with transcriptomic alterations in T2D-HAEC cell comparisons, we performed gene set enrichment analysis (GSEA) [14] on the expressed genes (n = 9857) with the Hallmark gene sets (https://www.gsea-msigdb.org/gsea/msigdb/, accessed on 2 March 2023) (Table S3). This analysis identified a total of 16 pathways (all down-regulated), 9 pathways (all down-regulated), and 9 pathways (8 down-regulated and 1 up-regulated) in 0.1 Gy-, 0.5 Gy-, and 2 Gy-exposed groups, respectively (Figure 1a). Among these pathways, the interferon alpha response and interferon gamma response pathways were significantly down-regulated in all three groups (Figure 1b). Furthermore, genes associated with these pathways were significantly down-regulated in all individual samples when compared to the control samples (Figure 1c). On the other hand, no pathways were significantly associated with HAEC cells in a dose-dependent manner (Figure S1). These data could be beneficial for researchers studying the impact of low-dose radiation on patients with type 2 diabetes.

3. Methods

3.1. Cell Culture

Human aortic endothelial cells (HAECs, #CC-2535) and human aortic endothelial cells with diabetes type II (T2D-HAECs, #CC-2920) were procured from Lonza Group Ltd. (Walkersville, MD, USA). These cells were cultured in endothelial growth medium-2 microvascular medium (Lonza) and maintained at 37 °C in a humidified incubator with 5% CO2. For the experiment, the cells were seeded onto 100 mm dishes at a consistent density of 4 × 10⁵ cells and incubated for 24 h to allow for normal proliferation prior to irradiation. Considering the typical cell proliferation cycle of 18 to 24 h, the cells were in an actively growing state (undergoing proliferation) at the time of radiation exposure.

3.2. Radiation Exposure

The impact of radiation exposure on the transcriptome was investigated in actively growing cells. Cells were exposed to γ-rays with a 137Cs laboratory γ-irradiator (LDI-KCCH 137, Seoul, Republic of Korea) at a dose of 0.1 Gy (4.8 mGy/min) or 137Cs γ- ray source (Atomic Energy of Canada, Mississauga, ON, Canada) at a dose of 0.5 Gy or 2 Gy (2.26 Gy/min) using a procedure described previously [15,16].

3.3. RNA Isolation

Cells were collected for RNA extraction at 36 h post-irradiation. Total RNA was isolated using the TRIsure solution (Bioline, London, UK), following the manufacturer’s instructions for the isolation procedure. The quality of RNA was assessed using an Agilent 2100 bioanalyzer and an RNA 6000 Nano Chip (Agilent Technologies, Amstelveen, The Netherlands), and the RNA integrity number was obtained. The total RNA was quantified using a NanoDrop 2000 spectrophotometer (ND-2000; Thermo Fisher Scientific, Waltham, MA, USA).

3.4. Library Preparation and Sequencing

RNA-seq was performed using high-quality RNA samples (RNA integrity number > 7) isolated from HAEC and T2D-HAEC cells that were either exposed to 0 Gy (no radiation), 0.1 Gy, 0.5 Gy, or 2.0 Gy. Samples were multiplexed into lanes and sequenced on a HiSeq 4000 system (Illumina, San Diego, CA, USA).

3.5. RNA Sequencing Data Analysis

The raw RNA-seq reads obtained from the sequencing platform were processed using Trim Galore (https://www.bioinformatics.babraham.ac.uk/projects/trim_galore/, accessed on 2 March 2023) to remove adapter and low-quality sequences. The trimmed reads were then quality checked using FastQC (v. 0.11.9) (http://www.bioinformatics.babraham.ac.uk/projects/fastqc/, accessed on 2 March 2023). Next, the trimmed reads were aligned to the reference human genome (hg38 assembly; GRCh38.p13) using STAR (v. 2.7.9a) [17] with GENCODE gene annotation (https://www.gencodegenes.org/, accessed on 2 March 2023). The quality of RNA-seq data was further assessed using the transcript integrity number (TIN) score, which was calculated using RSeQC (tin.py; v. 4.0.0) [12]. The median TIN value for all RNA-seq data was greater than 0.7, indicating high data quality. The expression levels of known genes were estimated using the transcript per million (TPM) method with StringTie (v. 2.1.7b) [13]. Differential expression analysis was performed using DESeq2 (v. 1.36.0) [18] with an adjusted p-value cutoff of 0.05. All software and algorithms were used with default parameters.

3.6. Gene Set Enrichement Analysis

To determine the enriched gene sets in our study, we conducted gene set enrichment analysis (GSEA) using the Hallmark gene sets obtained from the Molecular Signatures Database (MSigDB) (https://www.gsea-msigdb.org/gsea/msigdb/, accessed on 2 March 2023) with the GSEA software [14]. We calculated gene ranks as -log(p-value) × log2FoldChange for each comparison and utilized this information as input for the GSEAPreranked analysis. We identified significantly enriched pathways using a false discovery rate (FDR) q-value threshold of 0.05.

Supplementary Materials

The following supporting information can be downloaded at: https://www.mdpi.com/article/10.3390/data8050092/s1, Table S1: Normalized expression levels of known genes in all samples; Table S2: Differentially expressed genes identified in each comparison; Table S3: Gene sets associated with each comparison; Figure S1: Identification of radiation-responsive pathways and associated genes at low doses in HAEC cells.

Author Contributions

Conceptualization, J.P., K.K. (Keunsoo Kang), K.K. (Kyuho Kang) and H.-J.L.; methodology, Y.S. and K.S.K.; validation, Y.S. and K.S.K.; formal analysis, J.P. and K.K. (Keunsoo Kang); investigation, J.P., K.K. (Keunsoo Kang), K.K. (Kyuho Kang) and H.-J.L.; writing—original draft preparation, J.P., K.K. (Keunsoo Kang), K.K. (Kyuho Kang) and H.-J.L.; writing—review and editing, K.K. (Kyuho Kang) and H.-J.L.; visualization, J.P.; funding acquisition, H.-J.L. All authors have read and agreed to the published version of the manuscript.

Funding

This work was supported by grants from the National Research Foundation (NRF-2020M2C8A2069337).

Institutional Review Board Statement

Not applicable.

Informed Consent Statement

Not applicable.

Data Availability Statement

The data presented in this study are openly available in the gene expression omnibus repository at https://www.ncbi.nlm.nih.gov/geo/query/acc.cgi?acc=GSE228572, accessed on 2 March 2023.

Conflicts of Interest

The authors declare no conflict of interest.

References

  1. Ali, Y.F.; Cucinotta, F.A.; Ning-Ang, L.; Zhou, G. Cancer Risk of Low Dose Ionizing Radiation. Front. Phys. 2020, 8, 234. [Google Scholar] [CrossRef]
  2. Ghandhi, S.A.; Smilenov, L.B.; Elliston, C.D.; Chowdhury, M.; Amundson, S.A. Radiation dose-rate effects on gene expression for human biodosimetry. BMC Med. Genom. 2015, 8, 22. [Google Scholar] [CrossRef] [PubMed]
  3. Poonsombudlert, K.; Limpruttidham, N. Total Body Irradiation and Risk of Diabetes Mellitus; A Meta-Analysis. Asian Pac. J. Cancer Prev. 2019, 20, 885–891. [Google Scholar] [CrossRef] [PubMed]
  4. Zhang, F.; Lin, X.; Yu, L.; Li, W.; Qian, D.; Cheng, P.; He, L.; Yang, H.; Zhang, C. Low-dose radiation prevents type 1 diabetes-induced cardiomyopathy via activation of AKT mediated anti-apoptotic and anti-oxidant effects. J. Cell. Mol. Med. 2016, 20, 1352–1366. [Google Scholar] [CrossRef] [PubMed]
  5. Teinturier, C.; Tournade, M.-F.; Caillat-Zucman, S.; Boitard, C.; Amoura, Z.; Bougneres, P.-F.; Timsit, J. Diabetes mellitus after abdominal radiation therapy. Lancet 1995, 346, 633–634. [Google Scholar] [CrossRef] [PubMed]
  6. Alexander, Y.; Osto, E.; Schmidt-Trucksäss, A.; Shechter, M.; Trifunovic, D.; Duncker, D.J.; Aboyans, V.; Bäck, M.; Badimon, L.; Cosentino, F.; et al. Endothelial function in cardiovascular medicine: A consensus paper of the European Society of Cardiology Working Groups on Atherosclerosis and Vascular Biology, Aorta and Peripheral Vascular Diseases, Coronary Pathophysiology and Microcirculation, and Thrombosis. Cardiovasc. Res. 2021, 117, 29–42. [Google Scholar] [CrossRef] [PubMed]
  7. Naveed, A.; Farrukh, L.; Sana, M.K.; Naveed, B.; Randhawa, F.A. Pharmacological Primary Prevention of Diabetes Mellitus Type II: A Narrative Review. Cureus 2020, 12, e10033. [Google Scholar] [CrossRef] [PubMed]
  8. Leon, B.M.; Maddox, T.M. Diabetes and cardiovascular disease: Epidemiology, biological mechanisms, treatment recommendations and future research. World J. Diabetes 2015, 6, 1246–1258. [Google Scholar] [CrossRef] [PubMed]
  9. Meacham, L.R.; Sklar, C.A.; Li, S.; Liu, Q.; Gimpel, N.; Yasui, Y.; Whitton, J.A.; Stovall, M.; Robison, L.L.; Oeffinger, K.C.; et al. Diabetes mellitus in long-term survivors of childhood cancer. Increased risk associated with radiation therapy: A report for the childhood cancer survivor study. Arch. Intern. Med. 2009, 169, 1381–1388. [Google Scholar] [CrossRef] [PubMed]
  10. Tatsukawa, Y.; Cordova, K.; Yamada, M.; Ohishi, W.; Imaizumi, M.; Hida, A.; Sposto, R.; Sakata, R.; Fujiwara, S.; Nakanishi, S.; et al. Incidence of Diabetes in the Atomic Bomb Survivors: 1969–2015. J. Clin. Endocrinol. Metab. 2022, 107, e2148–e2155. [Google Scholar] [CrossRef] [PubMed]
  11. Zhang, C.; Jin, S.; Guo, W.; Li, C.; Li, X.; Rane, M.J.; Wang, G.; Cai, L. Attenuation of diabetes-induced cardiac inflammation and pathological remodeling by low-dose radiation. Radiat. Res. 2011, 175, 307–321. [Google Scholar] [CrossRef]
  12. Wang, L.; Wang, S.; Li, W. RSeQC: Quality control of RNA-seq experiments. Bioinformatics 2012, 28, 2184–2185. [Google Scholar] [CrossRef] [PubMed]
  13. Pertea, M.; Pertea, G.M.; Antonescu, C.M.; Chang, T.-C.; Mendell, J.T.; Salzberg, S.L. StringTie enables improved reconstruction of a transcriptome from RNA-seq reads. Nat. Biotechnol. 2015, 33, 290–295. [Google Scholar] [CrossRef] [PubMed]
  14. Subramanian, A.; Tamayo, P.; Mootha, V.K.; Mukherjee, S.; Ebert, B.L.; Gillette, M.A.; Paulovich, A.; Pomeroy, S.L.; Golub, T.R.; Lander, E.S.; et al. Gene set enrichment analysis: A knowledge-based approach for interpreting genome-wide expression profiles. Proc. Natl. Acad. Sci. USA 2005, 102, 15545–15550. [Google Scholar] [CrossRef] [PubMed]
  15. Kaushik, N.; Kim, M.-J.; Kim, R.-K.; Kaushik, N.K.; Seong, K.M.; Nam, S.-Y.; Lee, S.-J. Low-dose radiation decreases tumor progression via the inhibition of the JAK1/STAT3 signaling axis in breast cancer cell lines. Sci. Rep. 2017, 7, 43361. [Google Scholar] [CrossRef] [PubMed]
  16. Park, H.; Nam, K.-S.; Lee, H.-J.; Kim, K.S. Ionizing Radiation-Induced GDF15 Promotes Angiogenesis in Human Glioblastoma Models by Promoting VEGFA Expression Through p-MAPK1/SP1 Signaling. Front. Oncol. 2022, 12, 801230. [Google Scholar] [CrossRef] [PubMed]
  17. Dobin, A.; Gingeras, T.R. Mapping RNA-seq Reads with STAR. Curr. Protoc. Bioinform. 2015, 51, 11.14.1–11.14.19. [Google Scholar] [CrossRef] [PubMed]
  18. Love, M.I.; Huber, W.; Anders, S. Moderated estimation of fold change and dispersion for RNA-seq data with DESeq2. Genome Biol. 2014, 15, 550. [Google Scholar] [CrossRef] [PubMed]
Figure 1. Identification of radiation-responsive pathways and associated genes at low doses. (a) Enriched pathways based on the overall expression patterns of the given comparisons are presented. The significance of each pathway is represented by the length of the bars in the plots, which indicate the normalized enrichment score (NES). Blue, red, and grey bars represent pathways that are down-regulated (q-value < 0.05 and NES < 0), up-regulated (q-value < 0.05 and NES > 0), and not significantly affected (the rest of the cases), respectively. (b) Gene set enrichment plots of two pathways that are significantly down-regulated in all comparisons are shown. (c) Heatmaps of gene expression levels in all individual samples belonging to the pathways are presented.
Data 08 00092 g001
Table 1. Summary of RNA-seq data quality control analysis.
SampleTotal Number of ReadsUniquely Mapped Reads (%)TIN
(Median)
Raw ReadsFiltered Reads
T2D-HAEC 0 Gy rep131,213,31330,849,90367.0274.69
T2D-HAEC 0 Gy rep231,266,21530,911,93866.5376.27
T2D-HAEC 0.1 Gy rep131,300,63530,373,82569.9471.40
T2D-HAEC 0.1 Gy rep231,166,49530,857,10075.4977.32
T2D-HAEC 0.5 Gy rep131,308,49130,076,44072.1570.08
T2D-HAEC 0.5 Gy rep231,551,54931,207,06276.6977.72
T2D-HAEC 2 Gy rep131,390,59230,915,93277.7674.72
T2D-HAEC 2 Gy rep231,197,38530,789,71676.3978.39
HAEC 0 Gy rep126,663,03726,602,48565.0778.38
HAEC 0 Gy rep228,990,60228,865,83753.8475.03
HAEC 0.1 Gy rep131,210,03231,175,47775.9879.38
HAEC 0.1 Gy rep231,530,65231,499,02075.5079.31
HAEC 0.5 Gy rep131,075,65131,043,18855.2578.82
HAEC 0.5 Gy rep231,188,25731,153,90156.2579.39
HAEC 2 Gy rep131,359,76131,279,38154.6177.62
HAEC 2 Gy rep228,409,48328,313,54357.0076.83
Disclaimer/Publisher’s Note: The statements, opinions and data contained in all publications are solely those of the individual author(s) and contributor(s) and not of MDPI and/or the editor(s). MDPI and/or the editor(s) disclaim responsibility for any injury to people or property resulting from any ideas, methods, instructions or products referred to in the content.

