Next Issue
Volume 8, June
Previous Issue
Volume 8, April


Data, Volume 8, Issue 5 (May 2023) – 19 articles

Cover Story (view full-size image): 
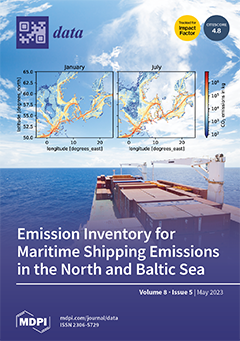
This paper provides a comprehensive maritime emission inventory for the North Sea and the Baltic Sea. It uses AIS data to quantify air pollutant emissions from ships over 100 GT at 5-minute intervals. Using a bottom-up approach, the inventory covers nine leading air pollutants: CO2, NOX, PM2.5, SO2, POA, ash, CO, NMVOC, and BC. It also incorporates speed-dependent fuel and energy consumption, considering emissions from main and auxiliary engines in addition to the well-to-tank and tank-to-propeller stages. It allows for the analysis of future emissions, considering inter alia fuel switching and efficiency measures. Overall, the inventory meets the need for a transparent and accessible dataset, allowing stakeholders to assess shipping emissions, develop policies, and analyze energy requirements in port areas. View this paper
  • Issues are regarded as officially published after their release is announced to the table of contents alert mailing list.
  • You may sign up for e-mail alerts to receive table of contents of newly released issues.
  • PDF is the official format for papers published in both, html and pdf forms. To view the papers in pdf format, click on the "PDF Full-text" link, and use the free Adobe Reader to open them.
Order results
Result details
Section
Select all
Export citation of selected articles as:
7 pages, 602 KiB  
Data Descriptor
Low-Dose Radiation-Induced Transcriptomic Changes in Diabetic Aortic Endothelial Cells
by Jihye Park, Kyuho Kang, Yeonghoon Son, Kwang Seok Kim, Keunsoo Kang and Hae-June Lee
Data 2023, 8(5), 92; https://doi.org/10.3390/data8050092 - 18 May 2023
Viewed by 1328
Abstract
Low-dose radiation refers to exposure to ionizing radiation at levels that are generally considered safe and not expected to cause immediate health effects. However, the effects of low-dose radiation are still not fully understood, and research in this area is ongoing. In this [...] Read more.
Low-dose radiation refers to exposure to ionizing radiation at levels that are generally considered safe and not expected to cause immediate health effects. However, the effects of low-dose radiation are still not fully understood, and research in this area is ongoing. In this study, we investigated the alterations in gene expression profiles of human aortic endothelial cells (HAECs) and diabetic human aortic endothelial cells (T2D-HAECs) derived from patients with type 2 diabetes. To this end, we used RNA-seq to profile the transcriptomes of cells exposed to varying doses of low-dose radiation (0.1 Gy, 0.5 Gy, and 2.0 Gy) and compared them to a control group with no radiation exposure. Differentially expressed genes and enriched pathways were identified using the DESeq2 and gene set enrichment analysis (GSEA) methods, respectively. The data generated in this study are publicly available through the gene expression omnibus (GEO) database with the accession number GSE228572. This study provides a valuable resource for examining the effects of low-dose radiation on HAECs and T2D-HAECs, thereby contributing to a better understanding of the potential human health risks associated with low-dose radiation exposure. Full article
Show Figures

Figure 1

25 pages, 12346 KiB  
Data Descriptor
A Set of Geophysical Fields for Modeling of the Lithosphere Structure and Dynamics in the Russian Arctic Zone
by Anatoly Soloviev, Alexey Petrunin, Sofia Gvozdik and Roman Sidorov
Data 2023, 8(5), 91; https://doi.org/10.3390/data8050091 - 14 May 2023
Cited by 1 | Viewed by 1313
Abstract
This paper presents a set of various geological and geophysical data for the Arctic zone, including some detailed models for the eastern part of the Russian Arctic zone. This hard-to-access territory has a complex geological structure, which is poorly studied by direct geophysical [...] Read more.
This paper presents a set of various geological and geophysical data for the Arctic zone, including some detailed models for the eastern part of the Russian Arctic zone. This hard-to-access territory has a complex geological structure, which is poorly studied by direct geophysical methods. Therefore, these data can be used in an integrative analysis for different purposes. These are the gravity field, heat flow, and various seismic tomography models. The gravity field data include several reductions calculated during our preceding studies, which are more appropriate for the study of the Earth’s interiors than the initial free air anomalies. Specifically, these are the Bouguer, isostatic, and decompensative gravity anomalies. A surface heat flow map included in the dataset is based on a joint inversion of multiple geophysical data constrained by the observations from the International Heat Flow Commission catalog. Available seismic tomography models were analyzed to select the best one for further investigation. We provide the models for the sedimentary cover and the Moho depth, which are significantly improved compared to the existing ones. The database provides a basis for qualitative and quantitative analysis of the region. Full article
Show Figures

Figure 1

22 pages, 3560 KiB  
Article
An Efficient Deep Learning for Thai Sentiment Analysis
by Nattawat Khamphakdee and Pusadee Seresangtakul
Data 2023, 8(5), 90; https://doi.org/10.3390/data8050090 - 13 May 2023
Cited by 5 | Viewed by 2629
Abstract
The number of reviews from customers on travel websites and platforms is quickly increasing. They provide people with the ability to write reviews about their experience with respect to service quality, location, room, and cleanliness, thereby helping others before booking hotels. Many people [...] Read more.
The number of reviews from customers on travel websites and platforms is quickly increasing. They provide people with the ability to write reviews about their experience with respect to service quality, location, room, and cleanliness, thereby helping others before booking hotels. Many people fail to consider hotel bookings because the numerous reviews take a long time to read, and many are in a non-native language. Thus, hotel businesses need an efficient process to analyze and categorize the polarity of reviews as positive, negative, or neutral. In particular, low-resource languages such as Thai have greater limitations in terms of resources to classify sentiment polarity. In this paper, a sentiment analysis method is proposed for Thai sentiment classification in the hotel domain. Firstly, the Word2Vec technique (the continuous bag-of-words (CBOW) and skip-gram approaches) was applied to create word embeddings of different vector dimensions. Secondly, each word embedding model was combined with deep learning (DL) models to observe the impact of each word vector dimension result. We compared the performance of nine DL models (CNN, LSTM, Bi-LSTM, GRU, Bi-GRU, CNN-LSTM, CNN-BiLSTM, CNN-GRU, and CNN-BiGRU) with different numbers of layers to evaluate their performance in polarity classification. The dataset was classified using the FastText and BERT pre-trained models to carry out the sentiment polarity classification. Finally, our experimental results show that the WangchanBERTa model slightly improved the accuracy, producing a value of 0.9225, and the skip-gram and CNN model combination outperformed other DL models, reaching an accuracy of 0.9170. From the experiments, we found that the word vector dimensions, hyperparameter values, and the number of layers of the DL models affected the performance of sentiment classification. Our research provides guidance for setting suitable hyperparameter values to improve the accuracy of sentiment classification for the Thai language in the hotel domain. Full article
Show Figures

Figure 1

11 pages, 1288 KiB  
Data Descriptor
A Comprehensive Dataset of Spelling Errors and Users’ Corrections in Croatian Language
by Gordan Gledec, Marko Horvat, Miljenko Mikuc and Bruno Blašković
Data 2023, 8(5), 89; https://doi.org/10.3390/data8050089 - 12 May 2023
Cited by 1 | Viewed by 2406
Abstract
This paper presents a unique and extensive dataset containing over 33 million entries with pairs in the form “spelling error → correction” from ispravi.me, the most popular Croatian online spellchecking service, collected since 2008. The dataset, compiled from the contribution of nearly 900,000 [...] Read more.
This paper presents a unique and extensive dataset containing over 33 million entries with pairs in the form “spelling error → correction” from ispravi.me, the most popular Croatian online spellchecking service, collected since 2008. The dataset, compiled from the contribution of nearly 900,000 users, is a valuable resource for researchers and developers in the field of natural language processing (NLP), improving spellcheck accuracy, and language learning applications. The dataset may be used to accomplish several goals: (1) improving spellchecking accuracy by incorporating common user corrections and reducing false positives and negatives; (2) helping language learners identify common errors and learn correct spelling through targeted feedback; (3) analyzing data trends and patterns to uncover the most common spelling errors and their underlying causes; (4) identifying and evaluating factors that influence typing input; (5) improving NLP applications such as text recognition and machine translation. Tasks specific to the Croatian language include the creation of a letter-level confusion matrix and the refinement of word suggestions based on historical usage of the service. This comprehensive dataset provides researchers and practitioners with a wealth of information, opening the path for advancements in spellchecking, language learning, and NLP applications in the Croatian language. Full article
(This article belongs to the Section Information Systems and Data Management)
Show Figures

Figure 1

13 pages, 4995 KiB  
Data Descriptor
A Multispectral UAV Imagery Dataset of Wheat, Soybean and Barley Crops in East Kazakhstan
by Almasbek Maulit, Aliya Nugumanova, Kurmash Apayev, Yerzhan Baiburin and Maxim Sutula
Data 2023, 8(5), 88; https://doi.org/10.3390/data8050088 - 11 May 2023
Cited by 3 | Viewed by 2892
Abstract
This study introduces a dataset of crop imagery captured during the 2022 growing season in the Eastern Kazakhstan region. The images were acquired using a multispectral camera mounted on an unmanned aerial vehicle (DJI Phantom 4). The agricultural land, encompassing 27 hectares and [...] Read more.
This study introduces a dataset of crop imagery captured during the 2022 growing season in the Eastern Kazakhstan region. The images were acquired using a multispectral camera mounted on an unmanned aerial vehicle (DJI Phantom 4). The agricultural land, encompassing 27 hectares and cultivated with wheat, barley, and soybean, was subjected to five aerial multispectral photography sessions throughout the growing season. This facilitated thorough monitoring of the most important phenological stages of crop development in the experimental design, which consisted of 27 plots, each covering one hectare. The collected imagery underwent enhancement and expansion, integrating a sixth band that embodies the normalized difference vegetation index (NDVI) values in conjunction with the original five multispectral bands (Blue, Green, Red, Red Edge, and Near Infrared Red). This amplification enables a more effective evaluation of vegetation health and growth, rendering the enriched dataset a valuable resource for the progression and validation of crop monitoring and yield prediction models, as well as for the exploration of precision agriculture methodologies. Full article
Show Figures

Figure 1

9 pages, 1849 KiB  
Data Descriptor
The Effect of Short-Term Transcutaneous Electrical Stimulation of Auricular Vagus Nerve on Parameters of Heart Rate Variability
by Vladimir Shvartz, Eldar Sizhazhev, Maria Sokolskaya, Svetlana Koroleva, Soslan Enginoev, Sofia Kruchinova, Elena Shvartz and Elena Golukhova
Data 2023, 8(5), 87; https://doi.org/10.3390/data8050087 - 11 May 2023
Viewed by 2680
Abstract
Many previous studies have demonstrated that transcutaneous vagus nerve stimulation (VNS) has the potential to exhibit therapeutic effects similar to its invasive counterpart. An objective assessment of VNS requires a reliable biomarker of successful vagal activation. Although many potential biomarkers have been proposed, [...] Read more.
Many previous studies have demonstrated that transcutaneous vagus nerve stimulation (VNS) has the potential to exhibit therapeutic effects similar to its invasive counterpart. An objective assessment of VNS requires a reliable biomarker of successful vagal activation. Although many potential biomarkers have been proposed, most studies have focused on heart rate variability (HRV). Despite the physiological rationale for HRV as a biomarker for assessing vagal stimulation, data on its effects on HRV are equivocal. To further advance this field, future studies investigating VNS should contain adequate methodological specifics that make it possible to compare the results between studies, to replicate studies, and to enhance the safety of study participants. This article describes the design and methodology of a randomized study evaluating the effect of short-term noninvasive stimulation of the auricular branch of the vagus nerve on parameters of HRV. Primary records of rhythmograms of all the subjects, as well as a dataset with clinical, instrumental, and laboratory data of all the current study subjects are in the public domain for possible secondary analysis to all interested researchers. The physiological interpretation of the obtained data is not considered in the article. Full article
Show Figures

Graphical abstract

5 pages, 584 KiB  
Data Descriptor
RaspberrySet: Dataset of Annotated Raspberry Images for Object Detection
by Sarmīte Strautiņa, Ieva Kalniņa, Edīte Kaufmane, Kaspars Sudars, Ivars Namatēvs, Arturs Nikulins and Edgars Edelmers
Data 2023, 8(5), 86; https://doi.org/10.3390/data8050086 - 10 May 2023
Viewed by 1506
Abstract
The RaspberrySet dataset is a valuable resource for those working in the field of agriculture, particularly in the selection and breeding of ecologically adaptable berry cultivars. This is because long-term changes in temperature and weather patterns have made it increasingly important for crops [...] Read more.
The RaspberrySet dataset is a valuable resource for those working in the field of agriculture, particularly in the selection and breeding of ecologically adaptable berry cultivars. This is because long-term changes in temperature and weather patterns have made it increasingly important for crops to be able to adapt to their environment. To assess the suitability of different cultivars or to make yield predictions, it is necessary to describe and evaluate berries’ characteristics at various growth stages. This process is typically carried out visually, but it can be time-consuming and labor-intensive, requiring significant expert knowledge. The RaspberrySet dataset was created to assist with this process, and it includes images of raspberry berries at five different stages of development. These stages are flower buds, flowers, unripe berries, and ripe berries. All these stages of raspberry images classified buds, damaged buds, flowers, unripe berries, and ripe berries and were annotated using ground truth ROI and presented in YOLO format. The dataset includes 2039 high-resolution RGB images, with a total of 46,659 annotations provided by experts using Label Studio software (1.7.1). The images were taken in various weather conditions, at different times of the day, and from different angles, and they include fully visible buds, flowers, berries, and partially obscured buds. This dataset is intended to improve the efficiency of berry breeding and yield estimation and to identify the raspberry phenotype more accurately. It may also be useful for breeding other fruit crops, as it allows for the reliable detection and phenotyping of yield components at different stages of development. By providing a homogenized dataset of images taken on-site at the Institute of Horticulture in Dobele, Latvia, the RaspberrySet dataset offers a valuable resource for those working in horticulture. Full article
Show Figures

Figure 1

14 pages, 1690 KiB  
Data Descriptor
Emission Inventory for Maritime Shipping Emissions in the North and Baltic Sea
by Franziska Dettner and Simon Hilpert
Data 2023, 8(5), 85; https://doi.org/10.3390/data8050085 - 01 May 2023
Viewed by 2349
Abstract
A high temporal and spatial resolution emission inventory for the North Sea and Baltic Sea was compiled using current emission factors and ship activity data. The inventory includes seagoing vessels over 100 GT registered with the International Maritime Organization traversing in the North [...] Read more.
A high temporal and spatial resolution emission inventory for the North Sea and Baltic Sea was compiled using current emission factors and ship activity data. The inventory includes seagoing vessels over 100 GT registered with the International Maritime Organization traversing in the North and Baltic Seas. A bottom-up approach was chosen for the compilation of the inventory, which provides emission levels of the air pollutants CO2, NOx, SO2, PM2.5, CO, BC, Ash, NMVOC, and POA, as well as the speed-dependent fuel and energy consumption. Input data come from both main and auxiliary engines, as well as well-to-tank and tank-to-propeller emission and energy and fuel consumption quantities. The georeferenced data are provided in a temporal resolution of five minutes. The data can be used to assess, inter alia, the health effects of maritime emissions, the social costs of maritime transport, emission mitigation effects of alternative fuel scenarios, and shore-to-ship power supply. Full article
Show Figures

Figure 1

6 pages, 234 KiB  
Data Descriptor
Biotechnology and Bio-Based Products Perceptions in the Community of Madrid: A Representative Survey Dataset
by Juan Romero-Luis, Manuel Gertrudix, María del Carmen Gertrudis Casado and Alejandro Carbonell-Alcocer
Data 2023, 8(5), 84; https://doi.org/10.3390/data8050084 - 01 May 2023
Viewed by 1446
Abstract
(1) Background: Bioeconomy aims to reduce dependence on non-renewable resources and foster economic growth through the development of new bio-based products and services. Achieving this goal requires social acceptance and stakeholder engagement in the development of sustainable technologies. The objective of this data [...] Read more.
(1) Background: Bioeconomy aims to reduce dependence on non-renewable resources and foster economic growth through the development of new bio-based products and services. Achieving this goal requires social acceptance and stakeholder engagement in the development of sustainable technologies. The objective of this data article is to provide a dataset derived from a survey with a representative sample of 500 citizens over 18 years old based in the Community of Madrid. (2) Methods: We created a questionnaire on the social acceptance of technologies and bio-based products to later gather the responses using a SurveyMonkey panel for the Community of Madrid through an online CAWI survey; (3) Results: A dataset with a total of 82 columns with all responses is the result of this study. (4) Conclusions: This data article provides not only a valuable representative dataset of citizens of the Community of Madrid but also sufficient resources to replicate the same study in other regions. Full article
21 pages, 5248 KiB  
Article
Cloud-Based Smart Contract Analysis in FinTech Using IoT-Integrated Federated Learning in Intrusion Detection
by Venkatagurunatham Naidu Kollu, Vijayaraj Janarthanan, Muthulakshmi Karupusamy and Manikandan Ramachandran
Data 2023, 8(5), 83; https://doi.org/10.3390/data8050083 - 29 Apr 2023
Cited by 4 | Viewed by 1954
Abstract
Data sharing is proposed because the issue of data islands hinders advancement of artificial intelligence technology in the 5G era. Sharing high-quality data has a direct impact on how well machine-learning models work, but there will always be misuse and leakage of data. [...] Read more.
Data sharing is proposed because the issue of data islands hinders advancement of artificial intelligence technology in the 5G era. Sharing high-quality data has a direct impact on how well machine-learning models work, but there will always be misuse and leakage of data. The field of financial technology, or FinTech, has received a lot of attention and is growing quickly. This field has seen the introduction of new terms as a result of its ongoing expansion. One example of such terminology is “FinTech”. This term is used to describe a variety of procedures utilized frequently in the financial technology industry. This study aims to create a cloud-based intrusion detection system based on IoT federated learning architecture as well as smart contract analysis. This study proposes a novel method for detecting intrusions using a cyber-threat federated graphical authentication system and cloud-based smart contracts in FinTech data. Users are required to create a route on a world map as their credentials under this scheme. We had 120 people participate in the evaluation, 60 of whom had a background in finance or FinTech. The simulation was then carried out in Python using a variety of FinTech cyber-attack datasets for accuracy, precision, recall, F-measure, AUC (Area under the ROC Curve), trust value, scalability, and integrity. The proposed technique attained accuracy of 95%, precision of 85%, RMSE of 59%, recall of 68%, F-measure of 83%, AUC of 79%, trust value of 65%, scalability of 91%, and integrity of 83%. Full article
(This article belongs to the Special Issue Data Management for Internet-of-Things)
Show Figures

Figure 1

13 pages, 1775 KiB  
Data Descriptor
Exploring Spatial Patterns in Sensor Data for Humidity, Temperature, and RSSI Measurements
by Juan Botero-Valencia, Adrian Martinez-Perez, Ruber Hernández-García and Luis Castano-Londono
Data 2023, 8(5), 82; https://doi.org/10.3390/data8050082 - 29 Apr 2023
Viewed by 1578
Abstract
The Internet of Things (IoT) is one of the fastest-growing research areas in recent years and is strongly linked to the development of smart cities, smart homes, and factories. IoT can be defined as connecting devices, sensors, and physical objects that can collect [...] Read more.
The Internet of Things (IoT) is one of the fastest-growing research areas in recent years and is strongly linked to the development of smart cities, smart homes, and factories. IoT can be defined as connecting devices, sensors, and physical objects that can collect and transmit data across a network, enabling increased automation and better decision-making. In several IoT applications, humidity and temperature are some of the most used variables for adjusting system configurations and understanding their performance because they are related to various physical processes, human comfort, manufacturing processes, and 3D printing, among other things. In addition, one of the biggest problems associated with IoT is the excessive production of data, so it is necessary to develop methodologies to optimize the process of collecting information. This work presents a new dataset comprising almost 55 million values of temperature, relative humidity, and RSSI (Received Signal Strength Indicator) collected in two indoor spaces for longer than 3915 h at 10 s intervals. For each experiment, we captured the information from 13 previously calibrated sensors suspended from the ceiling at the same height and with a known relative position. The proposed dataset aims to contribute a benchmark for evaluating indoor temperature and humidity-controlled systems. The collected data allow the validation and improvement of the acquisition process for IoT applications. Full article
(This article belongs to the Topic Smart Energy Systems, 2nd Edition)
Show Figures

Figure 1

6 pages, 646 KiB  
Data Descriptor
Dataset of Fluorescence EEM and UV Spectroscopy Data of Olive Oils during Ageing
by Francesca Venturini, Silvan Fluri and Michael Baumgartner
Data 2023, 8(5), 81; https://doi.org/10.3390/data8050081 - 29 Apr 2023
Cited by 3 | Viewed by 1323
Abstract
The dataset presented in this study encompasses fluorescence excitation–emission matrices (EEMs) and UV-spectroscopy data of 24 extra virgin olive oils (EVOOs) commercially available at supermarkets in Switzerland. To investigate the effect of thermal degradation, the samples were exposed to accelerated ageing at 60 [...] Read more.
The dataset presented in this study encompasses fluorescence excitation–emission matrices (EEMs) and UV-spectroscopy data of 24 extra virgin olive oils (EVOOs) commercially available at supermarkets in Switzerland. To investigate the effect of thermal degradation, the samples were exposed to accelerated ageing at 60 C up to 53 days. EEMs and UV absorption parameters were measured in 10 ageing steps. The dataset can be used, for example, to predict one or multiple chemical parameters or to classify samples based on their quality from fluorescence spectra. Full article
Show Figures

Figure 1

19 pages, 12628 KiB  
Article
Remote Sensing Data Preparation for Recognition and Classification of Building Roofs
by Emil Hristov, Dessislava Petrova-Antonova, Aleksandar Petrov, Milena Borukova and Evgeny Shirinyan
Data 2023, 8(5), 80; https://doi.org/10.3390/data8050080 - 28 Apr 2023
Cited by 3 | Viewed by 1854
Abstract
Buildings are among the most significant urban infrastructure that directly affects citizens’ livelihood. Knowledge about their rooftops is essential not only for implementing different Levels of Detail (LoD) in 3D city models but also for performing urban analyses related to usage potential (solar, [...] Read more.
Buildings are among the most significant urban infrastructure that directly affects citizens’ livelihood. Knowledge about their rooftops is essential not only for implementing different Levels of Detail (LoD) in 3D city models but also for performing urban analyses related to usage potential (solar, green, social), construction assessment, maintenance, etc. At the same time, the more detailed information we have about the urban environment, the more adequate urban digital twins we can create. This paper proposes an approach for dataset preparation using an orthophoto with a resolution of 10 cm. The goal is to obtain roof images into separate GeoTIFFs categorised by type (flat, pitched, complex) in a way suitable for feeding rooftop classification models. Although the dataset is initially elaborated for rooftop classification, it can be applied to developing other deep-learning models related to roof recognition, segmentation, and usage potential estimation. The dataset consists of 3617 roofs covering the Lozenets district of Sofia, Bulgaria. During its preparation, the local-specific context is considered. Full article
(This article belongs to the Section Spatial Data Science and Digital Earth)
Show Figures

Figure 1

9 pages, 5038 KiB  
Data Descriptor
A Tumour and Liver Automatic Segmentation (ATLAS) Dataset on Contrast-Enhanced Magnetic Resonance Imaging for Hepatocellular Carcinoma
by Félix Quinton, Romain Popoff, Benoît Presles, Sarah Leclerc, Fabrice Meriaudeau, Guillaume Nodari, Olivier Lopez, Julie Pellegrinelli, Olivier Chevallier, Dominique Ginhac, Jean-Marc Vrigneaud and Jean-Louis Alberini
Data 2023, 8(5), 79; https://doi.org/10.3390/data8050079 - 27 Apr 2023
Cited by 3 | Viewed by 3853
Abstract
Liver cancer is the sixth most common cancer in the world and the fourth leading cause of cancer mortality. In unresectable liver cancers, especially hepatocellular carcinoma (HCC), transarterial radioembolisation (TARE) can be considered for treatment. TARE treatment involves a contrast-enhanced magnetic resonance imaging [...] Read more.
Liver cancer is the sixth most common cancer in the world and the fourth leading cause of cancer mortality. In unresectable liver cancers, especially hepatocellular carcinoma (HCC), transarterial radioembolisation (TARE) can be considered for treatment. TARE treatment involves a contrast-enhanced magnetic resonance imaging (CE-MRI) exam performed beforehand to delineate the liver and tumour(s) in order to perform dosimetry calculation. Due to the significant amount of time and expertise required to perform the delineation process, there is a strong need for automation. Unfortunately, the lack of publicly available CE-MRI datasets with liver tumour annotations has hindered the development of fully automatic solutions for liver and tumour segmentation. The “Tumour and Liver Automatic Segmentation” (ATLAS) dataset that we present consists of 90 liver-focused CE-MRI covering the entire liver of 90 patients with unresectable HCC, along with 90 liver and liver tumour segmentation masks. To the best of our knowledge, the ATLAS dataset is the first public dataset providing CE-MRI of HCC with annotations. The public availability of this dataset should greatly facilitate the development of automated tools designed to optimise the delineation process, which is essential for treatment planning in liver cancer patients. Full article
Show Figures

Figure 1

16 pages, 2066 KiB  
Article
Assessing and Forecasting the Long-Term Impact of the Global Financial Crisis on New Car Sales in South Africa
by Tendai Makoni and Delson Chikobvu
Data 2023, 8(5), 78; https://doi.org/10.3390/data8050078 - 27 Apr 2023
Cited by 1 | Viewed by 2434
Abstract
In both developed and developing nations, with South Africa (SA) being one of the latter, the motor vehicle industry is one of the most important sectors. The SA automobile industry was not unaffected by the 2007/2008 global financial crisis (GFC). This study aims [...] Read more.
In both developed and developing nations, with South Africa (SA) being one of the latter, the motor vehicle industry is one of the most important sectors. The SA automobile industry was not unaffected by the 2007/2008 global financial crisis (GFC). This study aims to assess the impact of the GFC on new car sales in SA through statistical modeling, an impact that has not previously been investigated or quantified. The data obtained indicate that the optimal model for assessing the aforementioned impact is the SARIMA (0,1,1)(0,0,2)12 model. This model’s suitability was confirmed using Akaike information criterion (AIC) and Bayesian information criterion (BIC), as well as the root mean square error (RMSE) and the mean absolute percentage error (MAPE). An upward trend is projected for new car sales in SA, which has positive implications for SA and its economy. The projections indicate that the new car sales rate has increased and has somewhat recovered, but it has not yet reached the levels expected had the GFC not occurred. This shows that SA’s new car industry has been negatively and severely impacted by the GFC and that the effects of the latter still linger today. The findings of this study will assist new car manufacturing companies in SA to better understand their industry, to prepare for future negative shocks, to formulate potential policies for stocking inventories, and to optimize marketing and production levels. Indeed, the information presented in this study provides talking points that should be considered in future government relief packages. Full article
Show Figures

Figure 1

17 pages, 2454 KiB  
Data Descriptor
Dataset of Specific Total Embodied Energy and Specific Total Weight of 40 Buildings from the Last Four Decades in the Andean Region of Ecuador
by Jefferson Torres-Quezada and Tatiana Sánchez-Quezada
Data 2023, 8(5), 77; https://doi.org/10.3390/data8050077 - 26 Apr 2023
Viewed by 1627
Abstract
This article presents the Specific Total Embodied Energy (STEE) and Specific Total Weight (STW) of 40 Andean residential buildings in Ecuador, from 1980 to 2020. Firstly, the BoM of ten buildings of every decade was obtained through field work carried out in three [...] Read more.
This article presents the Specific Total Embodied Energy (STEE) and Specific Total Weight (STW) of 40 Andean residential buildings in Ecuador, from 1980 to 2020. Firstly, the BoM of ten buildings of every decade was obtained through field work carried out in three urban sectors of this city. Secondly, the specific embodied energy and specific weight of every material found in the 40 samples were obtained by bibliography. Finally, the calculation of each building was divided into three components: Structure, Envelope and Finishes. The analyzed data show a detailed collection of different materials and construction typologies used in these four decades, and the impact on their embodied energy and their weight. Moreover, this article gives a Specific Embodied Energy and Specific Weight database of 25 materials that are extensively used in Andean regions. The results show several changes in reference to the insertion of new material, but also regarding the adoption of new architectonic models. The most important changes, in the analyzed period, have been the use of concrete and metal in the structure instead of wood, the increase in the glass surface in the envelope, and the replacement of wood by particleboard on the finishes. In conclusion, the STEE of the entire building has experienced an increase of 2.19 times in the last four decades. The STW value has also increased, but to a lesser extent (1.36 times). Full article
Show Figures

Figure 1

4 pages, 236 KiB  
Data Descriptor
A Dataset of Marine Macroinvertebrate Diversity from Mozambique and São Tomé and Príncipe
by Marta Bento, Henrique Niza, Alexandra Cartaxana, Salomão Bandeira, José Paula and Alexandra Marçal Correia
Data 2023, 8(5), 76; https://doi.org/10.3390/data8050076 - 25 Apr 2023
Cited by 2 | Viewed by 1211
Abstract
Marine macroinvertebrate communities play a key role in ecosystem functioning by regulating flows of energy and materials and providing numerous ecosystem services. In Mozambique and São Tomé and Príncipe marine macroinvertebrates are important for the livelihood and food security of local populations. We [...] Read more.
Marine macroinvertebrate communities play a key role in ecosystem functioning by regulating flows of energy and materials and providing numerous ecosystem services. In Mozambique and São Tomé and Príncipe marine macroinvertebrates are important for the livelihood and food security of local populations. We compiled a dataset on marine invertebrates from Mozambique and São Tomé and Príncipe through an extensive data search of digital platforms, scientific literature, and natural history collections (NHC). This dataset encompasses data from 1816 to 2023 and comprises 20,122 records, representing 617 families, 1552 genera, 2137 species, providing species occurrence in mangrove forests, seagrass beds, coral reefs, and other coastal and offshore habitats. The dataset has a Darwin Core standard format and has been fully released in the Global Biodiversity Information Facility (GBIF). It is accessible through the GBIF portal under the Creative Commons Attribution 4.0 International license. The data are standardized and validated with tools such as WoRMS, GEOLocate, and Google Maps. Therefore, they can be readily used for further studies on species richness, distribution, and functional traits. Overall, this dataset contributes baseline information on marine biodiversity for future research. Full article
4 pages, 1003 KiB  
Data Descriptor
Data on 33 Years of Erroneous Usage of Rainfall Erosivity Equations
by Nejc Bezak, Klaudija Lebar, Yu-Chieh Huang and Walter Chen
Data 2023, 8(5), 75; https://doi.org/10.3390/data8050075 - 24 Apr 2023
Viewed by 1154
Abstract
This paper describes the data gathered for a paper published in Earth-Science Reviews (DOI: 10.1016/j.earscirev.2023.104339) to address the problem of studies using incorrect equations to calculate rainfall erosivity (R factor), which can lead to issues related to land degradation, soil productivity loss, and [...] Read more.
This paper describes the data gathered for a paper published in Earth-Science Reviews (DOI: 10.1016/j.earscirev.2023.104339) to address the problem of studies using incorrect equations to calculate rainfall erosivity (R factor), which can lead to issues related to land degradation, soil productivity loss, and biodiversity loss. The aim was to locate articles containing the incorrect equations and create a relational database that could be used to perform an in-depth analysis of the errors. Because the search target is an equation, it is impossible to directly query any literature database for the articles that contain the incorrect R equations. Therefore, a manual search of multiple databases was conducted. Subsequently, the literature search was broadened to identify the origin of the misuse of the R equations, and SQL (Structured Query Language) queries were formulated to understand why the errors continued to persist for a minimum of 33 years. The resulting entity-relationship-based Microsoft Access database was determined to be a valuable tool for performing in-depth analysis. It can be used to add incorrect studies and perform further analysis. It is suggested that further research should be conducted to determine the extent of the impact of these errors on soil erosion, ecosystems, and the environment. Full article
Show Figures

Figure 1

7 pages, 1197 KiB  
Data Descriptor
MN-DS: A Multilabeled News Dataset for News Articles Hierarchical Classification
by Alina Petukhova and Nuno Fachada
Data 2023, 8(5), 74; https://doi.org/10.3390/data8050074 - 23 Apr 2023
Cited by 1 | Viewed by 4261
Abstract
This article presents a dataset of 10,917 news articles with hierarchical news categories collected between 1 January 2019 and 31 December 2019. We manually labeled the articles based on a hierarchical taxonomy with 17 first-level and 109 second-level categories. This dataset can be [...] Read more.
This article presents a dataset of 10,917 news articles with hierarchical news categories collected between 1 January 2019 and 31 December 2019. We manually labeled the articles based on a hierarchical taxonomy with 17 first-level and 109 second-level categories. This dataset can be used to train machine learning models for automatically classifying news articles by topic. This dataset can be helpful for researchers working on news structuring, classification, and predicting future events based on released news. Full article
Show Figures

Figure 1

Previous Issue
Next Issue
Back to TopTop