
Deep Learning with Northern Australian Savanna Tree Species: A Novel Dataset
 , , ,
, , ,
Abstract
:1. Summary
2. Data Description
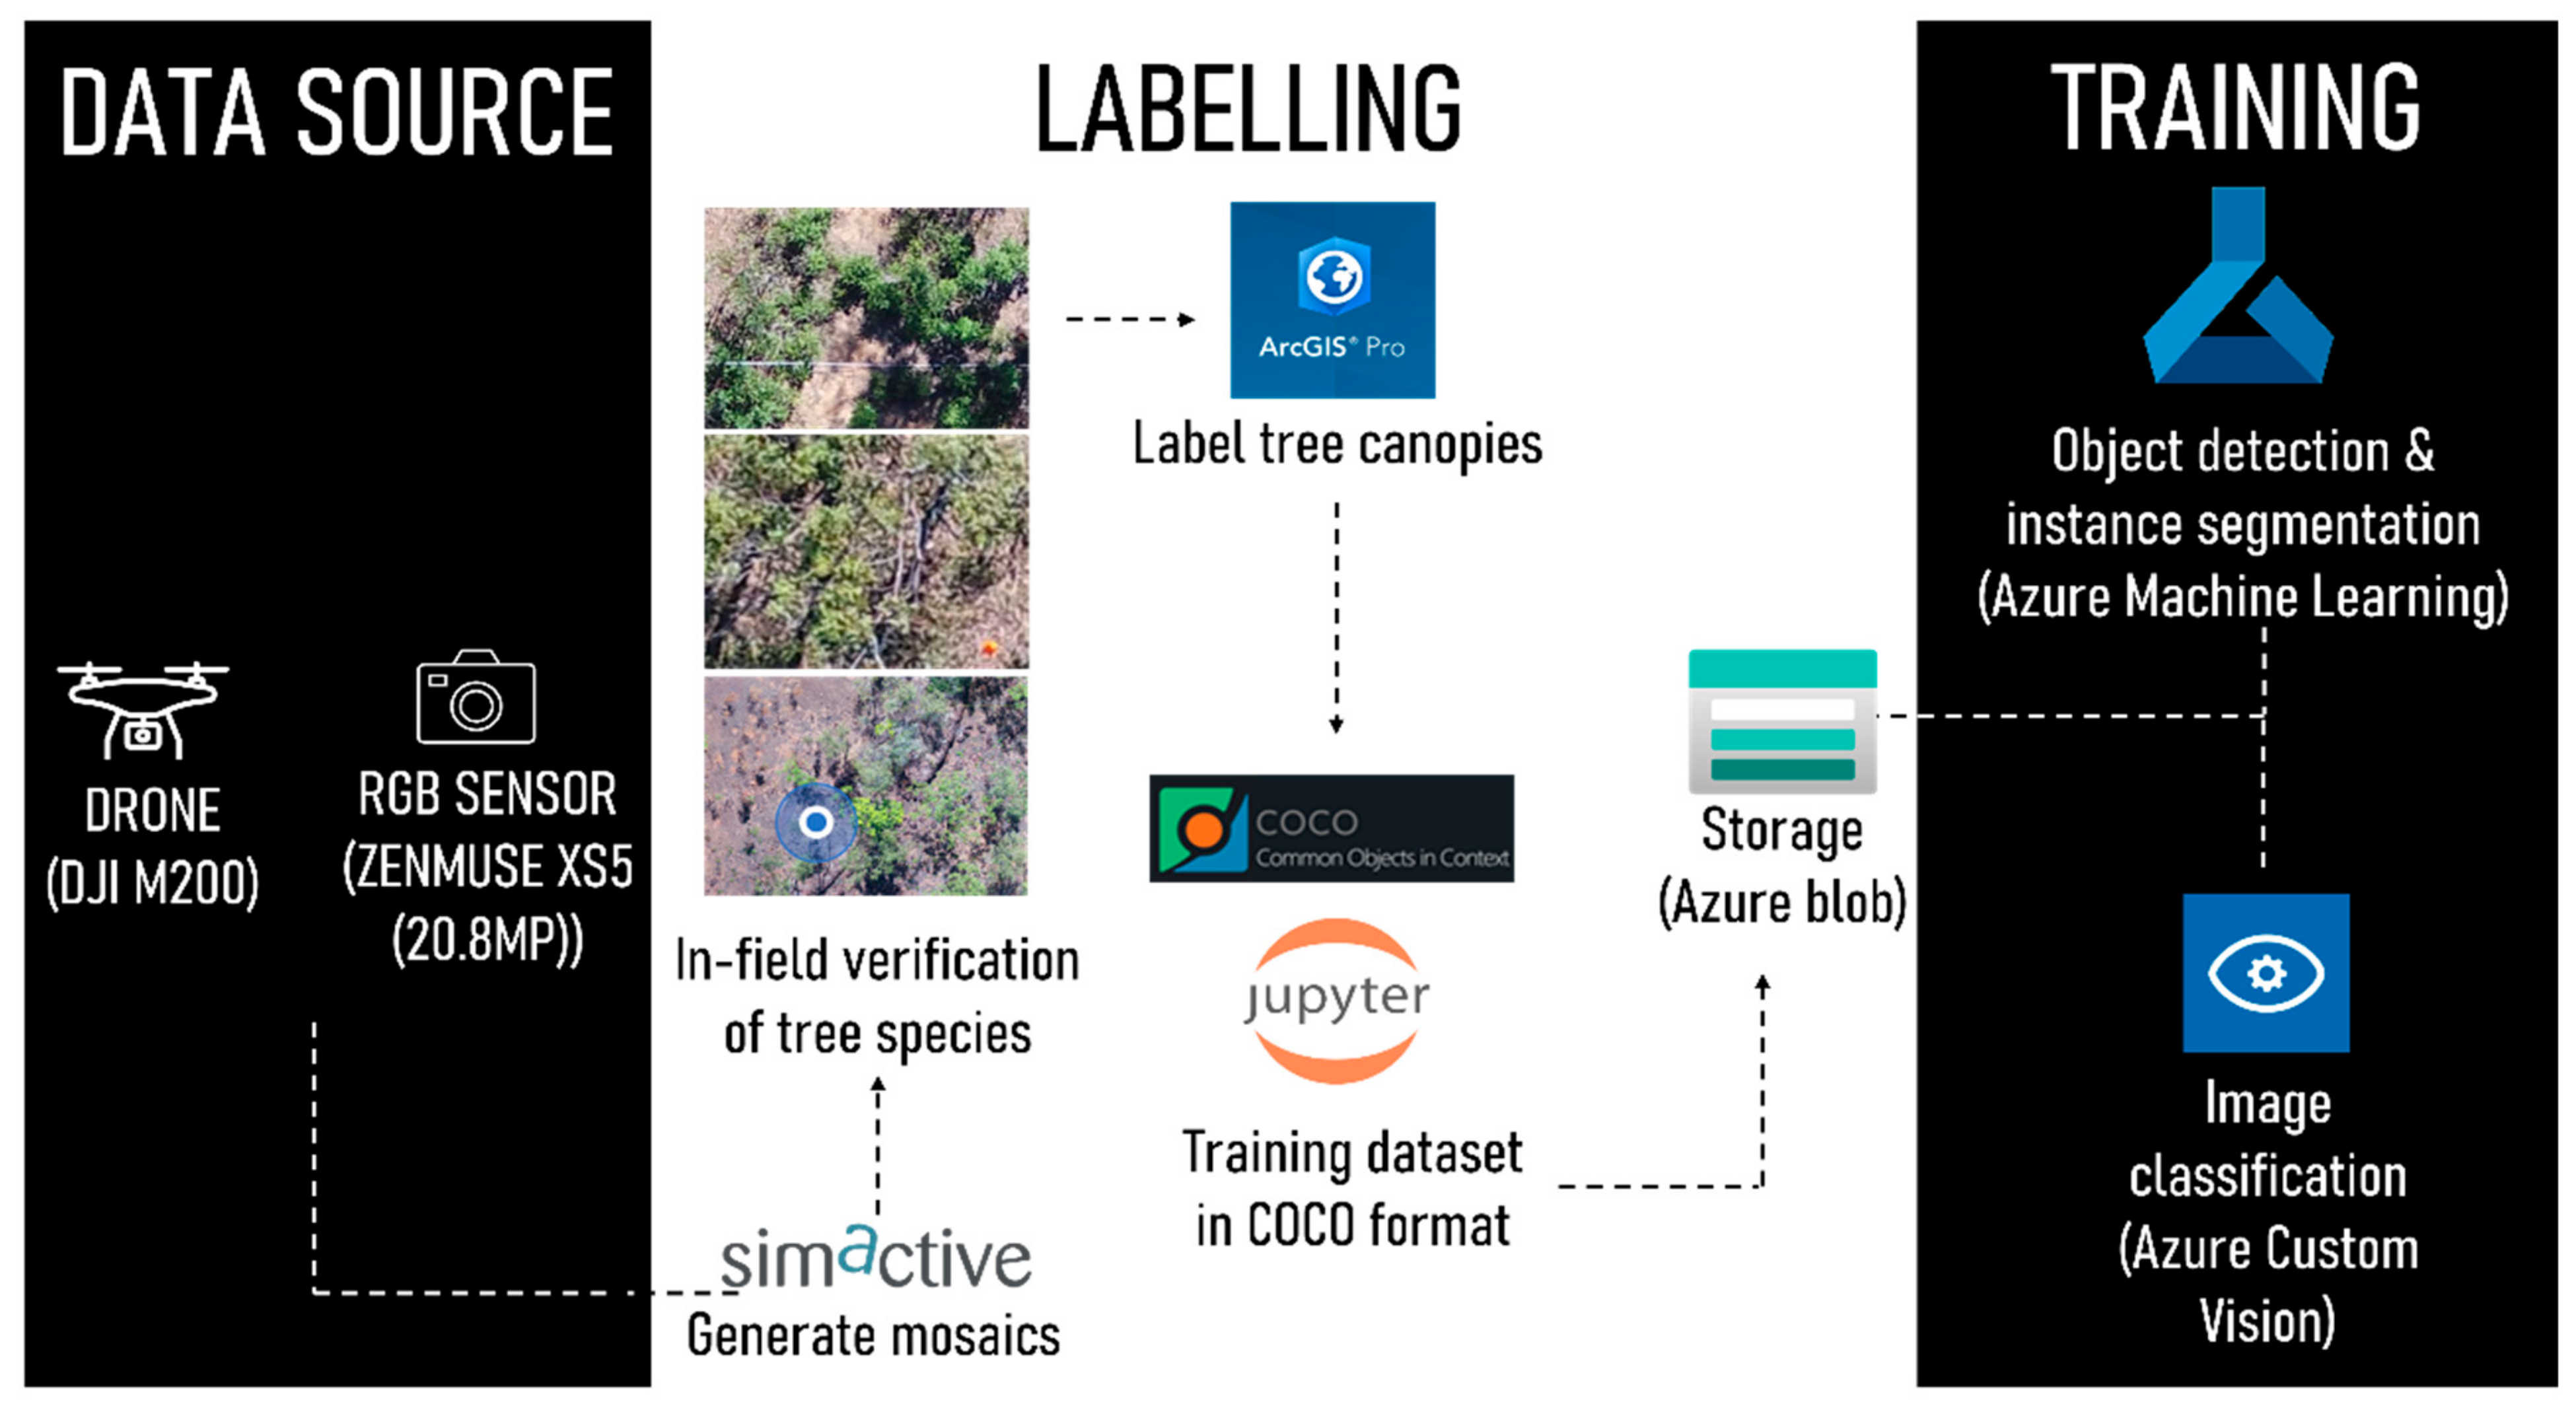
3. Methods
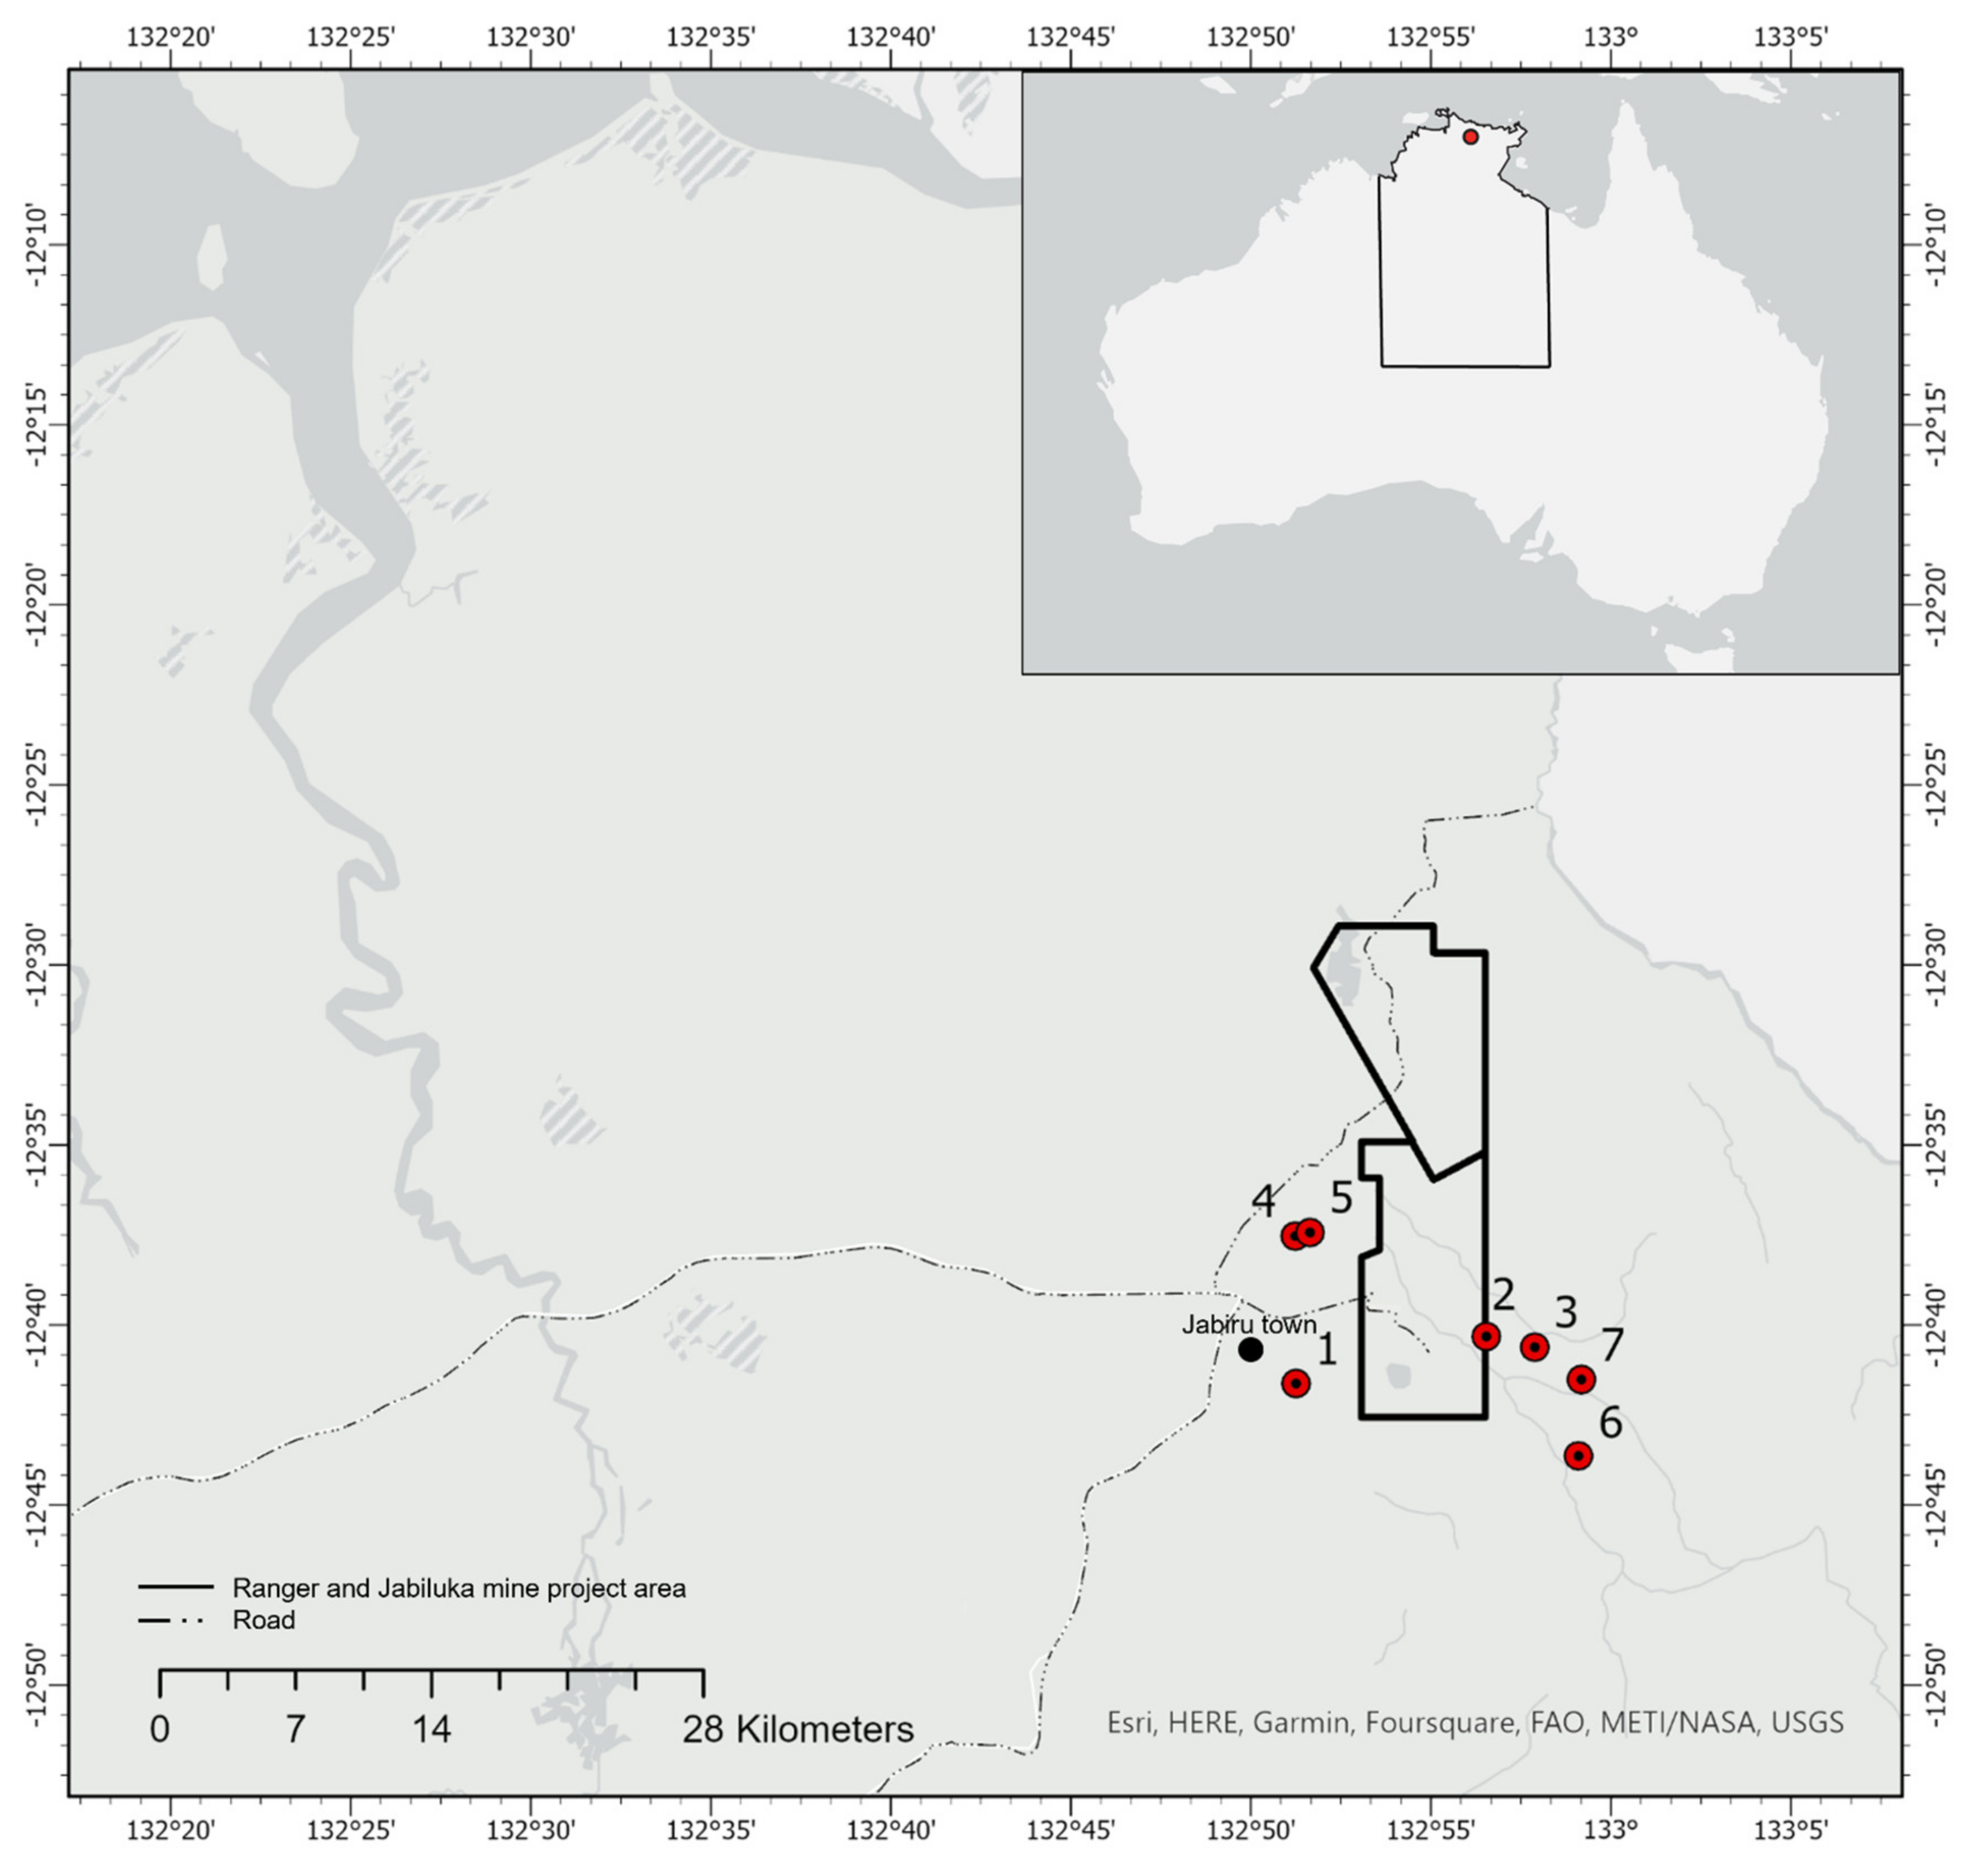
3.1. Plot Setup
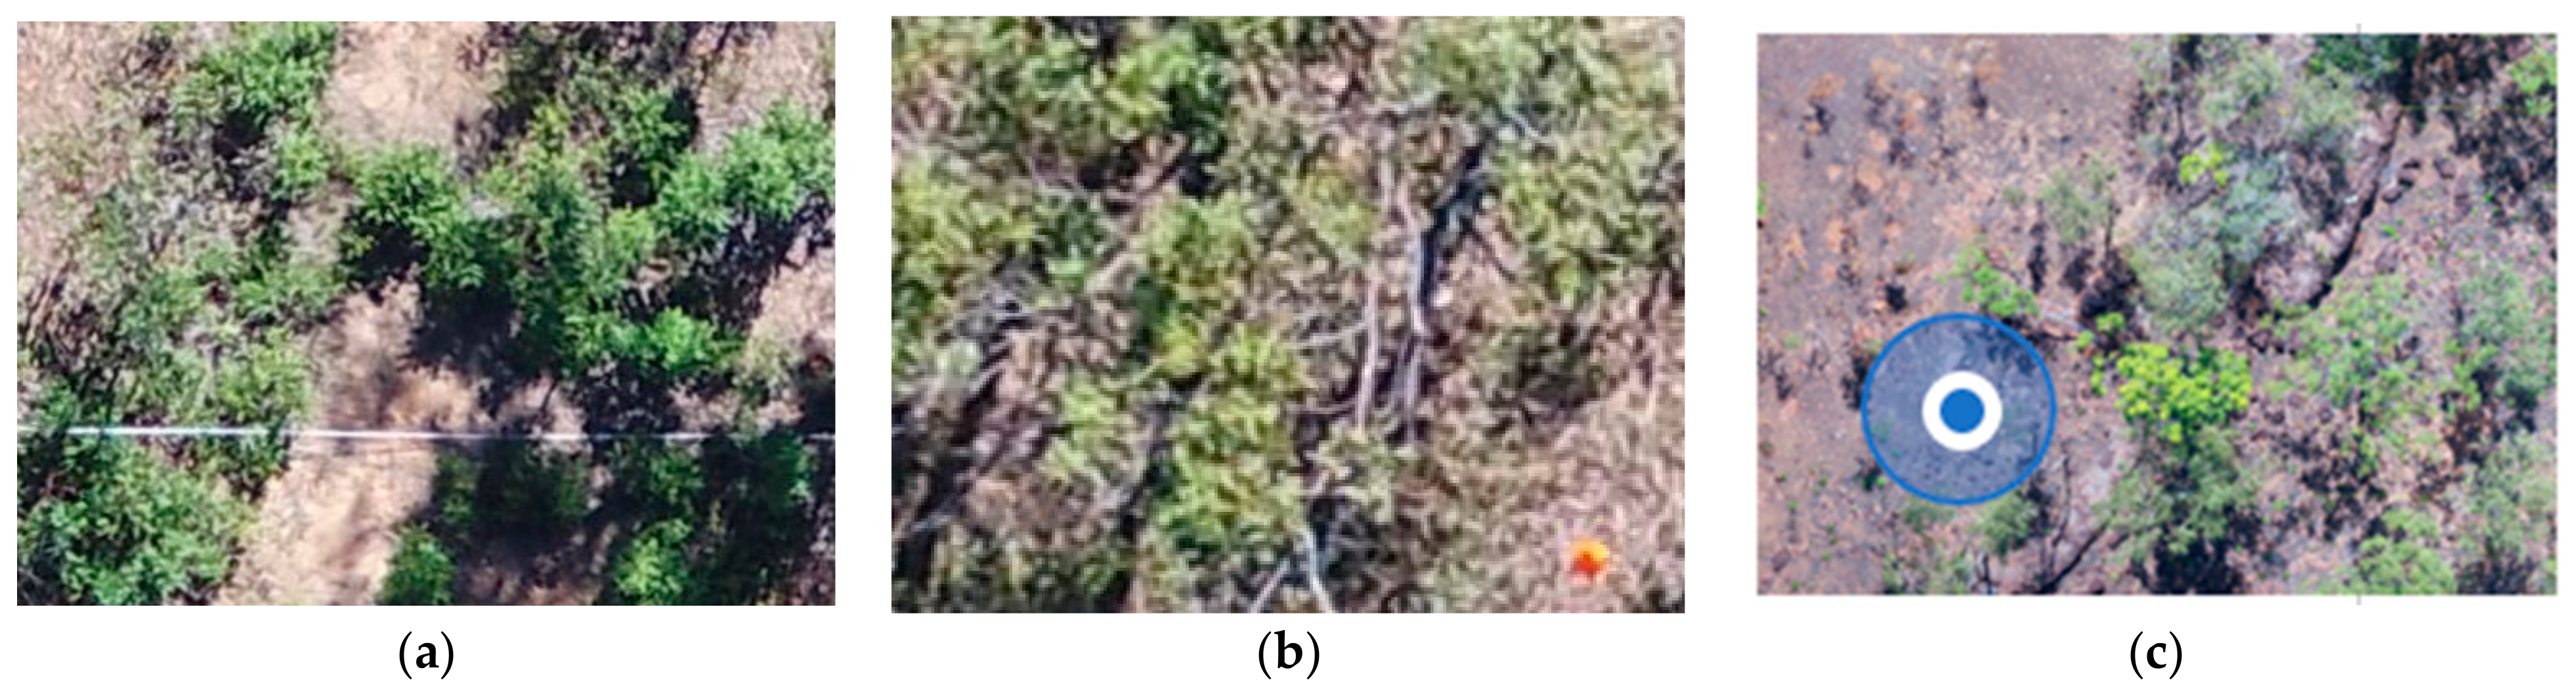
3.2. Image Capture
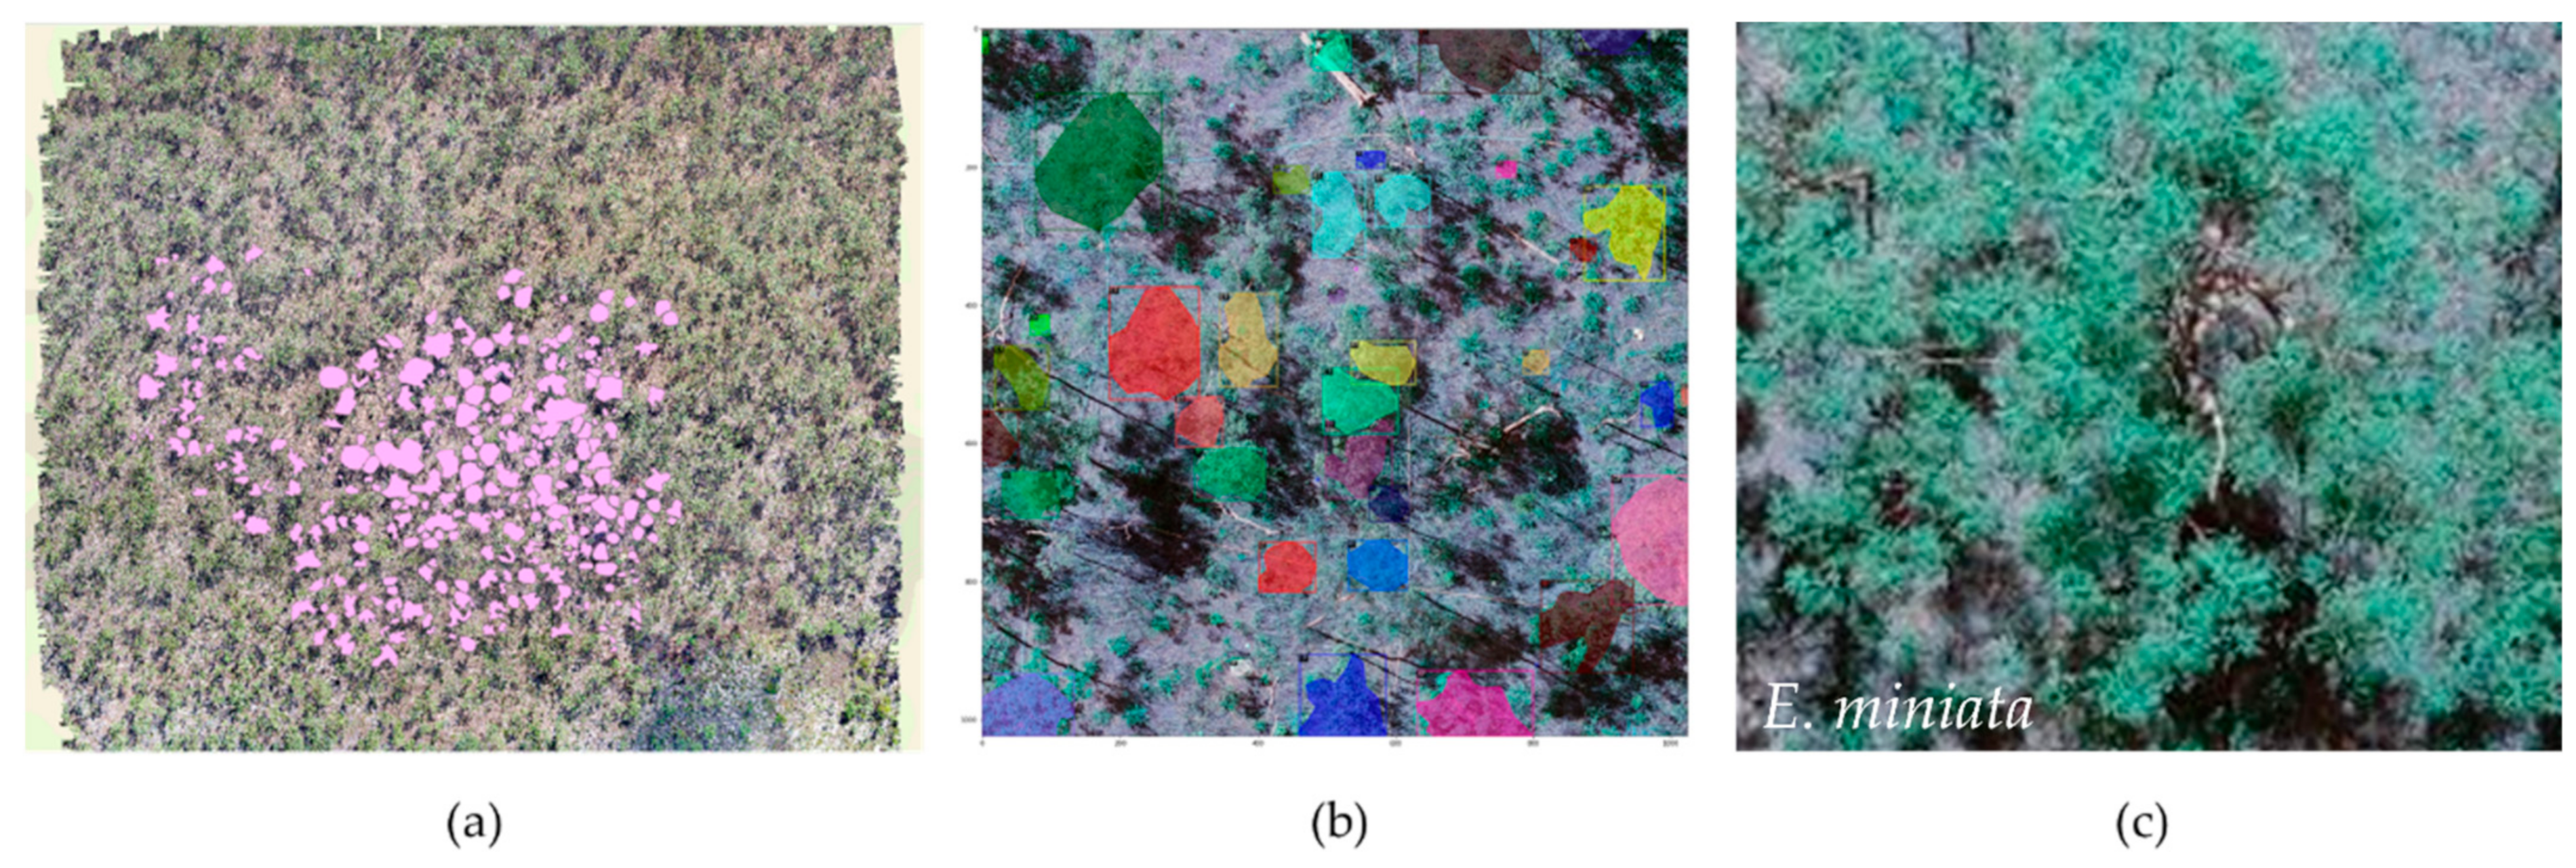
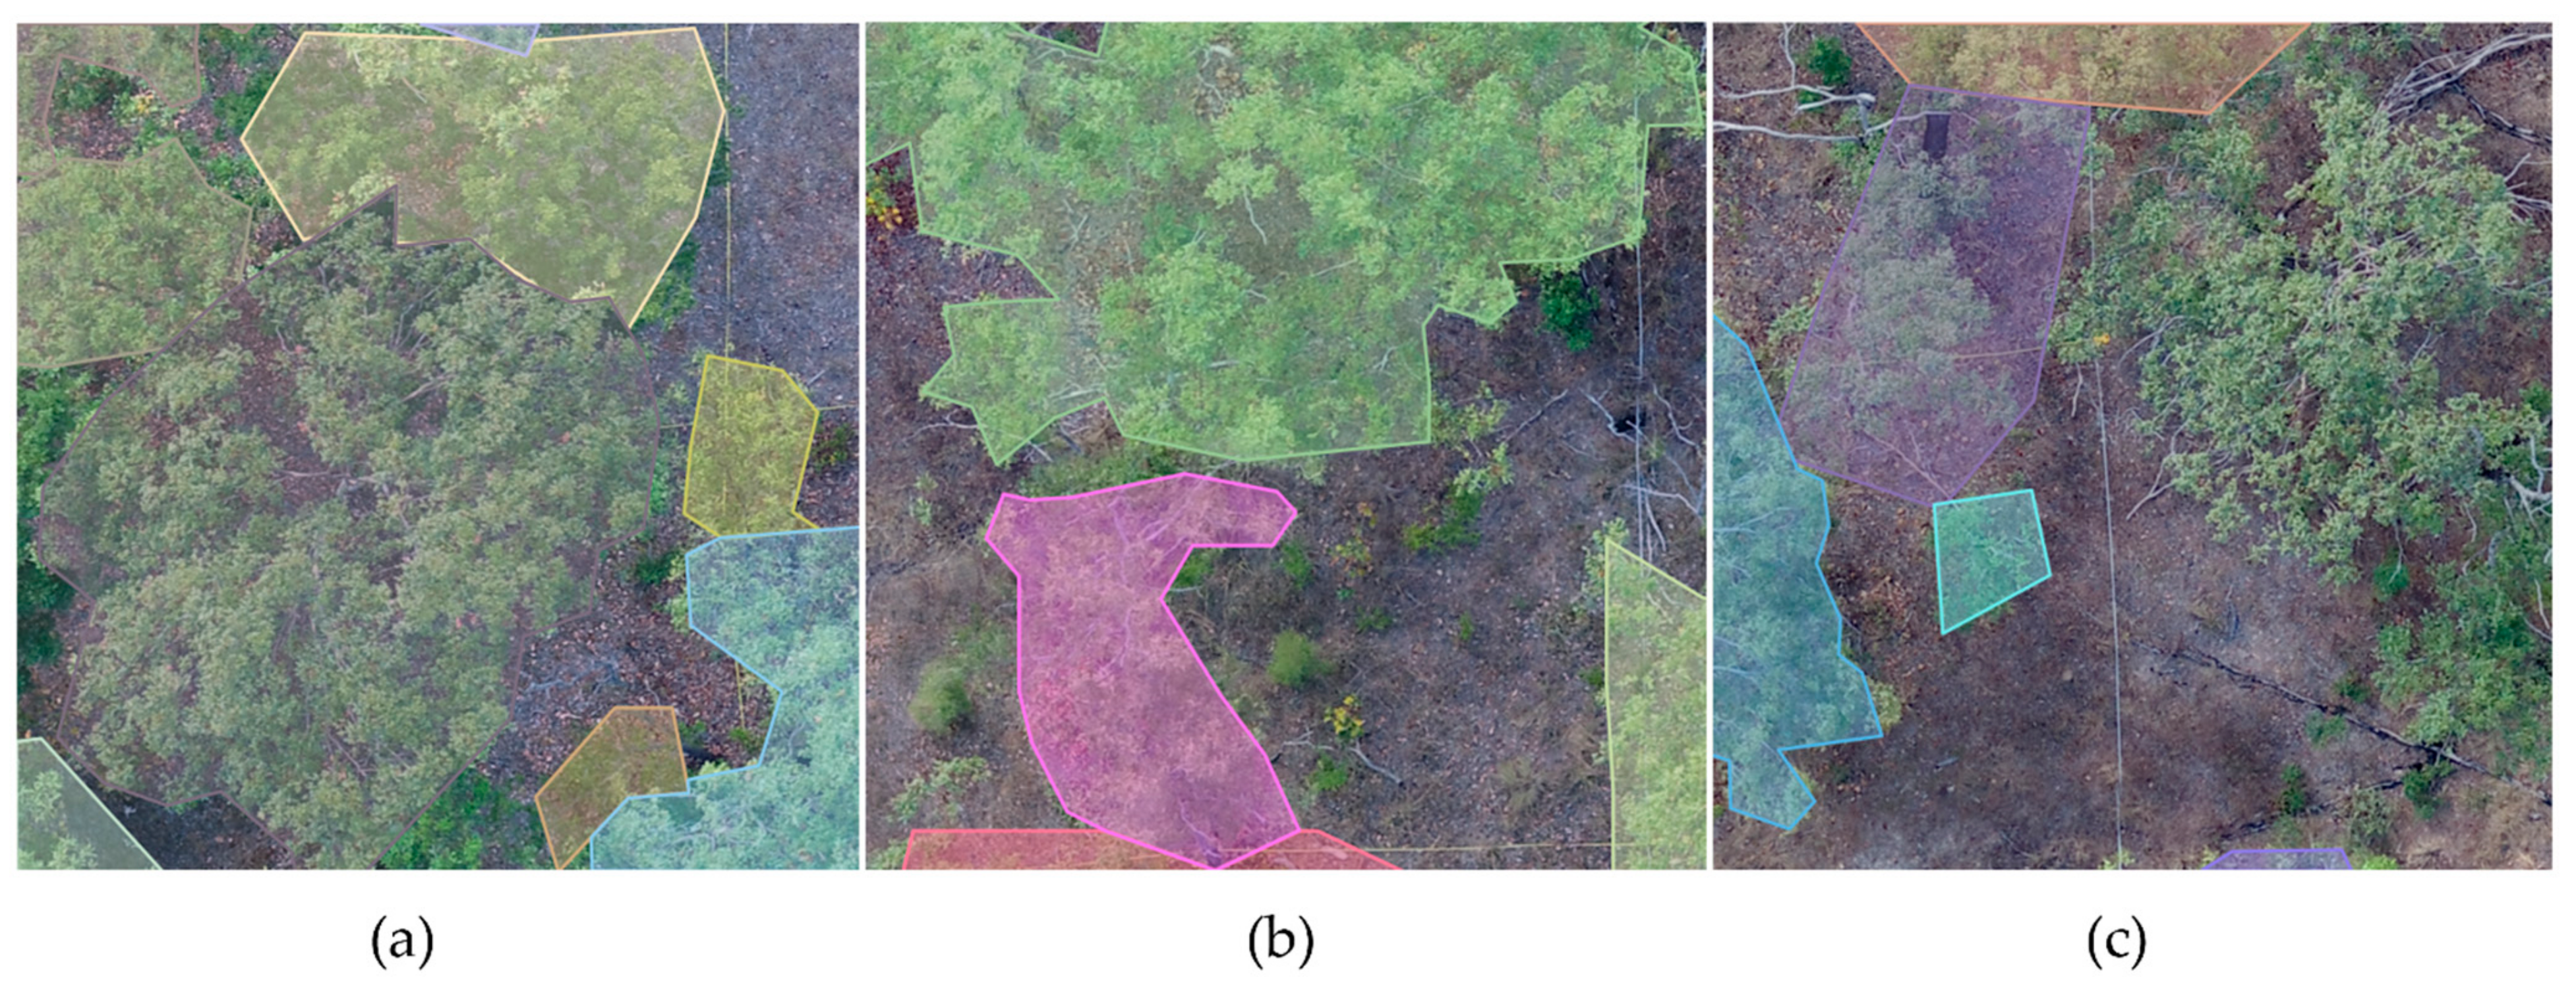
3.3. Field-Based Image Labelling
3.4. Preparing Plot Data for Deep Learning
3.5. Deep Learning Model Training and Preliminary Results
3.5.1. Instance Segmentation
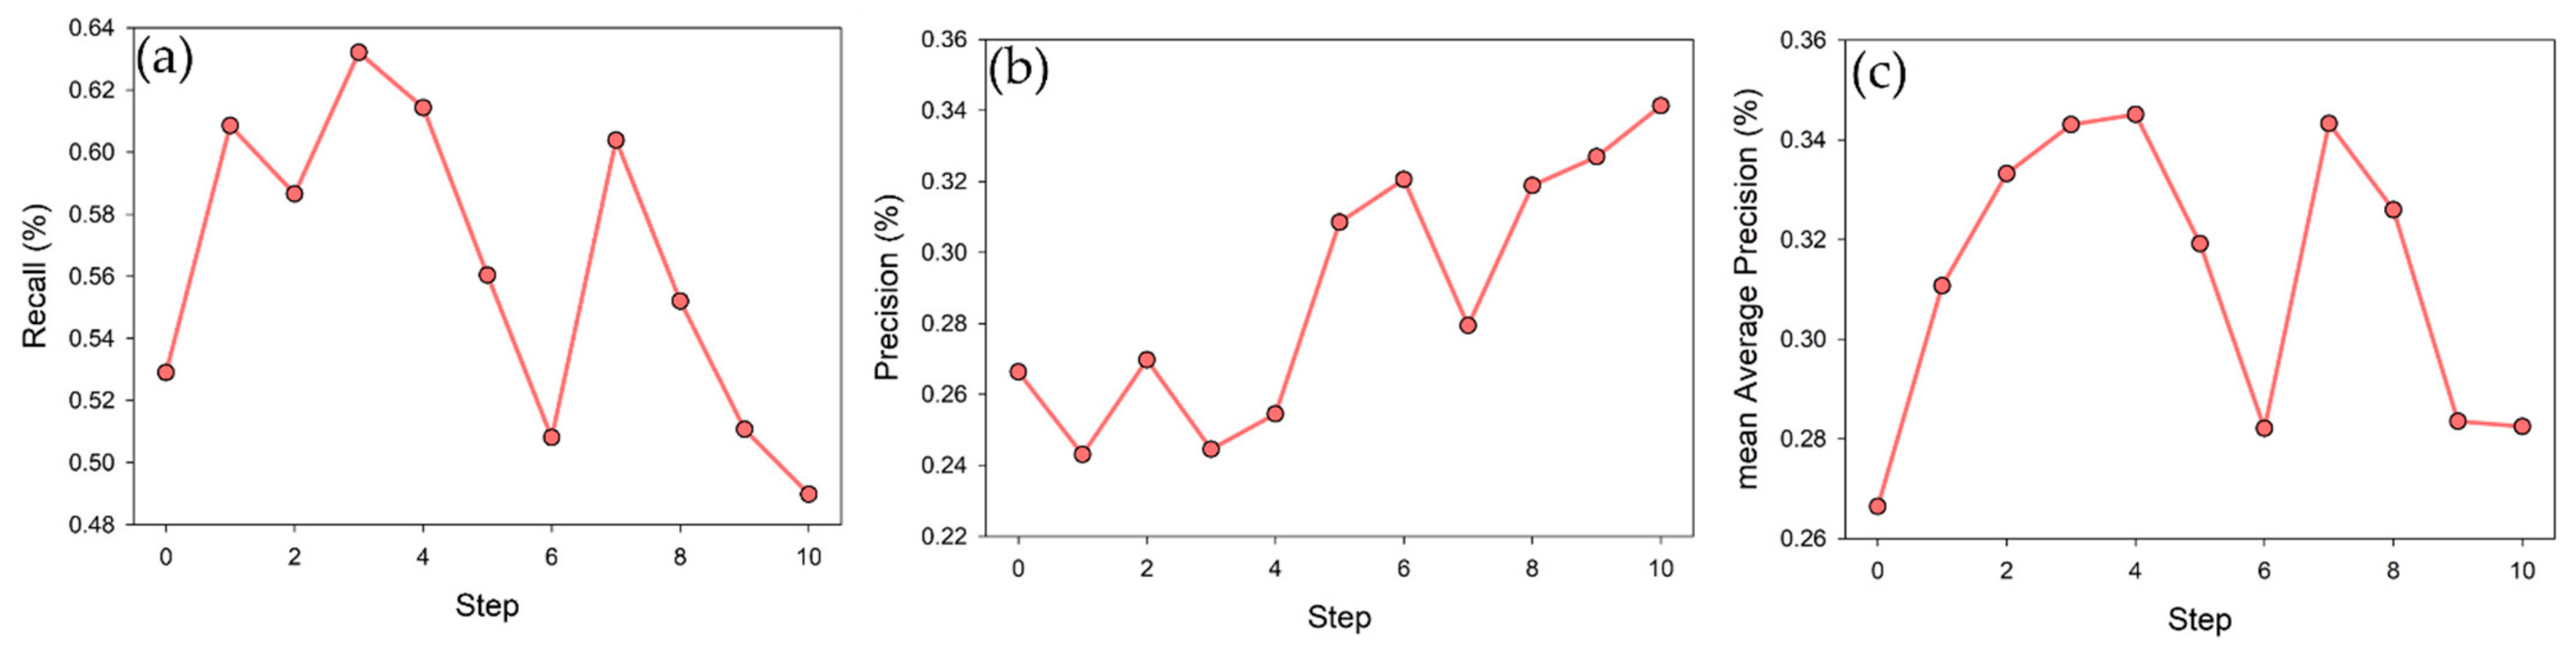
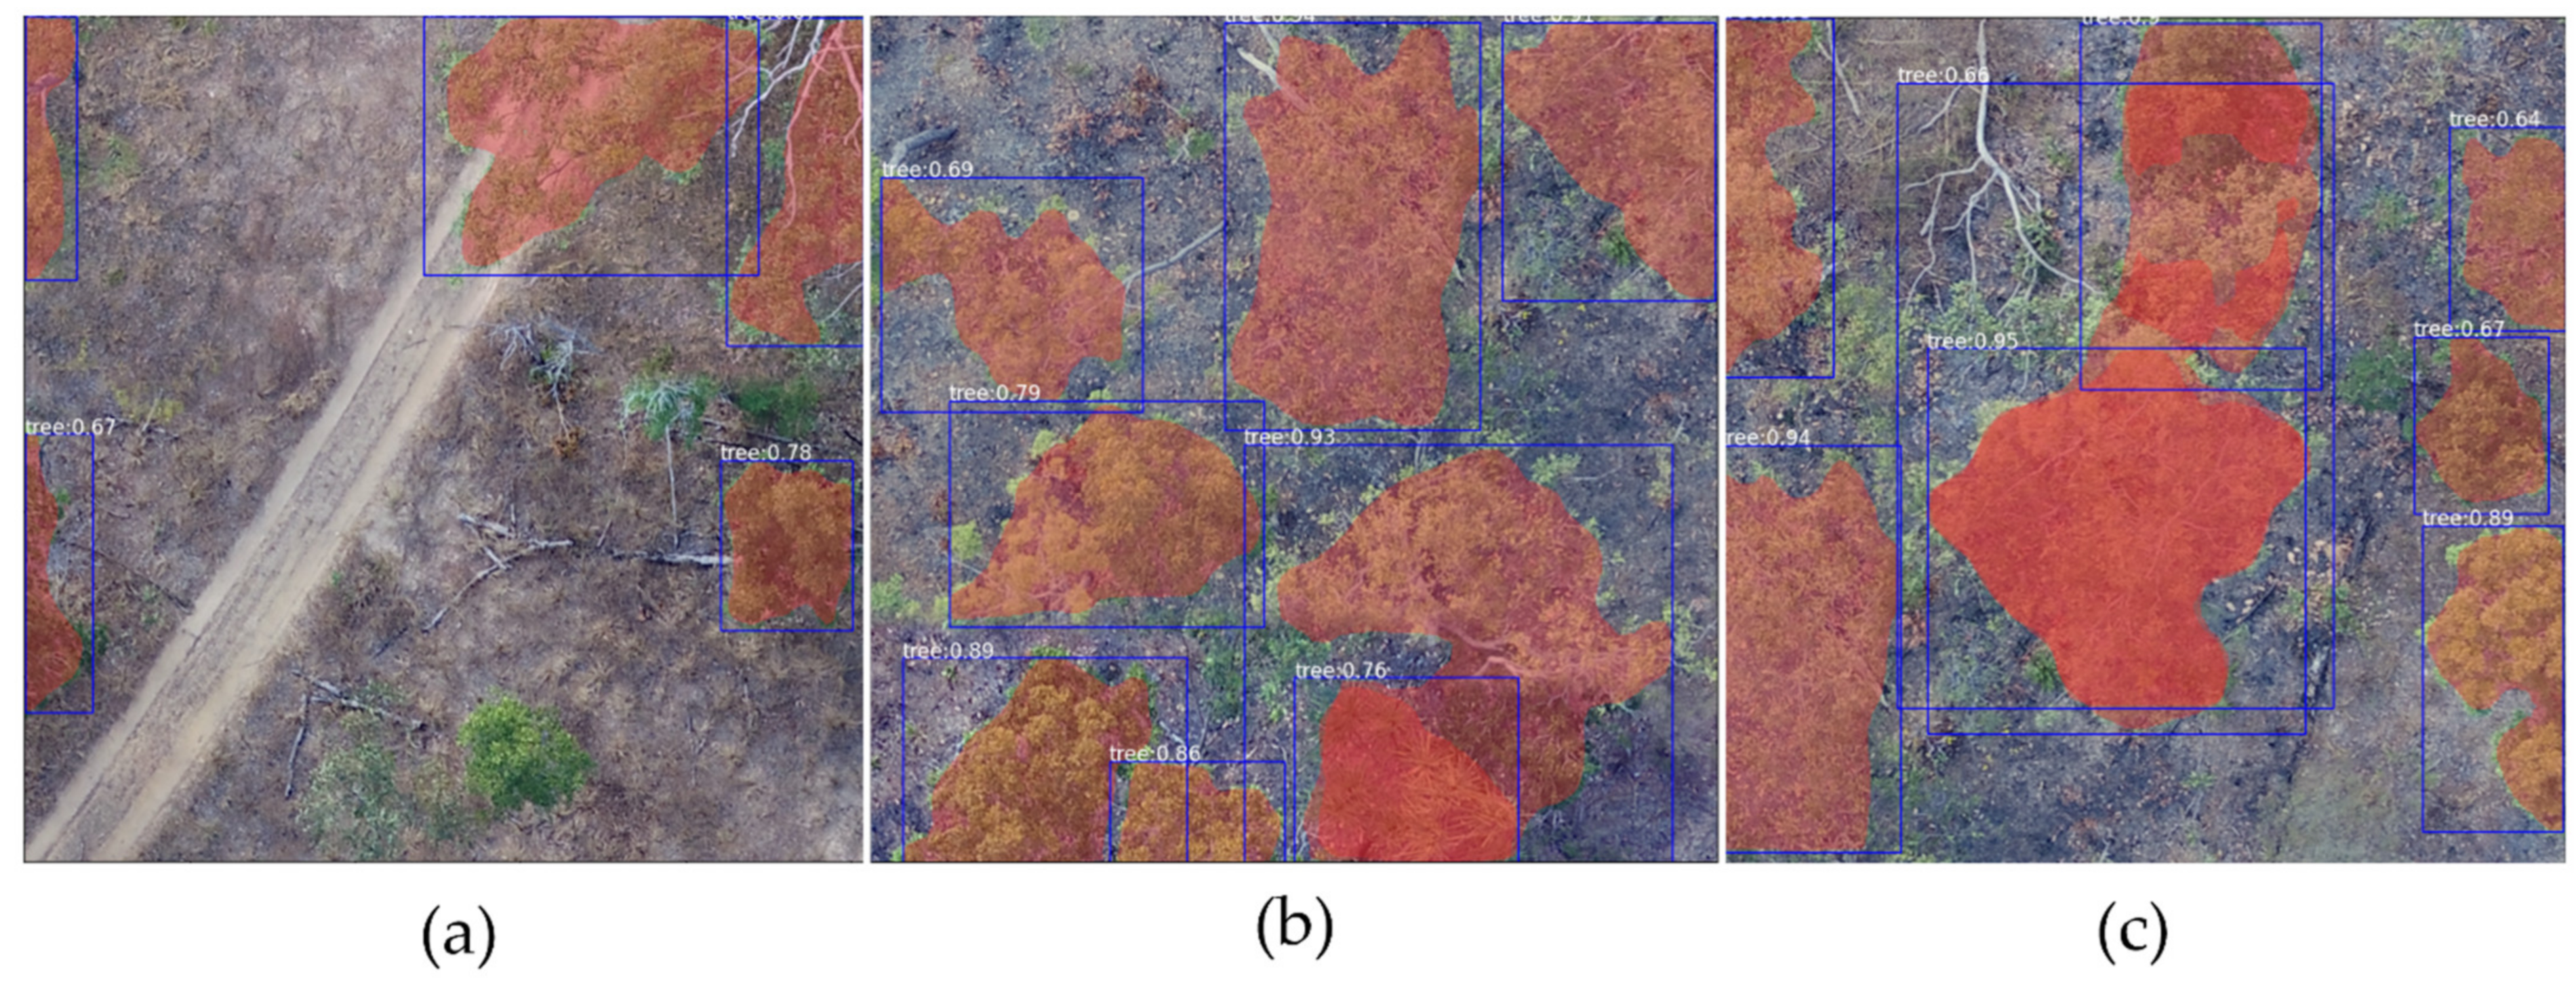
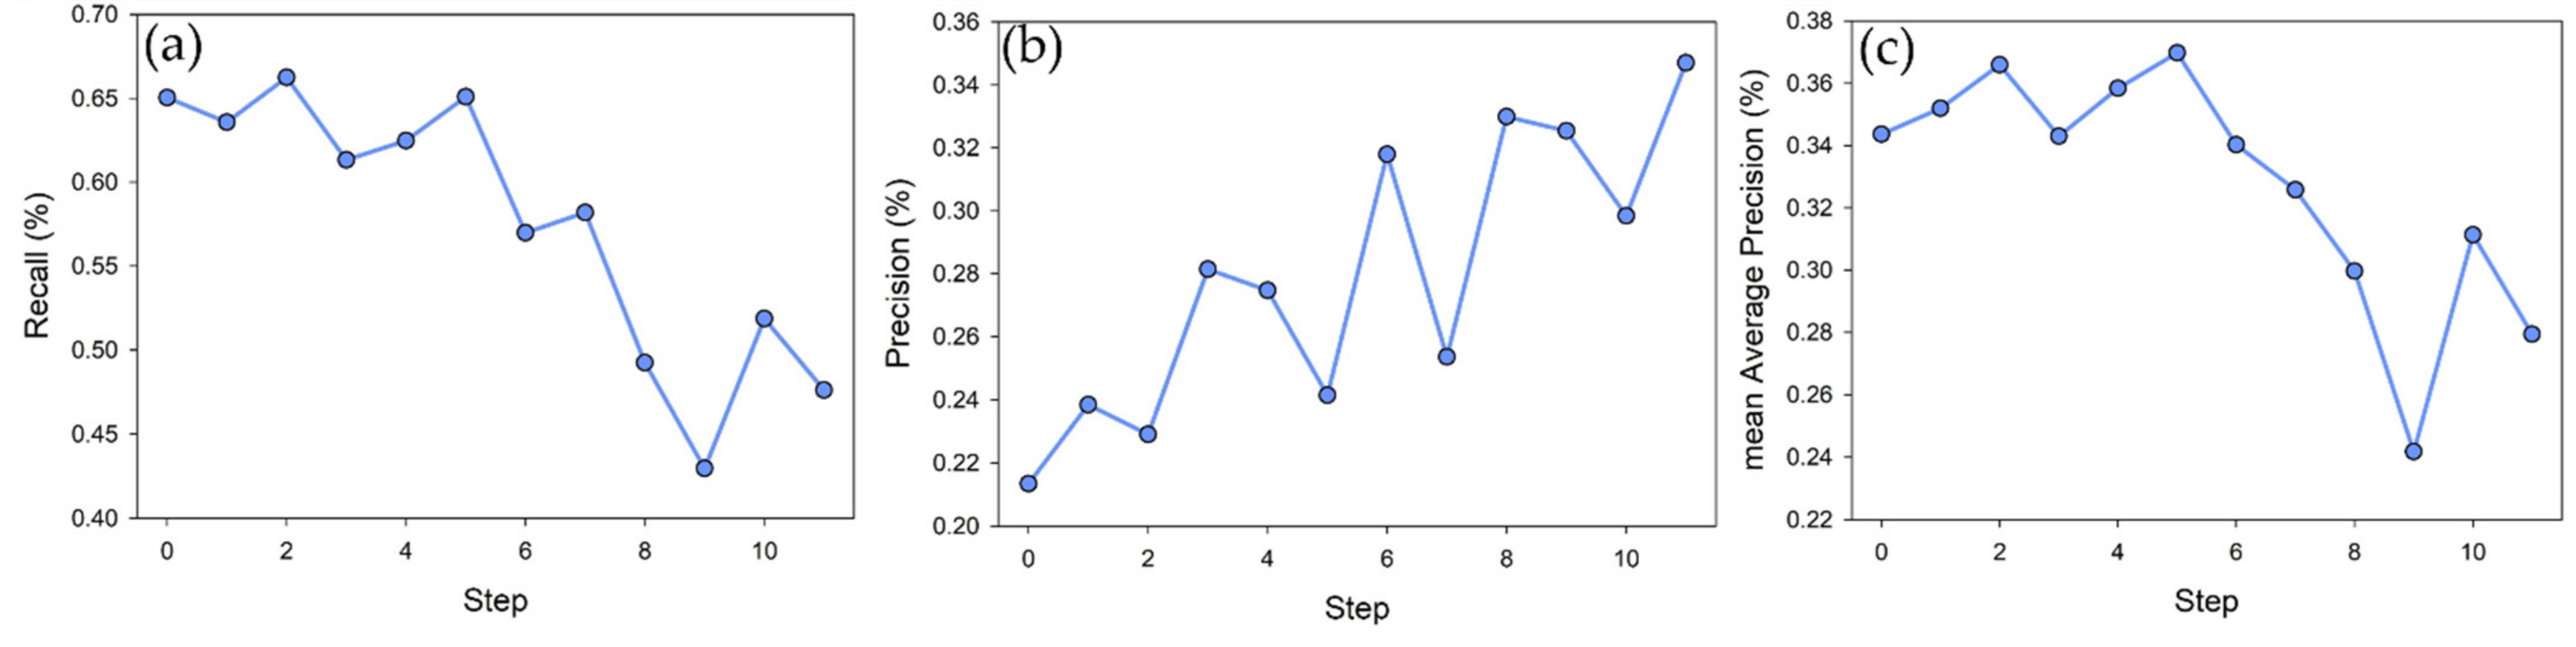
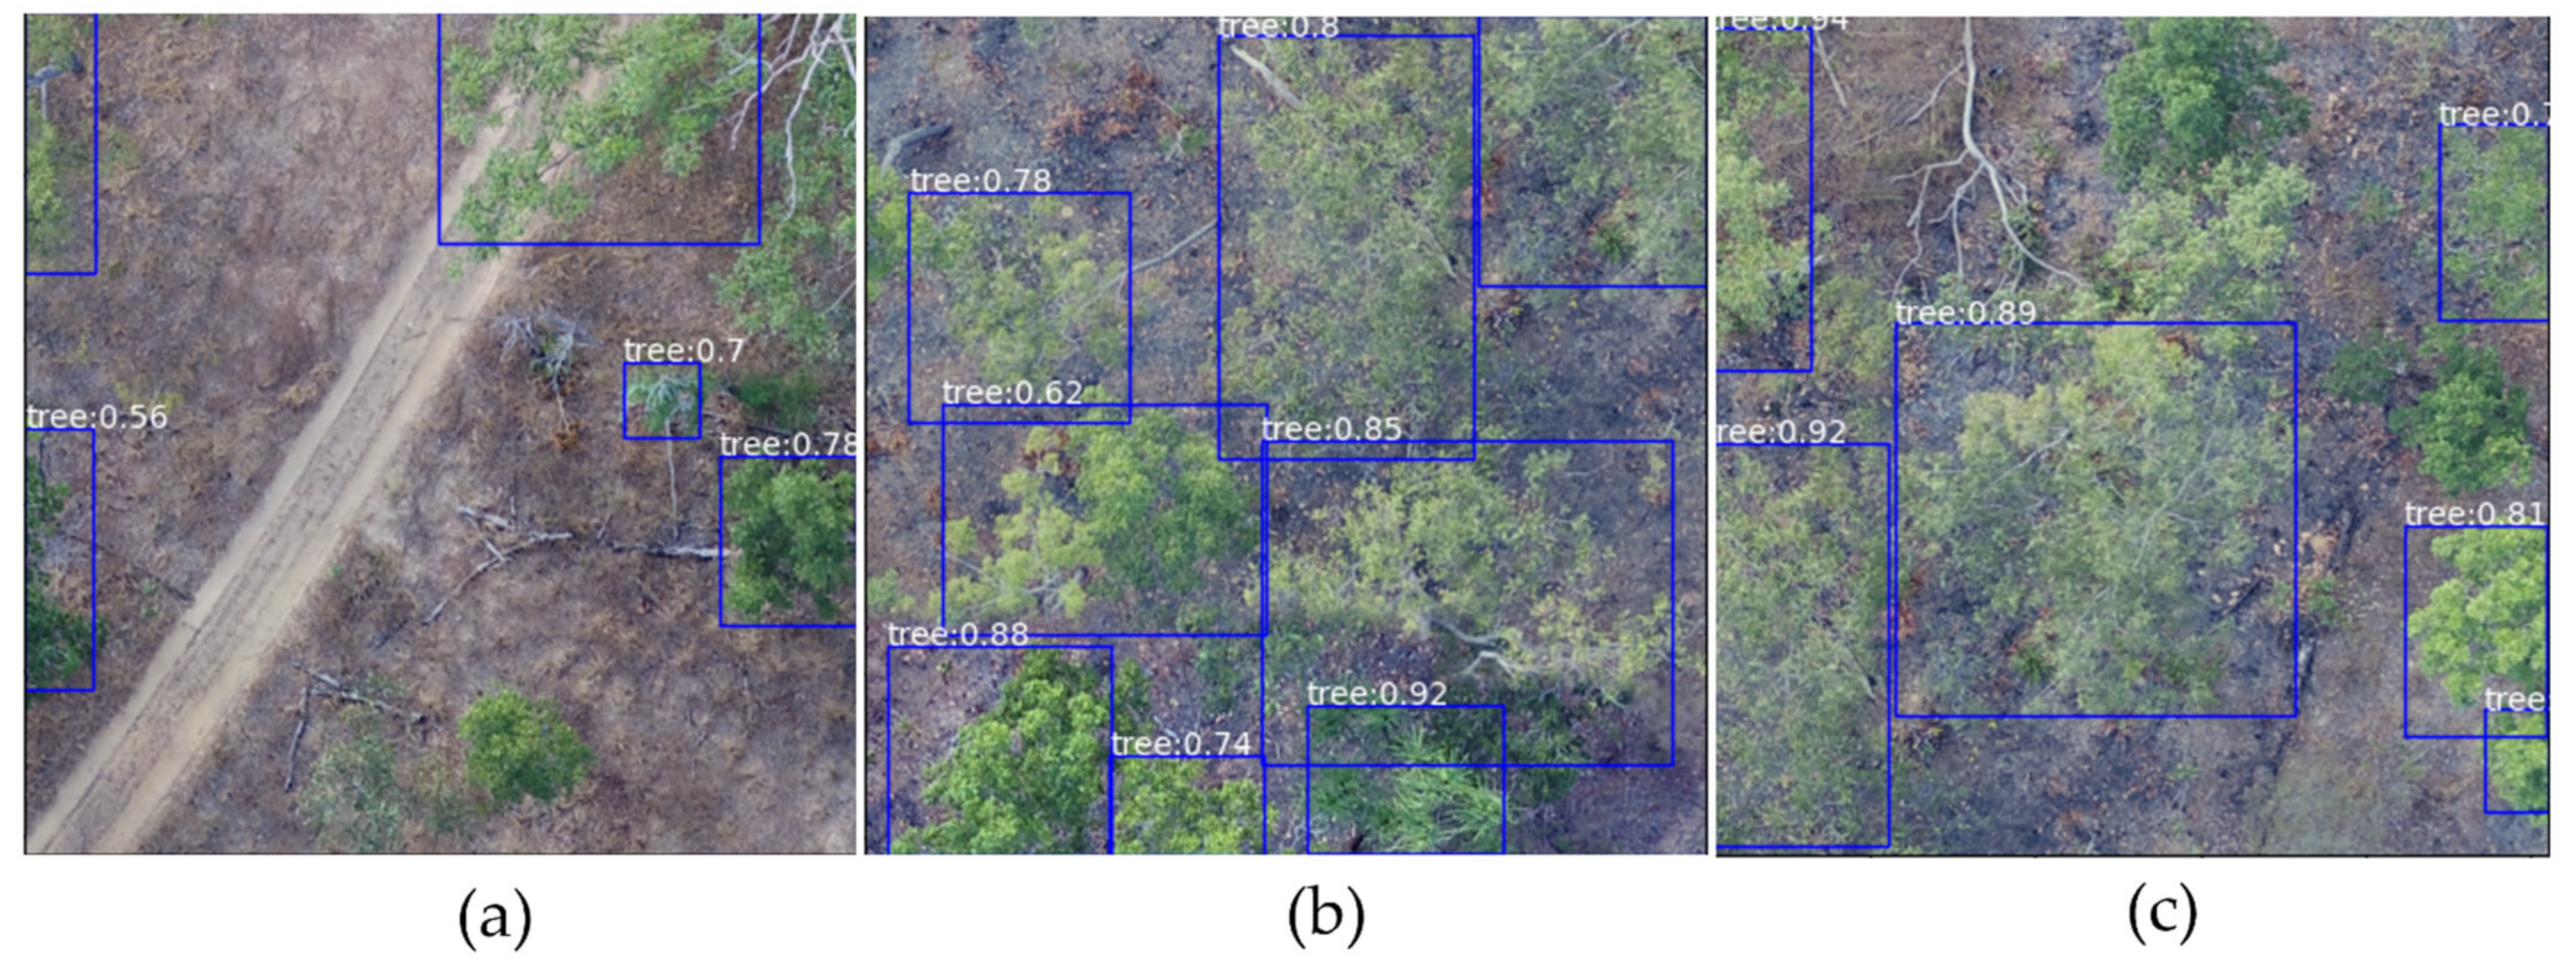
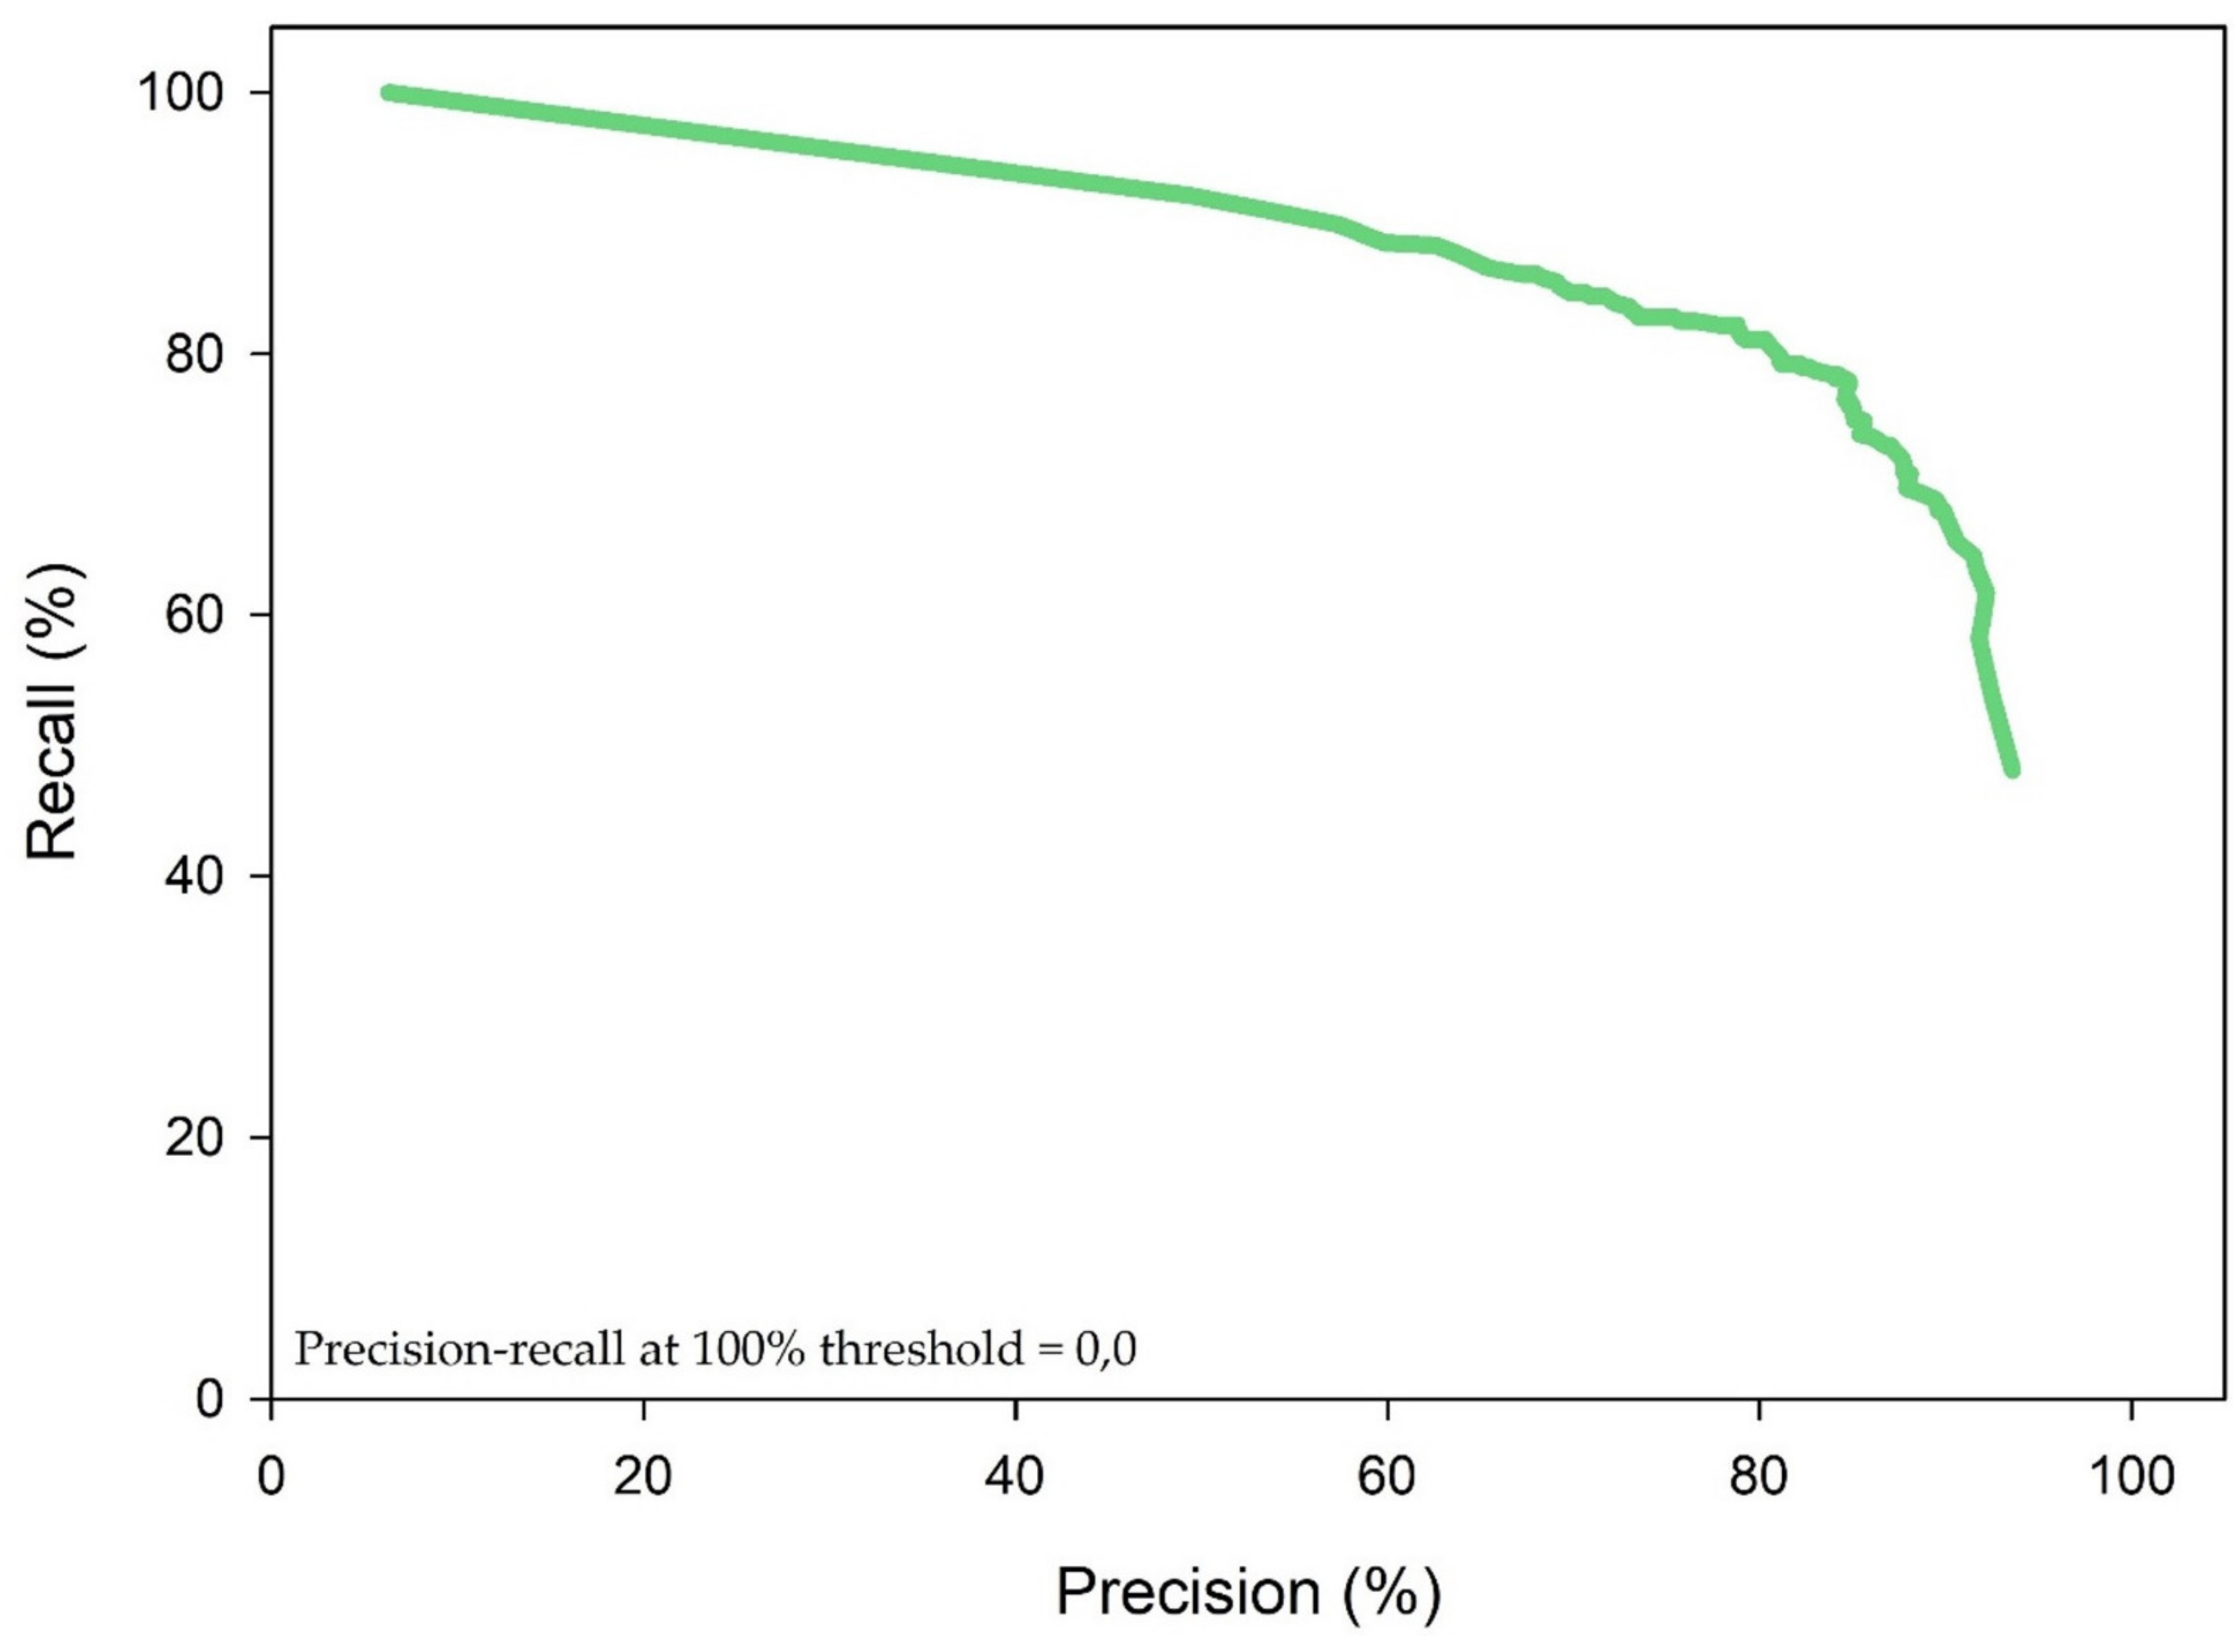
3.5.2. Object Detection
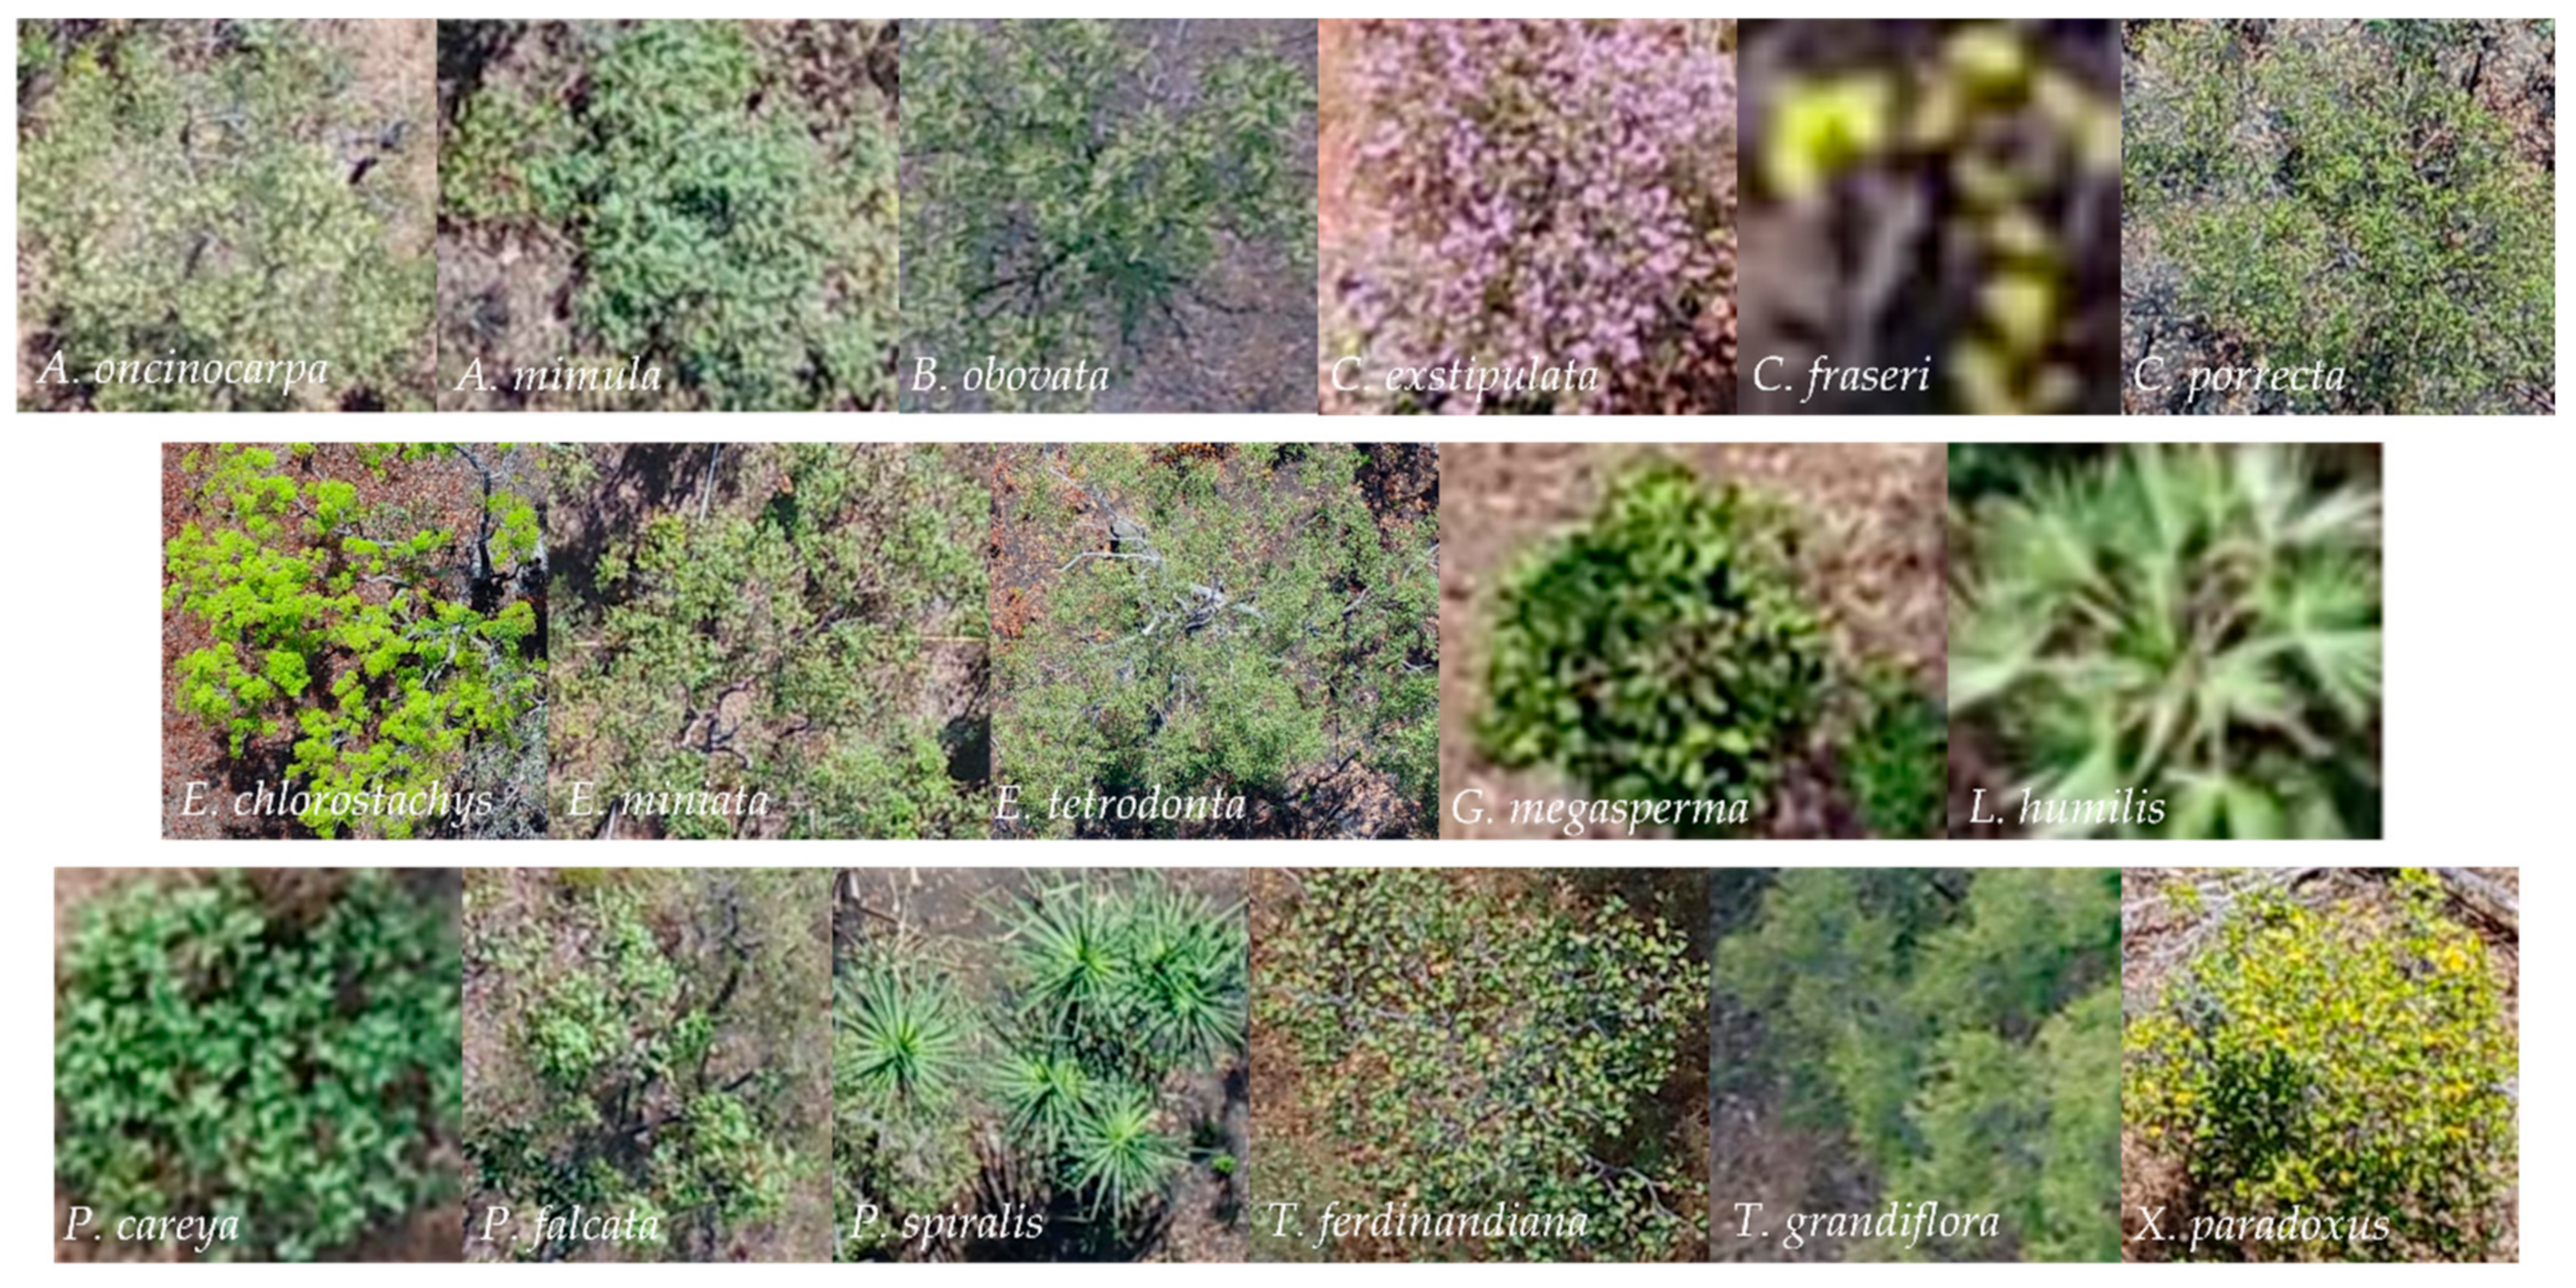
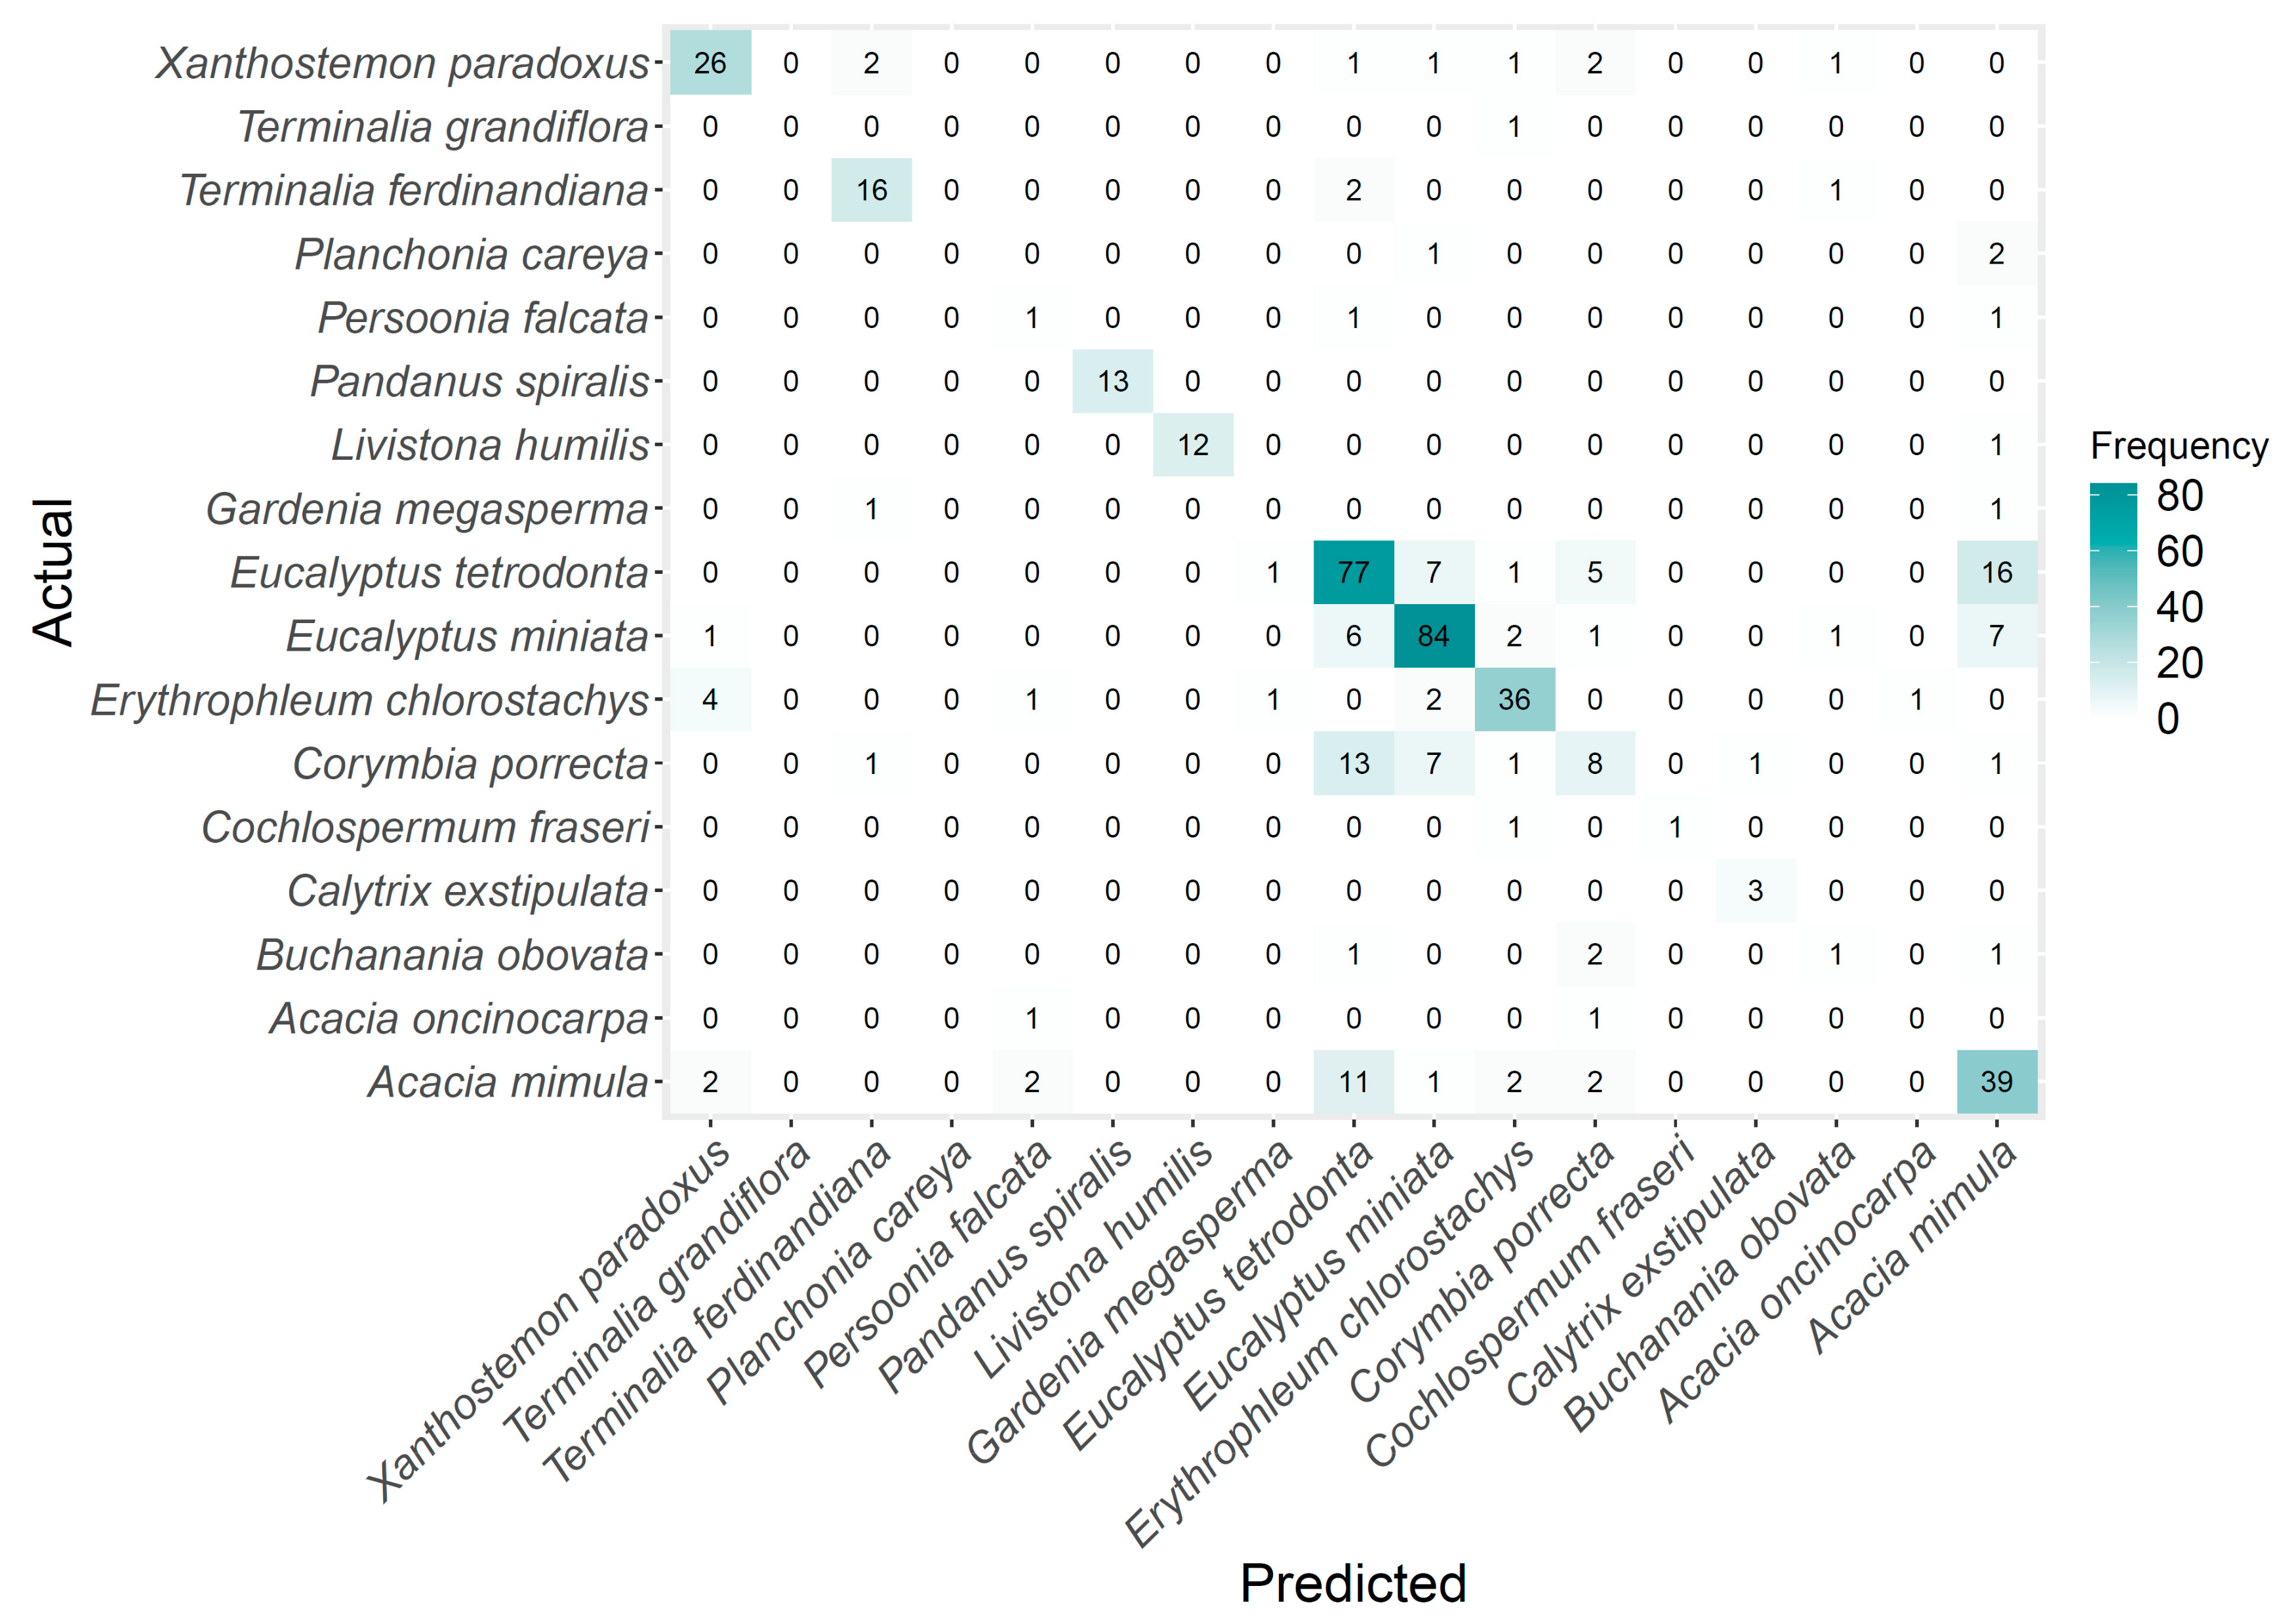
3.5.3. Image Classification (Multiclass)
4. Conclusions
5. User Notes
Author Contributions
Funding
Institutional Review Board Statement
Informed Consent Statement
Data Availability Statement
Acknowledgments
Conflicts of Interest
References
- Hutley, L.B.; Setterfield, S.A. Savanna. In Encyclopedia of Ecology; Elsevier: Amsterdam, The Netherlands, 2019; pp. 623–633. [Google Scholar]
- Naidoo, L.; Cho, M.A.; Mathieu, R.; Asner, G. Classification of savanna tree species, in the Greater Kruger National Park region, by integrating hyperspectral and LiDAR data in a Random Forest data mining environment. ISPRS J. Photogramm. Remote Sens. 2012, 69, 167–179. [Google Scholar] [CrossRef]
- Anchang, J.Y.; Prihodko, L.; Ji, W.; Kumar, S.S.; Ross, C.W.; Yu, Q.; Lind, B.; Sarr, M.A.; Diouf, A.A.; Hanan, N.P. Toward operational mapping of woody canopy cover in tropical savannas using Google Earth Engine. Front. Environ. Sci. 2020, 8, 4. [Google Scholar] [CrossRef] [Green Version]
- Humphrey, G.; Eastment, C.; Gillson, L.; Timm Hoffman, M. Woody cover change in relation to fire history and land-use in the savanna-woodlands of north-east Namibia (1996–2019). Afr. J. Range Forage Sci. 2022, 39, 96–106. [Google Scholar] [CrossRef]
- Kolarik, N.E.; Gaughan, A.E.; Stevens, F.R.; Pricope, N.G.; Woodward, K.; Cassidy, L.; Salerno, J.; Hartter, J. A multi-plot assessment of vegetation structure using a micro-unmanned aerial system (UAS) in a semi-arid savanna environment. ISPRS J. Photogramm. Remote Sens. 2020, 164, 84–96. [Google Scholar] [CrossRef] [Green Version]
- Hernandez-Santin, L.; Rudge, M.L.; Bartolo, R.E.; Whiteside, T.G.; Erskine, P.D. Reference site selection protocols for mine site ecosystem restoration. Restor. Ecol. 2021, 29, e13278. [Google Scholar] [CrossRef]
- Loewensteiner, D.A.; Bartolo, R.E.; Whiteside, T.G.; Esparon, A.J.; Humphrey, C.L. Measuring savanna woody cover at scale to inform ecosystem restoration. Ecosphere 2021, 12, e03437. [Google Scholar] [CrossRef]
- Baldeck, C.A.; Asner, G.P.; Martin, R.E.; Anderson, C.B.; Knapp, D.E.; Kellner, J.R.; Wright, S.J. Operational tree species mapping in a diverse tropical forest with airborne imaging spectroscopy. PloS ONE 2015, 10, e0118403. [Google Scholar] [CrossRef]
- Colgan, M.S.; Baldeck, C.A.; Féret, J.-B.; Asner, G.P. Mapping savanna tree species at ecosystem scales using support vector machine classification and BRDF correction on airborne hyperspectral and LiDAR data. Remote Sens. 2012, 4, 3462–3480. [Google Scholar] [CrossRef] [Green Version]
- Sothe, C.; Dalponte, M.; Almeida, C.M.d.; Schimalski, M.B.; Lima, C.L.; Liesenberg, V.; Miyoshi, G.T.; Tommaselli, A.M.G. Tree species classification in a highly diverse subtropical forest integrating UAV-based photogrammetric point cloud and hyperspectral data. Remote Sens. 2019, 11, 1338. [Google Scholar] [CrossRef] [Green Version]
- Almeida, J.S. Predictive non-linear modeling of complex data by artificial neural networks. Curr. Opin. Biotechnol. 2002, 13, 72–76. [Google Scholar] [CrossRef] [PubMed]
- Deng, J.; Dong, W.; Socher, R.; Li, L.-J.; Li, K.; Fei-Fei, L. Imagenet: A large-scale hierarchical image database. In Proceedings of the 2009 IEEE Conference on Computer Vision and Pattern Recognition, Miami, FI, USA, 20–25 June 2009; pp. 248–255. [Google Scholar]
- Lin, T.-Y.; Maire, M.; Belongie, S.; Hays, J.; Perona, P.; Ramanan, D.; Dollár, P.; Zitnick, C.L. Microsoft coco: Common objects in context. In Proceedings of the European Conference on Computer Vision, Zurich, Switzerland, 6–12 September 2014; pp. 740–755. [Google Scholar]
- Weinstein, B.G.; Marconi, S.; Bohlman, S.; Zare, A.; White, E. Individual tree-crown detection in RGB imagery using semi-supervised deep learning neural networks. Remote Sens. 2019, 11, 1309. [Google Scholar] [CrossRef] [Green Version]
- Wegner, J.D.; Branson, S.; Hall, D.; Schindler, K.; Perona, P. Cataloging public objects using aerial and street-level images-urban trees. In Proceedings of the IEEE Conference on Computer Vision and Pattern Recognition, Las Vegas, NV, USA, 30 June 2016; pp. 6014–6023. [Google Scholar]
- Rukundo, O. Effects of Image Size on Deep Learning. arXiv 2021, arXiv:2101.11508. [Google Scholar]
- Sabottke, C.F.; Spieler, B.M. The effect of image resolution on deep learning in radiography. Radiol. Artif. Intell. 2020, 2, e190015. [Google Scholar] [CrossRef] [PubMed]
- Azure Machine Learning. Available online: https://azure.microsoft.com/en-gb/products/machine-learning/#product-overview (accessed on 1 November 2021).
- Custom Vision. Available online: https://azure.microsoft.com/en-us/products/cognitive-services/custom-vision-service/ (accessed on 1 December 2019).
- He, K.; Gkioxari, G.; Dollár, P.; Girshick, R. Mask r-cnn. In Proceedings of the IEEE International Conference on Computer Vision, Venice, Italy, 22–29 October 2017; pp. 2961–2969. [Google Scholar]


| Plot | Number of Polygons [Classes] | Top Three Dominant Tree Species Per Plot |
|---|---|---|
| Site 1 | 219 [13] | Eucalyptus tetrodonta, Xanthostemon paradoxus, and Corymbia porrecta |
| Site 2 | 322 [17] | Acacia mimula, Eucalyptus tetrodonta, and Persoonia falcata |
| Site 3 | 169 [15] | Eucalyptus tetrodonta, Eucalyptus miniata, and Acacia mimula |
| Site 4 | 402 [18] | Eucalyptus tetrodonta, Eucalyptus miniata, and Erythrophleum chlorostachys |
| Site 5 | 538 [20] | Eucalyptus tetrodonta, Acacia lamprocarpa, and Acacia mimula |
| Site 6 | 365 [7] | Acacia mimula, Eucalyptus miniata, and Eucalyptus tetrodonta |
| Site 7 | 532 [17] | Eucalyptus tetrodonta, Erythrophleum chlorostachys, and Corymbia porrecta |
| Total | 2547 [36] | Eucalyptus tetrodonta, Acacia mimula, and Eucalyptus miniata |
| Species | Code (in Shape File) | Number of Polygons |
|---|---|---|
| Acacia dimidiata | ACDIM | 6 |
| Acacia lamprocarpa | ACLAM | 2 |
| Acacia mimula | ACMIM | 308 |
| Acacia oncinocarpa | ACONC | 8 |
| Brachychiton megaphyllus | BRMEG | 0 |
| Buchanania obovata | BUOBO | 27 |
| Calytrix exstipulata | CAEXS | 37 |
| Cochlospermum fraseri | COFRA | 34 |
| Coelospermum reticulatum | CORET | 3 |
| Corymbia bleeseri | COBLE | 2 |
| Corymbia ferruginea | COFER | 1 |
| Corymbia polycarpa | COPOC | 1 |
| Corymbia polysciada | COPOS | 2 |
| Corymbia porrecta | COPOR | 176 |
| Denhamia obscura | DEOBS | 3 |
| Erythrophleum chlorostachys | ERCHL | 261 |
| Eucalyptus miniata | EUMIN | 598 |
| Eucalyptus tetrodonta | EUTET | 597 |
| Ficus aculeata | FIACU | 2 |
| Gardenia megasperma | GAMEG | 10 |
| Grevillea pteridifolia | GRPTE | 2 |
| Livistona humilis | LIHUM | 54 |
| Owenia vernicosa | OWVER | 7 |
| Pandanus spiralis | PASPI | 62 |
| Persoonia falcata | PEFAL | 17 |
| Petalostigma pubescens | PEPUB | 4 |
| Petalostigma quadriloculare | PEQUA | 2 |
| Planchonella arnhemica | PLARN | 1 |
| Planchonia careya | PLCAR | 14 |
| Premna acuminata | PRACU | 1 |
| Stenocarpus acacioides | STACA | 2 |
| Syzygium eucalyptoides subsp. bleeseri | SYEUB | 1 |
| Syzygium eucalyptoides subsp. eucalyptoides | SYEUE | 1 |
| Terminalia ferdinandiana | TEFER | 101 |
| Terminalia grandiflora | TEGRA | 6 |
| Xanthostemon paradoxus | XAPAR | 194 |
| Site (Mosaic) | Date and Time | Flight Height (m) | No. Images | GSD (cm) |
|---|---|---|---|---|
| Site 1 | 12 April 2021 15:10 | 82 | 233 | 1.8 |
| Site 2 | 21 June 2021 11:30 | 87 | 260 | 1.9 |
| Site 3 | 22 June 2021 11:20 | 82 | 203 | 1.8 |
| Site 4 | 14 June 2021 14:20 | 87 | 112 | 1.9 |
| Site 5 | 15 June 2021 12:30 | 90 | 342 | 2.0 |
| Site 6 | 21 June 2021 11:35 | 82 | 270 | 1.8 |
| Site 7 | 17 June 2021 12:30 | 78 | 198 | 1.7 |
| Species | No. of Images Used for Training | Average Precision (%) | Precision (%) | Recall (%) |
|---|---|---|---|---|
| Acacia mimula | 304 | 58.6 | 60.6 | 65.6 |
| Acacia oncinocarpa | 7 | 0.4 | 0 | 0 |
| Buchanania obovata | 23 | 10.9 | 33.3 | 20 |
| Calytrix exstipulata | 13 | 100 | 75 | 100 |
| Cochlospermum fraseri | 9 | 83.3 | 100 | 50 |
| Corymbia porrecta | 170 | 36.4 | 42.1 | 23.5 |
| Erythrophleum chlorostachys | 246 | 83.9 | 80 | 73.5 |
| Eucalyptus miniata | 517 | 85 | 82.7 | 77.9 |
| Eucalyptus tetrodonta | 558 | 83.4 | 76.2 | 68.8 |
| Gardenia megasperma | 10 | 2.8 | 0 | 0 |
| Livistona humilis | 53 | 91.1 | 90.9 | 100 |
| Pandanus spiralis | 58 | 100 | 100 | 100 |
| Persoonia falcata | 17 | 38 | 25 | 25 |
| Planchonia careya | 14 | 0.0 | 0.0 | 2.5 |
| Terminalia ferdinandiana | 95 | 92.2 | 94.1 | 84.2 |
| Terminalia grandiflora | 5 | 50 | 0 | 0 |
| Xanthostemon paradoxus | 181 | 83.8 | 78.8 | 72.2 |
Disclaimer/Publisher’s Note: The statements, opinions and data contained in all publications are solely those of the individual author(s) and contributor(s) and not of MDPI and/or the editor(s). MDPI and/or the editor(s) disclaim responsibility for any injury to people or property resulting from any ideas, methods, instructions or products referred to in the content. |
© 2023 by the authors. Licensee MDPI, Basel, Switzerland. This article is an open access article distributed under the terms and conditions of the Creative Commons Attribution (CC BY) license (https://creativecommons.org/licenses/by/4.0/).
Share and Cite
Jansen, A.J.; Nicholson, J.D.; Esparon, A.; Whiteside, T.; Welch, M.; Tunstill, M.; Paramjyothi, H.; Gadhiraju, V.; van Bodegraven, S.; Bartolo, R.E. Deep Learning with Northern Australian Savanna Tree Species: A Novel Dataset. Data 2023, 8, 44. https://doi.org/10.3390/data8020044
Jansen AJ, Nicholson JD, Esparon A, Whiteside T, Welch M, Tunstill M, Paramjyothi H, Gadhiraju V, van Bodegraven S, Bartolo RE. Deep Learning with Northern Australian Savanna Tree Species: A Novel Dataset. Data. 2023; 8(2):44. https://doi.org/10.3390/data8020044
Chicago/Turabian StyleJansen, Andrew J., Jaylen D. Nicholson, Andrew Esparon, Timothy Whiteside, Michael Welch, Matthew Tunstill, Harinandanan Paramjyothi, Varma Gadhiraju, Steve van Bodegraven, and Renee E. Bartolo. 2023. "Deep Learning with Northern Australian Savanna Tree Species: A Novel Dataset" Data 8, no. 2: 44. https://doi.org/10.3390/data8020044