Article

Federated Learning for Data Analytics in Education

by
Christian Fachola
1,†,
Agustín Tornaría
2,†,
Paola Bermolen
2,†,
Germán Capdehourat
3,4,†,
Lorena Etcheverry
1,*,† and
María Inés Fariello
2,†
1
Instituto de Computación, Facultad de Ingeniería, Universidad de la República, Montevideo 11300, Uruguay
2
Instituto de Matemática, Facultad de Ingeniería, Universidad de la República, Montevideo 11300, Uruguay
3
Instituto de Ingeniería Eléctrica, Facultad de Ingeniería, Universidad de la República, Montevideo 11300, Uruguay
4
Ceibal, Montevideo 11500, Uruguay
*
Author to whom correspondence should be addressed.
These authors contributed equally to this work.
Submission received: 30 December 2022 / Revised: 8 February 2023 / Accepted: 14 February 2023 / Published: 20 February 2023

Abstract

:
Federated learning techniques aim to train and build machine learning models based on distributed datasets across multiple devices while avoiding data leakage. The main idea is to perform training on remote devices or isolated data centers without transferring data to centralized repositories, thus mitigating privacy risks. Data analytics in education, in particular learning analytics, is a promising scenario to apply this approach to address the legal and ethical issues related to processing sensitive data. Indeed, given the nature of the data to be studied (personal data, educational outcomes, and data concerning minors), it is essential to ensure that the conduct of these studies and the publication of the results provide the necessary guarantees to protect the privacy of the individuals involved and the protection of their data. In addition, the application of quantitative techniques based on the exploitation of data on the use of educational platforms, student performance, use of devices, etc., can account for educational problems such as the determination of user profiles, personalized learning trajectories, or early dropout indicators and alerts, among others. This paper presents the application of federated learning techniques to a well-known learning analytics problem: student dropout prediction. The experiments allow us to conclude that the proposed solutions achieve comparable results from the performance point of view with the centralized versions, avoiding the concentration of all the data in a single place for training the models.

1. Introduction

Education systems are usually composed of different educational centers (kindergartens, high schools, etc.). Each center involves students and teachers who interact daily in various learning activities, generating valuable information, both locally for the individual school and globally for the whole educational system. When these interactions occur through digital educational platforms, a potentially massive volume of data is generated that can be harnessed for various academic and pedagogical purposes.
Regardless of the governance and organization of each country’s education system, there are usually government entities above the schools. One of their main tasks is collecting and analyzing data on the education system. In its traditional approach, building, training, and deploying machine learning (ML) models and artificial intelligence (AI) techniques involve simple data-sharing models. Data must be fused, cleaned, and integrated and then used to train and test the models. This procedure faces challenges related to individuals’ privacy and personal data protection. These privacy and ethical issues are essential in learning analytics (LA), which is the application of quantitative techniques to educational data to help solve problems such as the design of teaching trajectories or the development of early dropout alerts. In the latter case, the prediction result would be significant mostly for the community of the analyzed individuals, and the prediction should be treated as personal data. The privacy issues and the ethical use of data in LA applications have been widely documented in the literature [1,2,3].
There are two ways of ensuring privacy in LA. On the one hand, the privacy-preserving data-publishing approach, which consists of applying data de-identification and anonymization techniques (e.g., satisfying the definition of k-anonymity [4]) and then using conventional ML methods [5,6]. On the other hand, in the privacy-preserving data mining or statistical disclosure control approach, the analyst does not directly access the data but uses a query mechanism that adds statistical noise to the response, implementing differential privacy [7]. The latter strategy may be more robust and scalable, but some authors suggest that it may be challenging to implement in practice [8].
Another way to tackle the privacy-preserving data issue is to use a decentralized approach such as federated learning (FL), initially proposed by Google [9] to build ML models using distributed datasets across multiple devices. Its main goal is to train ML models on remote devices or isolated data centers without transferring the data to centralized repositories. FL incorporates ideas from multiple areas, including cryptography, ML, heterogeneous computing, and distributed systems. In recent years, the concept has been growing and consolidating, along lines ranging from improvements in security aspects and the study of statistical problems that arise in the distributed scenario to the extension of the concept to cover collaborative learning scenarios between organizations [10].
In the context of LA, FL provides mechanisms that allow fitting models based on the data generated by a set of schools but avoid the concentration of raw data generated at each school. This scheme improves data management regarding privacy preservation but uses more information for training models than independently fitting a model for each school. It also avoids storage duplication in a central server and each school. In this context, we see a clear opportunity to capitalize on the benefits of FL.
There are two main variants of FL: horizontal and vertical [11], typically associated with the two different use cases called cross-device and cross-silo. In the first case, the data are horizontally partitioned since the data structure in the different devices is the same. Each device has its own data set, but all the sets share the same attributes or variables. The records in each data set have the same fields but are for different participants. A known example is the one that originated federated learning: smartphones’ predictive keyboard. Communication problems play a relevant role in this case, as devices are only sometimes available, hindering machine learning models’ training rounds. In contrast, in the vertical case, the partitioning corresponds to where different data sets share common identifiers (e.g., information from the same users). Still, each data set includes different fields in its records. This case corresponds to the exchange of information between different institutions, which usually involves data communication between well-established data centers. This second scenario is usually applied to integrating data from different sources without gathering all the data in one server. For example, a typical case could be a cross-silo scheme in which different government agencies share information on their citizens.

Our Proposal and Related Works

Our work uses horizontal FL techniques to apply LA to data distributed across different educational institutions. This scenario presents specific characteristics that differ from the ones observed in typical cross-device FL systems. In our proposal, each educational center manages all the information related to its teachers and students. This situation does not necessarily imply that each educational center has its on-premises data center. We could also have educational platforms in the cloud, where data are hosted on third-party servers. However, we assume that each educational center has the administration rights to all data on its teachers and students. Thus, each institution in the educational system can be seen as a silo in the proposed federated scheme.
In Figure 1, we illustrate the proposed cross-silo scheme for the educational system. The goal is to use the federated learning paradigm to enable a centralized analysis of education system data while avoiding the corresponding centralization of raw data. The proposed approach would allow higher government institutions in charge of the education system to conduct data analytics using ML models while preserving the teachers’ and students’ privacy. A similar scenario has been extensively studied in the context of healthcare applications [12,13,14]. scheme. The main difference is that the proposed education cross-silo scheme uses horizontal rather than vertical partitioning. In our case, the different educational institutions share the same data schema, with all of them sharing the same attributes for students and courses.
To evaluate the proposed education federated scheme, we analyzed a well-known learning analytics problem: student dropout prediction through a neural network model. We assume a scenario in which a global analysis is required without centralizing student data stored in different educational centers. To validate the proposed scheme, we compared the accuracy of the neural network model in an FL framework with the centralized case to determine if we lose performance compared to gathering all the data together. We also compared the accuracy obtained for each school after training the models under a federated scheme with the case where each school trains an individual model separately (i.e., each school uses only its data for dropout prediction). Finally, we extended the analysis to the case of the non-homogeneous distribution of dropout student rates among the different institutions. In cases where the data between clients are heterogeneous, algorithms can have good accuracy when considering all the data together. Still, they can be unfair to schools with a different data distribution than the rest. In the case of FL, this means that the schools can have very different sizes and also that there can be different biases in the schools, so the algorithms can be unfair with some of the schools and have a lower accuracy for those cases [15,16].
The LA problem we address has been studied before. In particular, the development of dropout-prediction systems is a relevant concern in many educational communities, and different proposals have been devised in this regard. In particular, our approach is based on the work presented in [17], where the dropout detection problem is addressed centrally in the context of online learning platforms. Finally, very few papers present the application of FL in the context of LA. A framework for educational data analysis is described in [18], introducing a similar education federated scheme to our proposal. However, it does not emphasize the evaluation of the obtained results or the discussion of how different parameters affect the convergence of the solutions.
The rest of the document is organized as follows. First, in Section 2, we describe the main FL concepts and present the dataset and models used to evaluate the framework proposed. Next, in Section 3, we describe the experiments carried out on federated dropout prediction and present the corresponding results. Finally, in Section 4, we discuss over the insights observed, while Section 5 concludes the paper, commenting on future research lines.

2. Methods

In this section, we describe the main concepts of FL; we then present the dataset that was used to evaluate the performance of the models and, finally the network architecture.

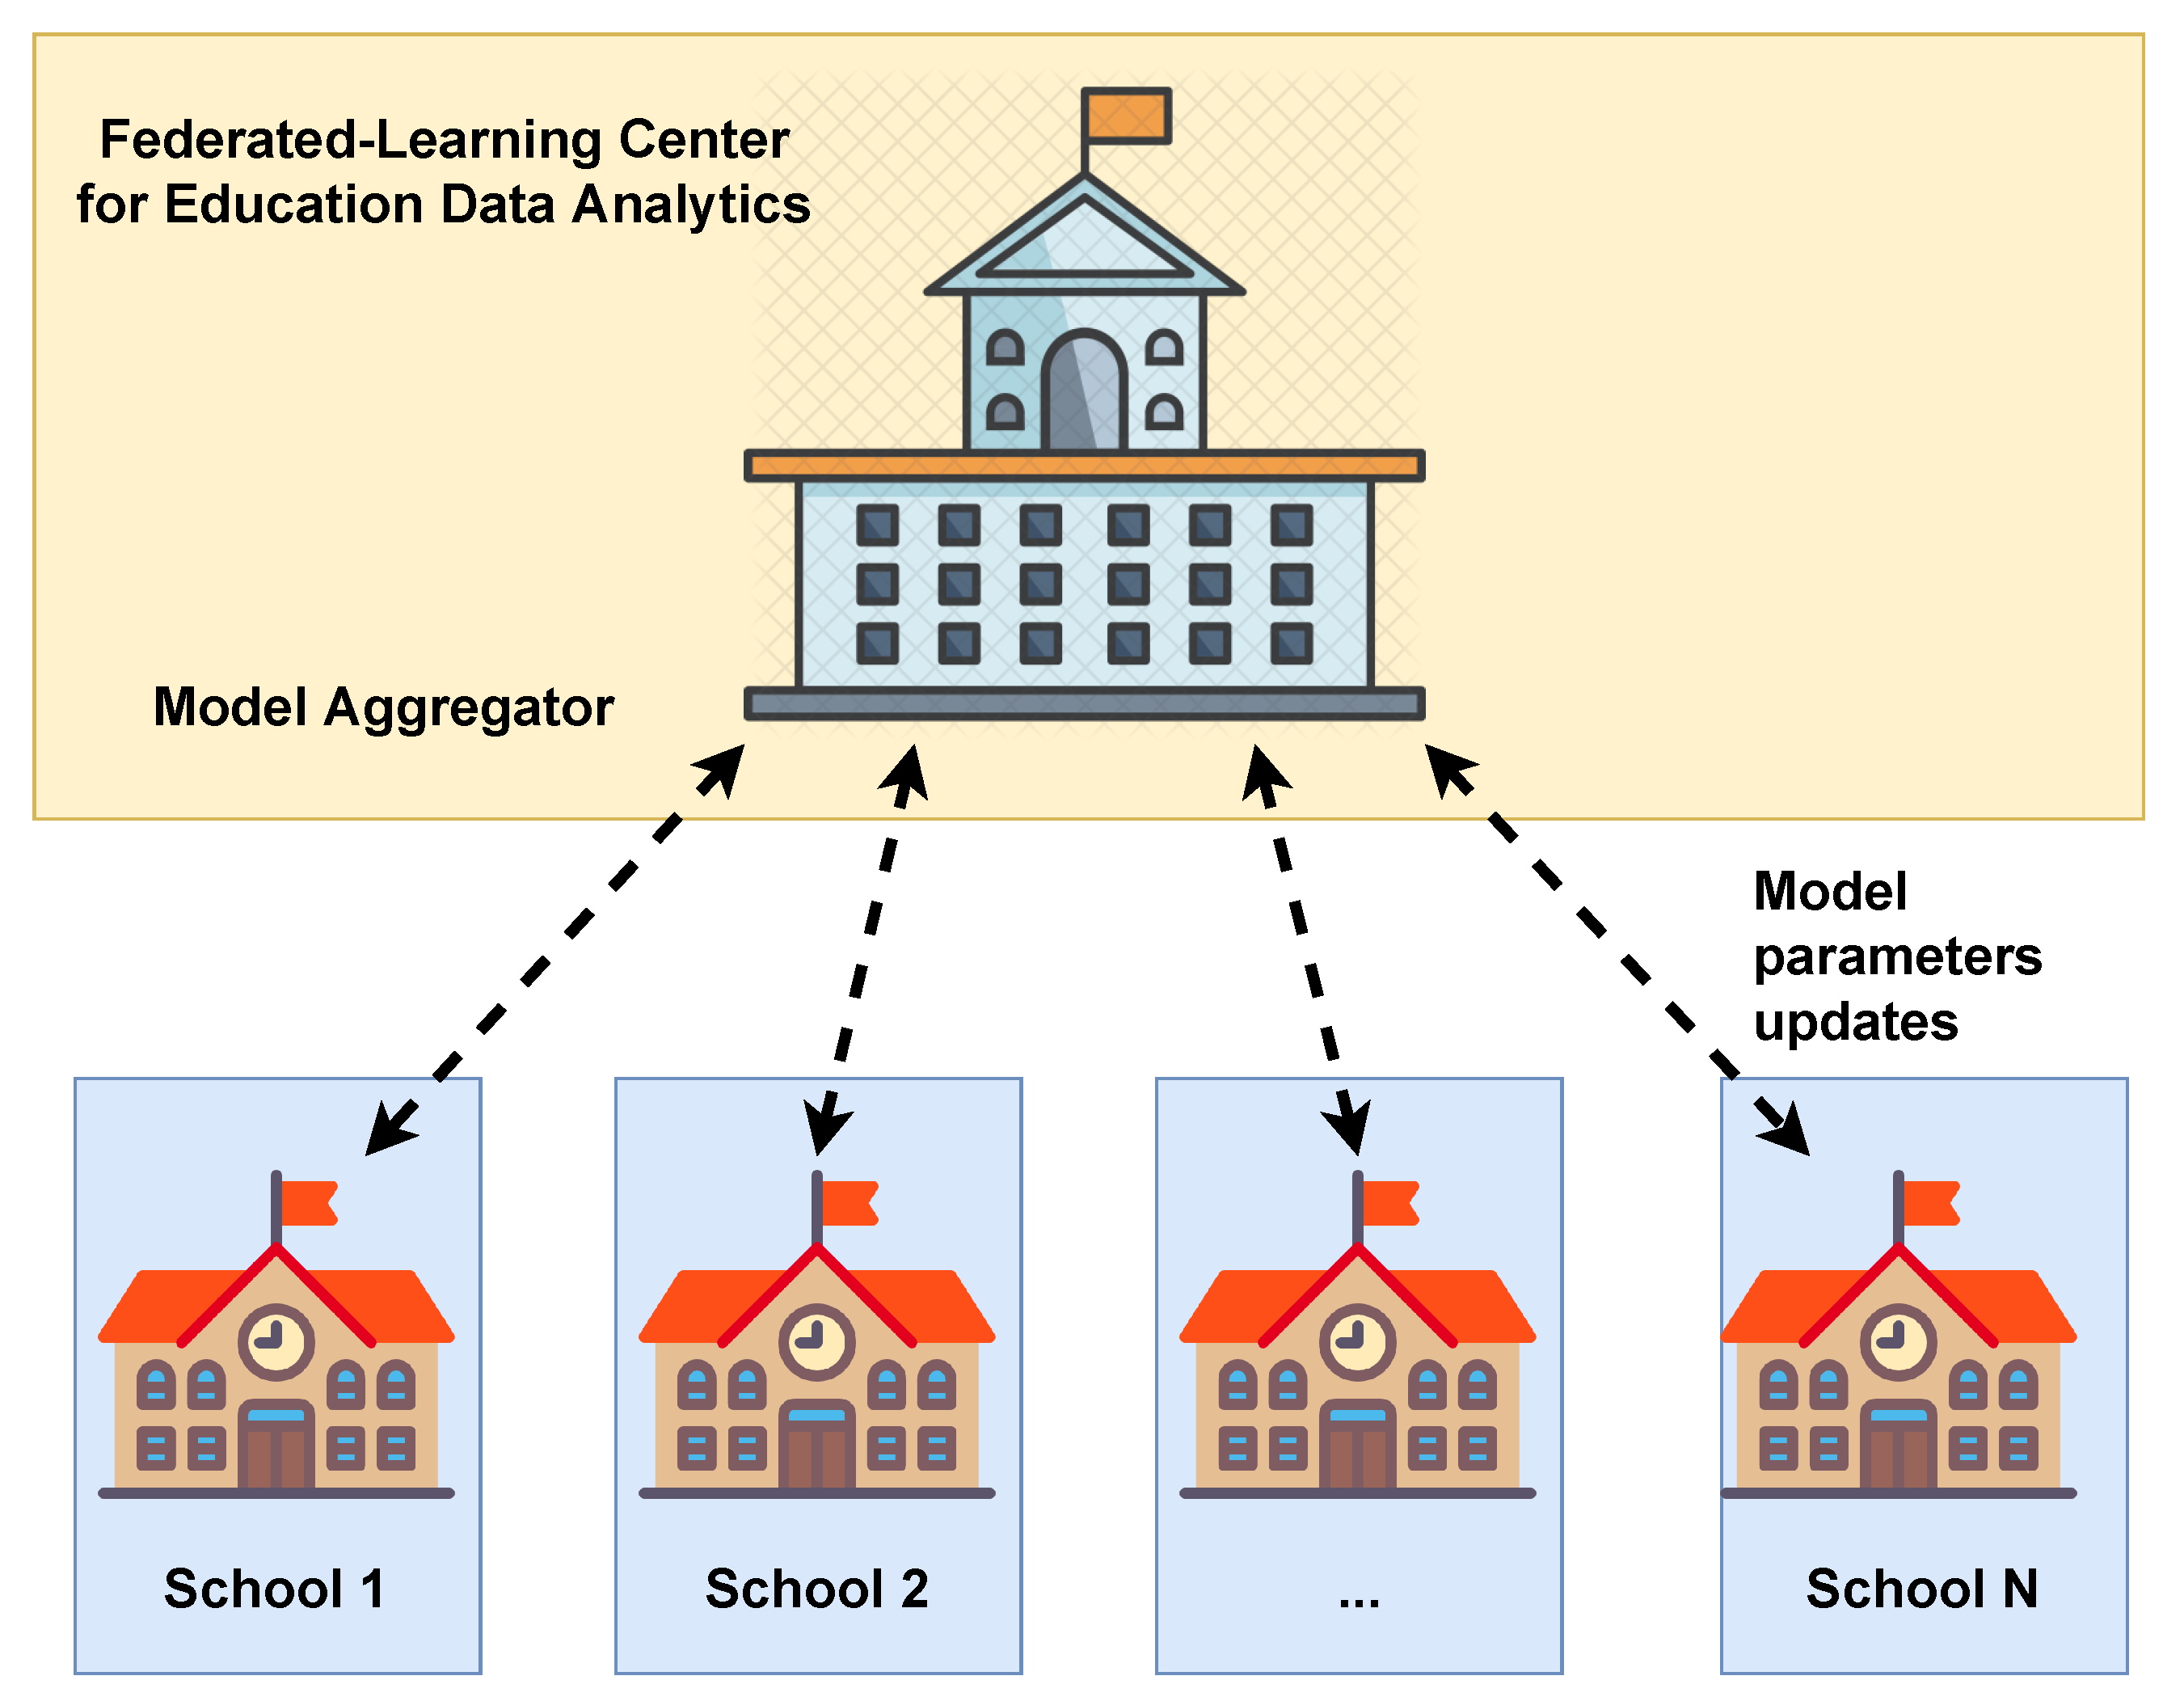
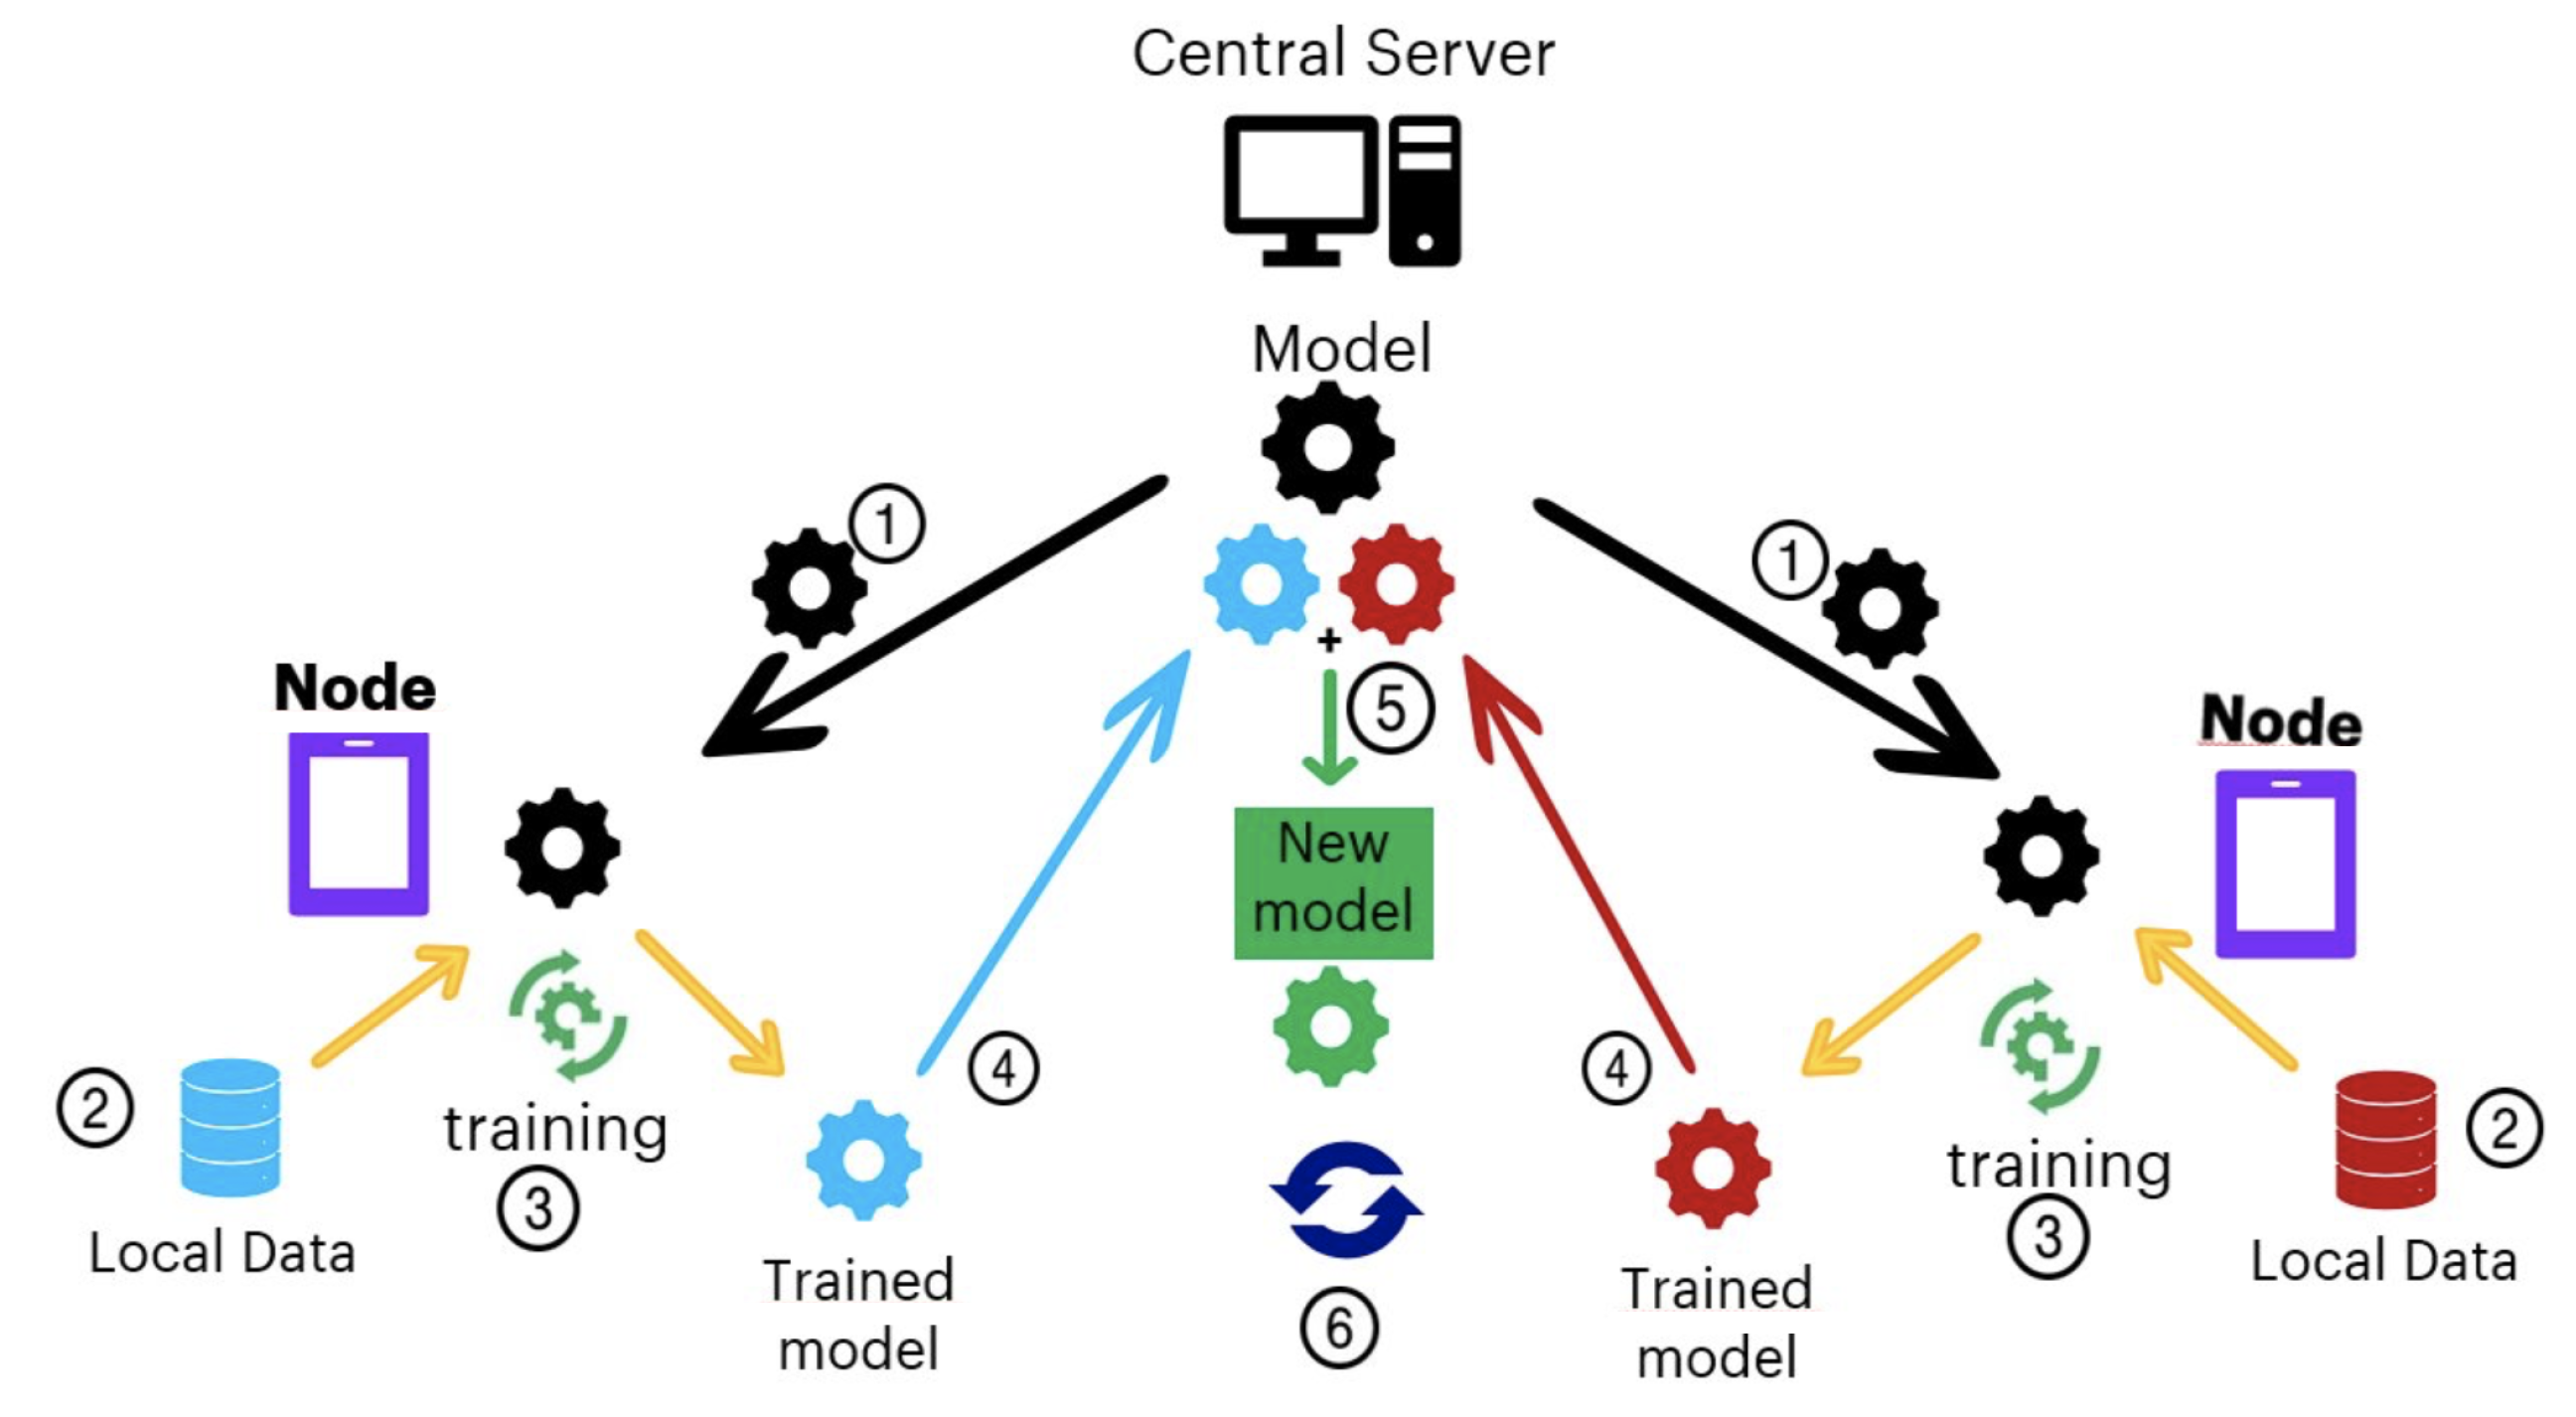
2.1. Main Concepts of Federated Learning

In the FL setting, the participating entities are usually classified as servers and clients; the server is the one that orchestrates the model training, and the clients are the ones who store the data and also run the models locally. In LA, the clients would be the schools and the server would be a governmental entity.
For computing the model’s parameters, an iterative process between model parameter estimation within the clients and actualization of the parameters in the server is carried out. In each iteration, specific clients are chosen to train the model with its own data locally. Then, the server aggregates all clients’ results to update the model’s state, which will be deployed on new clients in the next iteration, repeating the process [19].
Figure 2 shows the steps necessary to train a model using the FL scheme. First, the central server sends the last model parameters to the nodes or initial parameters in case it is the first run (step 1). Then, in step 2, data are selected at each node, and each local model is trained based on the last parameters (step 3). At the end of the local training, each client communicates the updated parameters of the local model to the global model (step 4), where the updates of each model are combined, generating a new model (step 5). Finally, the process is restarted from step 1 (step 6). The model developed in step 5 can then be put into production.
Each deployment, local training on the selected clients, and update of the server model cycle constitutes a round. In the case of neural networks (NN), each client trains the model independently using classical gradient descent, and sends the computed weights to the server. The server updates the weights using federated averaging algorithm [21]. This algorithm averages the received client’s weights. In the federated case for neural networks, one has to consider the parameters that define the behavior of the models on the clients epochs and batch-size) but also those specific to the federation, specifically, the number of rounds, the number of clients chosen per round, the total number of clients, and how the data are distributed among them. The parameters mentioned above may influence, a priori, the performance of the models obtained. Therefore, one of our goals is to experiment in this direction to understand the effects of each of these parameters.

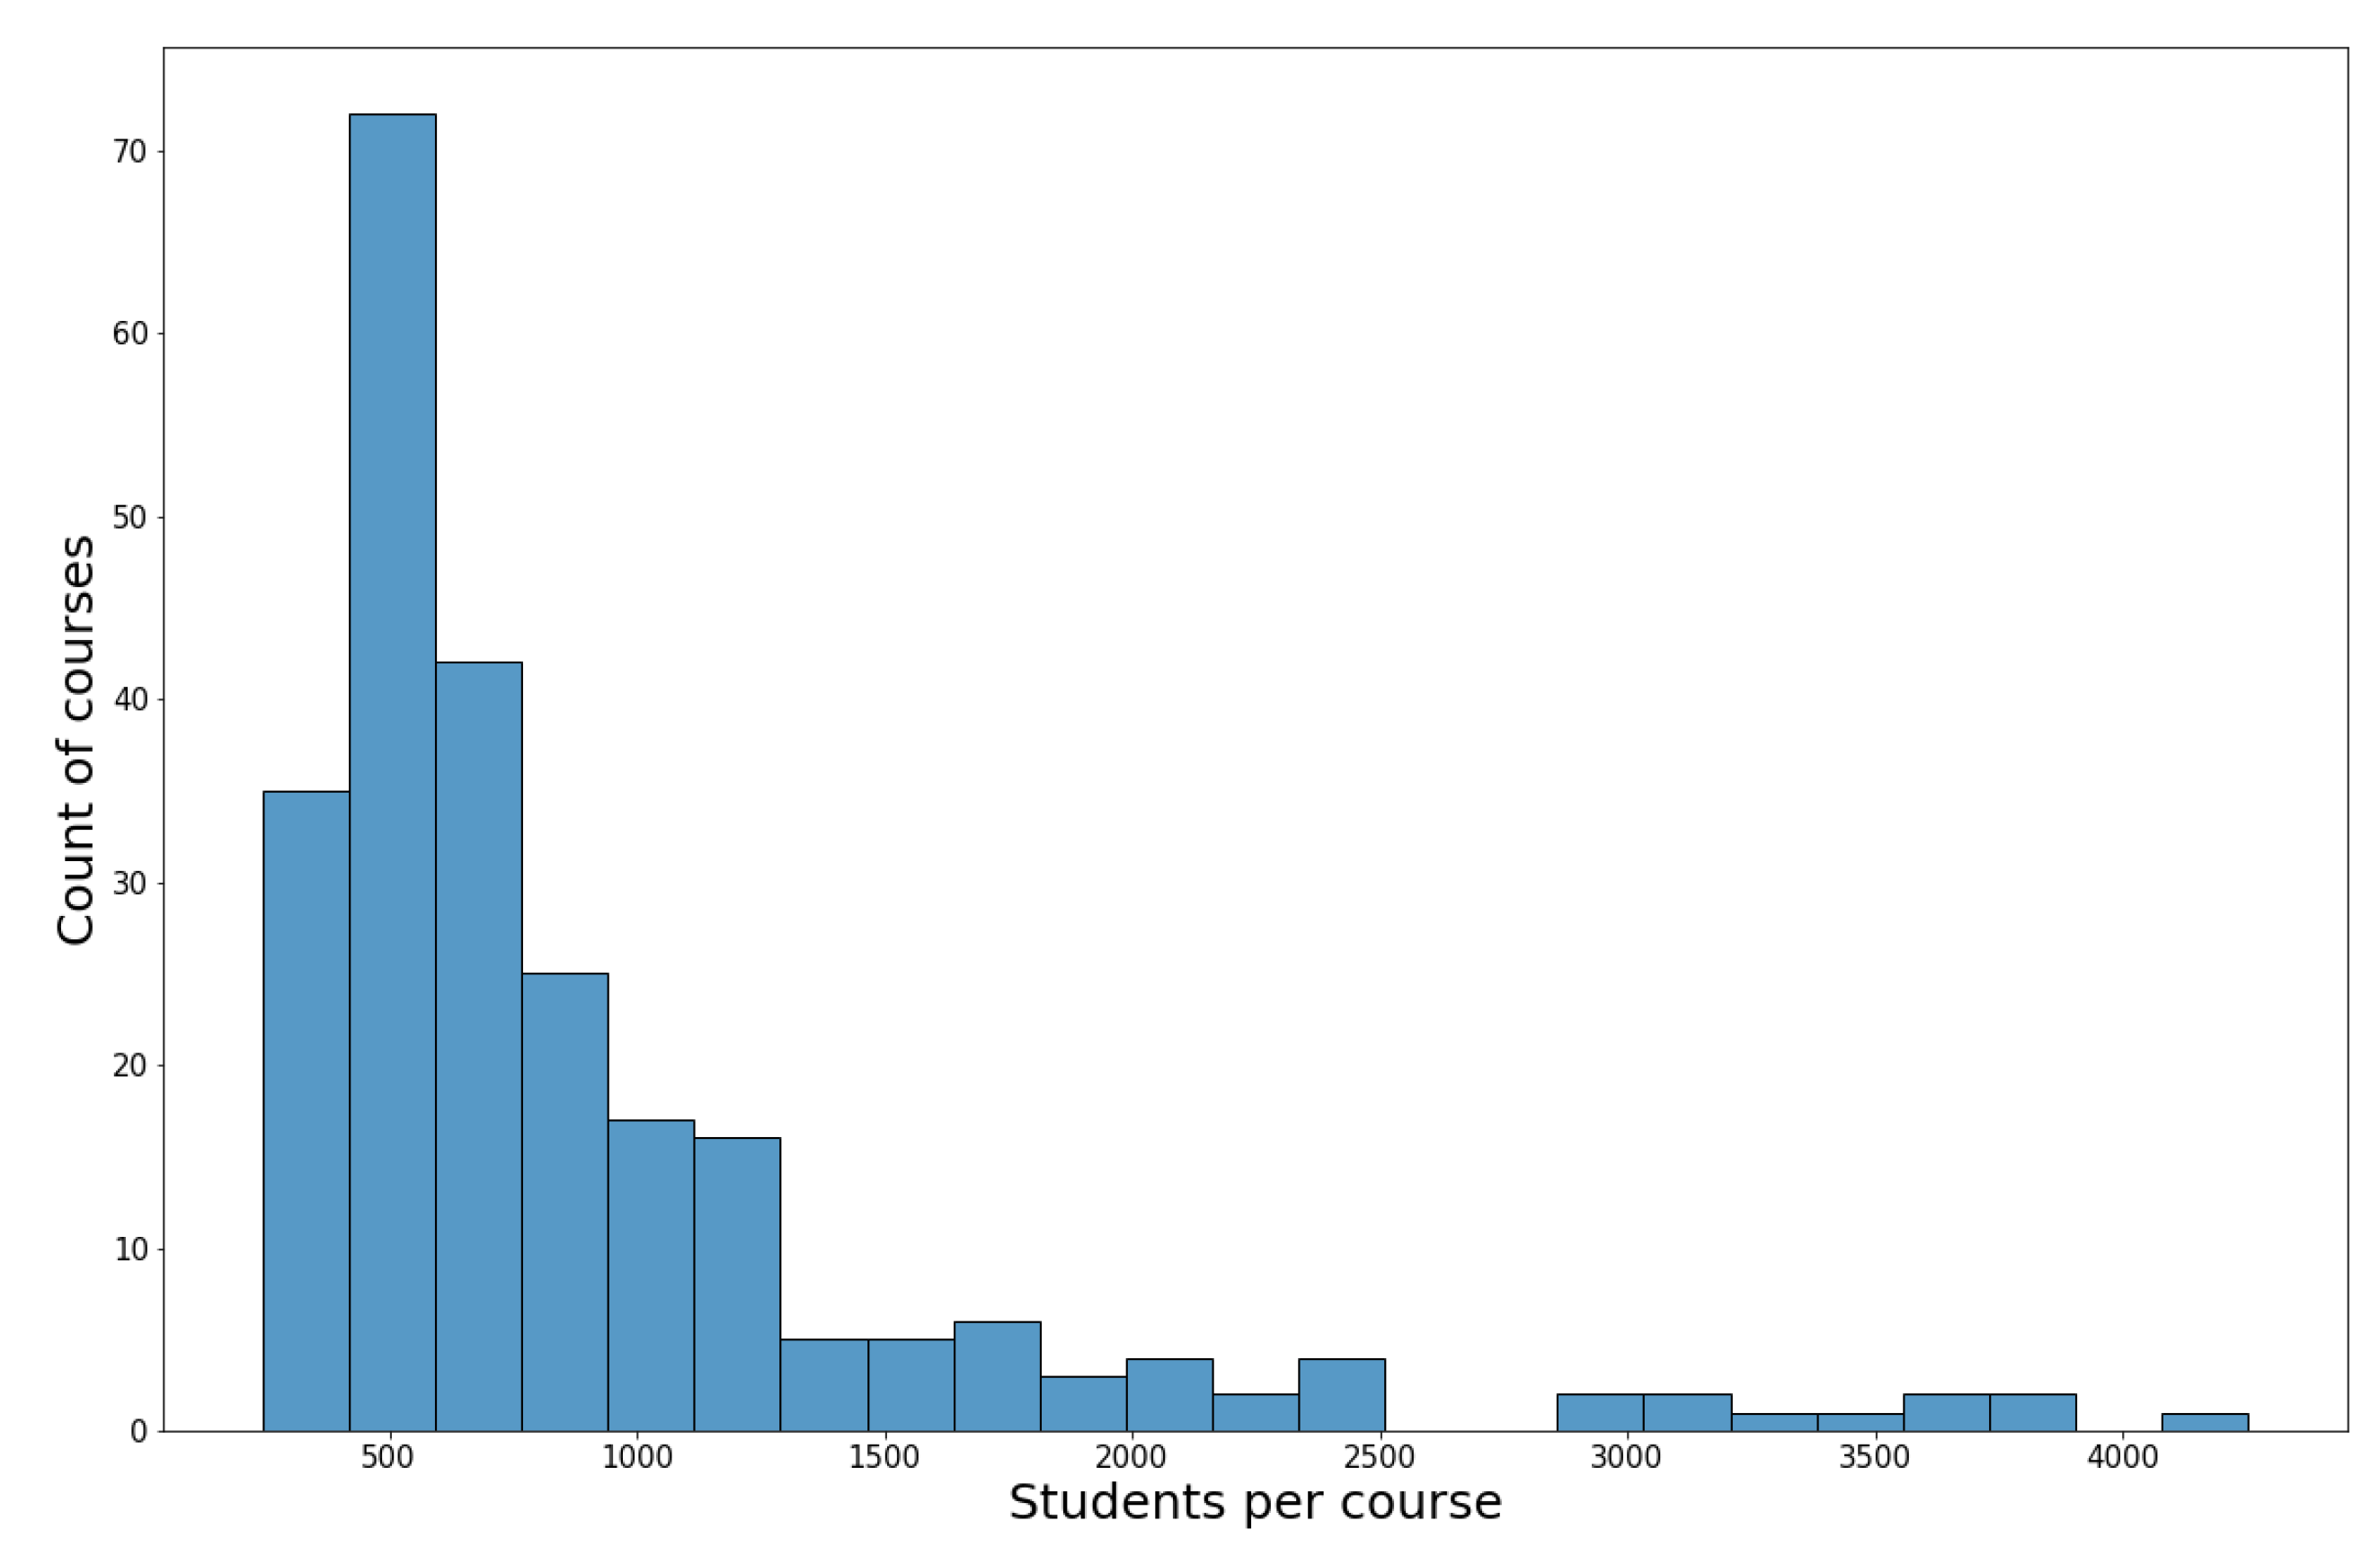
2.2. Dataset Description and Pre-Processing

As already mentioned, our work focuses on studying the applicability of FL to student dropout prediction. For this purpose, we use the KDDCup2015 dataset, which contains activity logs from XuetangX, a Chinese MOOC (Massive Online Open Course) learning platform [22]. Data are provided about the student activity on each course over time. Student information includes a record of participation in several activities of each course (discussion forum, quiz, media usage, etc.). There are 21 activities, and their availability varies across courses. We can calculate metrics, such as dropout, for a particular course or student across all the courses it takes.
The logs have 42 M individual entries and have a total size of approximately 2.1 GB. There are 77,083 students and 247 courses. On the one hand, there are typically many students per course, as is expected from a MOOC platform, and a count of how many courses have what amount of students can be seen as a histogram in Figure 3. On the other hand, the vast majority of students only enroll in a few courses, with 46% of them enrolling in just 2. Table 1 shows how many courses students tend to enroll in, with percentages.
From the individual entries of the raw activity logs, we group data by course and student, counting the number of entries per activity. The final dataset has 225,642 entries of 21 features, where each entry corresponds to a distinct pair ( c o u r s e _ i d , s t u d e n t _ i d ) , which is also identified by a key type column called e n r o l l _ i d number. The features are the activity counts. For instance, for the entry of enroll_idK corresponding to the enrollment of student S in course C, one feature is the number of times that S reproduced a video featured on the course’s C web page. Another feature is the number of times S deleted a comment in the forum of course C. A complete list of features can be found in the Appendix A. The data-preparation code is available at our repository [23].

2.3. Network Architecture

We used a fully connected NN architecture consisting of the input layer, three hidden layers of size 100, and an output layer of 1 neuron with a sigmoid as an activation function. In addition, we used the Adam optimizer [24] and binary cross-entropy as a loss function. This architecture was used across all experiments. In Section 3, we compare its performance for different training schemes (federated and centralized) and training parameters. The centralized NN will be trained using Tensorflow. For federating, we use the Federated Averaging algorithm [21] implemented in Tensorflow Federated.

3. Experimental Results

This section presents our implementation of different scenarios using Federated Learning frameworks and the experiments carried out in each case using a public data set from KDDCup2015 [22]. As mentioned in Section 1, we used the approach presented in [17] to predict student dropout. For every e n r o l l _ i d , there is a label saying whether the student dropped out of the course. We then used these labels to train and test a deep learning model that predicts dropout.
The experiments had four main goals: (1) to evaluate the influence of the training parameters on the accuracy and total training time of the federated models, (2) to assert whether the federated models can reach the accuracy of the centralized setting or not, (3) to evaluate the performance of the federation compared to training models locally on each institution, and (4) to compare performance when data distribution varies across institutions. These objectives are crucial to understanding when a federated scheme is a good alternative and how best to implement it. Objective (1) is addressed in Section 3.1, testing different parameters; then, in Section 3.2, we explore our second goal by increasing the number of rounds. Finally objectives (3) and (4) are addressed in Section 3.3, where we compare different schemes for performing training and evaluation (e.g., where each client trains its model separately, where all data are centralized, and a federated version), also varying the data distribution approach.

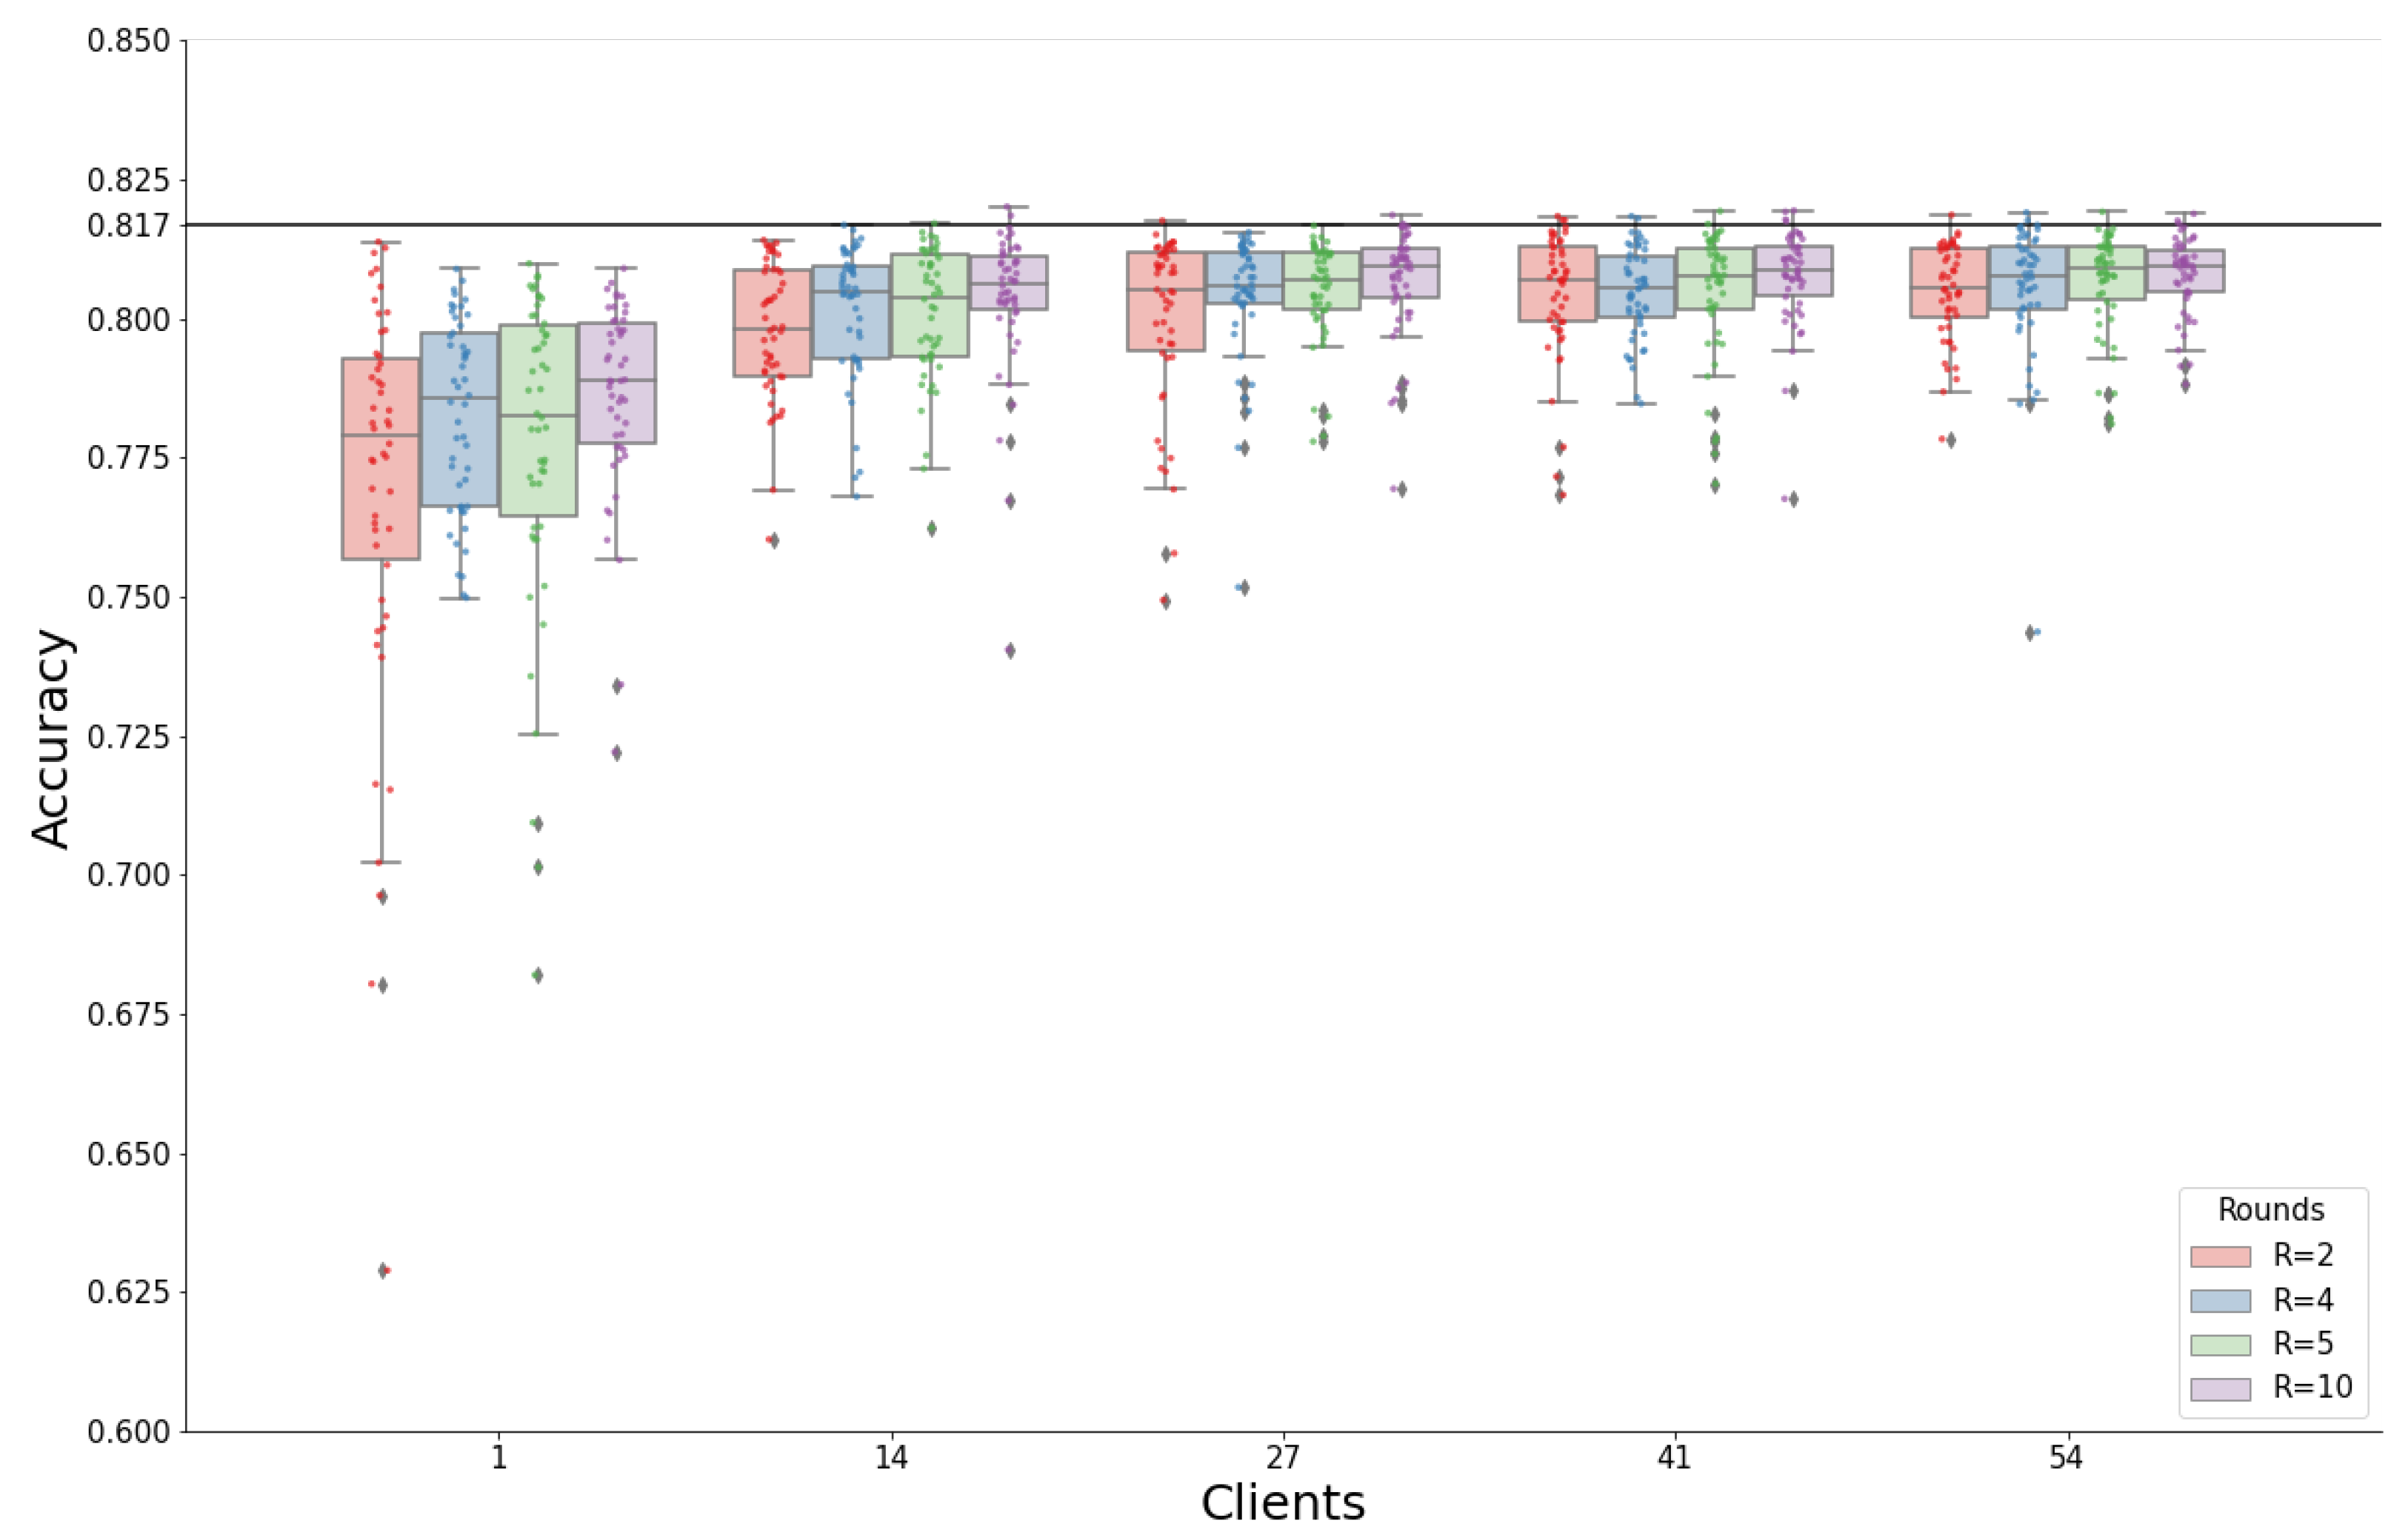
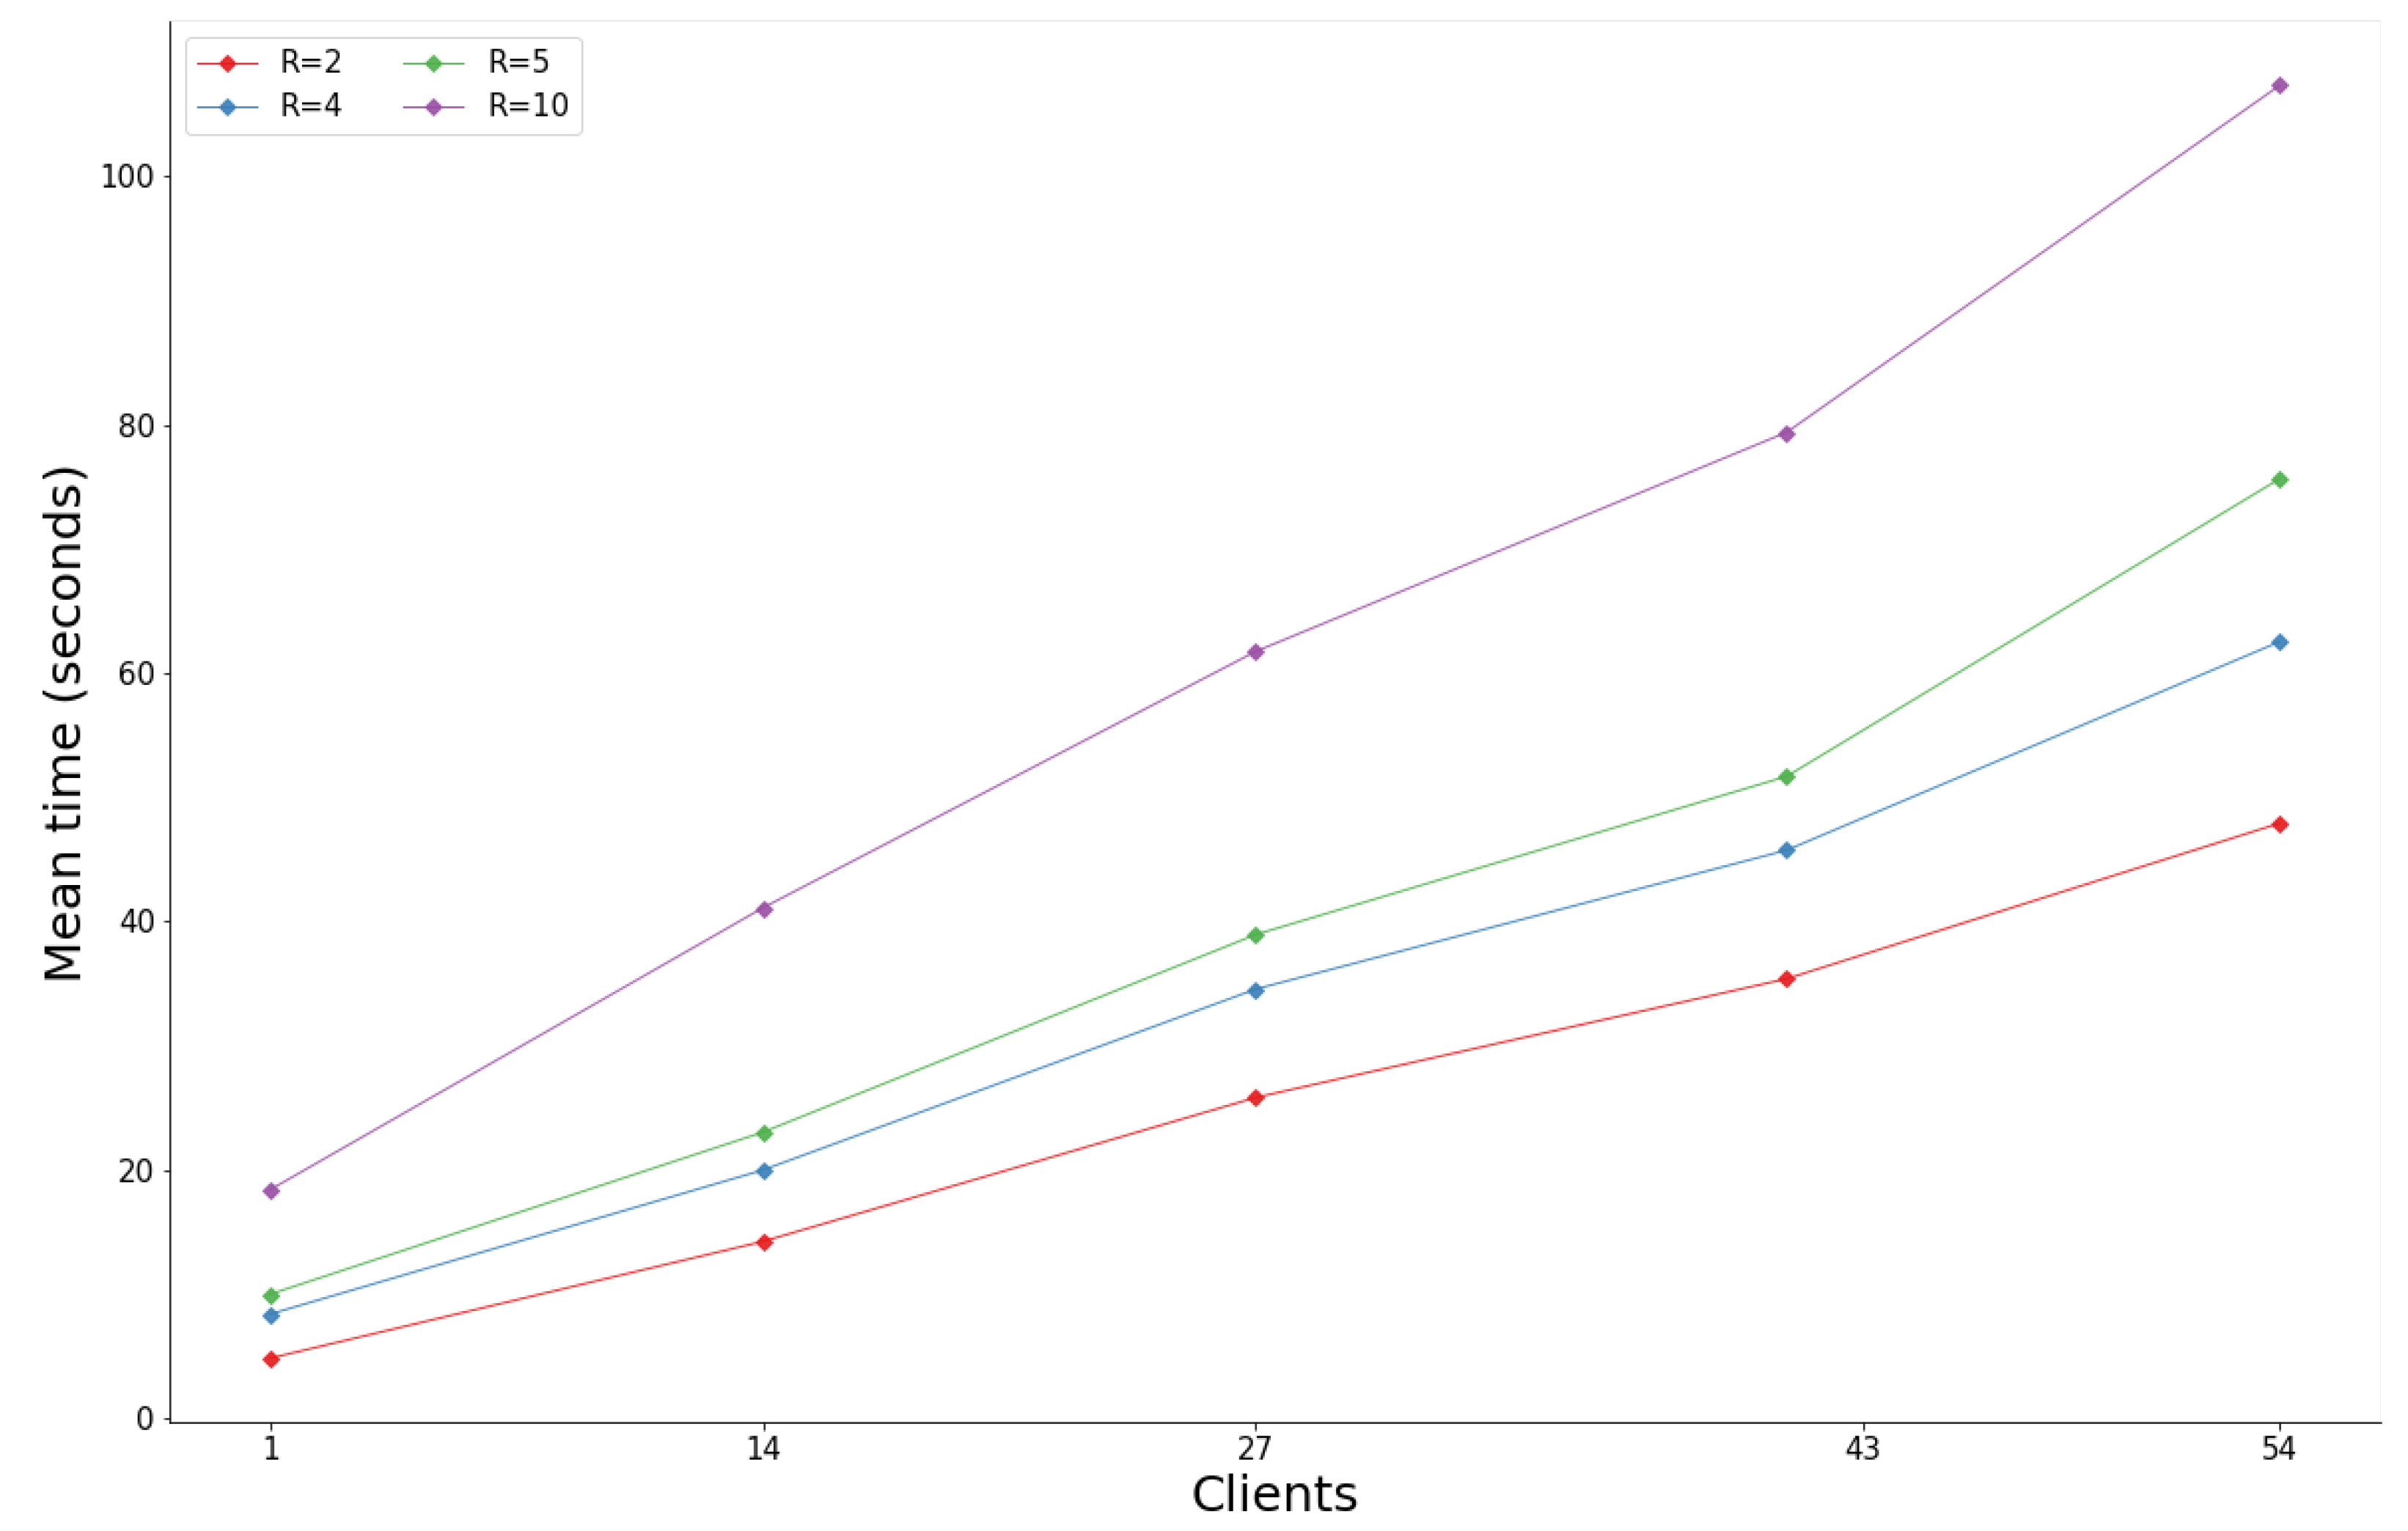
3.1. Federated Learning Parameters

In addition to the usual local parameters of each client, such as the epochs and the batch size, in the federated version, we need to deal with additional ones, such as the number of training rounds, the number of clients chosen in each round, the total number of clients, and how the data are distributed among them.

3.1.1. Experiment

A centralized model was trained for 20 epochs. The number of epochs was chosen empirically; we searched for a number large enough to allow for parameter tuning in the federated approach that also maintained an acceptable level of accuracy without much overfitting. We sampled 70% of all students and collect their data to build the training dataset, using the remaining to build the test set. The model was evaluated using 50 different random splits of the students.
In the federated model, each client represents one school and comprises samples of 1000 students, totaling 77 schools (clients). Clients did not share students but could share courses. The training-evaluation process consisted of 50 different random splits in a 70/30 proportion. Using 1000 students per client, the training was performed for 54 clients (%70). The remaining data were used for testing; this is carried out in a centralized manner where a model with the same architecture was initialized with weights from the federated model at the end of each round.
We used different combinations on the number of rounds (R) and local epochs (E), leaving a fixed number of total epochs R × E = 20 . This number is not arbitrary; it is the same number of training epochs as for the centralized model, so experiments are comparable. It also has a fair number of divisors, which allow us to play with different values of E and R. We vary the number of clients used per round using 1 client (minimum availability of clients), 14 clients ( 25% availability), 27 clients ( 50%), 43 clients ( 75%), and 54 clients (maximum availability).

3.1.2. Results

The centralized version achieves a mean accuracy of 81.7 % ± 0.07 % across the 50 different splits and a mean running time of 105 ± 2 s. This case is our baseline. Figure 4 shows the results in terms of accuracy for the federated case, where each point represents the result of one of the 50 executions. Increasing the number of clients from 1 to 14 causes a leap of 2–3% in the mean accuracy. At the same time, additional increments in the number of clients only cause a marginal increase in the mean accuracy but also produce a rise in the execution time (see Figure A1 in Appendix A). If the number of clients is fixed, we can see that favoring the number of rounds R over local epochs E tends to yield a better accuracy overall (boxes in each group go up), but again, this will cause an increment in time. It is also worth noting that variance decreases as we increase the clients and the rounds.
Finally, Figure 4 also shows that the performance in the federated setting is close to the one found in the centralized model, with a mean accuracy larger than 76% in every experiment (which goes up to 80% when excluding the experiments with one client per round), a top accuracy of 82% (reached on the run with 14 clients and ten rounds) and with around 63% of all individual runs, across all experiments, with more than 80% accuracy. However, some executions still have relatively low accuracy.

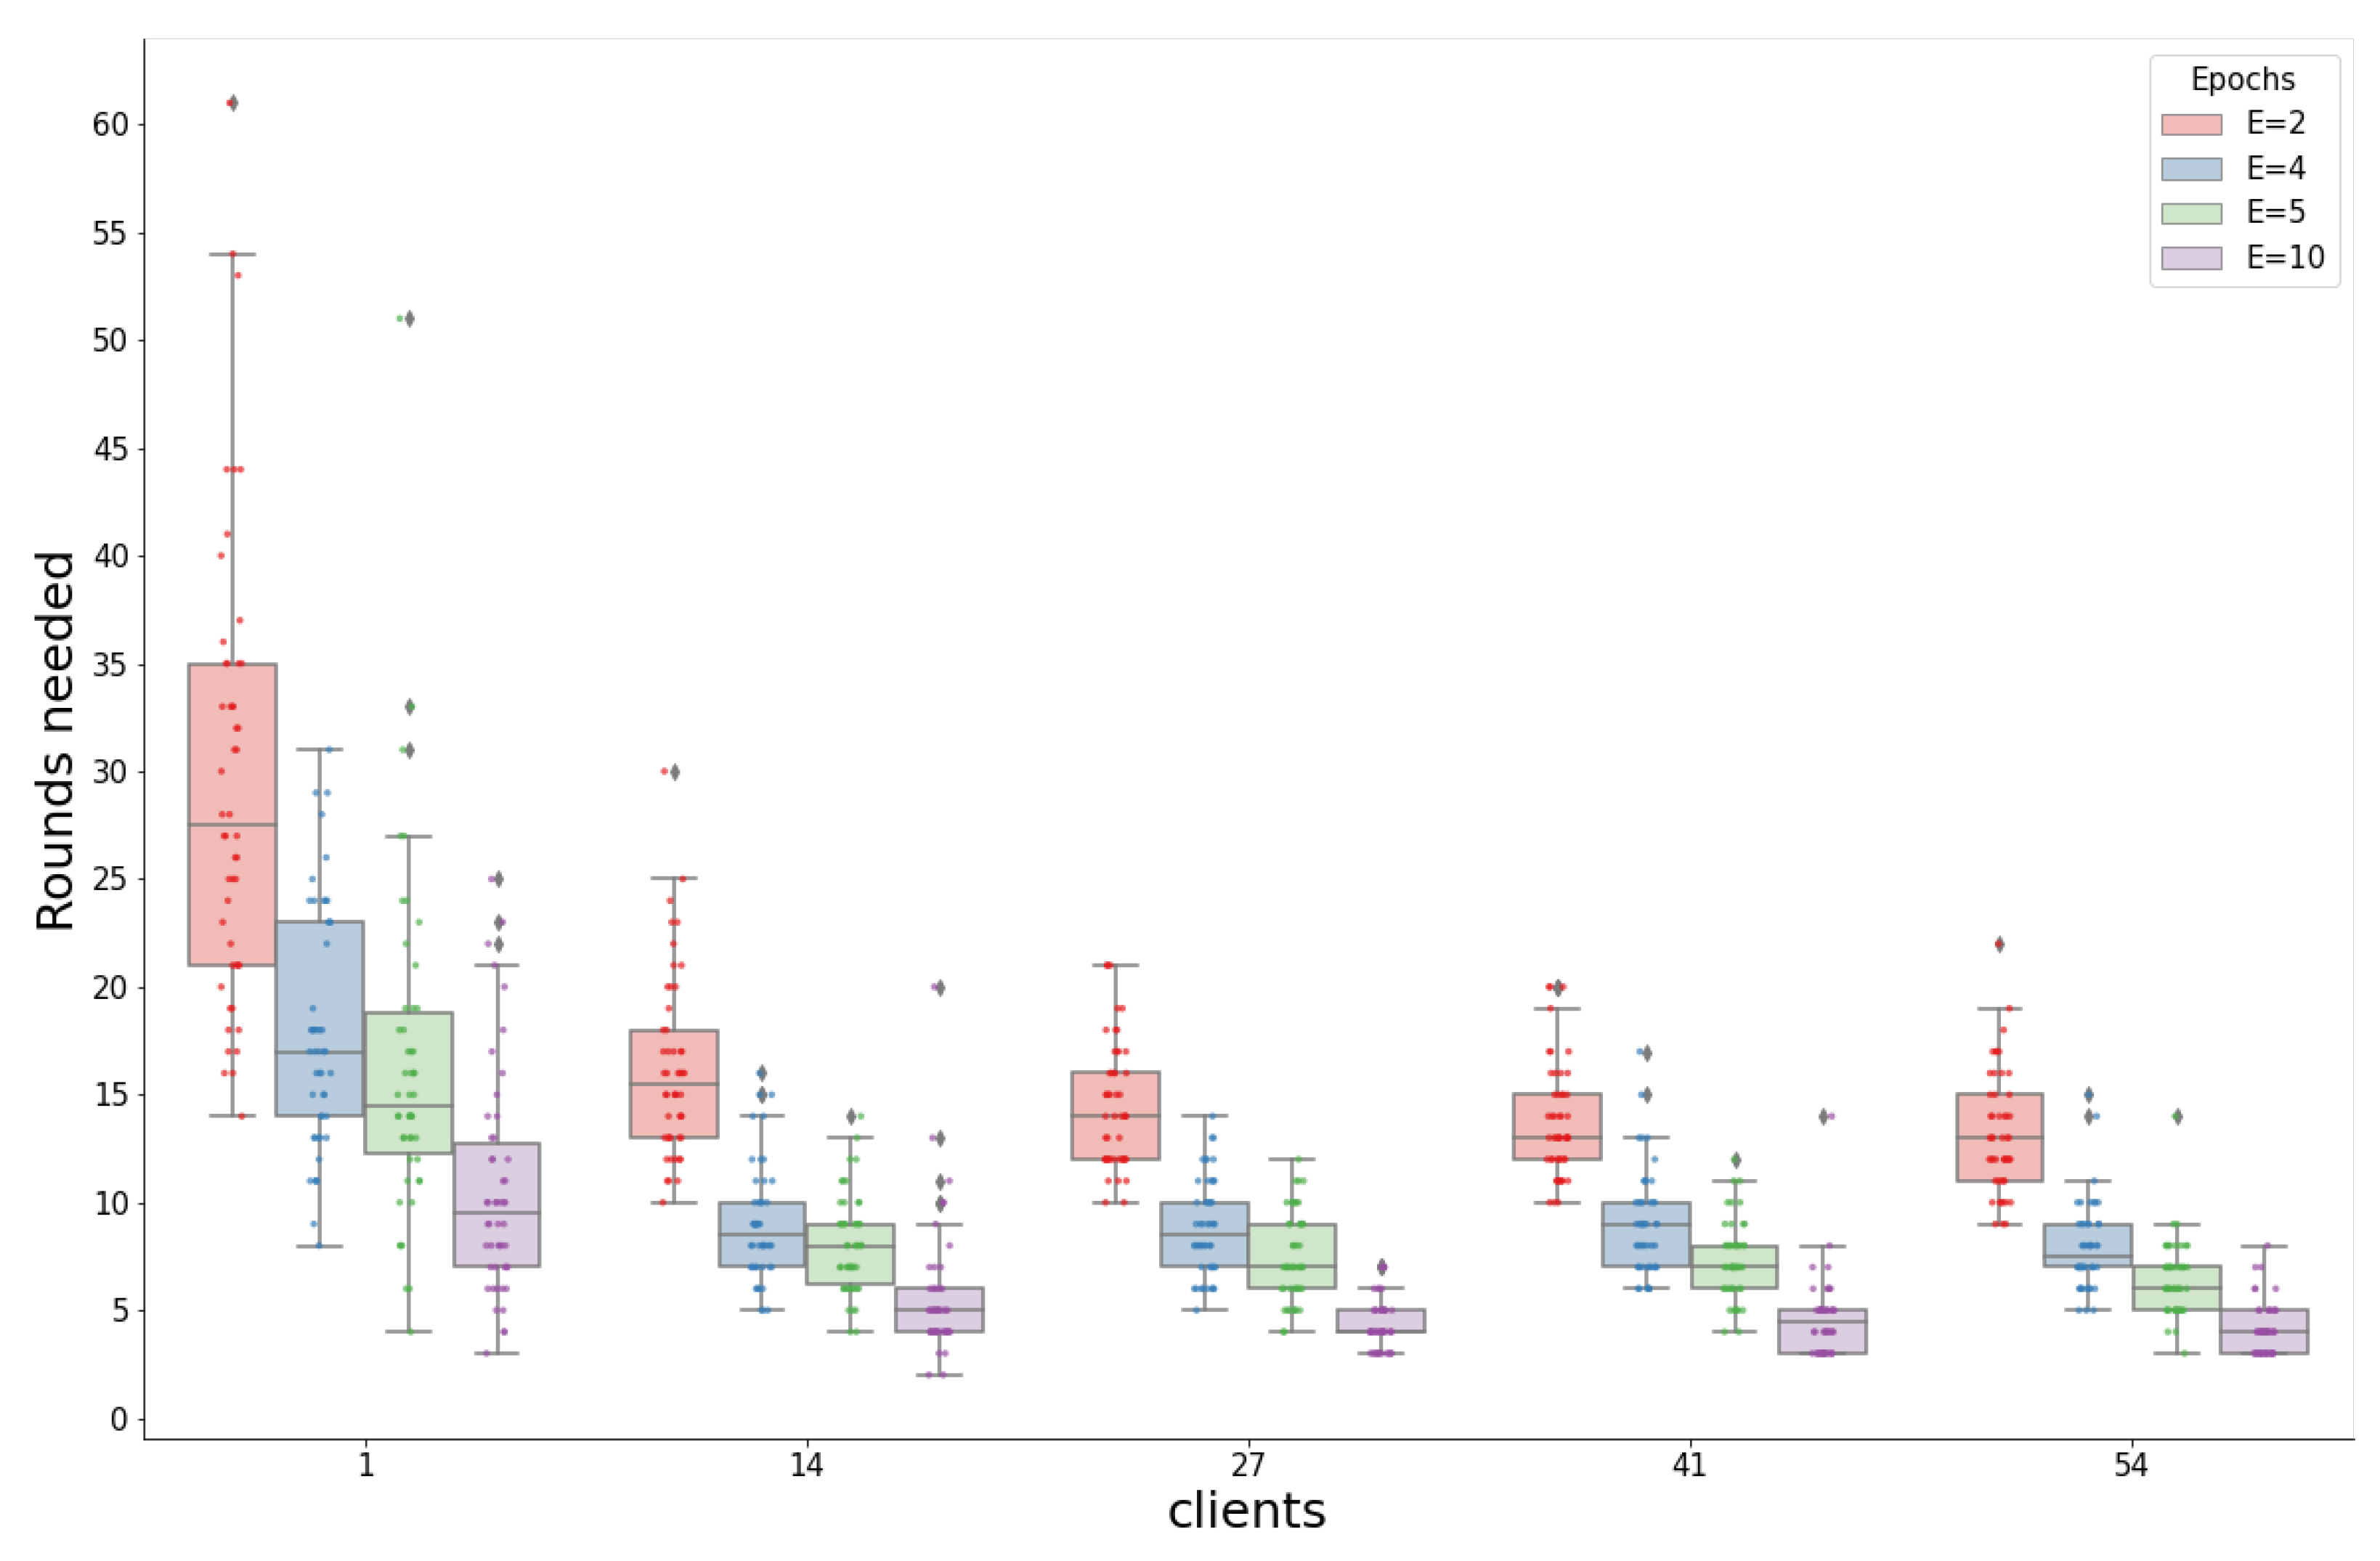
3.2. Further Tuning of the Federation

In this section we present our experiments to assert whether the federated models can reach the accuracy of the centralized setting or not.

3.2.1. Experiment

We determine whether it is possible to consistently reach the results of the centralized environment. Therefore, we repeated the experiments, running as many rounds as needed to reach 81.7% accuracy, the top accuracy of the centralized model. This evaluation scheme is inspired by the method’s comparison presented in [21].

3.2.2. Results

Figure 5 shows our results; we can see that it is possible to reach the accuracy of the centralized model in every case, with the caveat that many rounds may be needed. The maximum number of rounds is needed when training with one client per round, and the resulting accuracy presents a significant variance. From 14 clients onward, the results do not vary significantly; that is to say, increasing the number of clients does not necessarily improve convergence. Increasing E lowers the average R necessary to reach our baseline accuracy (81.7%) in every case. However, there is no 1:1 inverse relationship; for instance, if E = 2, an average of 16 rounds is needed, but if E = 10, we need six rounds. Thus an ×5 increase ratio in E but only an ×2.6 decrease ratio on R.

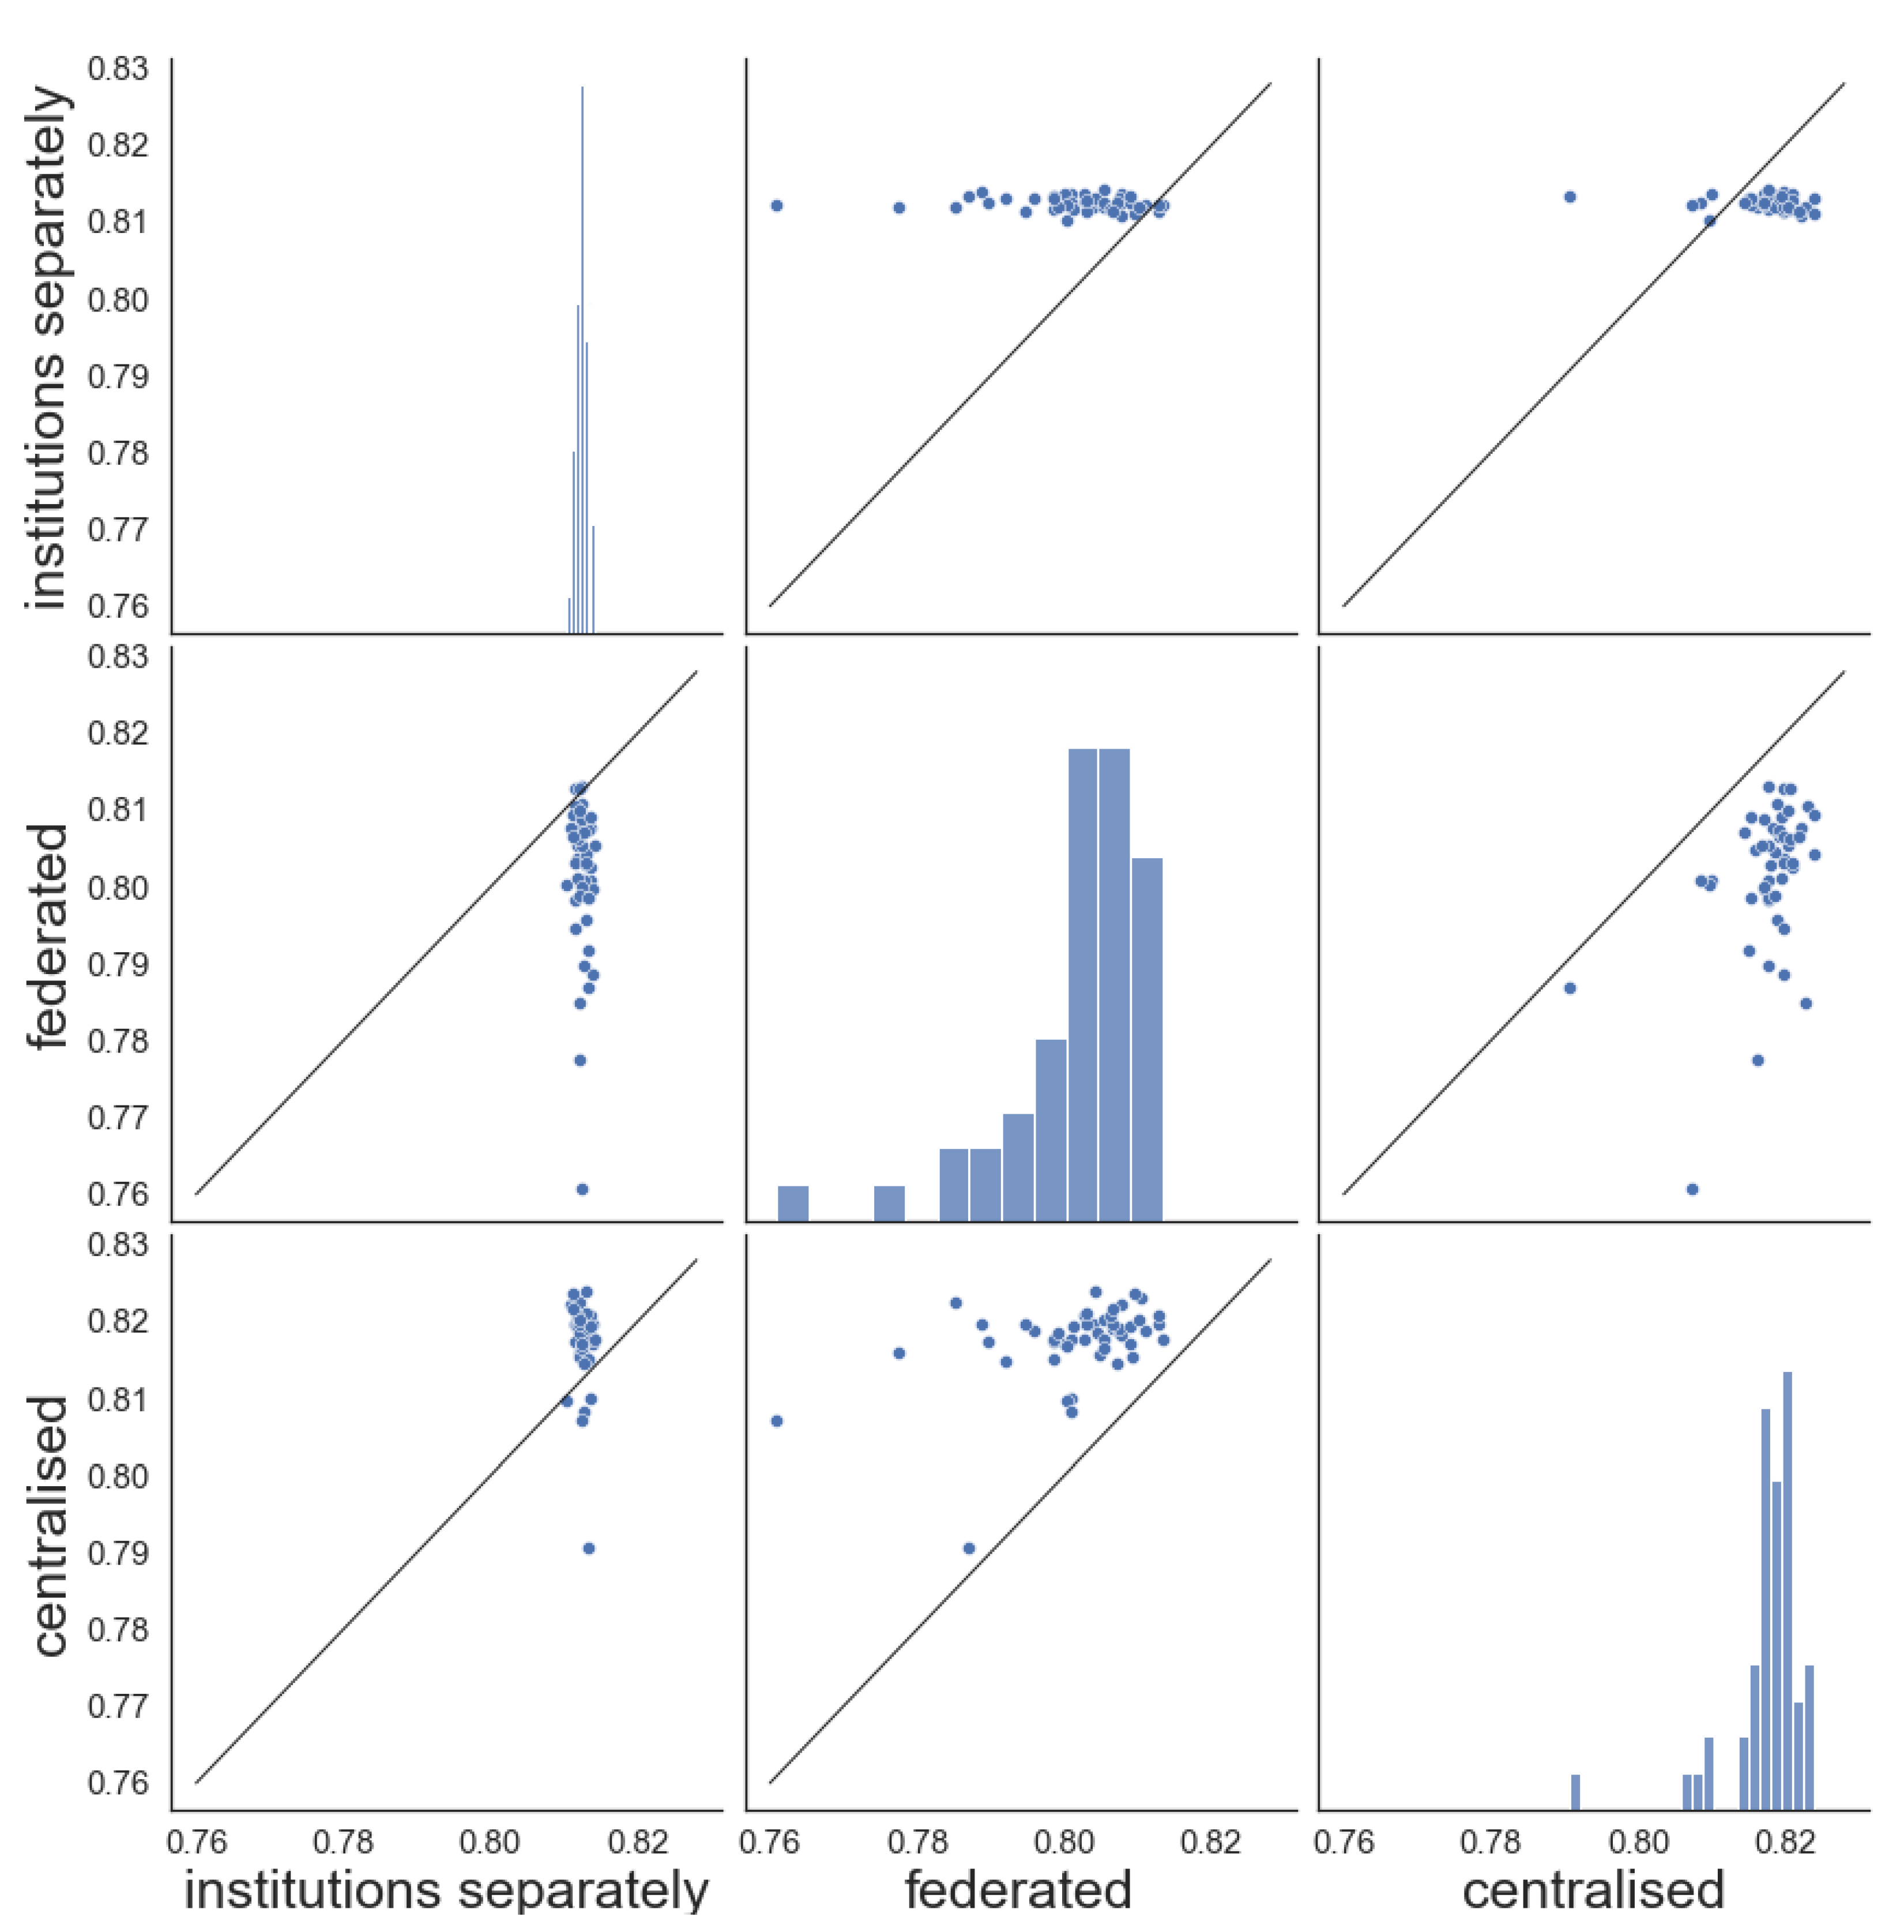
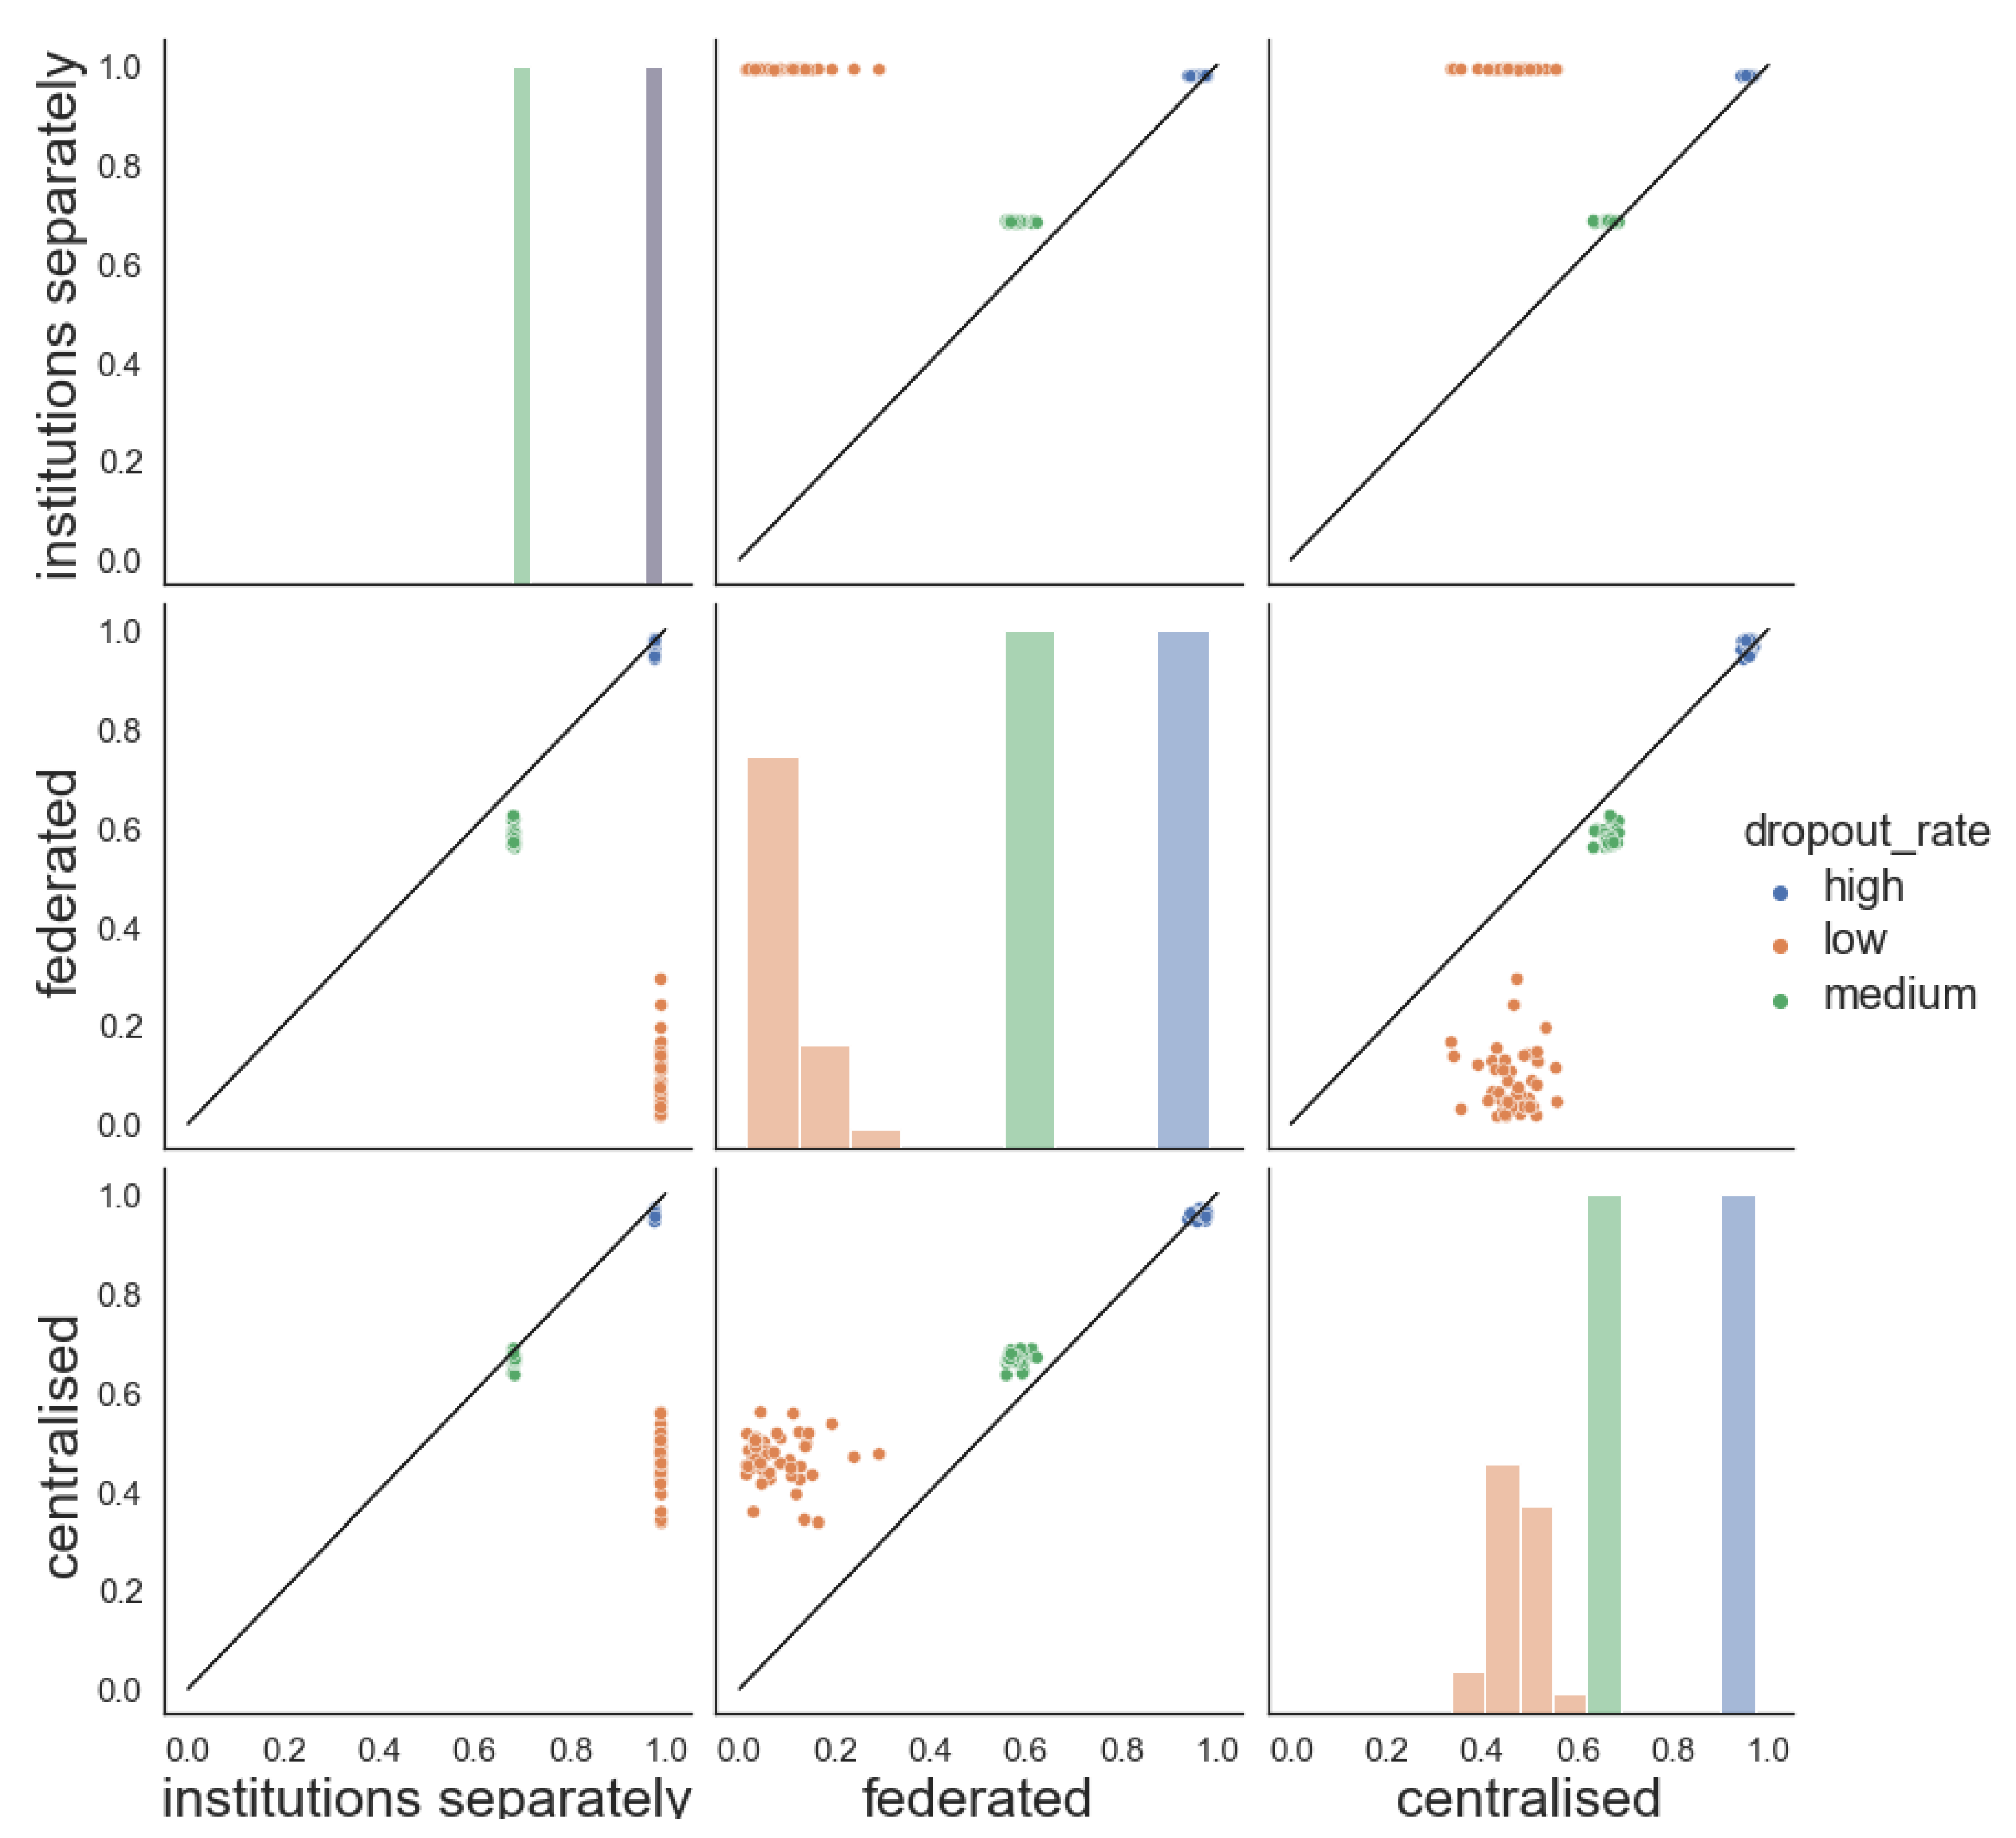
3.3. Federated Learning Performance

The experiments described in Section 3.1 test the interaction between different parameters and how they affect performance, given a fixed experimental setup. In this section, we select the parameters but vary the setups. We compare three training schemes: (1) each institution trains a model using only its local data, (2) a federated setting, and (3) a centralized approach, training on data collected from all institutions.
This experiment differs from Section 3.1 because the training parameters are fixed on a batch size equal to 32 in every case, 20 epochs for schemes 1 and 3, 10 rounds and 2 local epochs on scheme 2, and 50% of the clients on each round. We also introduced a new contender, which is models trained on each client, representing the case of institutions only using their data for an in-house model to be used for themselves, possibly only occurring with large and well-funded institutions, since they would need enough data (enough students) and resources.
To perform an experiment, we first have to simulate the clients. Since simply sampling from the original dataset of (students, courses) pairs could result in two clients having the same student assigned to different courses on each client, we first select a fixed number of students and define the client based on them. Then, for each student S selected to be a part of the client, we generate all the pairs (S, course), which finally constitute the institution’s data. This emulates how, in the real world, each student would typically take all of their courses at the same institution. For clarity, let us explain what one execution or run of an experiment in this section consists of: first, we sample a fixed number of students and define a client with their corresponding data (e.g., all the entries (student, course) for every student in each client). We do this to form each client until we run out of students; secondly, we partition each client, where 70% of the data are reserved for training and the other 30% for testing, and the training and testing are performed on each proposed scheme. This process (training and testing) must be performed to ensure a fair comparison between the three schemes. This is why we have data reserved from each client, so we always use the same data for testing. In scheme (1), each institution trains and tests on its own. In scheme (2), training is federated (using that 70% of data from each client), and testing is performed on each client on the remaining 30%. We test it with a model of the same architecture but with weights resulting after the training (in a fashion similar to Section 3.1). Finally, in scheme (3), all training data from institutions are merged into a single training dataset, but testing is performed separately on each client’s held-out data. For each scheme, we then report the average accuracy across all institutions.
The second purpose of this section is to assess the performance of the federated version on different data-distribution scenarios. This is important because, in real life, institutions come in all shapes and sizes. Therefore, we will present the scenarios in the following.

3.3.1. Homogeneous Data Distribution

The first scenario is defined by what we call a homogeneous data distribution; that is, each simulated institution (client) is generated by sampling randomly from the original dataset without any bias other than the one already present on the dataset (which favors the positive class, e.g., cases of dropout). This scenario replicates the case in real life where all institutions participating in the federation are comparable, at least when it comes to what is being predicted, in this case, early dropout of students (we could say they are equally engaging). The whole dataset has 76% dropout cases and 24% non-dropout cases; In this scenario, in the first phase of the execution, where we select the students, we sample randomly from the dataset. Therefore the label distribution mentioned will be approximately the same on each of the clients.

3.3.2. Heterogeneous Data Distribution

In the second scenario, the clients are generated by sampling from subsets of the original data, which are partitioned into three parts, using criteria based on the dropout rate. Given a student S, we define their dropout rate as the ratio of courses where they dropped out, out of all the courses in which they are enrolled. Figure 6 shows the distribution of this number across all students. We can see that most students have a dropout rate of 1; they dropped out of all their courses. Others have a dropout rate based around 0.5, so they dropped out from about half of their courses, and the rest have dropped out from no courses, so their dropout rate is 0. Based on this insight, we define three intervals: students with dropout rates from 0 to 0.2, from 0.2 to 0.8, and from 0.8 to 1. The size of the categories is shown in Table 2. Therefore, now with the defined categories, on the first phase of the execution of the experiment, we again sample 1000 students to define each client, generating its pairs as explained before, but with the condition that all students must be part of the same category of dropout rate. Based on Table 2, this process yields 9 clients with students having a low dropout rate (8 in 1000 students, 1 in 723), therefore having a label distribution skewed towards the negative class (e.g., cases of no dropout); 21 clients with a medium dropout rate, so a neutral label distribution; and 7 clients with a high dropout rate and therefore with a label distribution skewed towards the positive class. This heterogeneous scenario tries to emulate the case in real life where different institutions may have different levels of overall engagement (e.g., different overall dropout rates), either because of their teaching methods, the socio-economic background of their students, or any other reason. With our experiments, we hope to see how this affects each scheme’s performance and what scheme works better for each kind of institution.

3.3.3. Results

Figure 7 shows the results of 50 independent runs of the experiment in the first scenario, all schemes. By an independent run, we mean executing the experiment from the first step, randomly generating the clients. In each run, the clients are different; therefore, the results vary accordingly. Each point in this figure represents the average accuracy across clients achieved on each of their test data. The figure features the results of each scheme separately (histograms on diagonal), and one versus another, so it shows at the same time how they perform individually but also how they compare to one another. It clearly shows which scheme performs better by counting the number of dots above or below the drawn y = x lines. More points above the line means the scheme referenced on y- a x i s performs better.
If we focus on the histograms, we can observe that the results have different variances. When the institutions train separately, they all have an accuracy of around 81%, which is very focused. The centralized version has a more significant dispersion, and the federation has an even bigger one.
The cases in which each institution trains separately have better results on average than cases with the federated version; see quadrant at mid-left. This could be because the federation needs more rounds. However, the institutions training alone tend to perform worse than the centralized scheme, so sharing data proves beneficial. Finally, the federated version performs worse than the centralized model, but it could be because of a lack of rounds. Under the hypothesis of homogeneous data distribution, federating the training does not increase accuracy. However, given enough rounds, it could equal it, based on what we showed in Section 3.1.
Moving on to the heterogeneous scenario, Figure 8 shows the mean accuracy of 50 independent runs for each scheme. This figure is similar to Figure 7, but here we indicate the type of institution with colors according to the categories defined before.
Since fewer students have a low dropout rate (11.54% of the whole population), they are underrepresented in the total dataset, so they perform the worst in the centralized scheme (quadrant at bottom-right). Furthermore, this category only features nine institutions out of the 77 available; therefore, they are sampled less frequently during the federated averaging algorithm in the federated scheme and tend to perform poorly, seeing that they also have the worst performance for this scheme (middle quadrant). However, when the training is carried out separately, the models fit nicely to each institution’s data, regardless of their low proportion on the whole federation. The models never see the data on the rest of the institutions since they train and test in isolation. In this case, we achieve better performance (top-left, where orange and blue bins are overlapped) than in centralized and federated schemes (see orange dots on bottom-left and middle-left).
Interestingly, in institutions with medium dropout rates (green), the scheme of separated clients has its worst performance. This could be caused by the fact that here, the labels on each client are more balanced since the students in this category tend to have a 50/50 dropout rate, as opposed to the other categories where institutions have mostly only positive (high dropout) or only negative (low dropout) labels. This setup makes it harder for a model to generalize, hence the poorer performance. The federated and centralized schemes perform similarly.
Lastly, in terms of the high dropout rate, the largest category, each scheme has its best result, with the institutions separated also achieving it with the low dropout rate. Federation performs just as well as the centralized (mid-bottom) and just as well as with separate institutions (mid-left). This class is the biggest, so the centralized model generalizes easily; correspondingly, it is the one with the most clients, and the federation learns from it more often (these clients are selected for the most rounds, on average). These clients are highly unbalanced, so it is also easy for the isolated models to learn to predict there (just as in the low dropout rate).
We can conclude that if the institution belongs to a “favoured class”, i.e., those for which there are more data, then there is not much difference between using one scheme or another. If the institution has a random distribution, it is better to use approaches that leverage data from other clients, such as centralized or federated schemes. In this case, there is no evidence of performance loss using federation. To complete this analysis, if the institution belongs to one of the categories with fewer data, it is more convenient to use a customized model trained only with its data. This makes sense, because both the centralized model and the federated model will not be trained with this outlier category enough. As we saw on the results, this makes them perform poorly on the outlier institutions.

4. Discussion

The results show that increasing the number of clients and favoring more rounds result in higher accuracy. Concentrating resources on more rounds than local epochs of clients without network constraints brings better results. If time and connectivity are not an issue, using as many clients as possible per round is also optimal. However, the gain is not substantial, and reasonable results could be achieved using much fewer data (as in our experiment, using 25% and 50% of all clients). FL has the potential to achieve the same results as traditional ML in real-world settings, as it does in our experiments. However, testing in a non-experimental setting is needed to confirm this.
However, it is crucial to remember that this is a simulation, and we have yet to consider the problems involved in transferring information over the network in the real world. For example, when connectivity is an issue (such as in institutions in rural areas), it may only be possible to use some clients simultaneously in the same round. Latency may also be a factor to consider. For example, an increase in communication time could make it prohibitive to run many rounds. In these cases, it would be advisable to favor local epochs, even though the experiment in Figure 2 showed that it is not optimal in terms of accuracy. It is also worth noting that we have yet to consider privacy-preserving schemes (e.g., differential privacy [25]) in our experiments.
It is essential to remember that all experiments are based on MOOCs data; this should be kept in mind when extrapolating the results to the context of a physical institution. Some variables have an equivalent (number of courses taken, for example), but others certainly differ. On this note, the number of total courses, students, and especially students per course may not be typical of physical institutions (see Section 2).
It is crucial to notice that many potential issues would make this type of model unfeasible in the real world, such as heterogeneity in sampling and data storage across institutions, lack of processing capacity of underfunded institutions that could lead to discrimination, sampling bias of institutions in different parts of the territory, etc. All these aspects deserve thorough analysis and discussion before adopting this type of solution, as well as further experimentation to gauge the possible limitations of the federated approach.
Finally, we have focused on assessing whether a model can yield similar results in federated and centralized training settings. We also have explored the extent to which each client benefits from the federation, depending mostly on data distribution patterns. We showed that in some cases it is feasible to benefit from the patterns learned by the model at other institutions and that the obtained results are better than simply training a model of its own. Further experiments are needed to extend the observations to other scenarios, for example, considering the relative size of the institutions, their hardware and connection capabilities, etc.

5. Conclusions

In this paper, we evaluate the application of federated learning for learning analytics, specifically for student dropout prediction based on students’ activities. We implemented a neural network model to predict students’ behavior, and we explored different training scenarios (centralized and federated under various data-distribution hypotheses). In addition, we evaluated the influence on the prediction results of parameters such as the number of clients, the data distribution, the batch size, and the number of epochs. Although more exhaustive evaluations of the approach are still to be carried out, the results are auspicious. Our future work includes using real data and studying the possible repercussions that enabling mechanisms such as differential privacy could have. In all cases, interesting conclusions are reached, which demonstrate the feasibility of this approach and allow for envisioning its application at institutional and industrial levels in many scenarios.

Author Contributions

Conceptualization, P.B., G.C., L.E. and M.I.F.; software, C.F. and A.T.; validation, G.C. and M.I.F.; investigation, P.B., G.C., L.E., M.I.F., C.F. and A.T.; writing—original draft preparation, P.B., G.C., L.E. and M.I.F.; writing—review and editing, L.E.; visualization, M.I.F.; supervision, P.B., G.C., L.E. and M.I.F. All authors have read and agreed to the published version of the manuscript.

Funding

This research was funded by Agencia Nacional de Innovación e Investigación (ANII) Uruguay, Grant Number FMV_3_2020_1_162910.

Institutional Review Board Statement

Not applicable.

Informed Consent Statement

Not applicable.

Data Availability Statement

Not applicable.

Conflicts of Interest

The authors declare no conflict of interest. The funders had no role in the design of the study; in the collection, analyses, or interpretation of data; in the writing of the manuscript; or in the decision to publish the results.

Appendix A

Features vector
There are different actions tracked on the platforms: video actions (seek, play, pause, stop, load), problem actions (get the problem, check, reset), forum actions (create a thread, comment, delete thread, delete comment), click actions, and closing the page. Therefore, the entire feature vector has 21 features, each corresponding to one action, counting the number of times the student performed the action during their enrollment in the course. Programatically, it is a list such as the following:
          [‘seek_video#num’, ‘play_video#num’, ‘pause_video#num’, ‘stop_video#num’,
          ‘load_video#num’, ‘problem_get#num’, ‘problem_check#num’,
          ‘problem_save#num’, ‘reset_problem#num’, ‘problem_check_correct#num’,
          ‘problem_check_incorrect#num’, ‘create_thread#num’,
          ‘create_comment#num’, ‘delete_thread#num’, ‘delete_comment#num’,
          ‘click_info#num’, ‘click_courseware#num’, ‘click_about#num’,
          ‘click_forum#num’, ‘click_progress#num’, ‘close_courseware#num’]
		  
Times of experiments for parameter tuning
Figure A1. Mean time results of federation applied to dropout prediction, averaging over 50 random executions with different amount of clients per round (C), number of rounds (R), and local epochs of clients (E),s where R × E = 20 .
Data 08 00043 g0a1
Hardware specifications for dropout experiments:
  • CPU 2.3 GHz Quad-Core Intel Core i7.
  • 16 GB of RAM.

References

  1. Drachsler, H.; Kismihók, G.; Chen, W.; Hoel, T.; Berg, A.; Cooper, A.; Scheffel, M.; Ferguson, R. Ethical and privacy issues in the design of learning analytics applications. In ACM International Conference Proceeding Series; Association for Computing Machinery: New York, NY, USA, 2016; Volume 25–29, pp. 492–493. [Google Scholar] [CrossRef] [Green Version]
  2. Banihashem, S.K.; Aliabadi, K.; Pourroostaei Ardakani, S.; Delaver, A.; Nili Ahmadabadi, M. Learning Analytics: A Systematic Literature Review. Interdiscip. J. Virtual Learn. Med. Sci. 2018, 9, 63024. [Google Scholar] [CrossRef] [Green Version]
  3. Mangaroska, K.; Giannakos, M. Learning Analytics for Learning Design: A Systematic Literature Review of Analytics-Driven Design to Enhance Learning. IEEE Trans. Learn. Technol. 2019, 12, 516–534. [Google Scholar] [CrossRef] [Green Version]
  4. Sweeney, L. k-anonymity: A model for protecting privacy. Int. J. Uncertain. Fuzziness Knowl.-Based Syst. 2002, 10, 557–570. [Google Scholar] [CrossRef] [Green Version]
  5. Khalil, M.; Ebner, M. De-Identification in Learning Analytics. J. Learn. Anal. 2016, 3, 129–138. [Google Scholar] [CrossRef]
  6. Kyritsi, K.H.; Zorkadis, V.; Stavropoulos, E.C.; Verykios, V.S. The pursuit of patterns in educational data mining as a threat to student privacy. J. Interact. Media Educ. 2019, 2019, 2. [Google Scholar] [CrossRef] [Green Version]
  7. Dwork, C. Differential privacy: A survey of results. In Proceedings of the International Conference on Theory and Applications of Models of Computation; Springer: Berlin/Heidelberg, Germany, 2008; pp. 1–19. [Google Scholar]
  8. Gursoy, M.E.; Inan, A.; Nergiz, M.E.; Saygin, Y. Privacy-Preserving Learning Analytics: Challenges and Techniques. IEEE Trans. Learn. Technol. 2017, 10, 68–81. [Google Scholar] [CrossRef]
  9. Konečný, J.; McMahan, H.B.; Ramage, D.; Richtarik, P. Federated Optimization: Distributed Machine Learning for On-Device Intelligence. arXiv 2016, arXiv:1610.02527. [Google Scholar] [CrossRef]
  10. Li, T.; Sahu, A.K.; Talwalkar, A.; Smith, V. Federated Learning: Challenges, Methods, and Future Directions. IEEE Signal Process. Mag. 2020, 37, 50–60. [Google Scholar] [CrossRef]
  11. Yang, Q.; Liu, Y.; Chen, T.; Tong, Y. Federated Machine Learning: Concept and Applications. ACM Trans. Intell. Syst. Technol. 2019, 10, 1–19. [Google Scholar] [CrossRef]
  12. Hakak, S.; Ray, S.; Khan, W.Z.; Scheme, E. A framework for edge-assisted healthcare data analytics using federated learning. In Proceedings of the 2020 IEEE International Conference on Big Data (Big Data), Atlanta, GA, USA, 10–13 December 2020; pp. 3423–3427. [Google Scholar]
  13. Nguyen, D.C.; Pham, Q.V.; Pathirana, P.N.; Ding, M.; Seneviratne, A.; Lin, Z.; Dobre, O.; Hwang, W.J. Federated learning for smart healthcare: A survey. ACM Comput. Surv. (CSUR) 2022, 55, 1–37. [Google Scholar] [CrossRef]
  14. Rieke, N.; Hancox, J.; Li, W.; Milletari, F.; Roth, H.R.; Albarqouni, S.; Bakas, S.; Galtier, M.N.; Landman, B.A.; Maier-Hein, K.; et al. The future of digital health with federated learning. NPJ Digit. Med. 2020, 3, 1–7. [Google Scholar] [CrossRef]
  15. Divi, S.; Lin, Y.S.; Farrukh, H.; Celik, Z.B. New Metrics to Evaluate the Performance and Fairness of Personalized Federated Learning. arXiv 2021, arXiv:2107.13173. [Google Scholar] [CrossRef]
  16. Shi, Y.; Yu, H.; Leung, C. A Survey of Fairness-Aware Federated Learning. arXiv 2021, arXiv:2111.01872. [Google Scholar]
  17. Feng, W.; Tang, J.; Liu, T.X. Understanding dropouts in MOOCs. In Proceedings of the AAAI Conference on Artificial Intelligence; AAAI: Palo Alto, CA, USA, 2019; Volume 33, pp. 517–524. [Google Scholar]
  18. Guo, S.; Zeng, D. Pedagogical Data Federation toward Education 4.0. In Proceedings of the 6th International Conference on Frontiers of Educational Technologies; Association for Computing Machinery: New York, NY, USA, 2020; pp. 51–55. [Google Scholar] [CrossRef]
  19. Kairouz, P.; McMahan, B.; Song, S.; Thakkar, O.; Thakurta, A.; Xu, Z. Practical and Private (Deep) Learning without Sampling or Shuffling. arXiv 2021, arXiv:2103.00039. [Google Scholar] [CrossRef]
  20. Zaman, F. Instilling Responsible and Reliable AI Development with Federated Learning. 2020. Available online: https://medium.com/accenture-the-dock/instilling-responsible-and-reliable-ai-development-with-federated-learning-d23c366c5efd (accessed on 3 January 2023).
  21. McMahan, B.; Moore, E.; Ramage, D.; Hampson, S.; y Arcas, B.A. Communication-efficient learning of deep networks from decentralized data. In Proceedings of the Artificial Intelligence and Statistics, Fort Lauderdale, FL, USA, 20–22 April 2017; pp. 1273–1282. [Google Scholar]
  22. KDD. KDDCup. 2015. Available online: http://moocdata.cn/challenges/kdd-cup-2015 (accessed on 3 January 2023).
  23. FLEA. FLEA Project Public Repository. 2022. Available online: https://gitlab.fing.edu.uy/lorenae/flea (accessed on 3 January 2023).
  24. Kingma, D.P.; Ba, J. Adam: A method for stochastic optimization. arXiv 2014, arXiv:1412.6980. [Google Scholar]
  25. Liu, B.; Ding, M.; Shaham, S.; Rahayu, W.; Farokhi, F.; Lin, Z. When Machine Learning Meets Privacy: A Survey and Outlook. ACM Comput. Surv. 2021, 54, 1–36. [Google Scholar] [CrossRef]
Figure 1. Our proposal for a cross-silo federated learning scheme for centralized data analysis of the educational system.
Data 08 00043 g001
Figure 2. Federated Learning Architecture. The numbers indicate the steps for training a model in an FL scheme. Reprinted/adapted with permission from Ref. [20]. 2020, Faisal Zaman.
Data 08 00043 g002
Figure 3. Histogram showing the count of courses with a certain number of students. About 70 courses have about 500 students.
Data 08 00043 g003
Figure 4. Accuracy results of dropout prediction (Federated version), averaging over 50 random executions with different number of clients per round (C), number of rounds (R), and local epochs of clients (E), where R × E = 20 . Each box contains 50 points. The black line marks accuracy averaged by the centralized model.
Data 08 00043 g004
Figure 5. Number of rounds R needed to reach the centralized accuracy baseline (81.7%), averaging over 50 random executions with different number of clients per round (C) and local epochs at clients (E).
Data 08 00043 g005
Figure 6. Dropout rate distribution over all students.
Data 08 00043 g006
Figure 7. Mean accuracy comparison of 50 independent runs using three training schemes: institutions alone, federated, and centralized. Homogeneous scenario (clients made sampling randomly from the data set). Figure is symmetrical.
Data 08 00043 g007
Figure 8. Mean accuracy comparison of 50 independent runs using three training schemes: institutions alone, federated, and centralized. Dropout rate varies between clients according to the categories defined in Table 2.
Data 08 00043 g008
Table 1. Percentage of students taking a certain number of courses. The vast majority of students take only a few courses.
% of All Students# CoursesStudents Taking # Courses
46%235,683
17%313,271
16%112,411
8%46277
4%53212
9%>56229
Table 2. Student categories according to dropout rate.
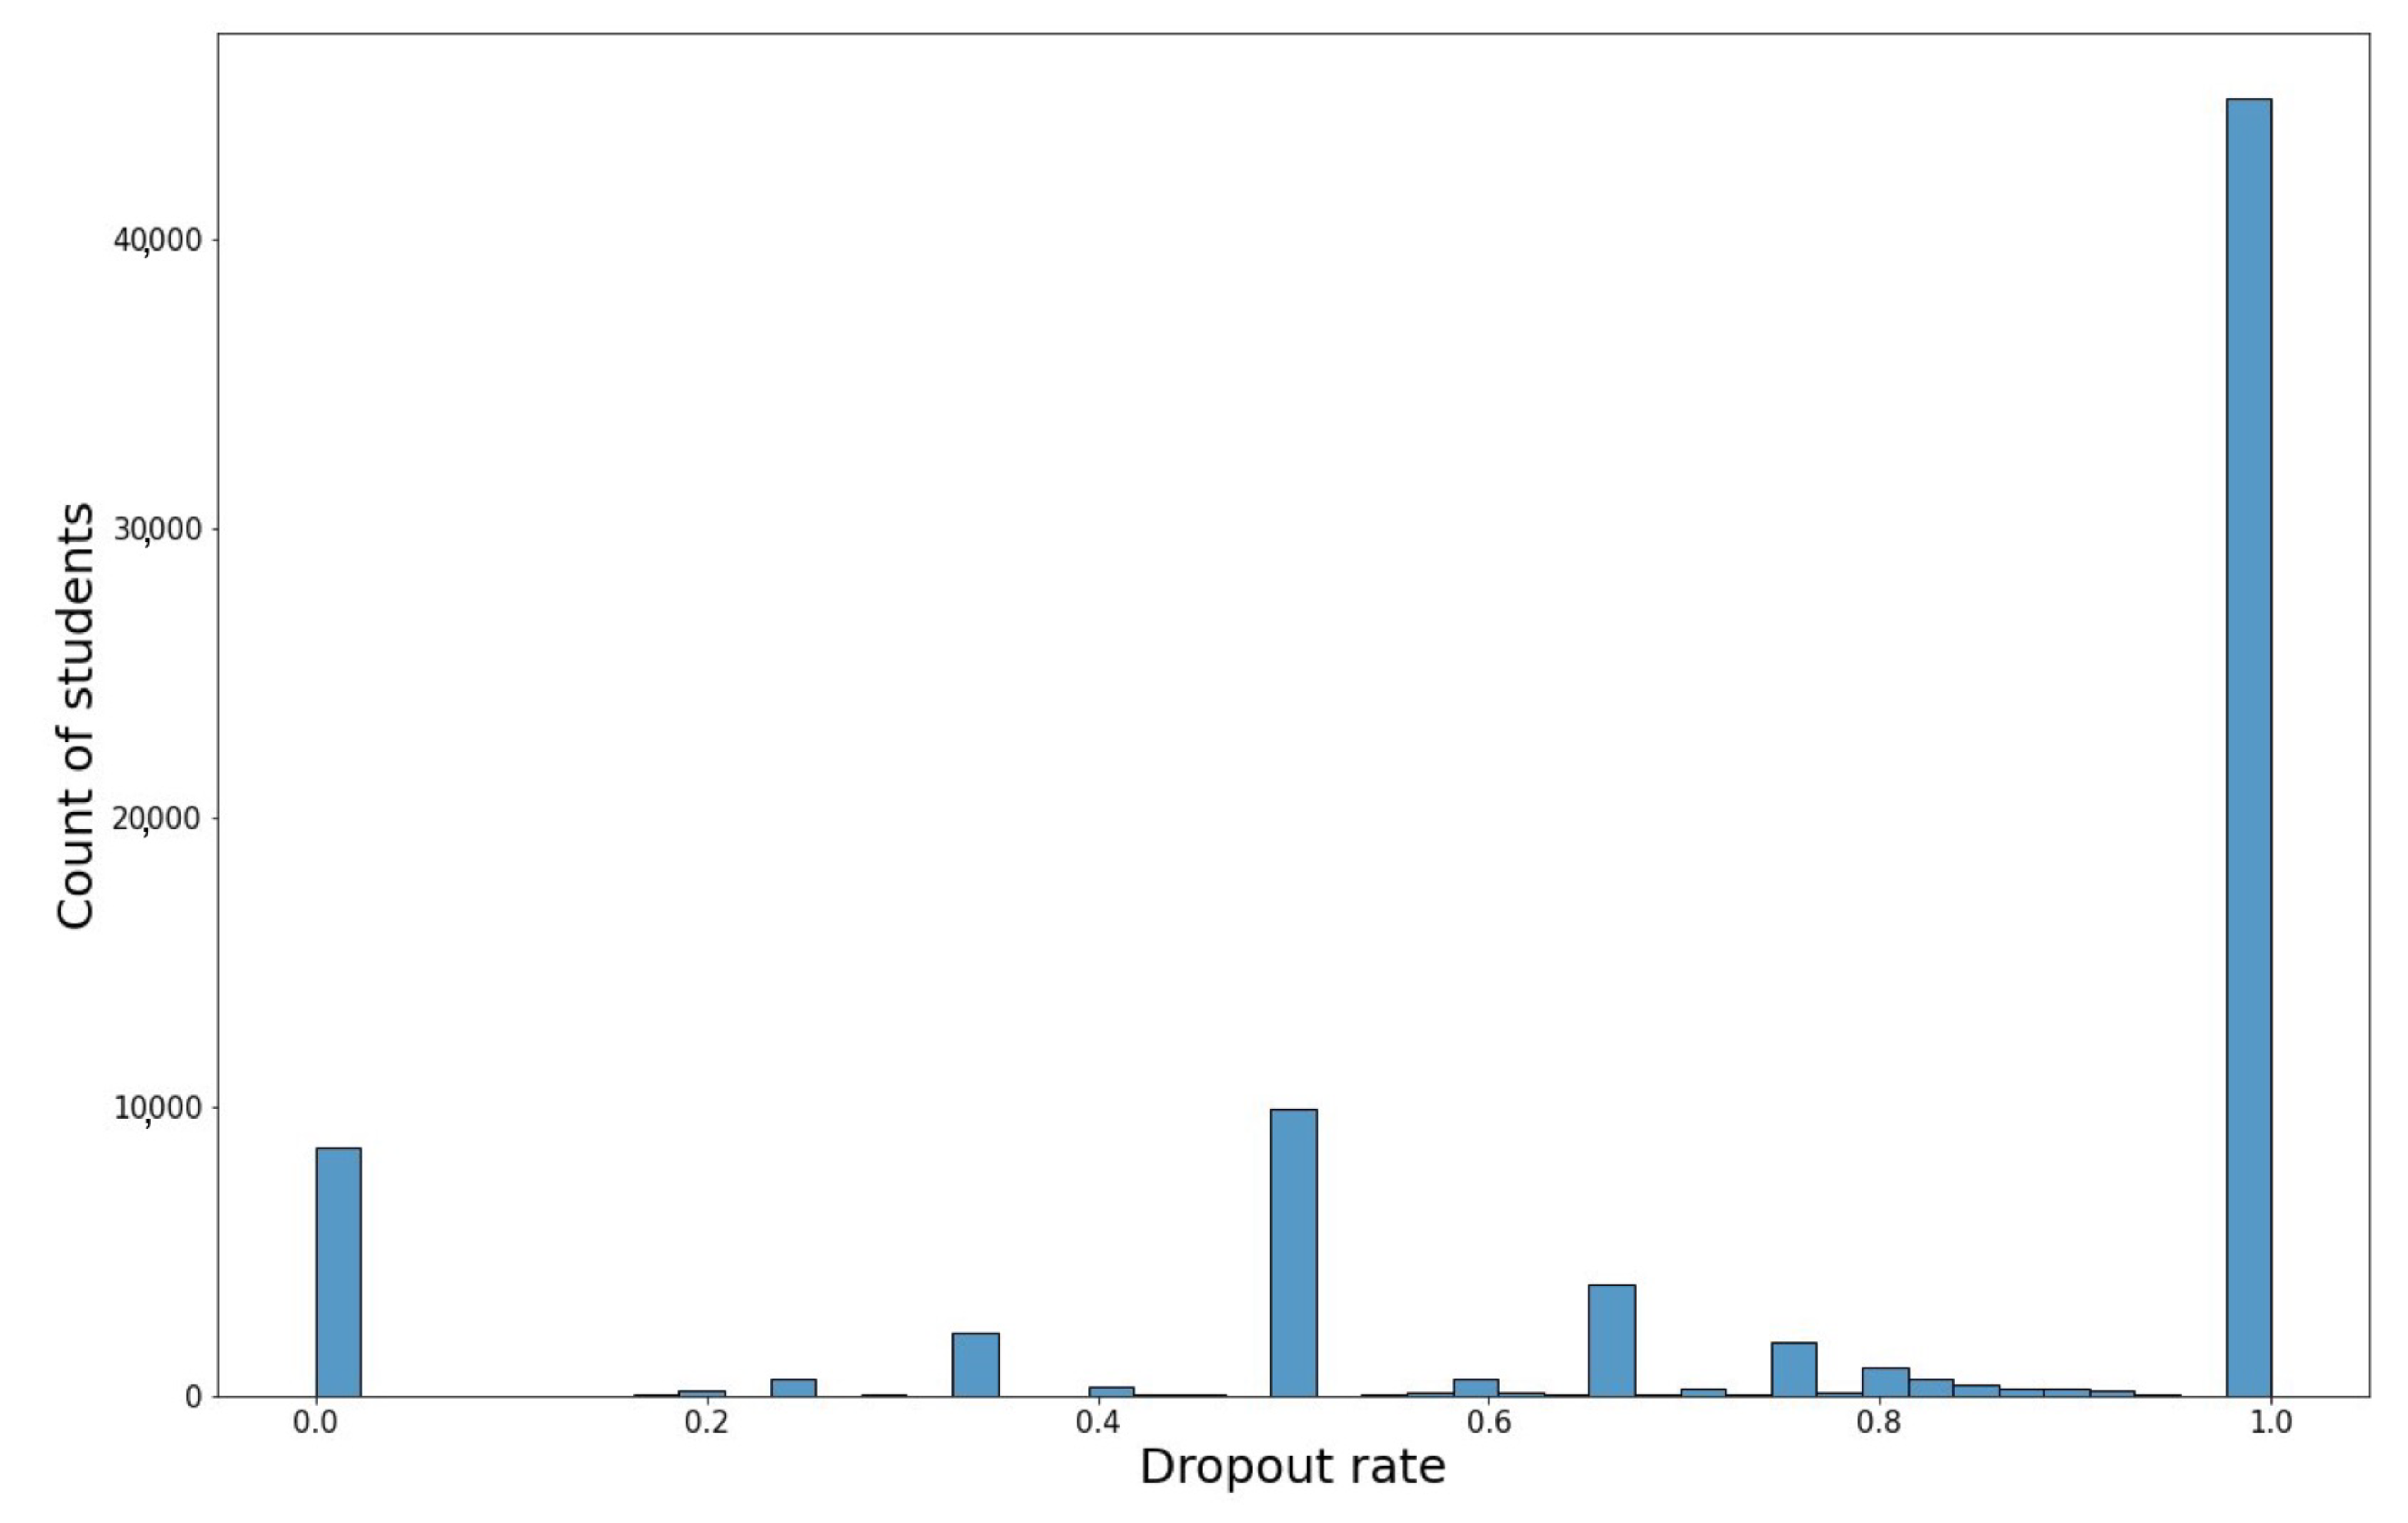
Students with a low dropout rate (lower than 0.2):889511.54%
Students with a medium dropout rate (between 0.2 and 0.8):20,56726.68%
Students with a high dropout rate (higher than 0.8):47,62161.78%
Disclaimer/Publisher’s Note: The statements, opinions and data contained in all publications are solely those of the individual author(s) and contributor(s) and not of MDPI and/or the editor(s). MDPI and/or the editor(s) disclaim responsibility for any injury to people or property resulting from any ideas, methods, instructions or products referred to in the content.

