1. Summary
The eastern Indo-Gangetic plain is characterized by fertile alluvial soils [
1] wherein rice and wheat are predominantly grown. This region has the potential to support high wheat yields if proper crop production practices are put into place [
2]. There is a substantial yield gap in wheat mainly due to delayed sowing [
3] and the use of late-sown varieties [
4]. Over the past several years, farmers’ awareness regarding the ‘importance of time’ in wheat sowing (sowing in the first fortnight of November) has substantially improved. Still, early sowing is the exception rather than the norm. Apart from awareness, there are other challenges [
5,
6] that restrict the farmers’ ability to plant wheat on time, including, for example, the late establishment and harvesting of the preceding rice crop [
7], the delayed clearing of rice plots due to poor farm mechanization, and the limited adoption of and/or access to zero-tillage wheat sowing equipment. Delay in wheat sowing after optimum time results in yield reduction by almost 1% per day [
8].
The research was conducted at the landscape level for five consecutive wheat seasons starting from 2016–2017 to 2020–2021 on farmers’ fields. The objective of this study was to quantify yield loss trends along the typical sowing date gradient and evaluate if the rate of decline was constant for the whole wheat sowing window. Another purpose of this work was to generate evidence on the comparative performance of long-duration wheat varieties (LDVs) and short-duration wheat varieties (SDVs) for different planting dates—do SDVs really outperform under late-sown conditions? Farmers are generally inclined towards SDVs in late-sown scenarios. The trial had five treatments of sowing time—(T1) 1 to 10 November, (T2) 11–20 November, (T3) 21 to 30 November, (T4) 1–15 December, and (T5) 16–31 December. T3, T4, and T5 had two sub-plots each of LDVs and SDVs. T1 and T2 had only LDVs because SDVs are generally planted after 20 November in field situations.
In the context of agronomic field research, the length and breadth of this dataset is quite large. The dataset can help agricultural researchers better understand the interannual variation of varietal yield response to planting date and the effect of seasonal weather conditions. Results of varietal performance can be re-validated by concerned institutions, as this has been a debated topic. Additional evidence for productivity gains from late-sown LDVs is needed before regional research and extension entities modify priorities to focus more on LDVs under late-sown conditions.
2. Data Description
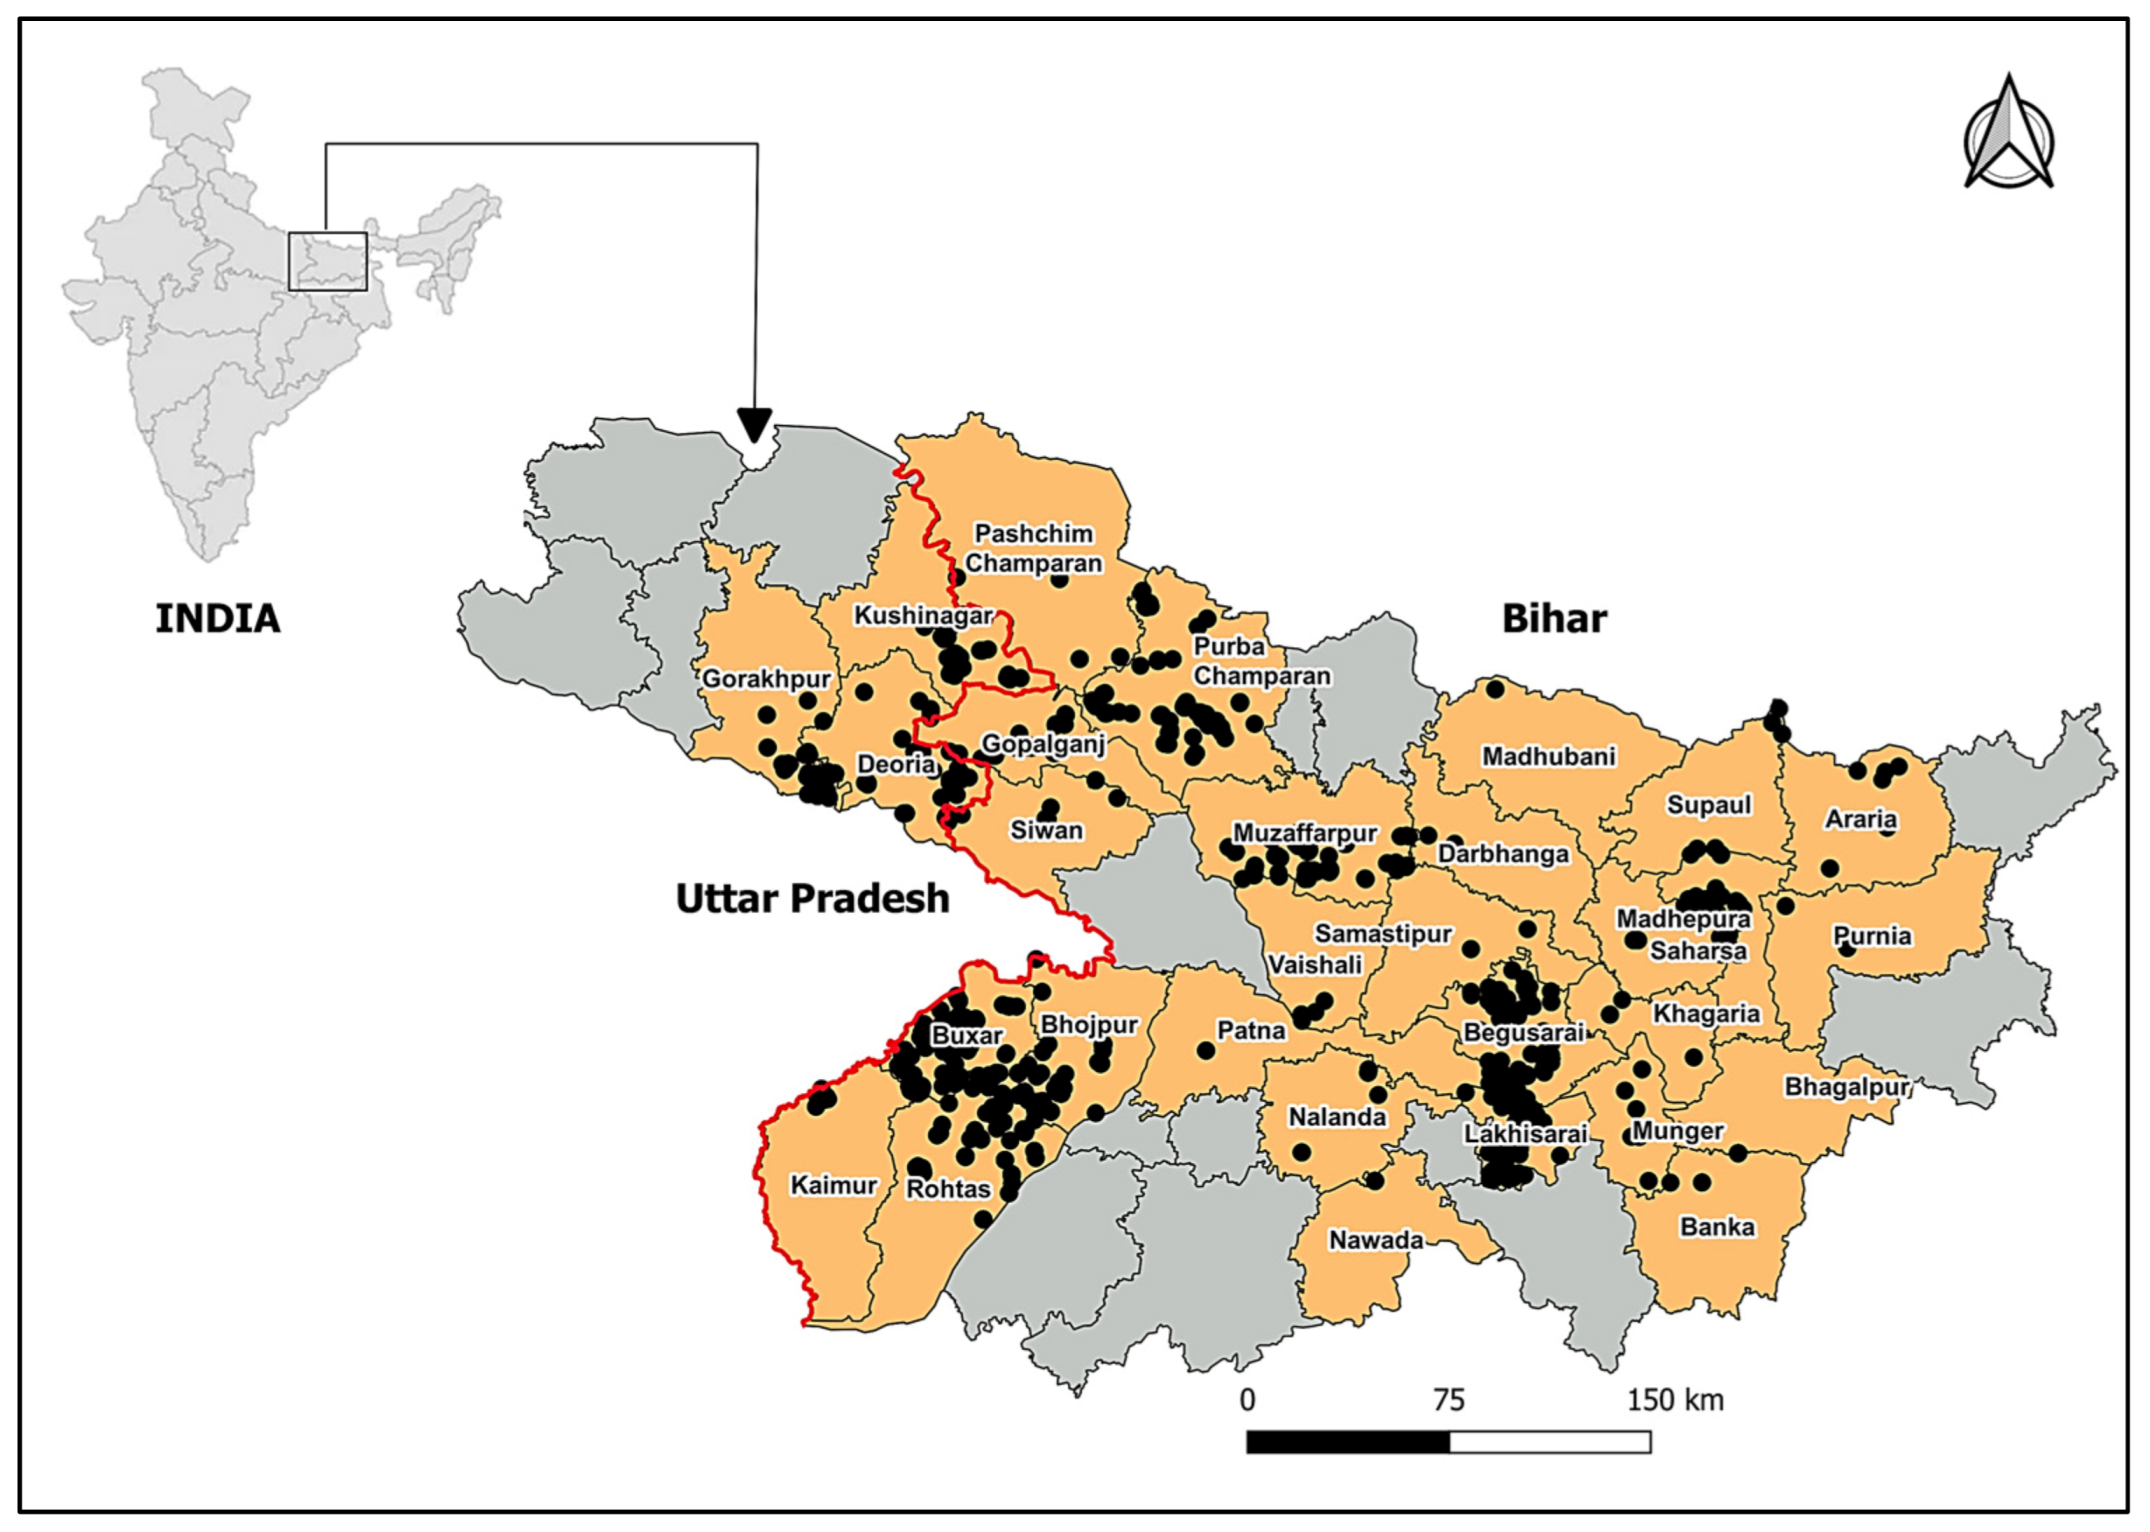
The trial was conducted in two east Indian states—Bihar and Uttar Pradesh (UP). There were eight districts from Bihar and two from eastern UP, adjoining part of Bihar (
Figure 1). Two types of wheat varieties were compared for yield performance based on time of sowing—LDVs and SDVs. Approximate maturing duration for LDVs and SDVs of wheat are 150 and 130 days, respectively.
2.1. Trial Location
This is the world’s most densely populated area where rice and wheat (the two major cereals) are grown in rotation. The region is characterized by fertile soils due to alluvium deposition by the river Ganges. Annual precipitation is around 1500 mm, and ground water sources are also very rich.
2.2. Trial Coverage and Data Size
The trial consisted of five treatments based on the time of wheat sowing. T1, T2, T3, T4, and T5 denote wheat sowing from 1–10 November, 11–20 November, 21–30 November, 1–15 December, and 16–31 December, respectively. Varietal comparisons were done under T3, T4, and T5, as SDVs are mostly planted after 20 November. However, in some scenarios, they could be planted before, so they appeared in T2 at a few locations. The most commonly used wheat varieties by farmers were selected under both of the varietal classes. In the majority of cases, HD 2967 wheat variety was used for the LDV category, and PBW 373 was the predominant variety used in the SDV category. Out of 3735 sites, 2958 sites were located in eight districts of Bihar, whereas 777 sites were in two districts of UP (
Table 1).
Table 1 further segregates trial sites by treatment and variety class.
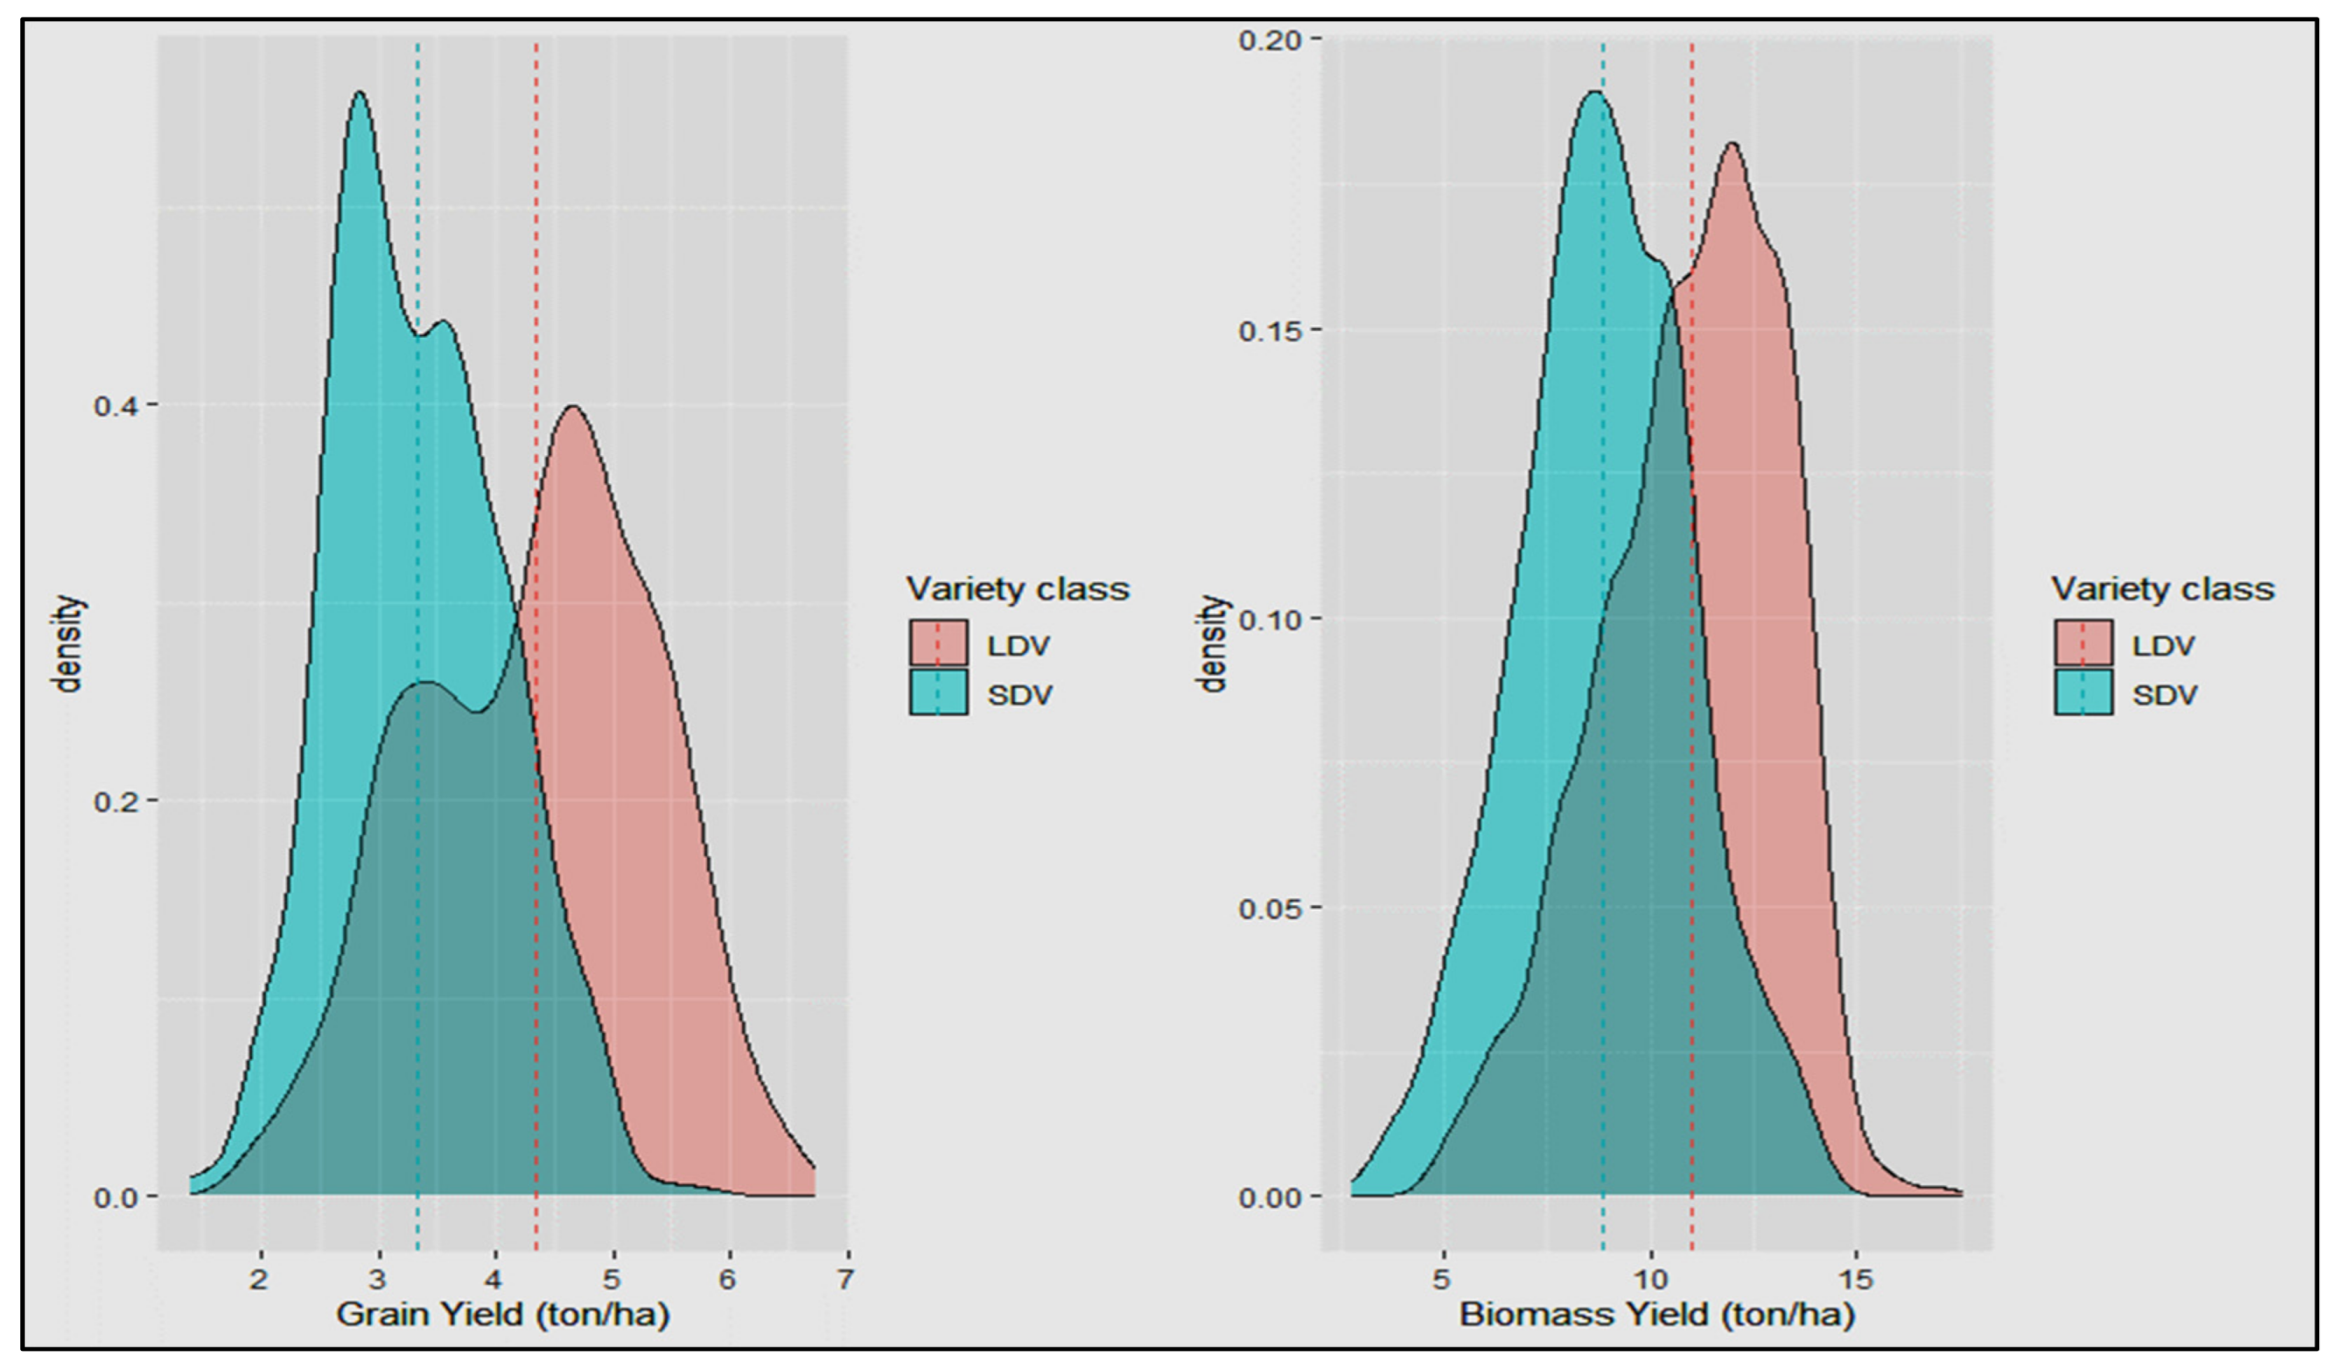
2.3. Grain and Biomass Yields
Overall, the comparison of grain yields revealed that the yields of the LDVs were higher than the SDVs. The yield difference between them was around 1 ton ha
−1. The mean grain yield of LDVs in the top 10% cases was 5.95 ton ha
−1, whereas this value for the SDVs was 4.45 ton ha
−1. A similar comparison for the biomass yield of LDVs and SDVs highlighted a difference of slightly more than 2 ton ha
−1 in favor of the LDVs. In the top 10% cases of LDVs and SDVs, the mean biomass yields were 14.16 and 10.81 ton ha
−1, respectively. These numbers very clearly indicate that LDVs have substantially higher potential (
Figure 2).
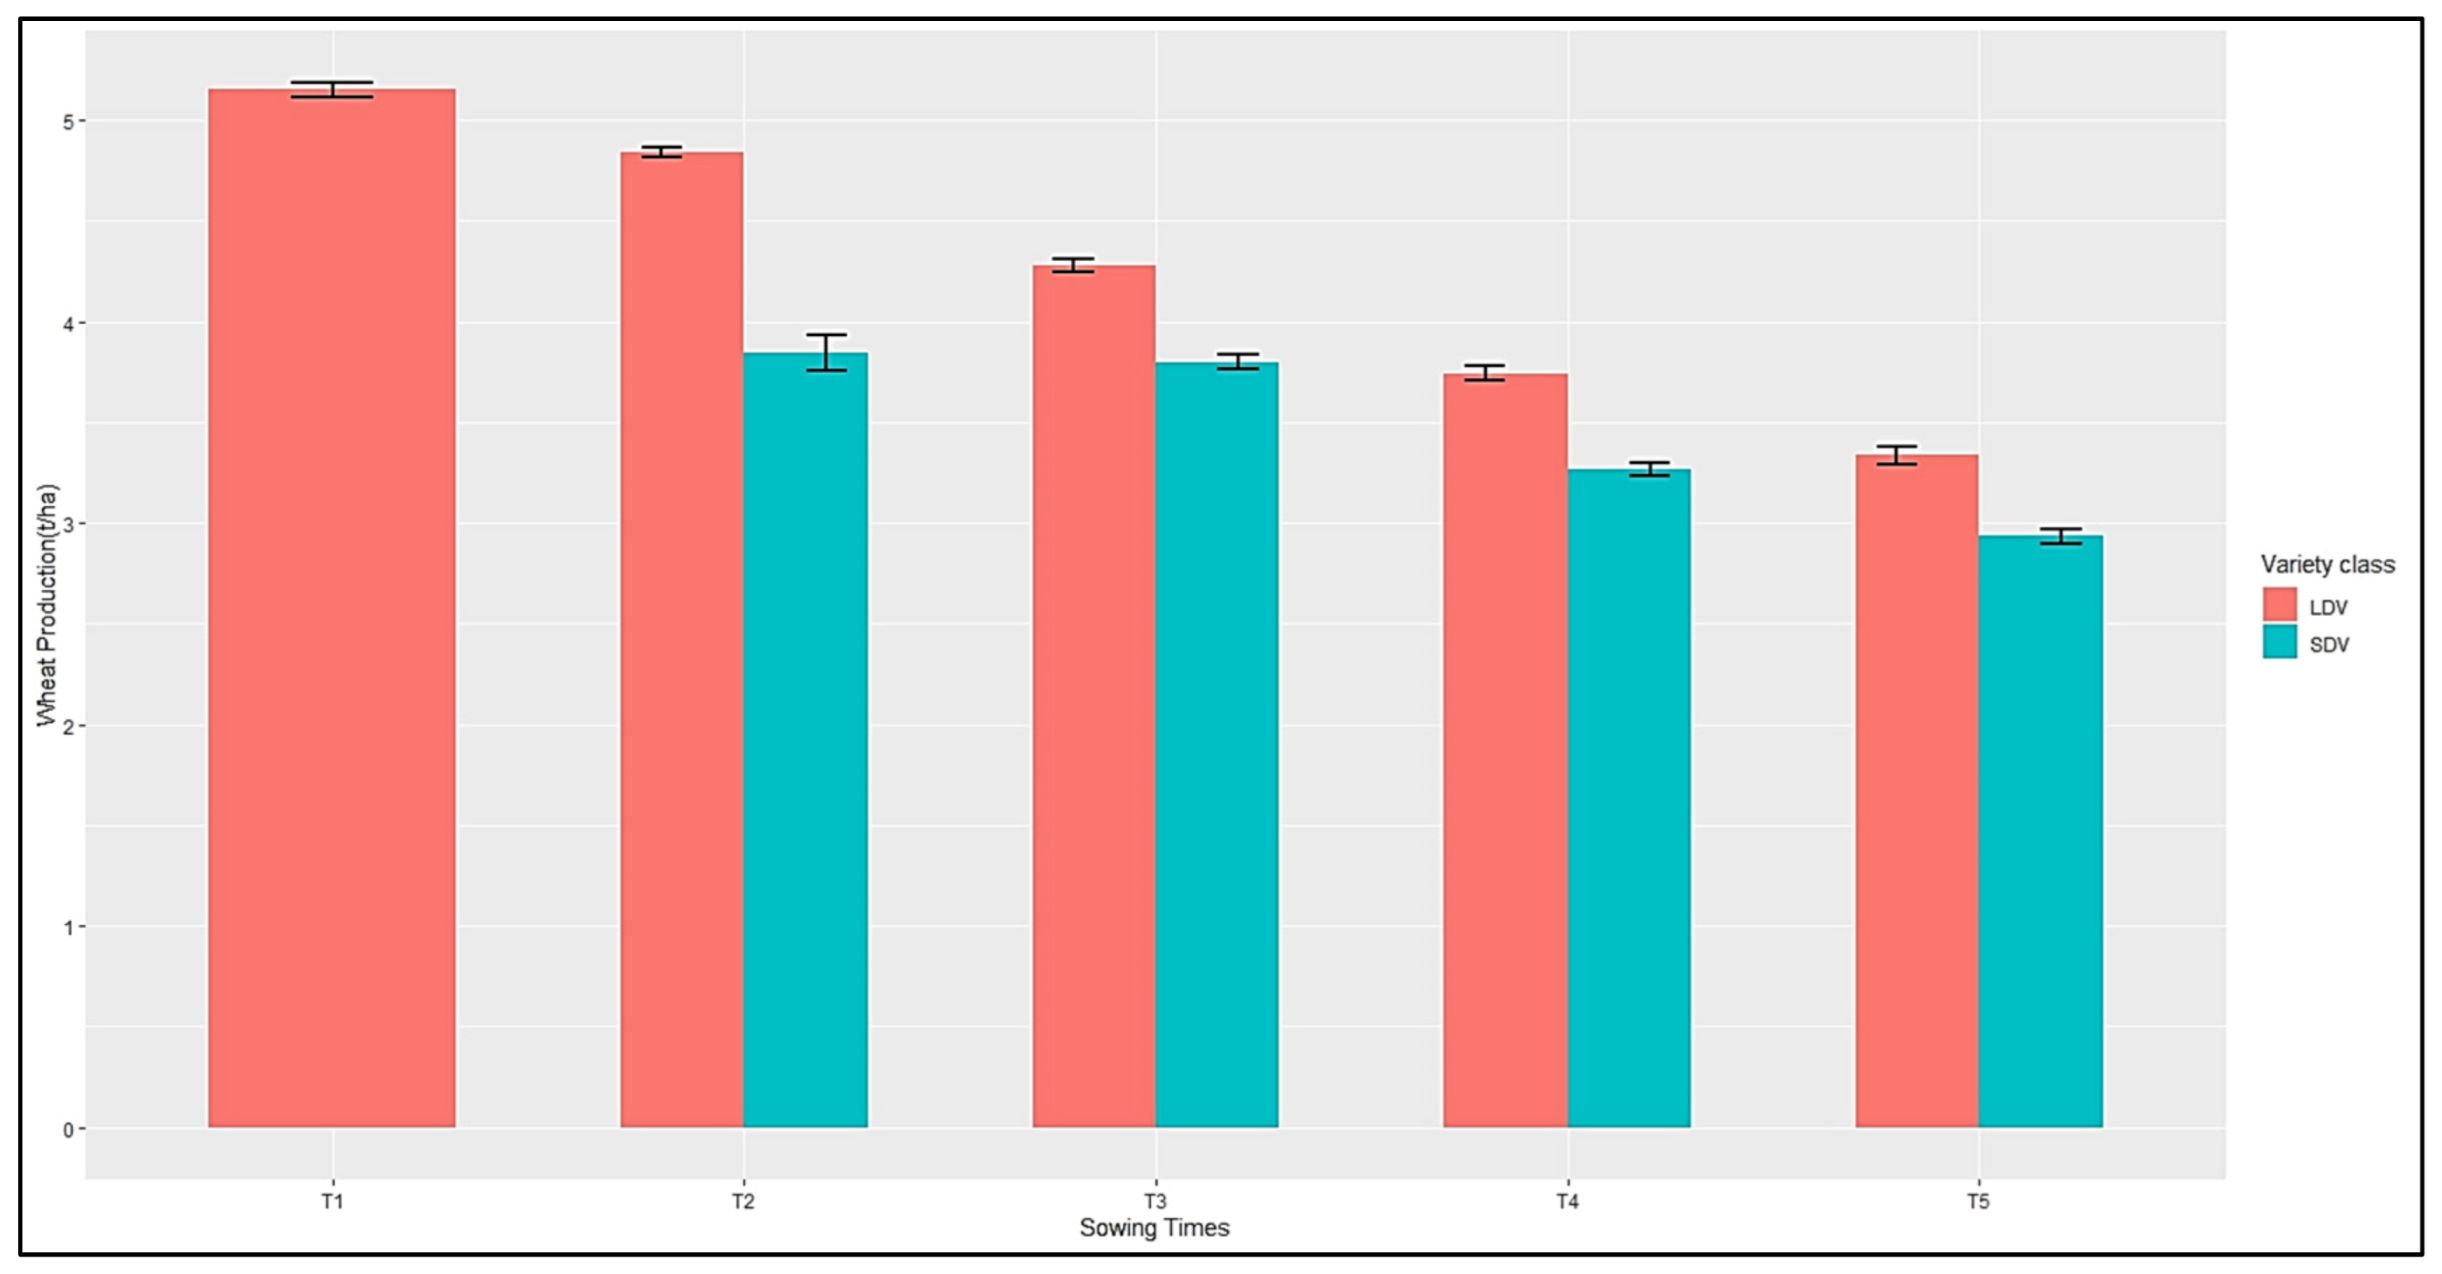
2.4. Grain Yield Comparison among Treatments
There was a continuous decline in grain yield as the sowing time progressed, starting from 1 November for both varietal classes. In the first two treatments (T1 and T2), the mean grain yields of the LDVs were close to 5 ton ha
−1—slightly more in T1 than T2. Yield losses were expected for the SDVs (N = 53) in T2, so pairwise varietal comparisons were limited to T3, T4, and T5. Contrary to farmers’ general perception of SDVs being suitable in late-sown scenarios, the LDVs outperformed the SDVs for all sowing date windows. In T3 and T4, the grain yields of the LDVs were approximately 0.5 ton ha
−1 higher, whereas in T5 they were 0.4 ton ha
−1 higher compared to the SDVs (
Figure 3).
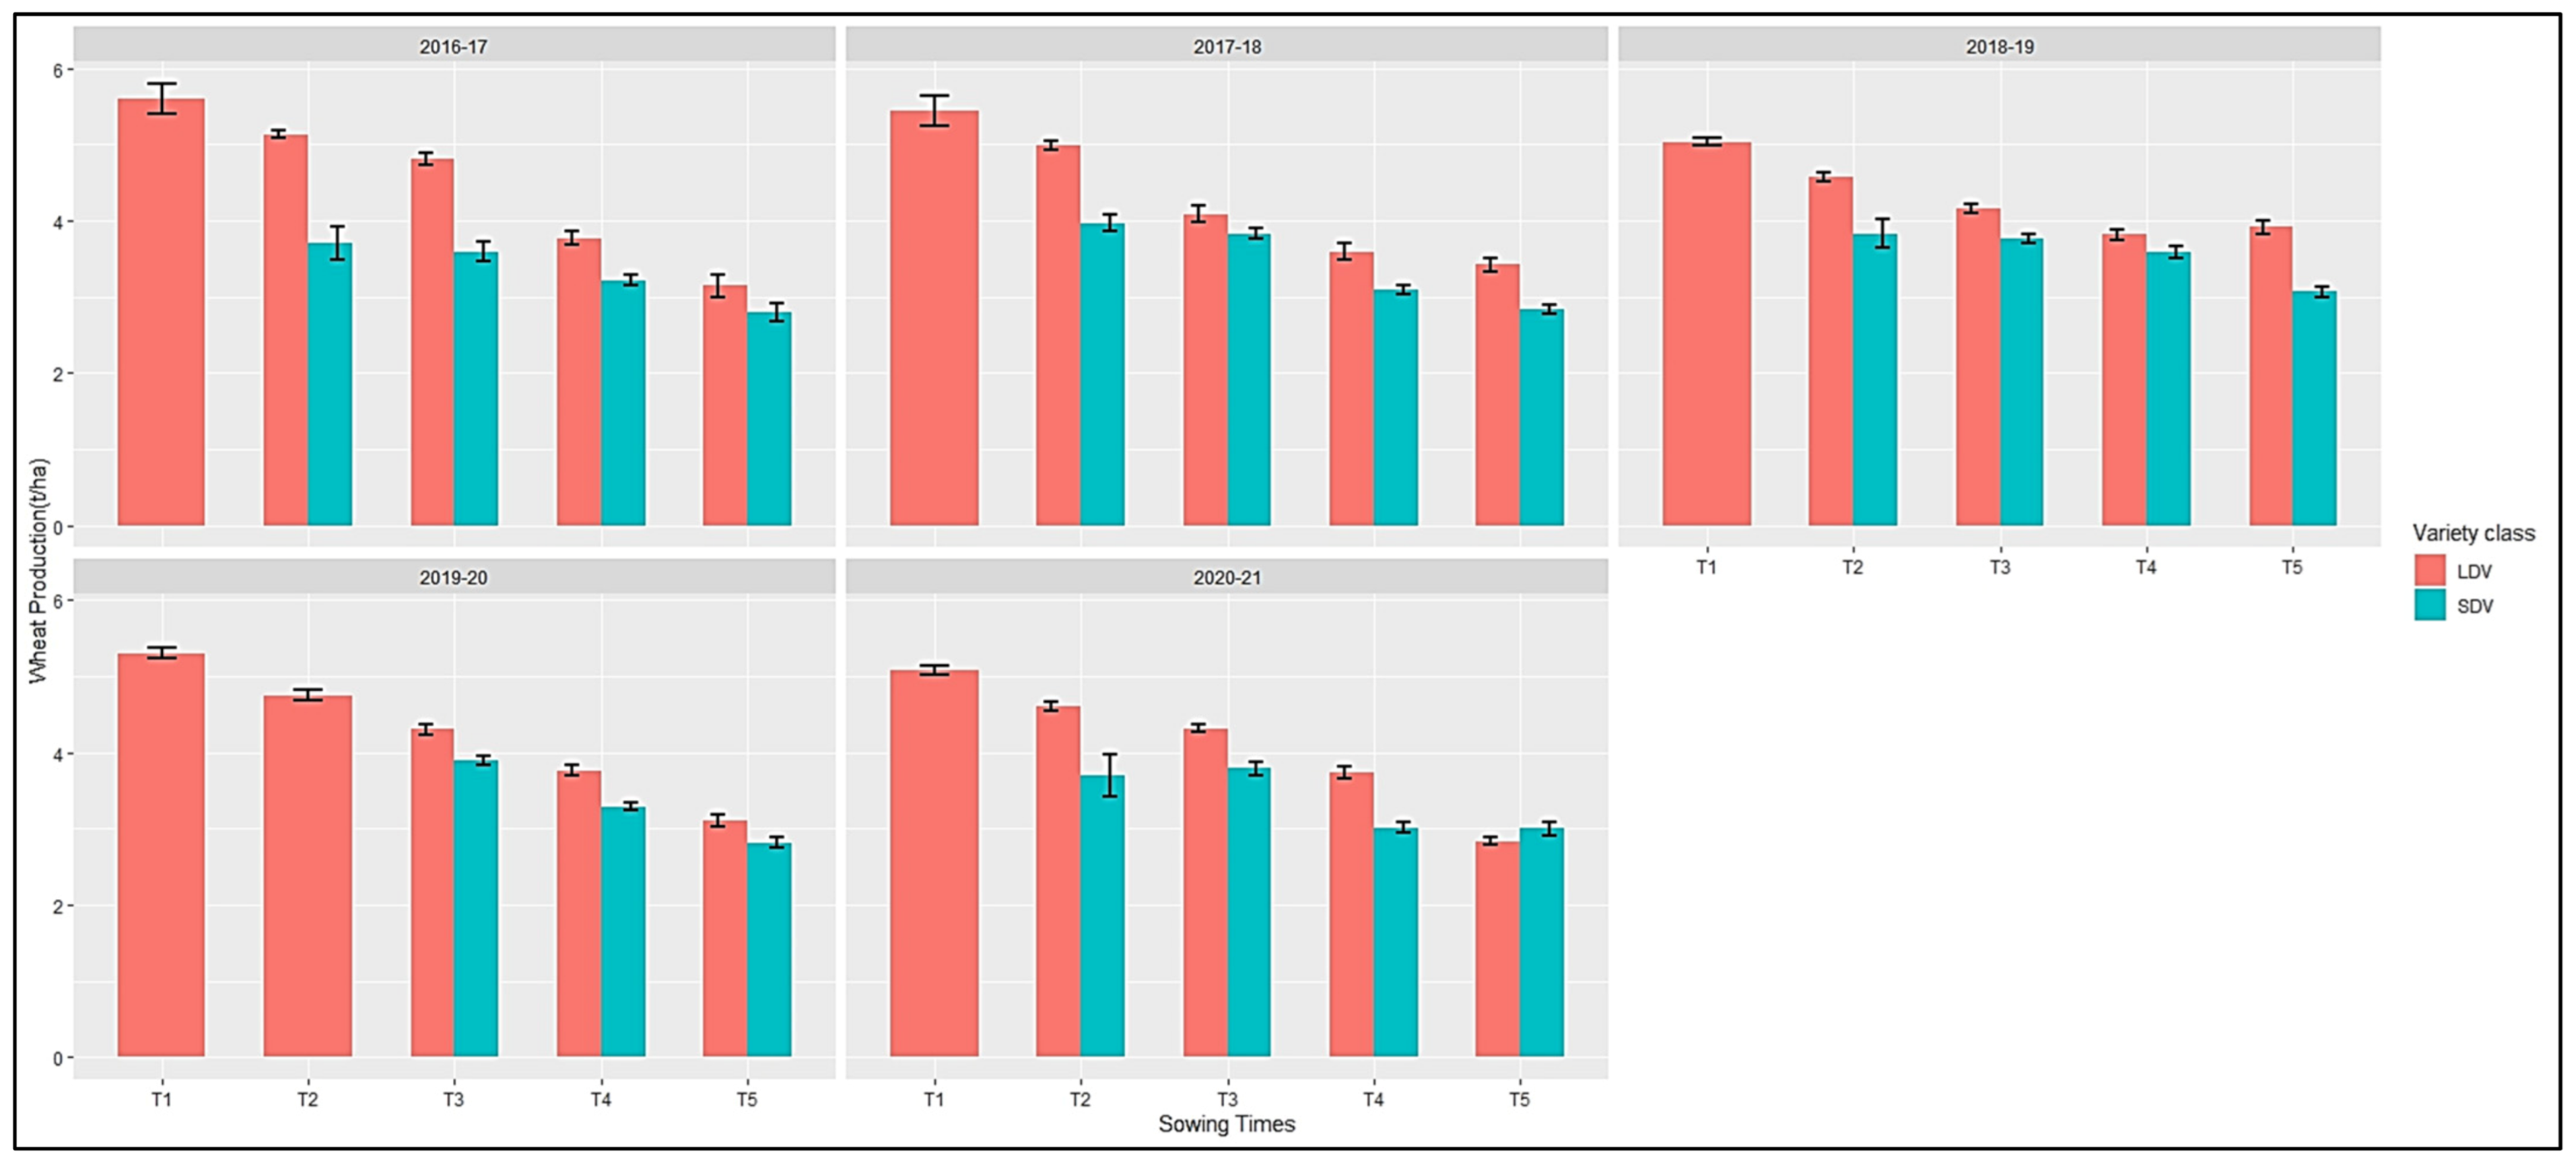
2.5. Comparison of Yields in Treatments for Each Year
Grain yield comparisons were individually investigated by year for all the years in which this trial was conducted in order to evaluate if aggregate trends deviate from annual trends among years. We observed similar results—grain yields of the LDVs decreased with later planting for all years, and the LDVs consistently outperformed the SDVs for all but one year (
Figure 4). During 2020–2021 under T5, the yields of both varietal groups showed no significant difference (
t-test
p-value of 0.1467). The mean yields of the LDVs (N = 74) and SDVs (N = 74) for T5 were 2.8 and 2.9 ton ha
−1, respectively.
Error bars in
Figure 3 and
Figure 4 represent the 95% confidence interval of the mean. Due to the experiment’s large sample size, error bars tended to be short in length, except for the SDVs in T2, which had a comparatively small sample size.
3. Methods
In the eastern Indo-Gangetic plain (IGP), wheat sowing is often delayed [
9]. It can be characterized for the low yields of this area and reason for a high proportion of farmers using SDVs as compared to the western IGP. The eastern IGP was targeted for this study in order to address the dearth of reliable evidence based on actual field conditions regarding the performance of short- and long-duration varieties, and to generate new insights for informing policy decisions aimed at closing yield gaps in the region. Target districts were selected in such a way that the trials capture all four agro-climatic zones of this region [
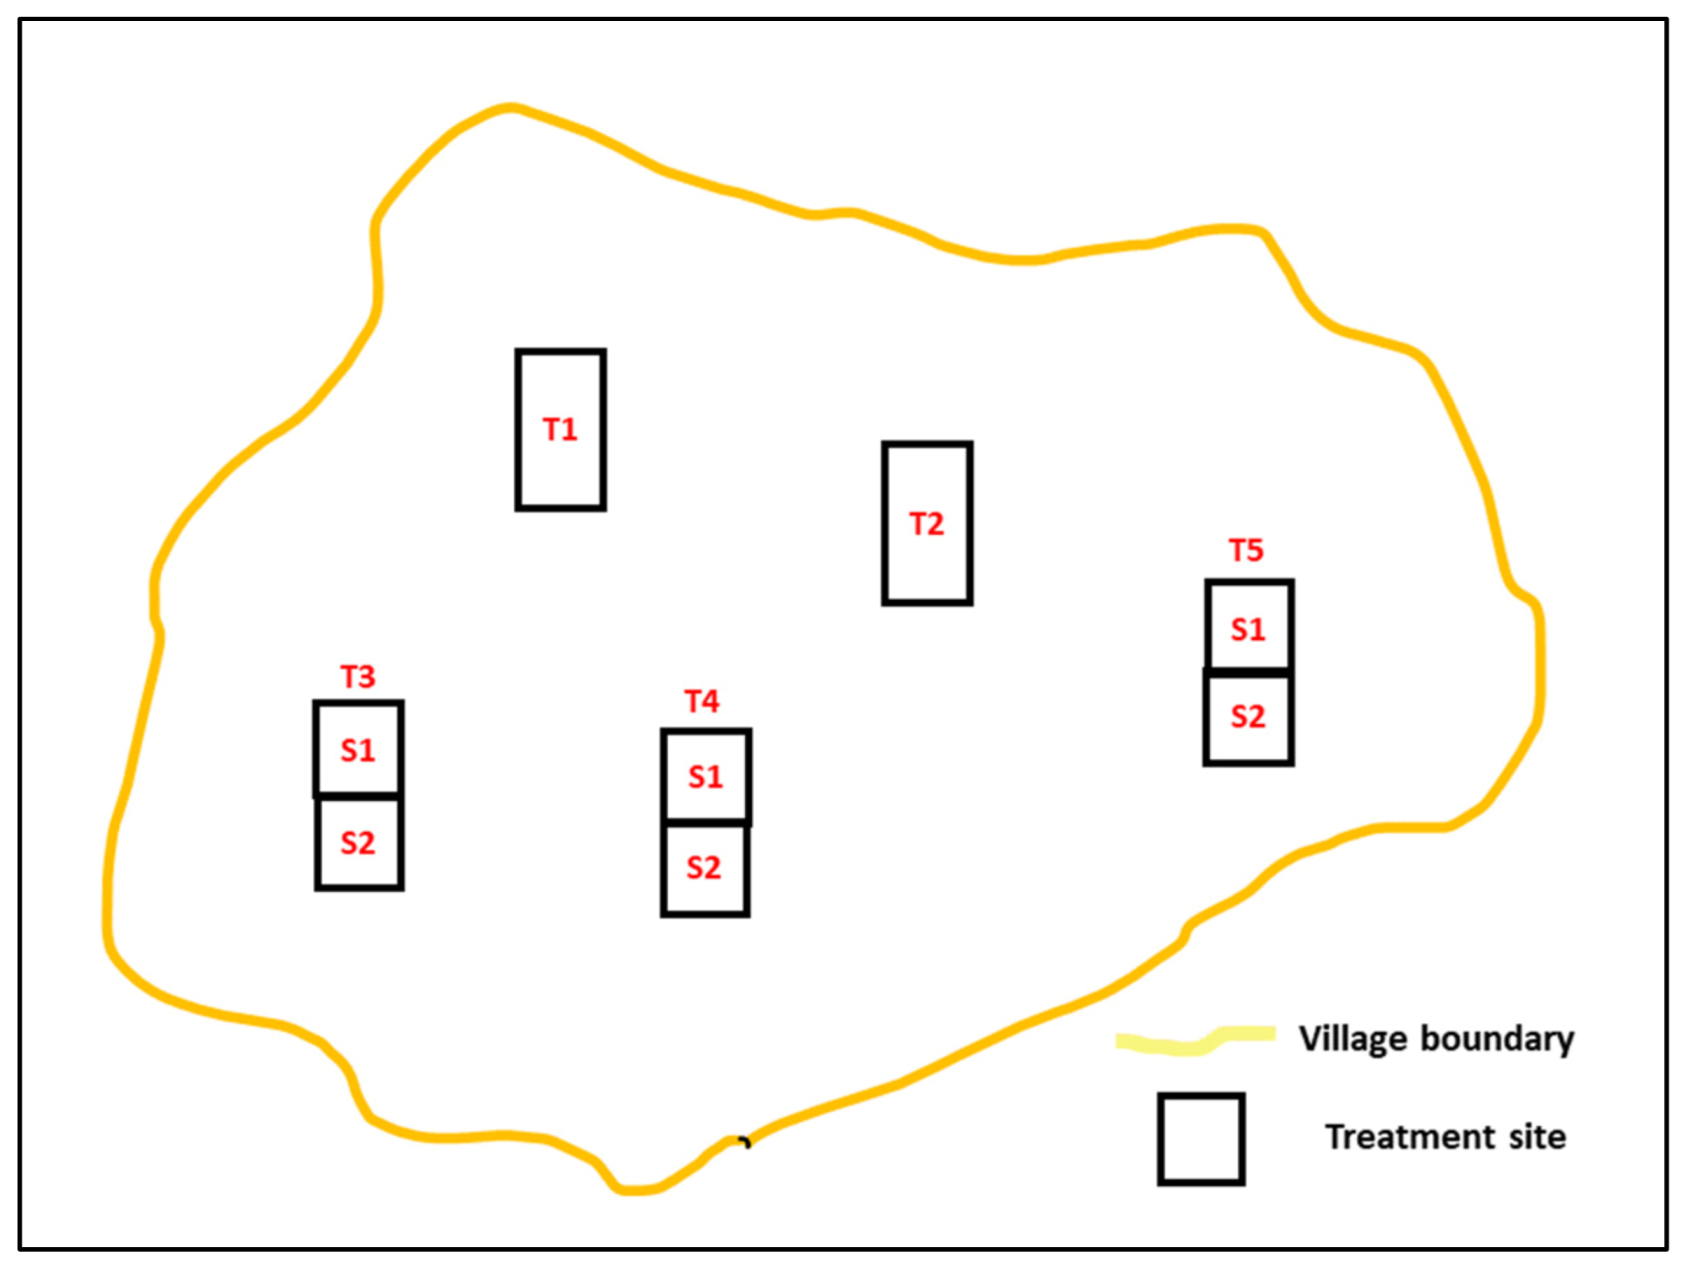
10] and reflect inconsistent wheat yields across these zones. Villages within a district were selected with the aim of maintaining sufficient spatial distance in order to represent typical district wise variation. For this study, sets of five treatments were applied at the village level on farmers’ plots (
Figure 5), with each roughly measuring 1 acre. Farmers’ plots for treatments were different, as it was practically infeasible to plant wheat at five different times on single farmer’s plot. Where possible, sub-plots (for LDVs and SDVs) were on the same field adhering to standard split-plot design [
11]. Treatment details are as follows:
T1 (sowing during 1–10 November)—only LDVs
T2 (sowing during 11–20 November)—mostly LDVs
T3 (sowing during 21–30 November)—LDVs and SDVs in sub-plots
T4 (sowing during 1–15 December)—LDVs and SDVs in sub-plots
T5 (sowing during 1–10 December)—LDVs and SDVs in sub-plots
In the data file, main-plot treatments are described by variable name ‘SowingSchedule’ (i.e., column ‘S’). Sub-plot treatments are in column ‘P’ of our data file, as described by variable name ‘VarietyClass’. Researchers can refer to these two variable columns (S and P) to run split-plot-related statistical analyses. Across five years of the experiment, the majority of the villages were selected repeatedly. However, within a particular year, there was largely a single set of main plots with limited replication within a village.
District-level project implementors (agriculture scientists) had set up the trials. All variables (except grain and biomass weights) were captured prior to crop harvest. Grain and biomass yields were recorded in kilograms from 2 m × 2 m areas at three spots in each treatments/sub-plots. Data were compiled for each district separately and then aggregated at the central level. Curation was done by the lead agronomist and an anonymized dataset was uploaded on organization’s Dataverse portal (
https://data.cimmyt.org/) on 2 January 2023 adhering to donor’s open data policy.
Grain and biomass yield recorded from three spots and measured in kilograms were converted into tons per hectare by the following formula in MS Excel:
where average of Grain/Biomass weight recorded in kilograms from three spots can also be divided by 1000 to convert the weight in tons and then the value can be multiplied by 2500 to calibrate the per hectare value. Alternatively, the above formula is the same but simpler.
Author Contributions
Conceptualization: A.J.M., P.C., S.S., V.K. and R.K.M.; methodology: A.J.M., V.K. and R.K.M.; investigation: R.K.M.; data curation: M.S.; writing—original draft preparation: A.A.; writing—review and editing: A.A.; visualization: S.P. (Subhajit Patra) and H.R.; supervision: A.P., S.P. (Shishpal Poonia), and S.R.S.; project administration: D.K.S., A.K., P.K. (Pankaj Kumar), M.I., M.S. and P.K. (Prabhat Kumar). All authors have read and agreed to the published version of the manuscript.
Funding
This research was funded by the Bill and Melinda Gates Foundation, grant number OPP1133205.
Institutional Review Board Statement
Not applicable.
Informed Consent Statement
Not applicable.
Data Availability Statement
Acknowledgments
We are grateful to the scientists of all 10 participating Krishi Vigyan Kendra (KVK) who extended their support in administering and monitoring the trial.
Conflicts of Interest
The authors declare no conflict of interest.
References
- Pal, D.K.; Bhattacharyya, T.; Srivastava, P.; Chandran, P.; Ray, S.K. Soils of the Indo-Gangetic Plains: Their historical perspective and management. Curr. Sci. 2009, 96, 1193–1202. [Google Scholar]
- Dubey, R.; Pathak, H.; Chakrabarti, B.; Singh, S.; Gupta, D.K.; Harit, R.C. Impact of terminal heat stress on wheat yield in India and options for adaptation. Agric. Syst. 2020, 181, 102826. [Google Scholar] [CrossRef]
- McDonald, A.J.; Keil, A.; Srivastava, A.; Craufurd, P.; Kishore, A.; Kumar, V.; Paudel, G.; Singh, S.; Singh, A.K.; Sohane, R.K.; et al. Time management governs climate resilience and productivity in the coupled rice–wheat cropping systems of eastern India. Nat. Food 2022, 3, 542–551. [Google Scholar] [CrossRef]
- Alam, M.P.; Kumar, S.; Ali, N.; Manjhi, R.P.; Kumari, N.; Lakra, R.K.; Izhar, T. Performance of wheat varieties under different sowing dates in Jharkhand. J. Wheat Res. 2013, 5, 61–64. [Google Scholar]
- Urfels, A.; McDonald, A.J.; van Halsema, G.; Struik, P.C.; Kumar, P.; Malik, R.K.; Poonia, S.P.; Singh, B.; Singh, D.K.; Singh, M.; et al. Social-ecological analysis of timely rice planting in Eastern India. Agron. Sustain. Dev. 2021, 41, 1–15. [Google Scholar] [CrossRef] [PubMed]
- Newport, D.; Lobell, D.B.; Srivastava, A.K.; Rao, P.; Umashaanker, M.; Malik, R.K.; McDonald, A.; Jain, M. Factors constraining timely sowing of wheat as an adaptation to climate change in Eastern India. Weather. Clim. Soc. 2020, 12, 515–528. [Google Scholar] [CrossRef]
- Singh, U.P.; Singh, Y.; Kumar, V.; Ladha, J.K. Evaluation and Promotion of Resource Conserving Tillage and Crop Establishment Techniques in Rice-Wheat System in Eastern India. In Integrated Crop and Resource Management in the Rice-Wheat System of South Asia; International Rice Research Institute (IRRI): Manila, Philippines, 2009; pp. 151–176. [Google Scholar]
- Dhillon, S.S.; Fischer, R.A. Date of sowing effects on grain yield and yield components of irrigated spring wheat cultivars and relationships with radiation and temperature in Ludhiana, India. Field Crops Res. 1944, 37, 169–184. [Google Scholar] [CrossRef]
- Lobell, D.B.; Ortiz-Monasterio, J.I.; Sibley, A.M.; Sohu, V.S. Satellite detection of earlier wheat sowing in India and implications for yield trends. Agric. Syst. 2013, 115, 137–143. [Google Scholar] [CrossRef]
- Singh, P.K.; Singh, K.K.; Singh, P.; Balasubramanian, R.; Baxla, A.K.; Kumar, B.; Gupta, A.; Rathore, L.S.; Kalra, N. Forecasting of wheat yield in various agro-climatic regions of Bihar by using CERES-Wheat model. J. Agrometeorol. 2017, 19, 346–349. [Google Scholar] [CrossRef]
- Altman, N.; Krzywinski, M. Split plot design: When some factors are harder to vary than others, a split plot design can be efficient. Nat. Methods 2015, 12, 165. [Google Scholar] [CrossRef] [PubMed]
| Disclaimer/Publisher’s Note: The statements, opinions and data contained in all publications are solely those of the individual author(s) and contributor(s) and not of MDPI and/or the editor(s). MDPI and/or the editor(s) disclaim responsibility for any injury to people or property resulting from any ideas, methods, instructions or products referred to in the content. |
© 2023 by the authors. Licensee MDPI, Basel, Switzerland. This article is an open access article distributed under the terms and conditions of the Creative Commons Attribution (CC BY) license (https://creativecommons.org/licenses/by/4.0/).


 ,
, 


