1. Introduction
In medicine and epidemiology, machine learning is used to predict health outcomes via population-based epidemiology survey data [
1]. The healthcare industry uses machine learning to improve disease diagnosis and medical precision [
2]. Successful machine learning used in these and many other fields suggests that machine learning can also provide useful insights in the body-imaging field. For example, the use of these approaches in the literature regarding various disorder cases (i.e., eating disorders) has increased [
3,
4], but results have varied in terms of whether they strengthen predictive power over common statistical analyses.
Predicting cancer tumors’ categories in their early stages remains essential to identifying the disease’s depth and available treatments. One of the most aggressive cancers, breast cancer, has very low median survival rates, at 29% [
5].
An accurate breast cancer prognosis can spare a significant number of patients from unnecessary treatment and related medical expenses.
Many studies regarding various cancer types show that early cancer detection facilitates a steady decline in death rates. According to the American Cancer Society, 1.9 million new cancer diagnoses and 609,360 cancer deaths are expected in the United States in 2022,
Table 1 [
6].
Machine learning is a powerful tool for understanding complex correlations between multiple variables and uncovering hidden insights. It enables us to develop a predictive model from a given dataset and to make predictions regarding future results. The primary concept associated with using machine learning is to identify data patterns with the aim of making accurate predictions regarding future data.
Machine learning algorithms have significantly improved automated recognition in various domains, such as image, video, speech, and text recognition. These approaches provide researchers better opportunities to construct complex, nonlinear models, and to use them to accurately predict future data samples unseen to the model [
7,
8].
It is known that X-ray images are taken in cases of advanced cancer stages. Previously used classification research regarding breast cancer prognosis was based on X-ray image processing, and treatment is more difficult in such cases compared with cases detected in earlier stages. This research’s purpose was early prediction through laboratories’ and medical examinations’ results.
Classical decision tree (DT), linear discriminant (LD), logistic regression (LR), support vector machine (SVM), and ensemble techniques (ET) algorithms were used in this study. Modern deep learning algorithms, specifically probabilistic neural network (PNN), deep neural network (DNN), and recurrent neural network (RNN) methods were used for comparison.
A decision tree is a supervised learning algorithm that includes a graphical representation of all possible solutions. A decision tree predicts the target variable based on information fetched through its feature variables. DTs measure a probable distribution of conformity where a certain class belongs. The procedure is referred to as recursive partitioning using a source set split into subsets with repetition [
9].
The Fisher linear discriminant (FLD) is an algorithm used for dimension reduction and classification [
10]. Most researchers use FLD to address dimension reduction or classification problems. The FLD’s primary aim is to search for a transformation matrix that allows for the mapping of the original dataset to a space with a low dimension while maximizing the separability between classes [
7,
11,
12].
Many regression techniques were proposed. The importance of logistic regression, despite its simplicity, is well known, and one of its advantages is the ease of interpreting its results [
13]. To minimize the residual sum of squares between the observed targets in the dataset and the targets, LR fits a linear model with coefficients using prediction via linear approximation [
14].
Support vector machines, developed by Vapnik and others [
14], have been used for many machine learning tasks, such as pattern recognition and object classifications. The basic SVMs concept is to map input vectors into a high-dimensional feature space in which they become linearly separable. This mapping from the input vector space to the feature space is nonlinear mapping achieved using kernel functions. Depending on the application, different types of kernel functions can be used. A common choice for classification problems is the Gaussian kernel, which is based on structural risk minimization. SVM algorithms have shown superior performance when used for small training examples, as they avoid the problem of overfitting.
Ensemble methods are learning algorithms that construct a set of classifiers by taking a (weighted) vote of their predictions and then classifying new data points. Bayesian averaging is the original ensemble method; more recent algorithms include error-correcting output coding, bagging, and boosting [
15].
Recently, there has been much interest in “ensemble learning” methods that generate many classifiers and aggregate their results. Two well-known methods are boosting and bagging classification trees [
16,
17].
A probabilistic neural network is a data classifier that has been widely used in several scientific fields. The PNN method, introduced by D. Specht in 1988 [
18], is a “feed forward neural network, which is widely used in classification and pattern recognition problems”. In the PNN algorithm, the parent probability distribution function (PDF) of each class is approximated using a Parzen window and a nonparametric function [
19].
A neural network was first proposed in the 1950s in the form of single-layer perception. A second-generation neural network, i.e., a shallow neural network (SNN) or multilayers perception, is trained using a standard back-propagation (BP) algorithm.
The possibility of training a deep neural network (DNN) with many hidden layers, similar to the human neural system, has been explored by many researchers [
20,
21]. A neural network’s success is limited to an SNN of one or two hidden layers, because training a DNN is not easy. The resulting DNN accuracy is usually worse than that of an SNN [
22]. Difficulties training a DNN originate in vanishing gradients with the increment in the hidden layer number, i.e., the depth of the network and poor local minimums traps [
20,
21,
22,
23,
24].
The deep belief network (DBN) was invented as a solution for problems encountered by traditional neural networks training in deep-layered networks [
22]. It is a type of DNN, a generative model composed of stacked layers of restricted Boltzmann machines (RBMs), which can be used to solve unsupervised learning problems.
In unsupervised learning problems, the dimensionality of features is reduced and can be used to solve supervised learning tasks to build classification or regression models. There are two DBN training steps: a layer-by-layer training, which refers to each RBM’s unsupervised training, and fine tuning, which refers to using error back-propagation algorithms to fine tune DBN parameters after the unsupervised training is finished [
25].
Recurrent neural networks preserve the layer’s output by feeding the output back to the input to predict the layer’s results. Although engineers use the term “feedback”, in neuroscience, this is known as recurrence; the neural network field has adopted the latter term. The first network layer is formed similar to a feed-forward neural network (FNN). An FNN is the simplest neural network form; it uses the product-of-sum of the weights, in which the input is conveyed in one direction.
Recurrent connections can be an input from a node to itself or an input from a higher-level node back to a lower one; either type of input creates a feedback loop. Such systems have many challenges. As analyzing the behavior of systems with feedback is more complex, stability theorems have been developed, particularly for use in real-time applications. Equally significant are the increased demands of training such systems. An RNN starts with the front propagation and observes the information required for future use. If the prediction is wrong, it estimates the error rate to alter the network in order to provide the correct prediction in the back propagation [
26].
Inspired by the successful application of the deep learning method and the significant contribution of employing multidimensional data for cancer prediction, this study compared classical machine learning algorithms and deep learning algorithms to assess their classification accuracy in predicting breast cancer. Some feature selection algorithms were used to study their effect on accuracy.
The next section presents related work that attempted to analyze breast cancer databases.
Section 3 introduces the methodology used. The results are discussed in
Section 4. Finally, suggestions for future work are recommended.
2. Literature Review
Recently, machine learning techniques have provided tools for the detection and classification of breast cancer [
2,
3,
4,
5,
6,
7]. This section reviews and presents the literature related to breast cancer detection using machine learning techniques. A statistical distribution of ML and DL articles is presented in [
27], showing an increased use of ML and DL techniques in breast cancer detection after 2016.
From 2007 to 2022, cancer early diagnosis research, using both conventional and DL methods, was distributed as shown in
Figure 1. The commonly used modalities of these works were screen film mammography (SFM), full-field digital mammography (FFDM), digital breast tomosynthesis (DBT), 3D mammography, ultrasound (US), magnetic resource imaging (MRI), and histopathology (HP) images, which are all image processing techniques.
To accurately predict the prognosis of breast cancer, Sun et al. (2018) [
28] proposed a multimodal deep neural network by integrating multidimensional data (MDNNMD); they incorporated multidimensional data including gene expression profiles, CNA, and clinical breast cancer data. Although the results are promising, the method is unusable for research where multiple omics data are unavailable or incomplete.
It is difficult and expensive to obtain a large amount of complete clinical data. The dataset is limited to only 1980 available valid samples in METABRIC and 1054 available valid samples in TCGA-BRCA, which are relatively small and may limit further analysis.
Lianlian Wu et al. (2019) used a deep neural network to identify the DCNN and identified a method to detect early gastric cancer (EGC) from a nonmalignancy without blind spots during esophagogastroduodenoscopy (EGD) with a 92.5% accuracy, 94.0% sensitivity, 91.0% specificity, 91.3% positive predictive value, and 93.8%, negative predictive value, outperforming all endoscopists’ values [
29].
Although researchers achieved these significant results by applying DNN, notably, the research is in the image processing category.
Patrizia et al. (2019) [
30] proposed a breast cancer prognosis based on multiple kernel learning (MKL). Their model combined a support vector machine (SVM) algorithm and random optimization (RO) based on digital EHR data with an 86% accuracy.
Based on computational intelligence, Zeid et al. (2022) [
31] proposed optimized machine learning algorithms using grid search. The classifiers used were k-NN, RF, LR, DT, extreme gradient boost (XGboost), naive Bayes (NB), and a multilayer perceptron (MLP). The authors concluded that KNN was the worst machine learning classifier, owing to the fundamental concept of classification via Euclidian distance. The best accuracy was 78.6%, which was achieved using an MLP classifier detecting breast cancer using the Wisconsin Prognosis Breast Cancer dataset (WPBC) released in 1970.
Yue et al. [
32] mainly demonstrated comprehensive reviews on SVM, K-NNs, ANNs, and decision tree techniques in the application of predicting breast cancer with the benchmark Wisconsin Breast Cancer Diagnosis (WBCD) dataset. According to the authors, the deep belief networks (DBNs) approach with ANN architecture (DBNs-ANNs) has given more accurate results. This architecture obtained a 99.68% accuracy, whereas for the SVM method, the two-step clustering algorithm alongside the SVM technique achieved a 99.10% classification accuracy. They also reviewed the ensemble technique where SVM, Naive Bayes, and J48 were implemented using the voting technique. The ensemble method acquired a 97.13% accuracy.
In 2004, two ML classification methods, decision tree (DT) and Artificial Neural Network (ANN), were compared with a statistical method, linear regression, to predict breast cancer survival using a large dataset which had more than 200,000 cases. The study showed that for real-world usage, ML algorithms could be highly possible classification methods. The outcomes revealed that DT was the best classifier with a precision of 93.6%, ANN attained a 91.2% accuracy, and both were superior to linear regression, which only reached an 89.2% accuracy. In addition, an evaluation of current studies tells that almost all the ML algorithms employed in breast cancer analysis and prediction are supervised [
33].
Azar et al. [
34] introduced a method for the prediction of breast cancer using the variants of decision tree. The modalities used in this technique are the single decision tree (SDT), boosted decision tree (BDT), and decision tree forest (DTF). The decision is taken by training the dataset and after that testing. The outcomes presented that the accuracy obtained by the SDT and BDT was 97.07% and 98.83%, respectively, in the training phase, which clarifies that the BDT performed better than the SDT. The decision tree forest obtained an accuracy of 97.51%, whereas the SDT obtained a 95.75% accuracy in the testing phase.
Vikas Chaurasia and Saurabh Pal [
35] compared the performance criterion of supervised learning classifiers such as Naïve Bayes, SVM-RBF kernel, RBF neural networks, decision trees (J48), and simple CART to find the best classifier using breast cancer datasets. The experimental results showed that the SVM-RBF kernel was more accurate than other classifiers; it scored an accuracy of 96.84% with the Wisconsin Breast Cancer (original) datasets.
Djebbari et al. [
36] considered the effect of the ensemble of machine learning techniques to predict survival time with breast cancer. Their technique showed better accuracy with their breast cancer dataset compared with previous results.
S. Aruna and L.V Nandakishore [
37] compared the performance of C4.5, Naïve Bayes, Support Vector Machine (SVM), and K- Nearest Neighbor (K-NN) to find the best classifier in WBC. The SVM proved to be the most accurate classifier with an accuracy of 96.99%. Angeline Christobel. Y and Dr. Sivaprakasam achieved an accuracy of 69.23% using a decision tree classifier (CART) with breast cancer datasets.
Ojha. U [
38] emphasized the selection parameters for predicting the probability of the recurrence of breast cancer by using data mining techniques. The manuscript depicted the deployment of clustering and classification algorithms, and the author said that classification algorithms worked better than clustering for the experimental dataset. The clustering algorithms used were K-Means, EM, PAM, Fuzzy c-mean, and mean while the classification algorithms were C 5.0, KNN, Naïve Bayes, SVM, and mean.
Maldonado, Weber, and Basak [
39] introduced an embedded method that simultaneously selects relevant features during classifier construction by penalizing each feature used in the dual formulation of support vector machines (SVM). Their approach is called kernel-penalized SVM (KP-SVM) and they achieved an accuracy of 97.55% with 15 selected features using the WDBC dataset.
3. Materials and Methods
3.1. Dataset
Most machine learning techniques used in cancer prediction are based on older datasets because of availability problems or privacy issues, and most studies using deep learning methods focus primarily on image processing. All previous studies used limited and old Wisconsin breast cancer datasets.
The dataset used in this research was obtained from
https://seer.cancer.gov (accessed on 11 June 2022) [
39]. The dataset was collected from 1979 to 2018 and includes 1,700,000 records of different cancer types, with 210 columns (features). The scope of this study was breast cancer.
Data cleaning ensured that features specifically related to breast cancer were selected and that records missing data were removed. Thus, the dataset was filtered to contain only breast cancer cases with complete feature data; this limited the dataset to 70,079 records. A total of 107 features related only to breast cancer were considered, including the binary class (malignant/benign). The relevant data were then encoded as suitable numerical values in preparation for use in feature extraction algorithms. The dataset was converted to a comma separated values (csv) file to prepare the data for classification.
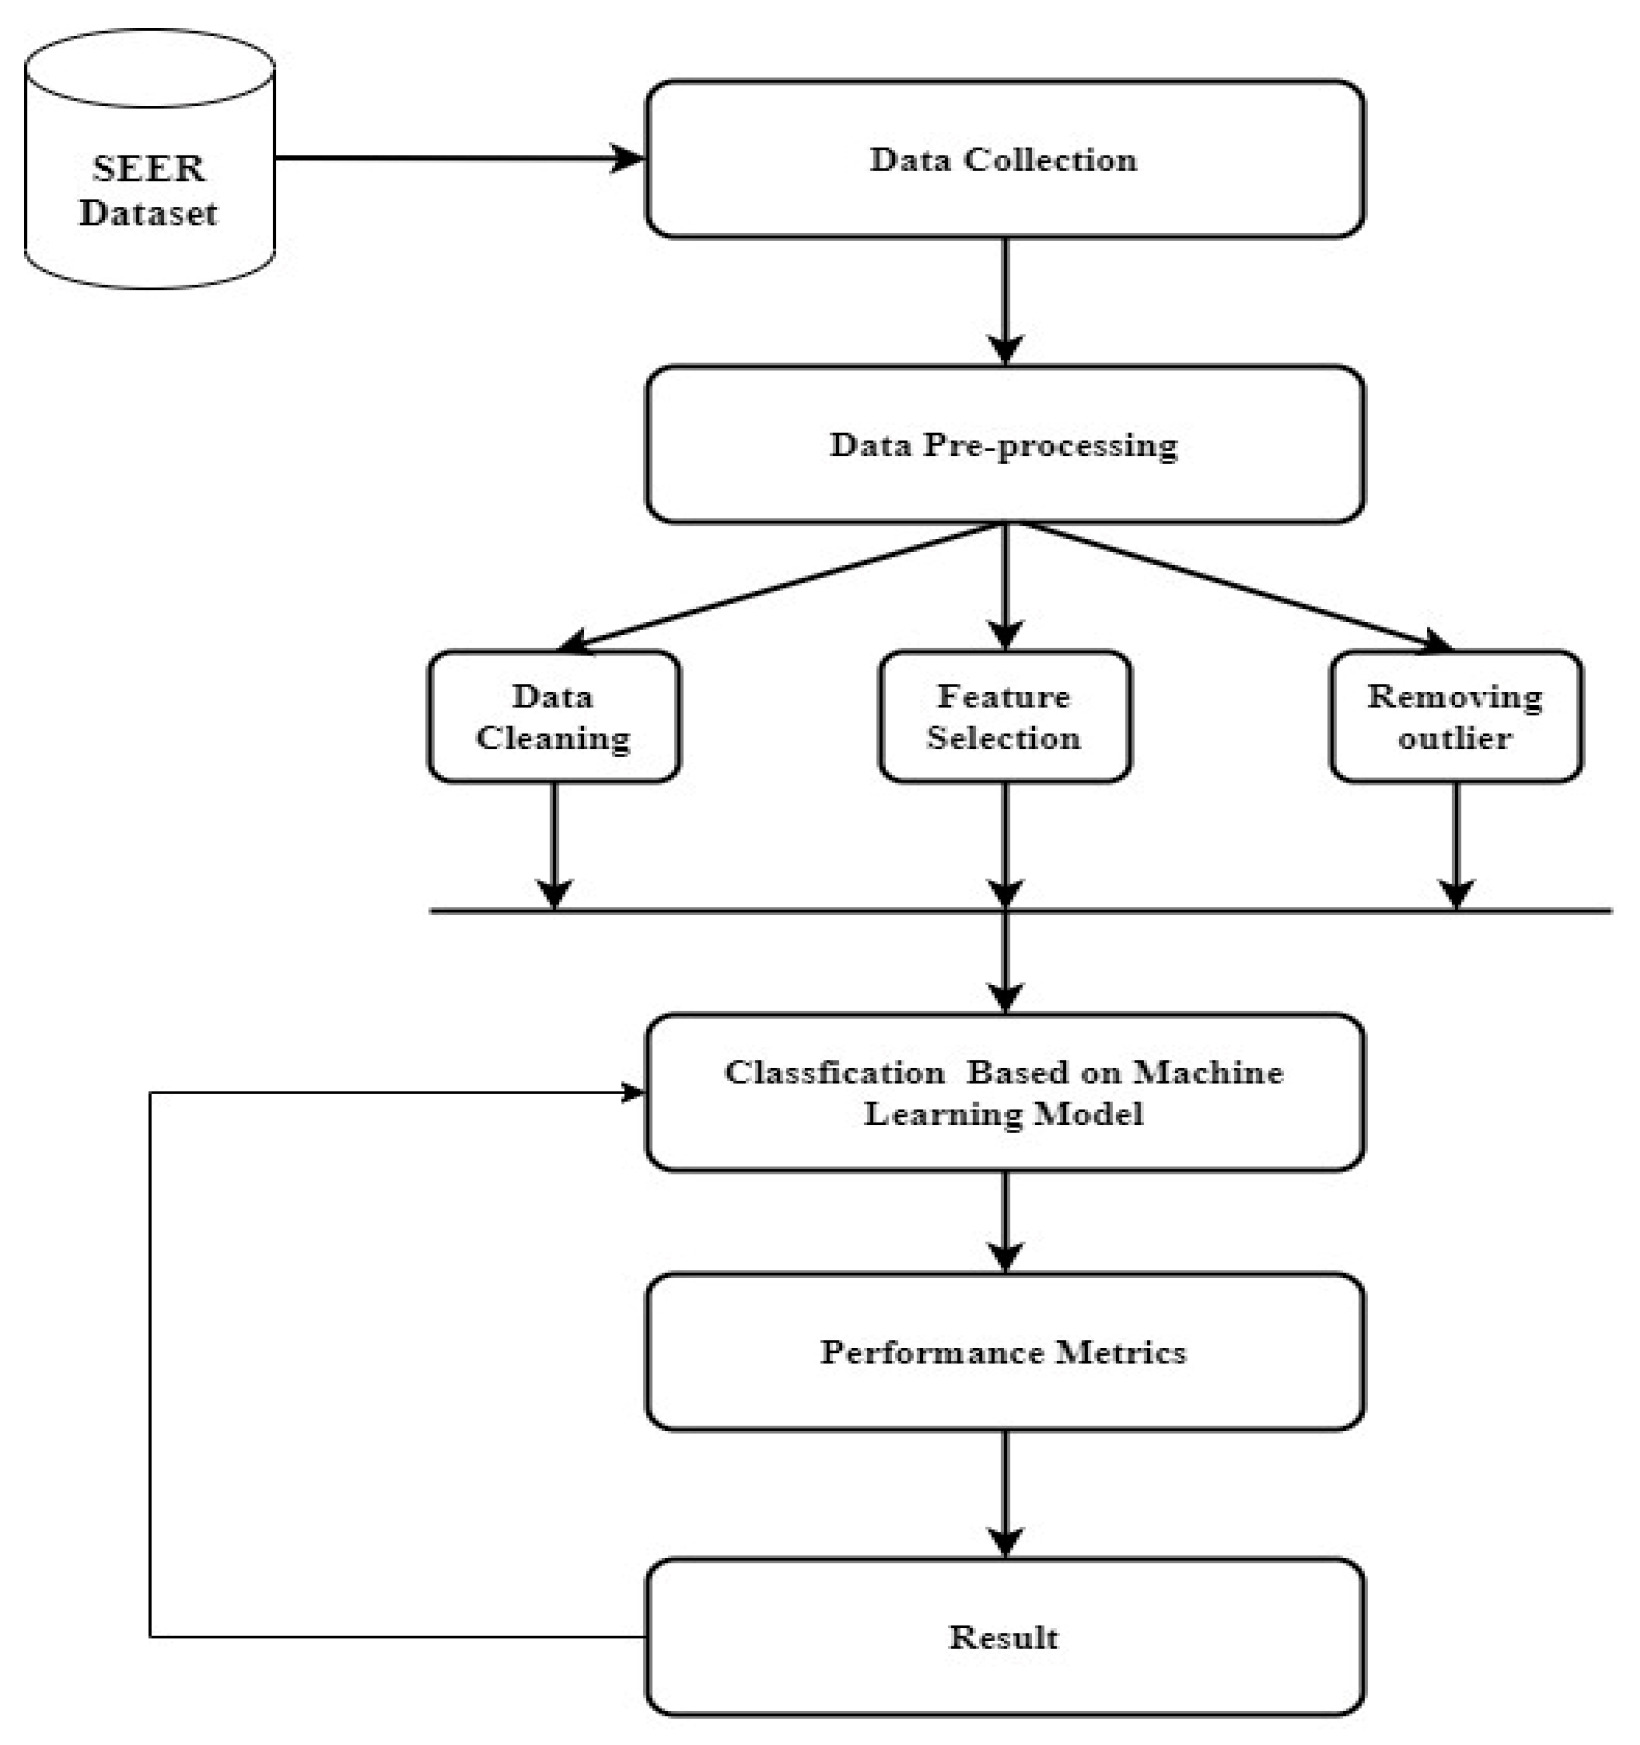
3.2. Model Structure
The data preprocessing phase included data cleaning, feature selection, and removing outliers. The identified features passed through evolving stages, which included the learning algorithm, and were processed according to a learning strategy. During data cleaning, the records were limited to breast cancer cases, features related to breast cancer were selected, and empty columns were removed. The string data were text content that had been encoded into numerical values.
Classical machine learning and deep learning models were used to classify the dataset records into malignant or benign.
This study used classical decision tree (DT), linear discriminant (LD), logistic regression (LR), support vector machine (SVM), and ensemble method (EM) algorithms. Modern deep learning (DL) probabilistic neural, deep neural, and recurrent neural network algorithms were used for comparison. The applied structure was implemented as shown in
Figure 1.
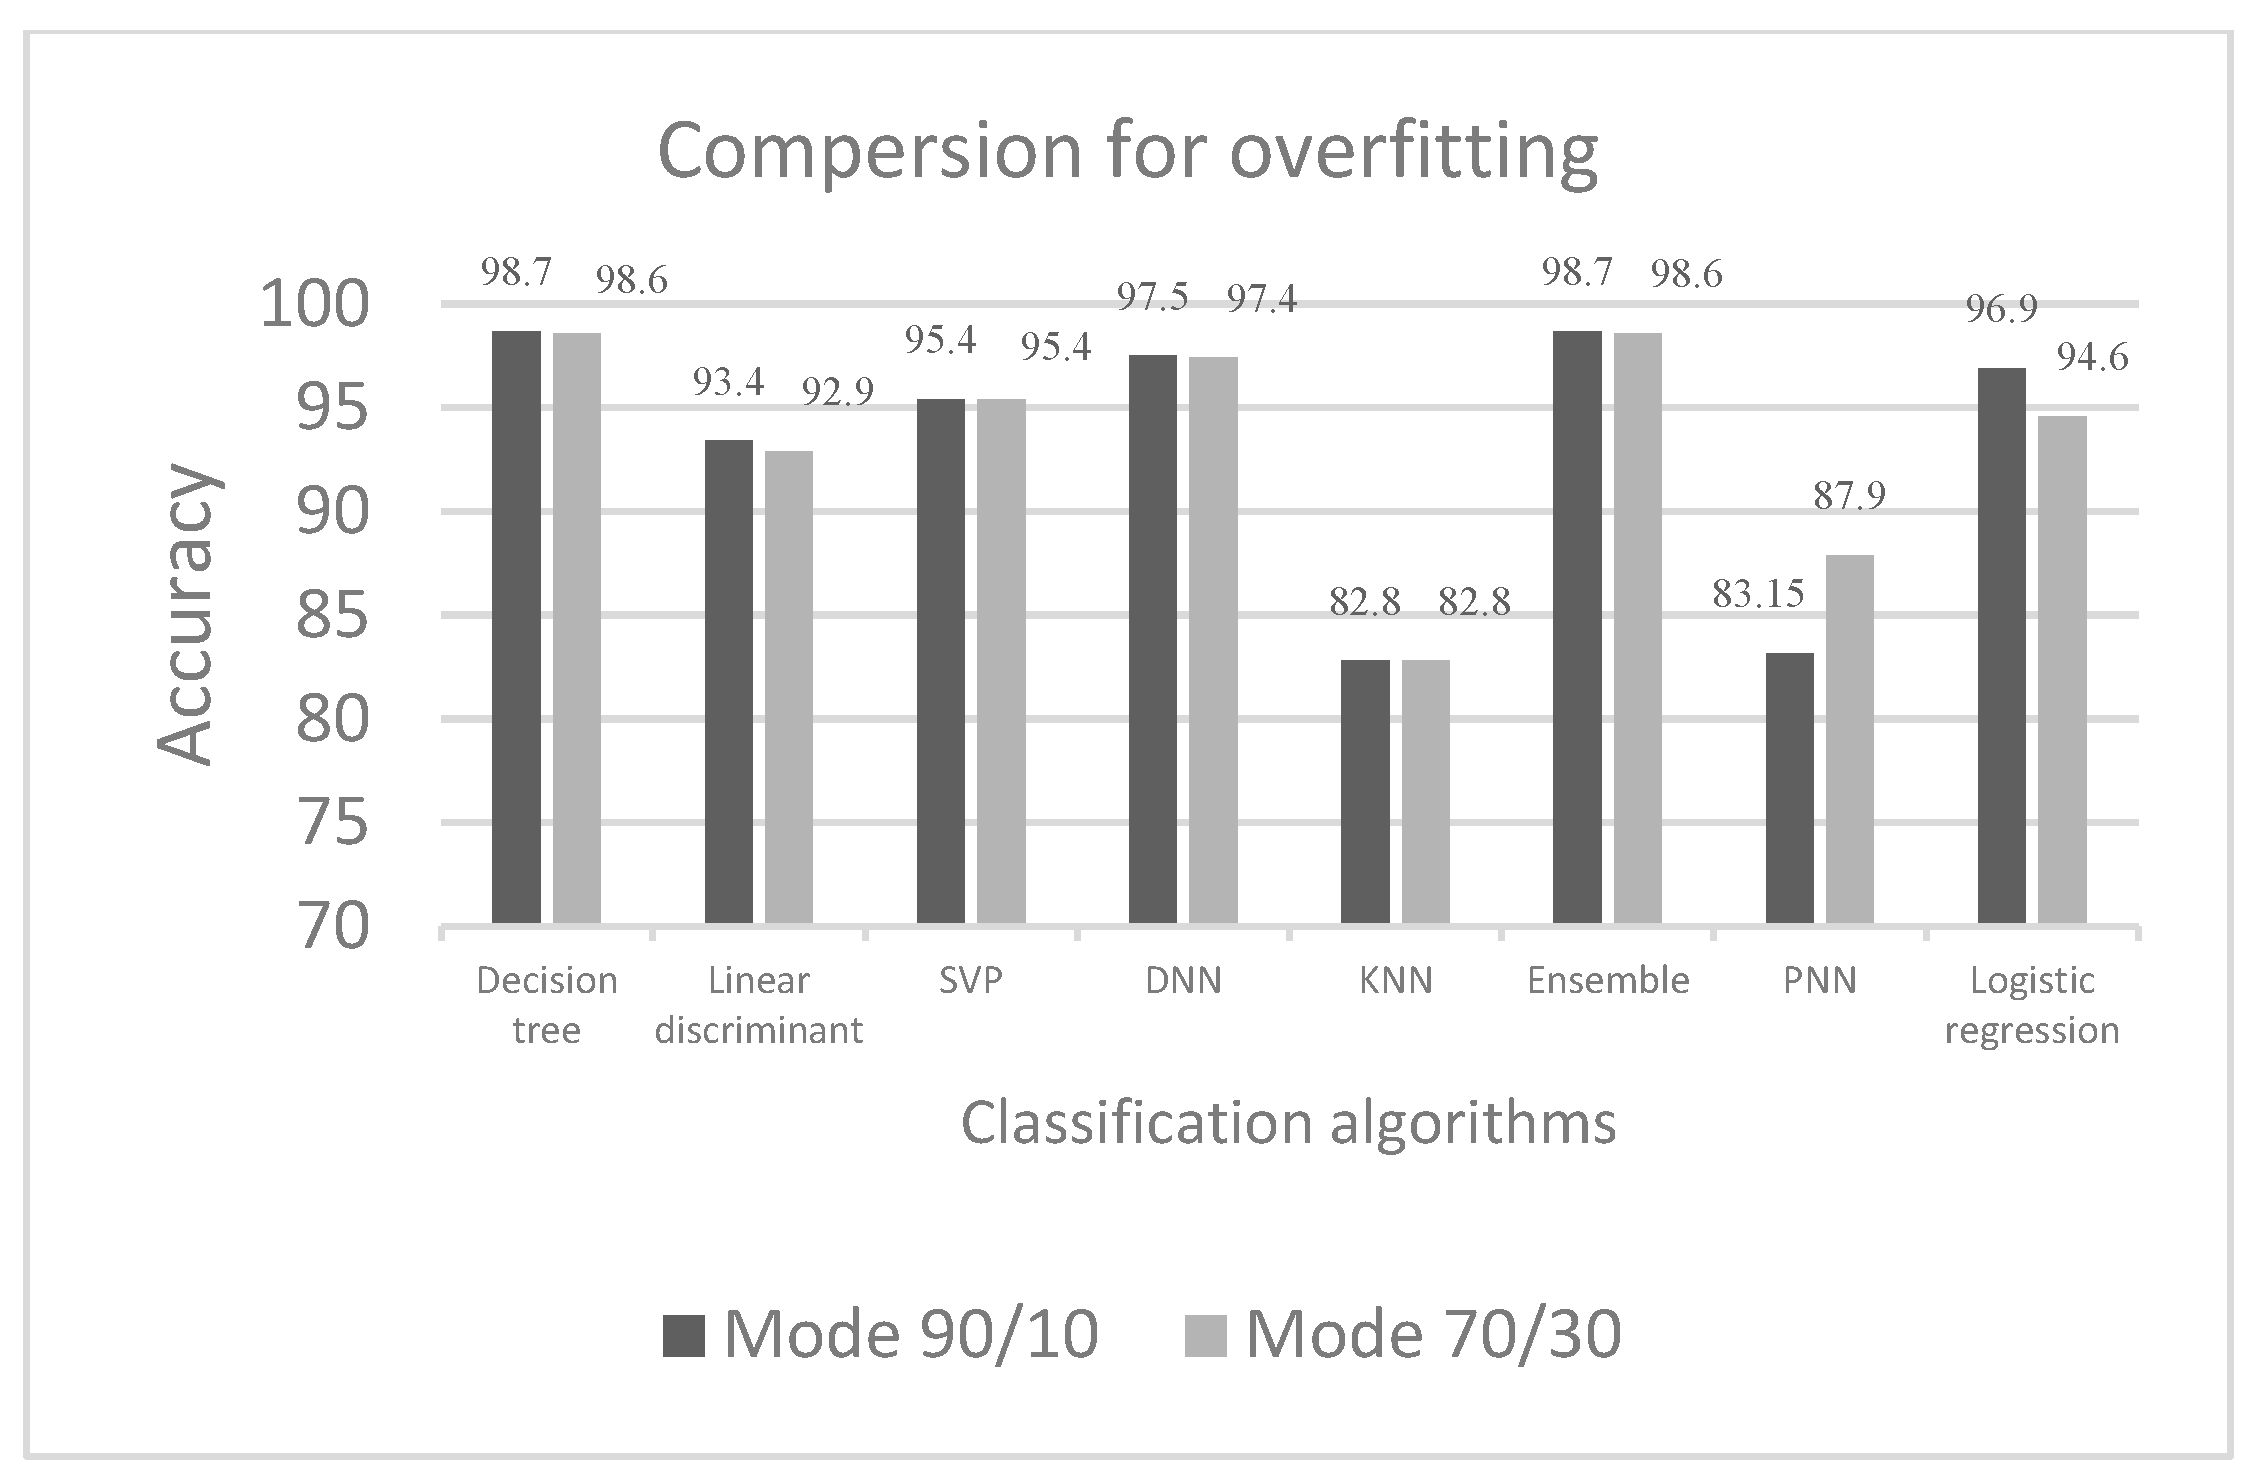
To test the data distribution and overfitting, and to ensure that the data were not biased, the data were split as follows:
Randomly, into 70% of data for training and 30% for testing;
Randomly, into 90% of data for training and 10% for testing;
The predictive accuracies of the fitted models were examined using a validation method. The validation estimated the models’ performances using new data compared to training data and protected them against overfitting. A cross-validation scheme was selected. The data were partitioned into k disjoint sets or folds and the number of cross-validation folds were 30 and 10. Each validation fold trained a model using training-fold observations and assessed model performance using validation-fold data. Next, the average validation errors over all folds were calculated before training any models, which enabled a comparison of all models using the same validation scheme.
3.3. Experimental Analysis and Results
An experimental analysis was carried out using an Intel i7 GPU Processor with 32 GB RAM, Math Works MATLAB, a Microsoft SQL Server, and Python v. 3.10 (Python Software Foundation, Wilmington, Delaware, United States) on Microsoft Windows 10.
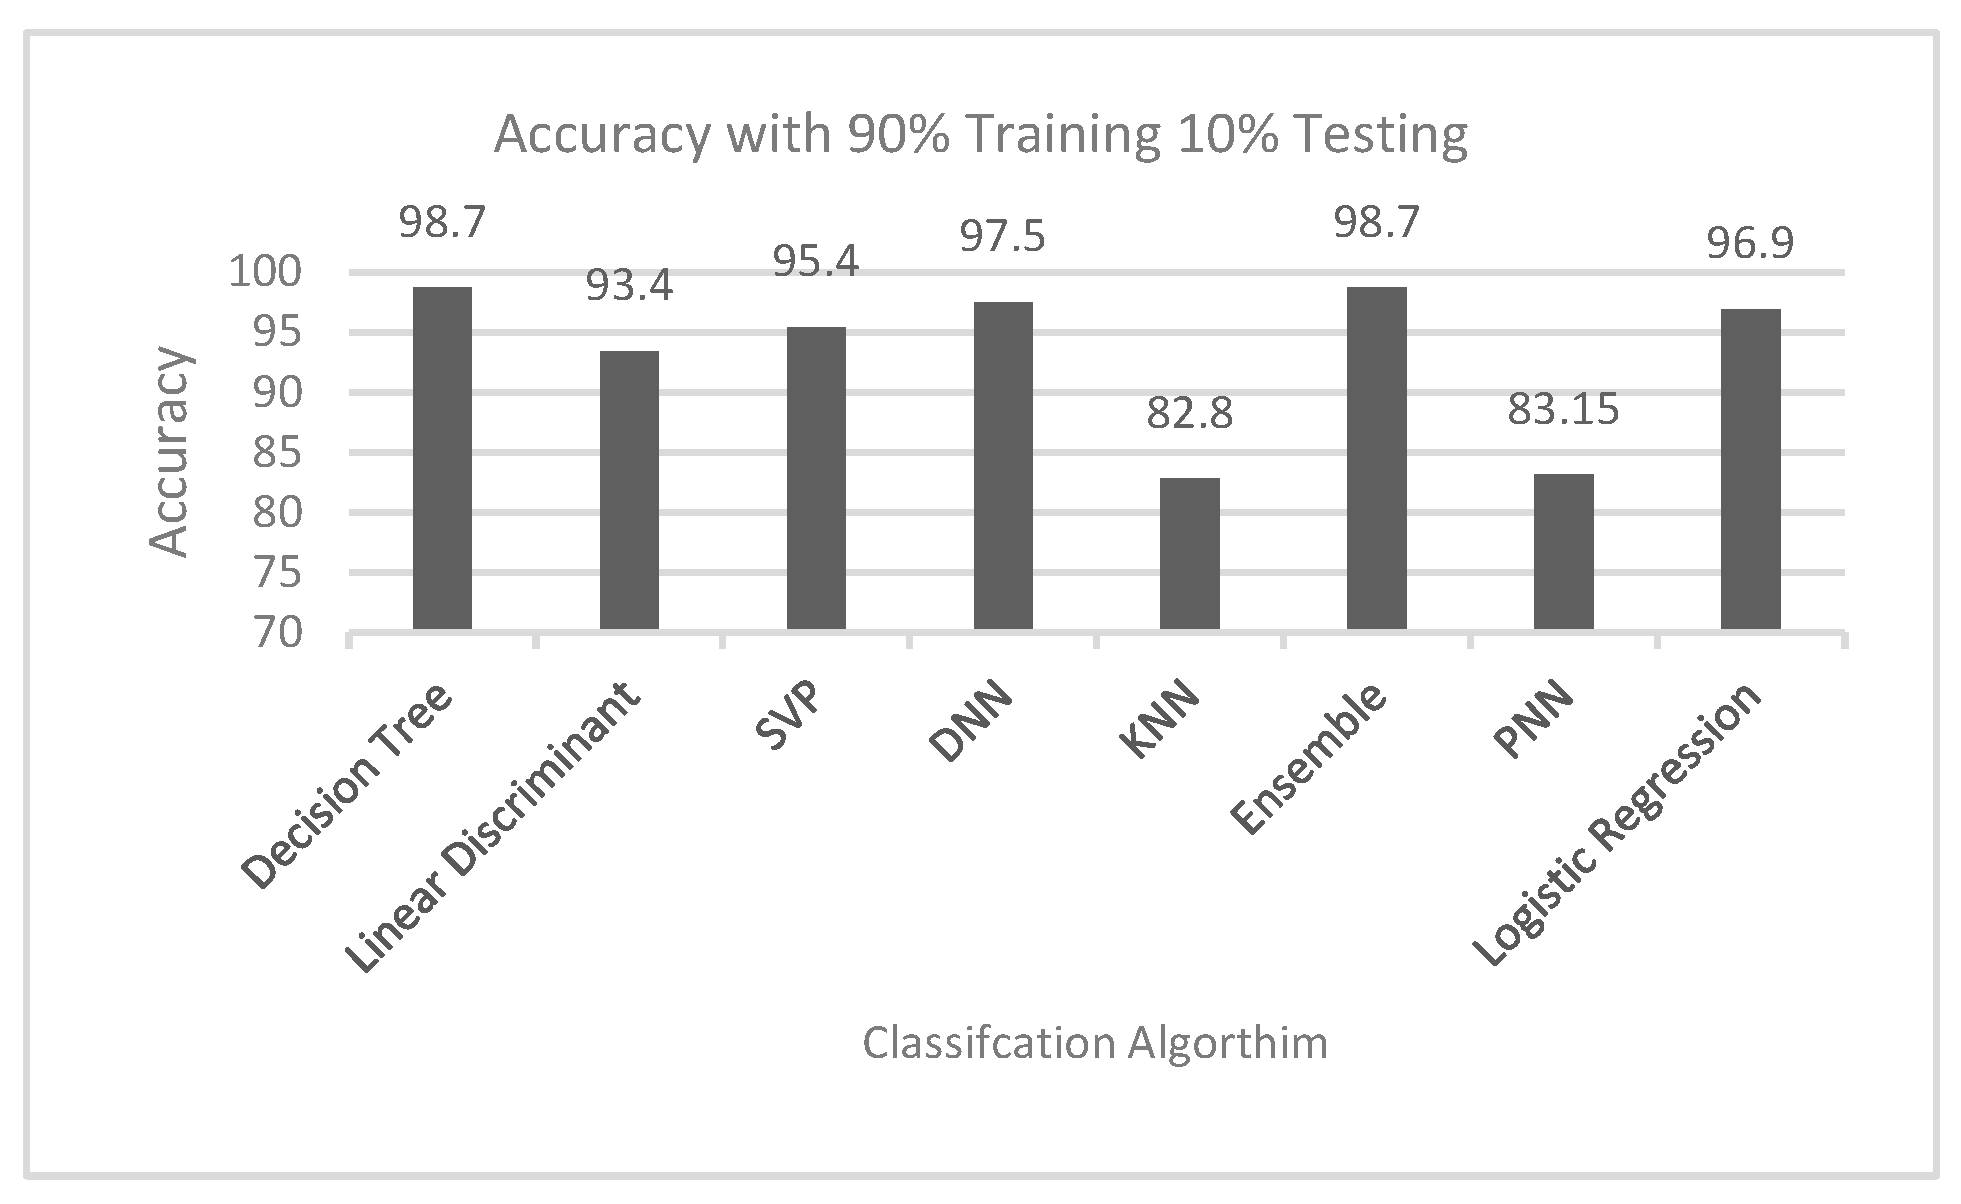
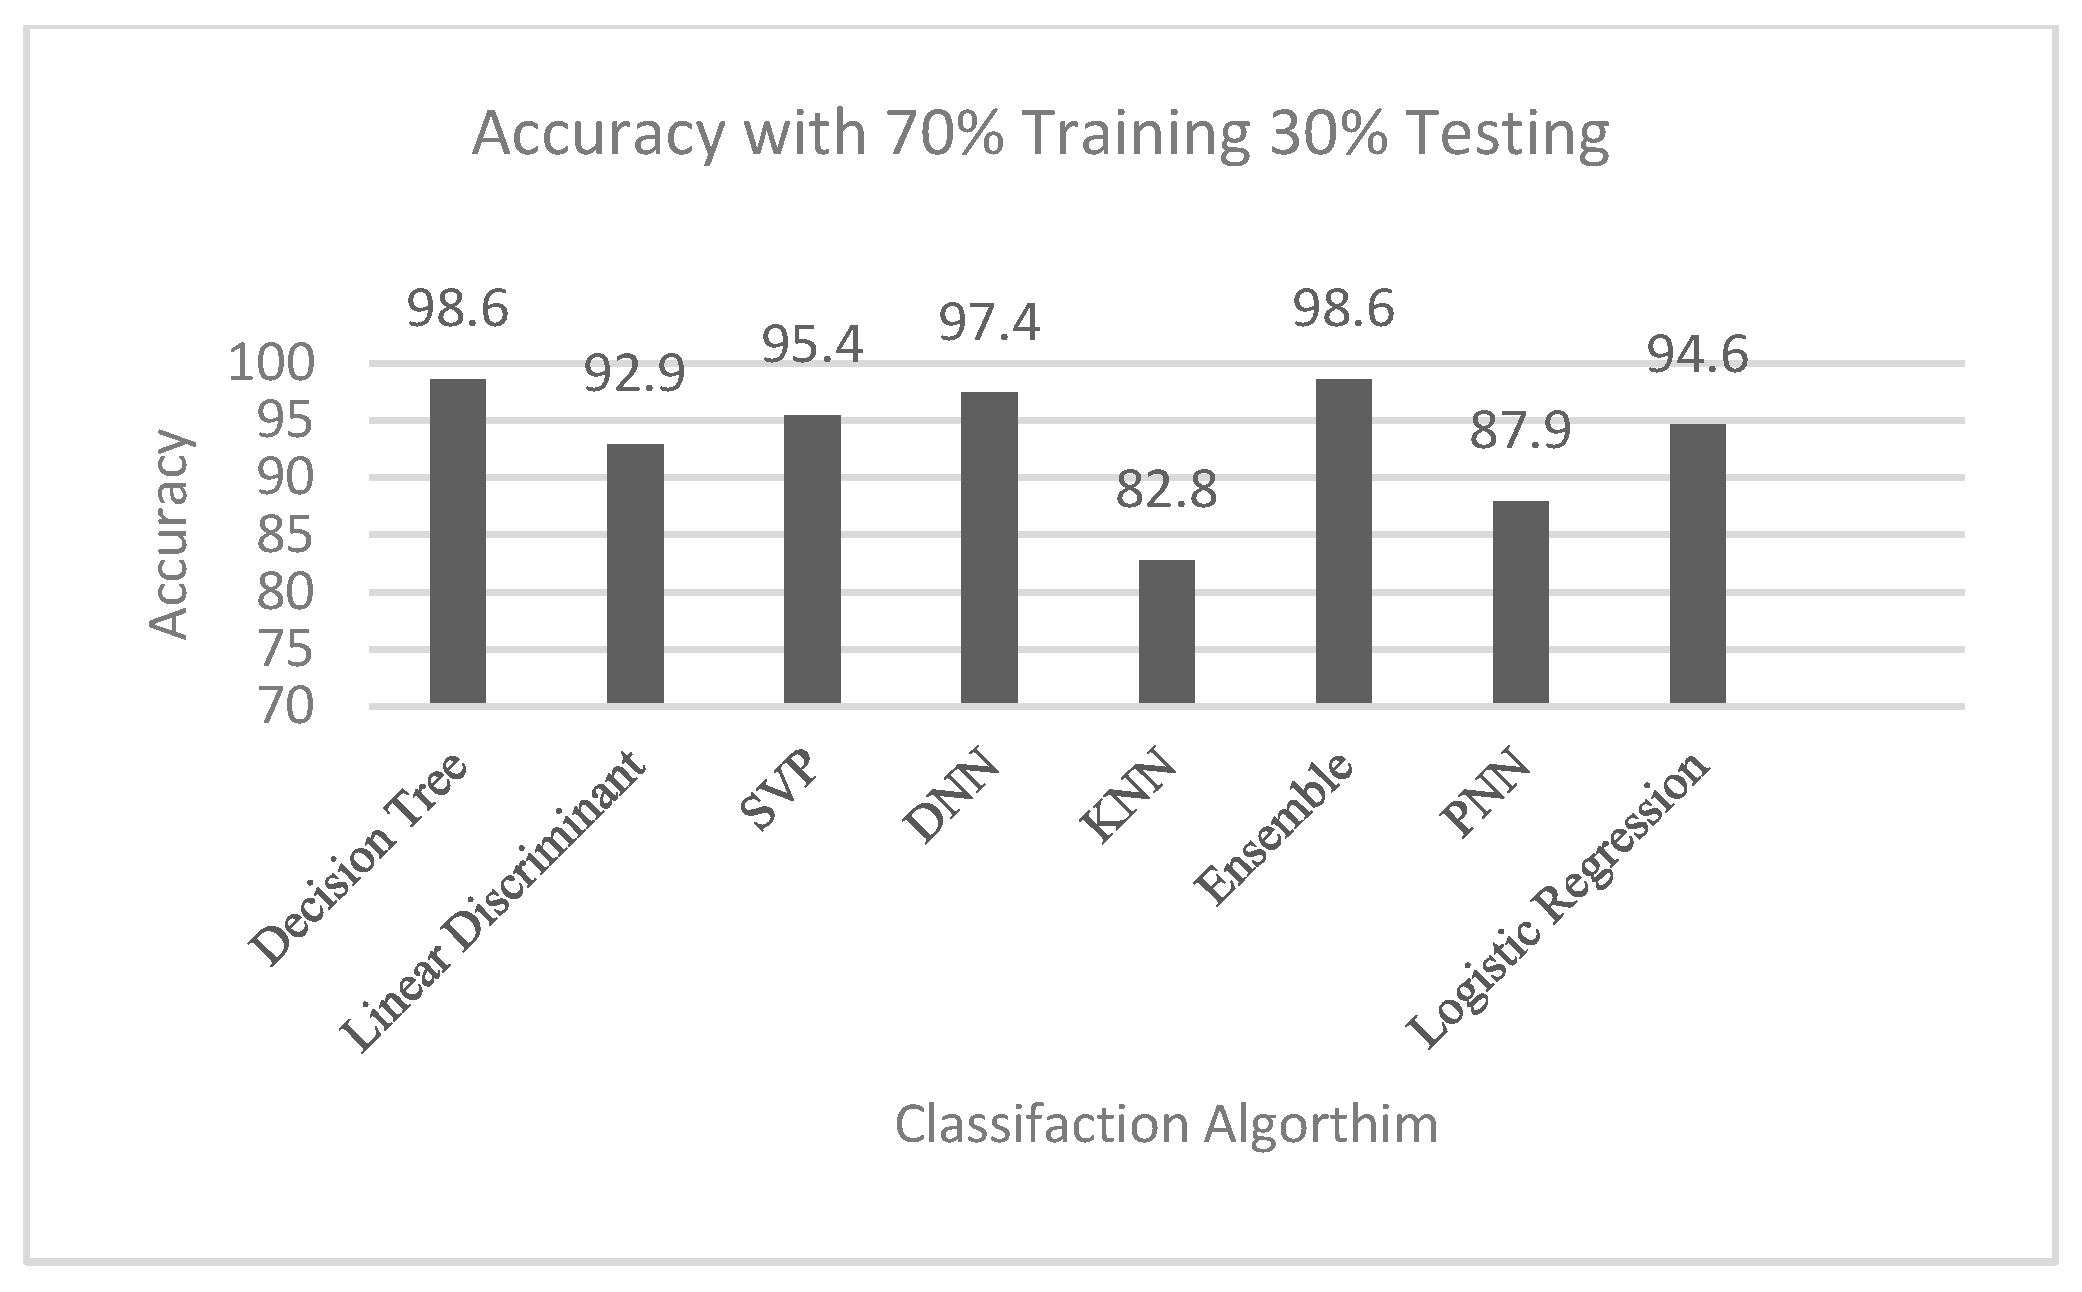
The results of applying the different classification algorithms to the collected dataset are as follows. Experiments were carried out using two modes. The first mode split the dataset into 90% for training and the remaining 10% for testing. The second mode split the dataset into 70% for training and the remaining 30% for testing. The prediction accuracy of each algorithm was calculated.
Figure 2,
Figure 3 and
Figure 4 and
Table 2 show the accuracies of different algorithms in both modes.
The accuracy (AC) of an algorithm was defined as the ratio of correctly classified patients (TP + TN) to all patients (TP + TN + FP + FN) using the following equation:
The classification results in the form of precision, recall, and F1 scores for the 90/10 and 70/30 training/testing samples are presented in
Table 3 and
Table 4, respectively. Two metrics, precision and recall, were used to measure the training systems’ performances. Precision measured the number of correct instances retrieved divided by all retrieved instances. Recall measured the number of correct instances retrieved divided by all correct instances. The F-score was defined as the weighted average of both precision and recall, depending on the weight function.
3.4. Performance Analysis
A performance analysis was carried out in two modes. In the first mode, all features were used, whereas in the second mode, only a subset of these features was used. The selection was based on feature selection algorithms; a cross-validation strategy regarding the training samples was used to avoid data leakage, which might have caused overfitting. This helped facilitate the study of the feature reduction’s impact on the classification algorithms’ results.
- (1)
Analysis without feature selection
The first analysis of different algorithms’ prediction performances used all the dataset’s features. The dataset contained 106 features in addition to the label (malignant/benign). The results are shown in
Figure 2 and
Figure 3.
Table 2 indicates that the DT and ensemble techniques provided better accuracy than the other algorithms, as both had a 98.7% accuracy.
- (2)
Analysis with feature selection
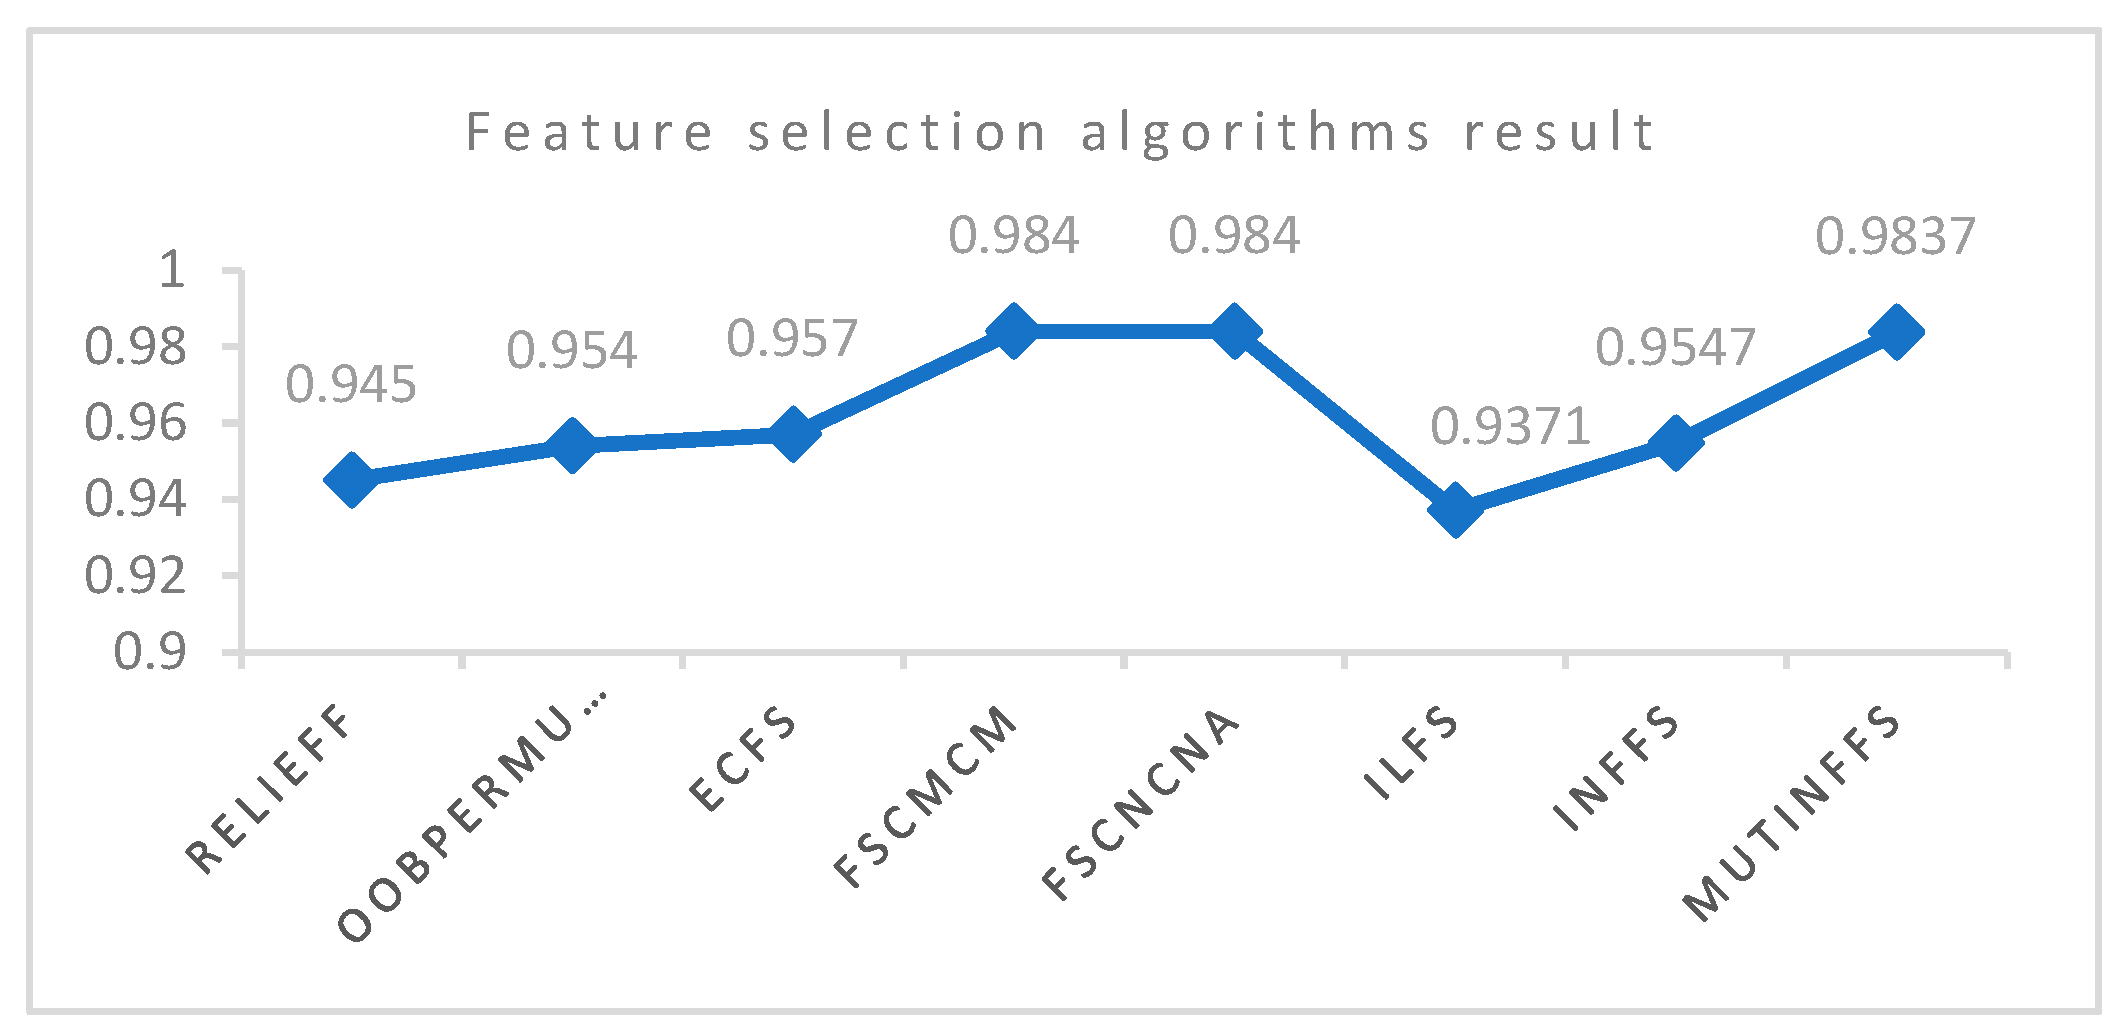
This section shows the results of different classification methods using a selected features subset. Feature selection was based on eight algorithms: ECFS, ILFS, FSCMC, RELIEFF, MUTINFFS, FSCNCNA, oob Permuted Predictor Importance, and INFFS.
Each feature selection algorithm selected 25 of the dataset’s 107 features.
Appendix A shows the ten most frequent features selected by these algorithms. Dataset analyses were repeated using the selected features. The results of classification after the feature selection phase are shown in
Table 5 and
Figure 5.
The results of the classification accuracy using different methods with selected features showed that the DT, ensemble, and RNN techniques provided better results than the other techniques. The linear discriminant technique had the lowest accuracy.
4. Discussion
This study undertook a comparative analysis of the classification accuracies of eight classification techniques and predictive machine learning algorithms: decision tree (DT), linear discriminant (LD), logistic regression (LR), support vector machine (SVM), ensemble, probabilistic neural network (PNN), deep neural network (DNN), and recurrent neural network (RNN) algorithms. Accuracies were tested regarding breast cancer classification.
The dataset used was obtained from the National Cancer Institute (NIH). The dataset was collected from 1975 to 2018 and contains 1.7 m records, with 210 features each. The authors are aware that the dataset was not large enough for ML algorithms to provide accurate indications or benchmarking results and that this study’s results do not reflect the actual performances of DL algorithms or represent the accurate rankings of different ML algorithms regarding malignancy classification. However, our primary aim was to compare different algorithms’ performance measures. Accuracy analyses indicated that the DT and ensemble techniques outperformed the accuracy results of the other techniques. Performance analyses were repeated using a subset of the features selected using eight feature selection algorithms. Ten selected features were found to have a high impact on the classification of cases as either malignant or benign.
The accuracy assessment of the selected techniques showed that the DT, ensemble, and RNN methods provided better accuracy than the other classification techniques in the prediction of breast cancer. The tree-based models (DT and ensemble) had the best breast cancer prediction accuracy using the numerical dataset in this experiment. In comparison, the neural-network-based algorithms (DNN, RNN, and PNN) did not achieve noticeable results.
Although the feature selection algorithms did not have a significant effect on the traditional models’ results, they did improve the deep learning models’ accuracy. The RNN model performed well and achieved 98.4% accuracy after the feature selection algorithms were applied.
Appendix A presents the features that were the most effective indicators in improving the prediction accuracy.


