
A Drought Dataset Based on a Composite Index for the Sahelian Climate Zone of Niger


Abstract
:1. Introduction
2. Data and Methods
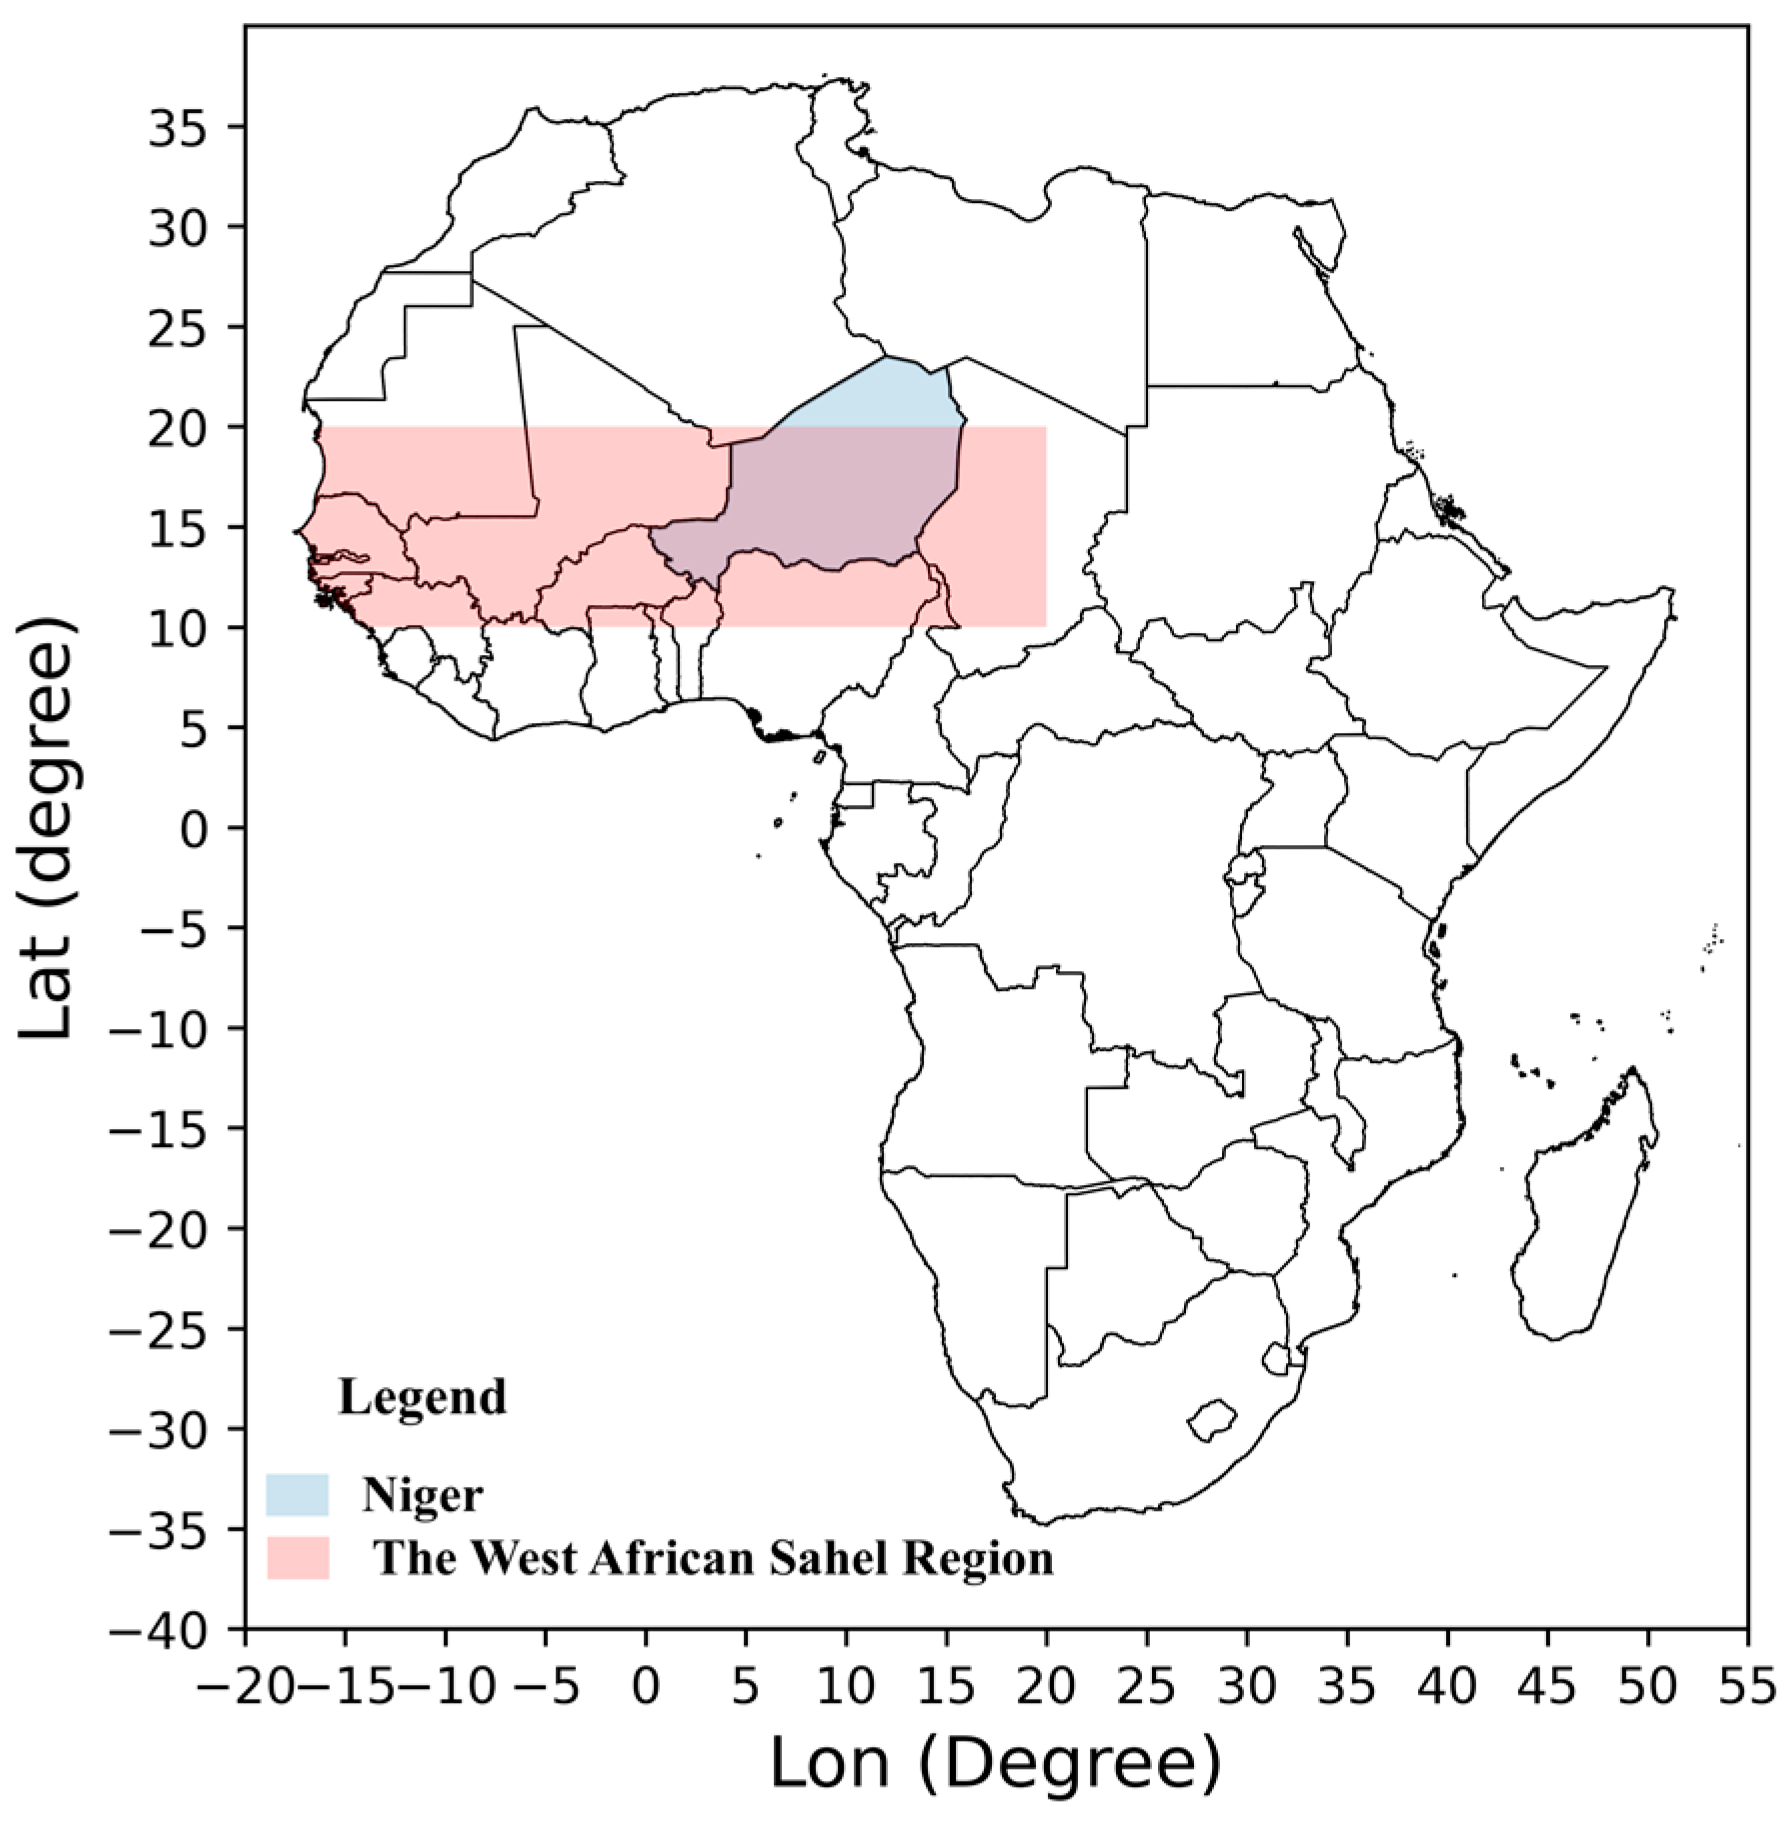
2.1. Study Area
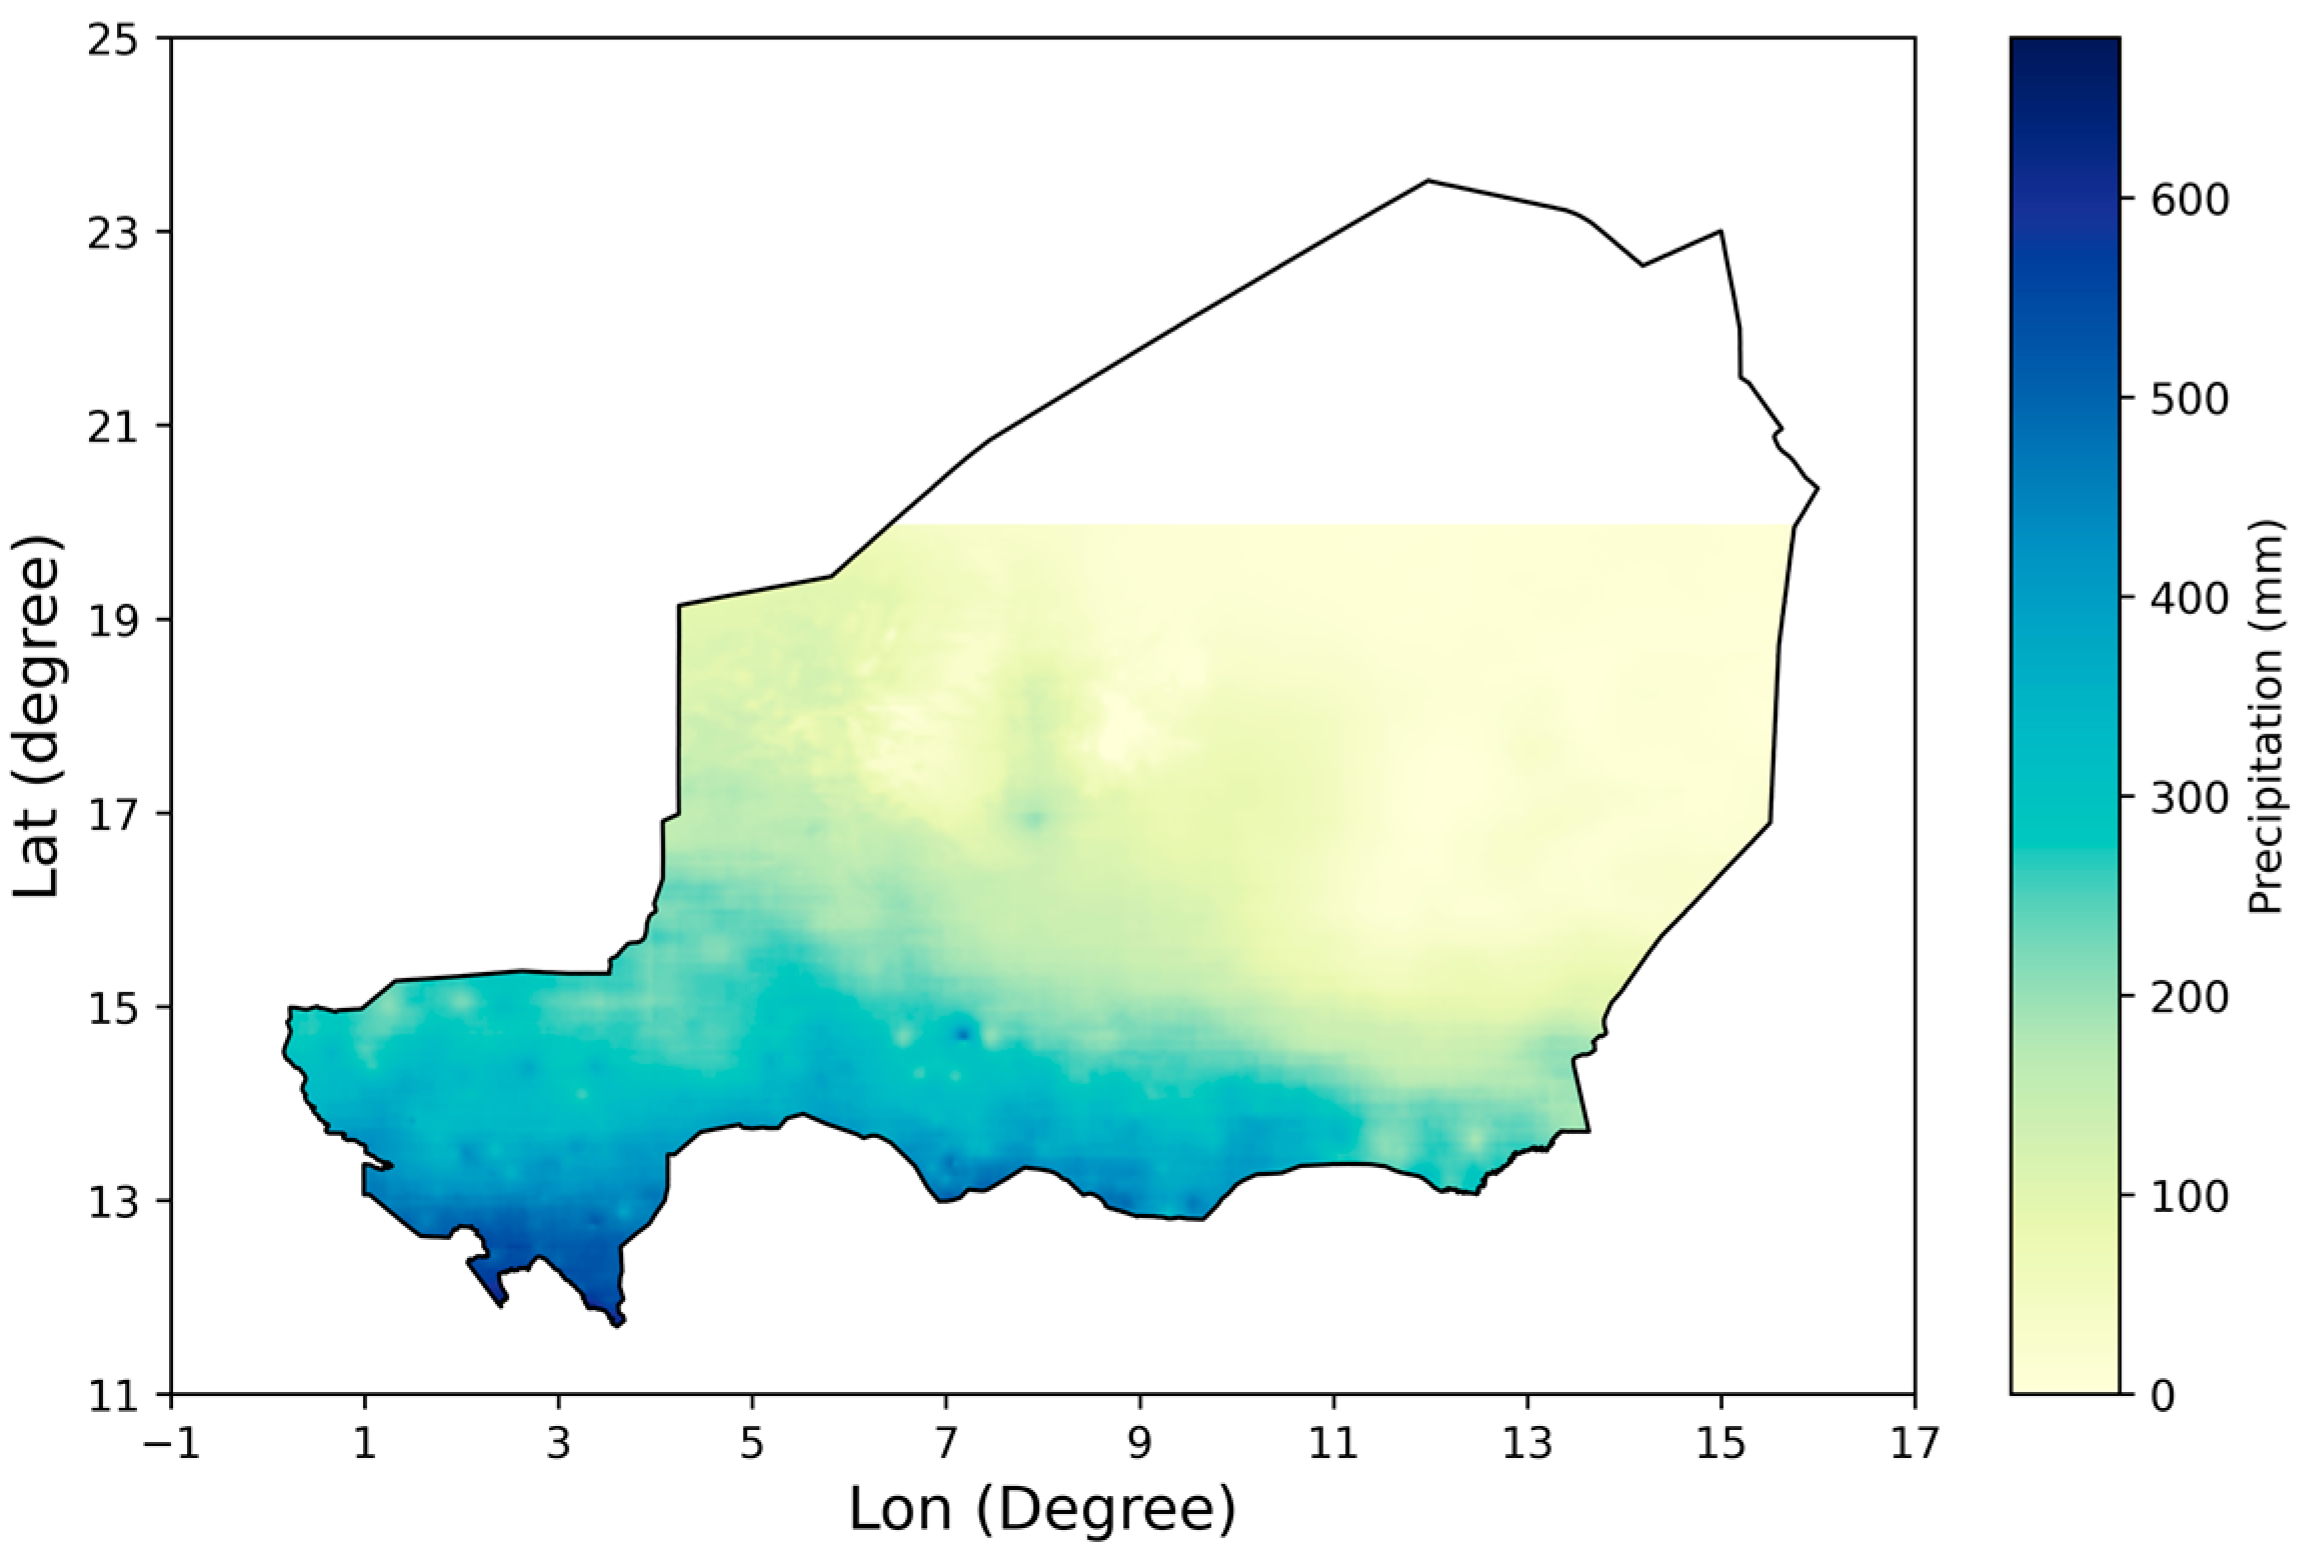
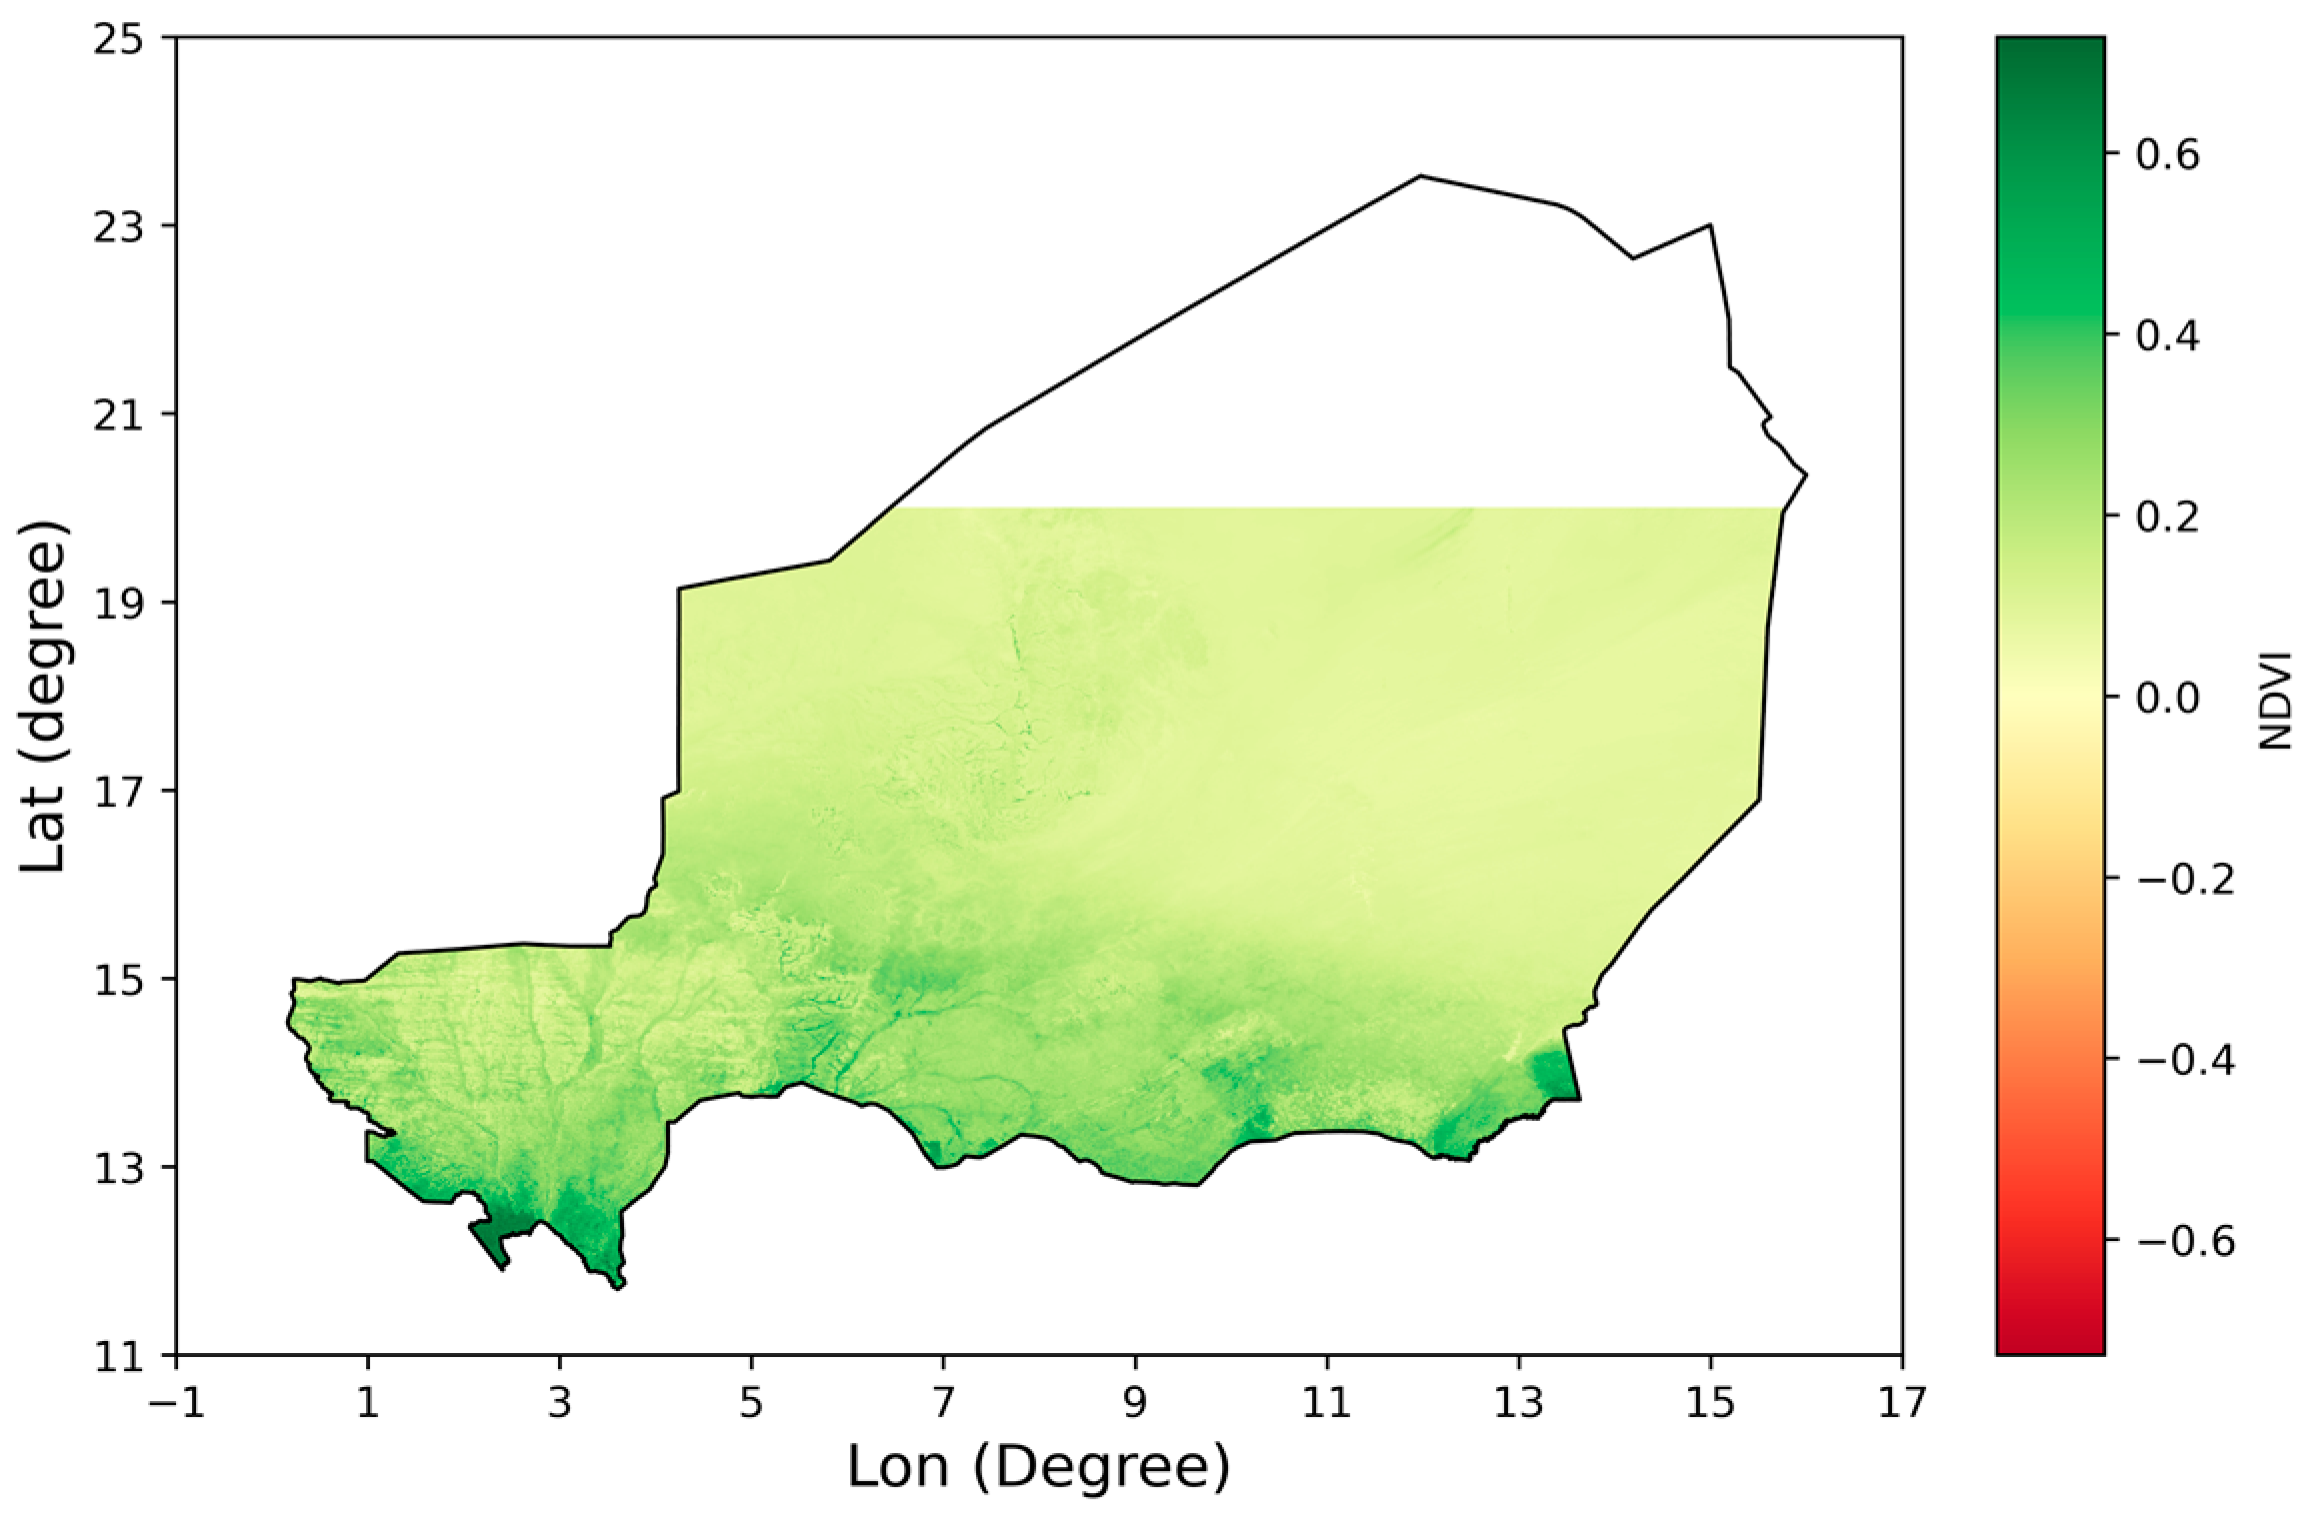
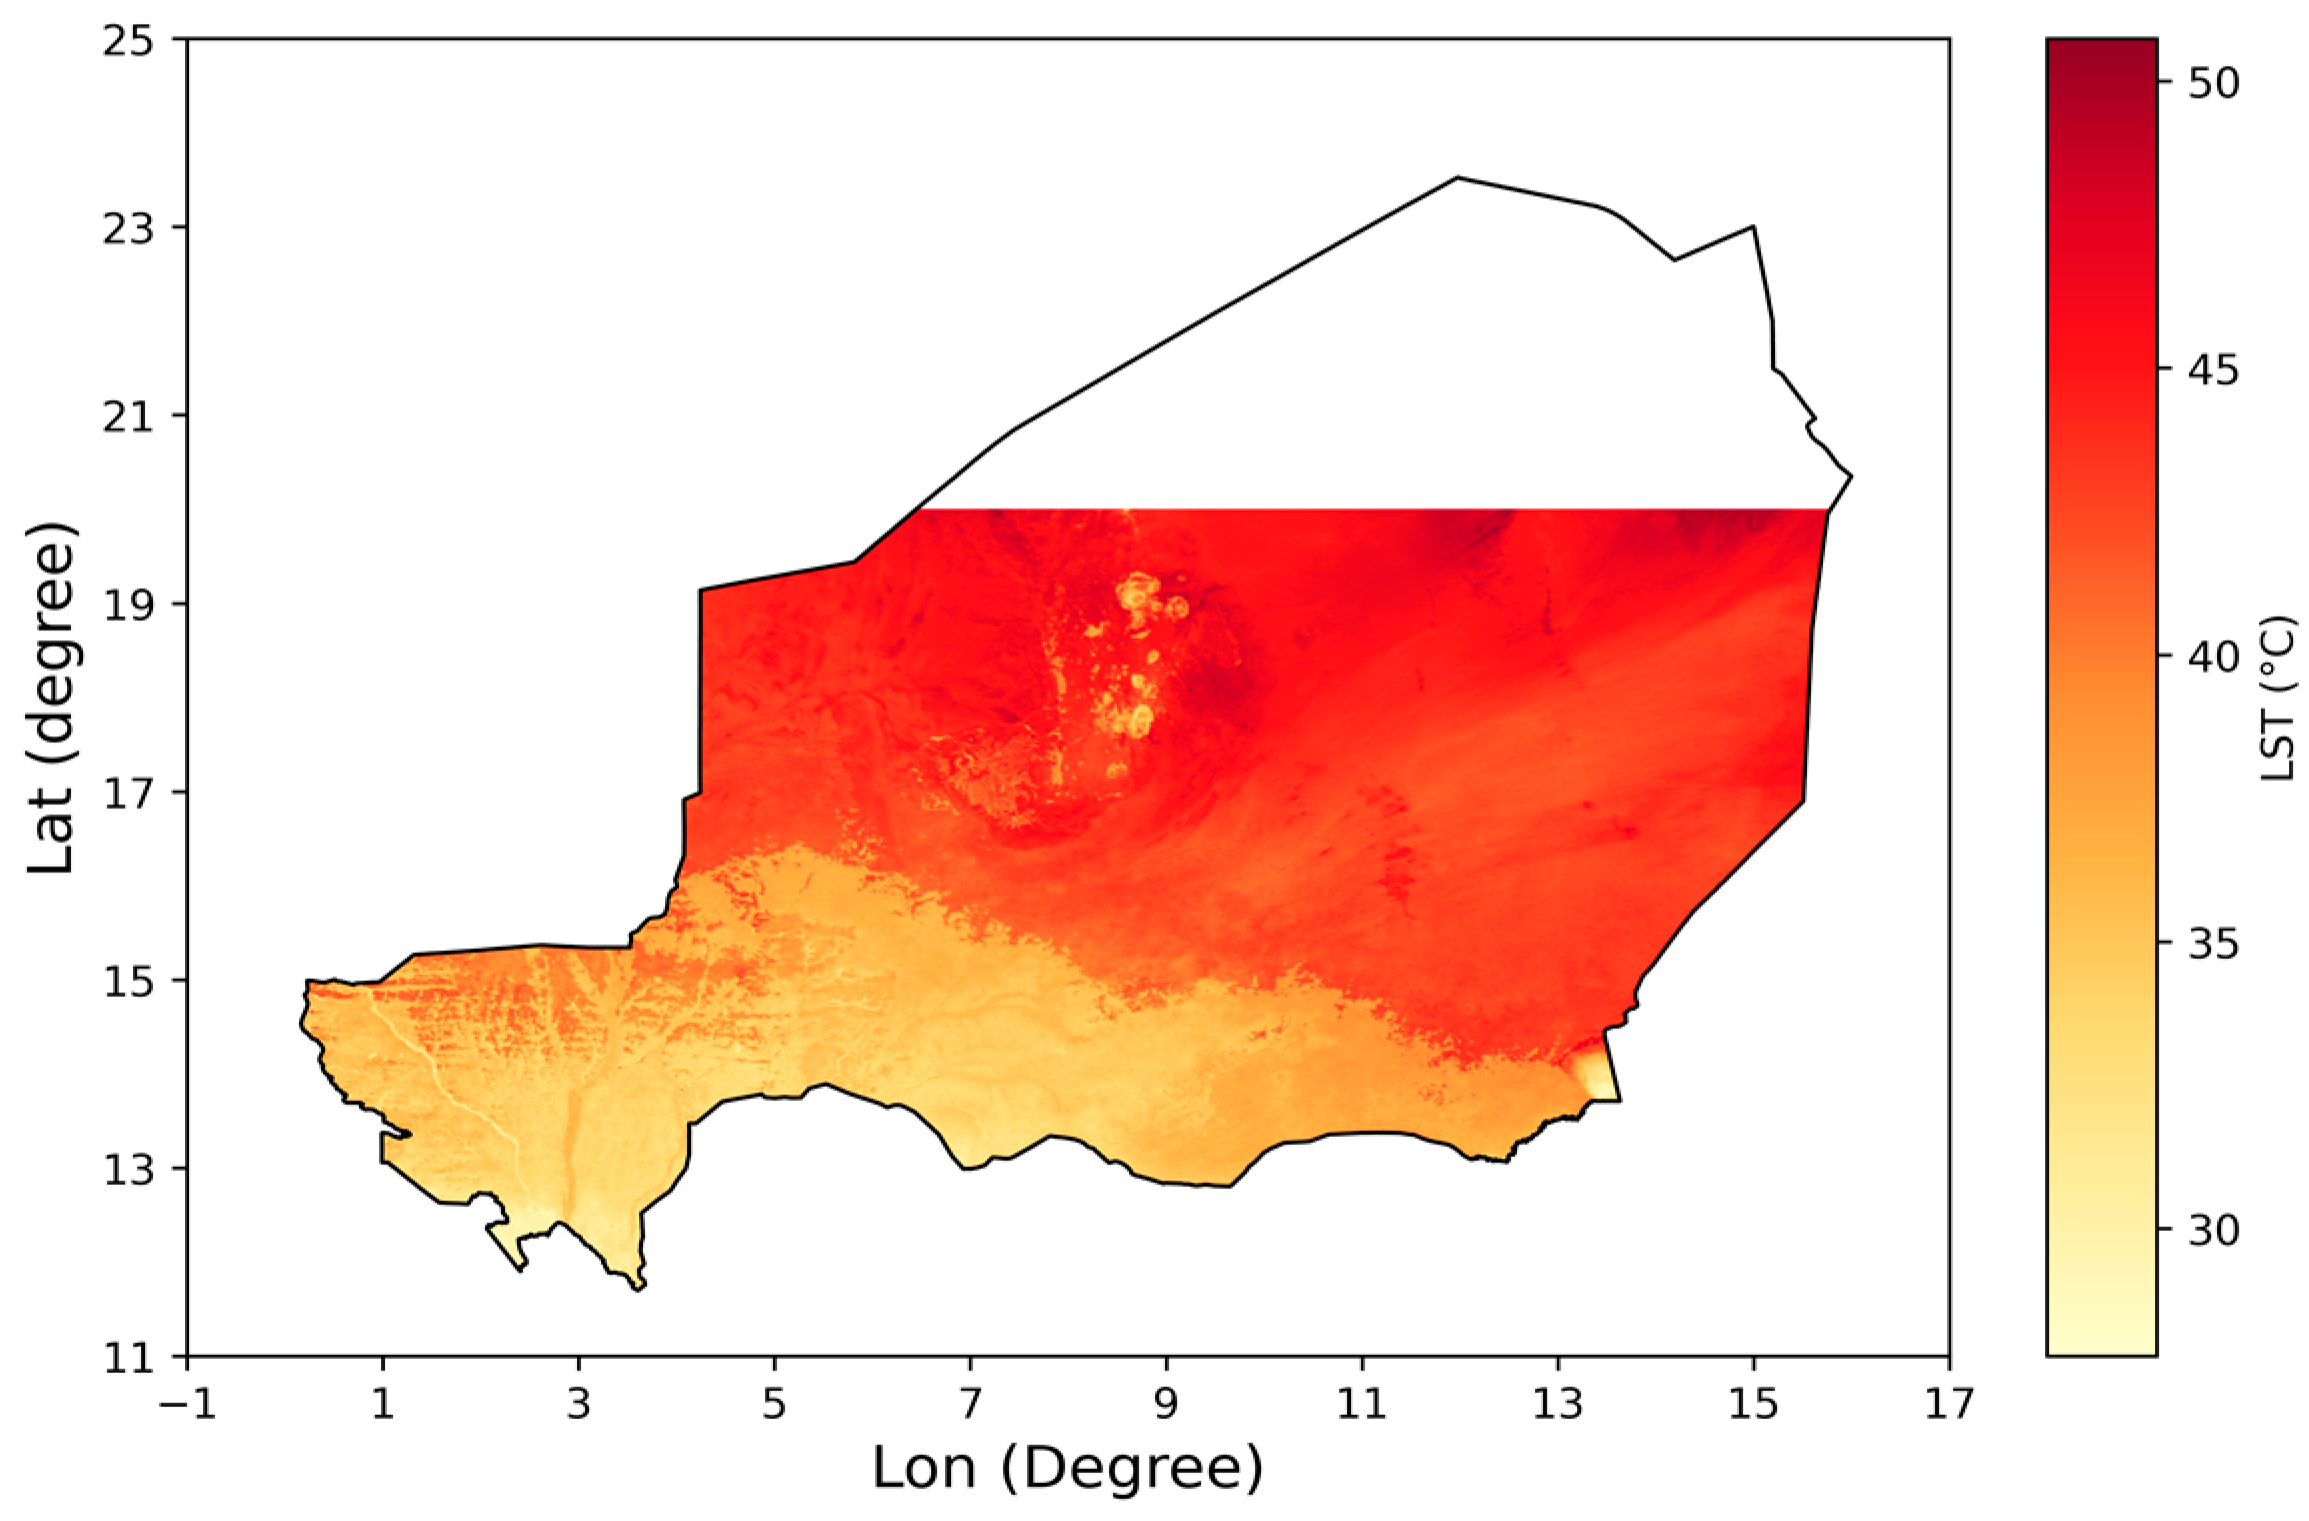
2.2. Input Data Description
2.3. Development of the Composite Drought Index
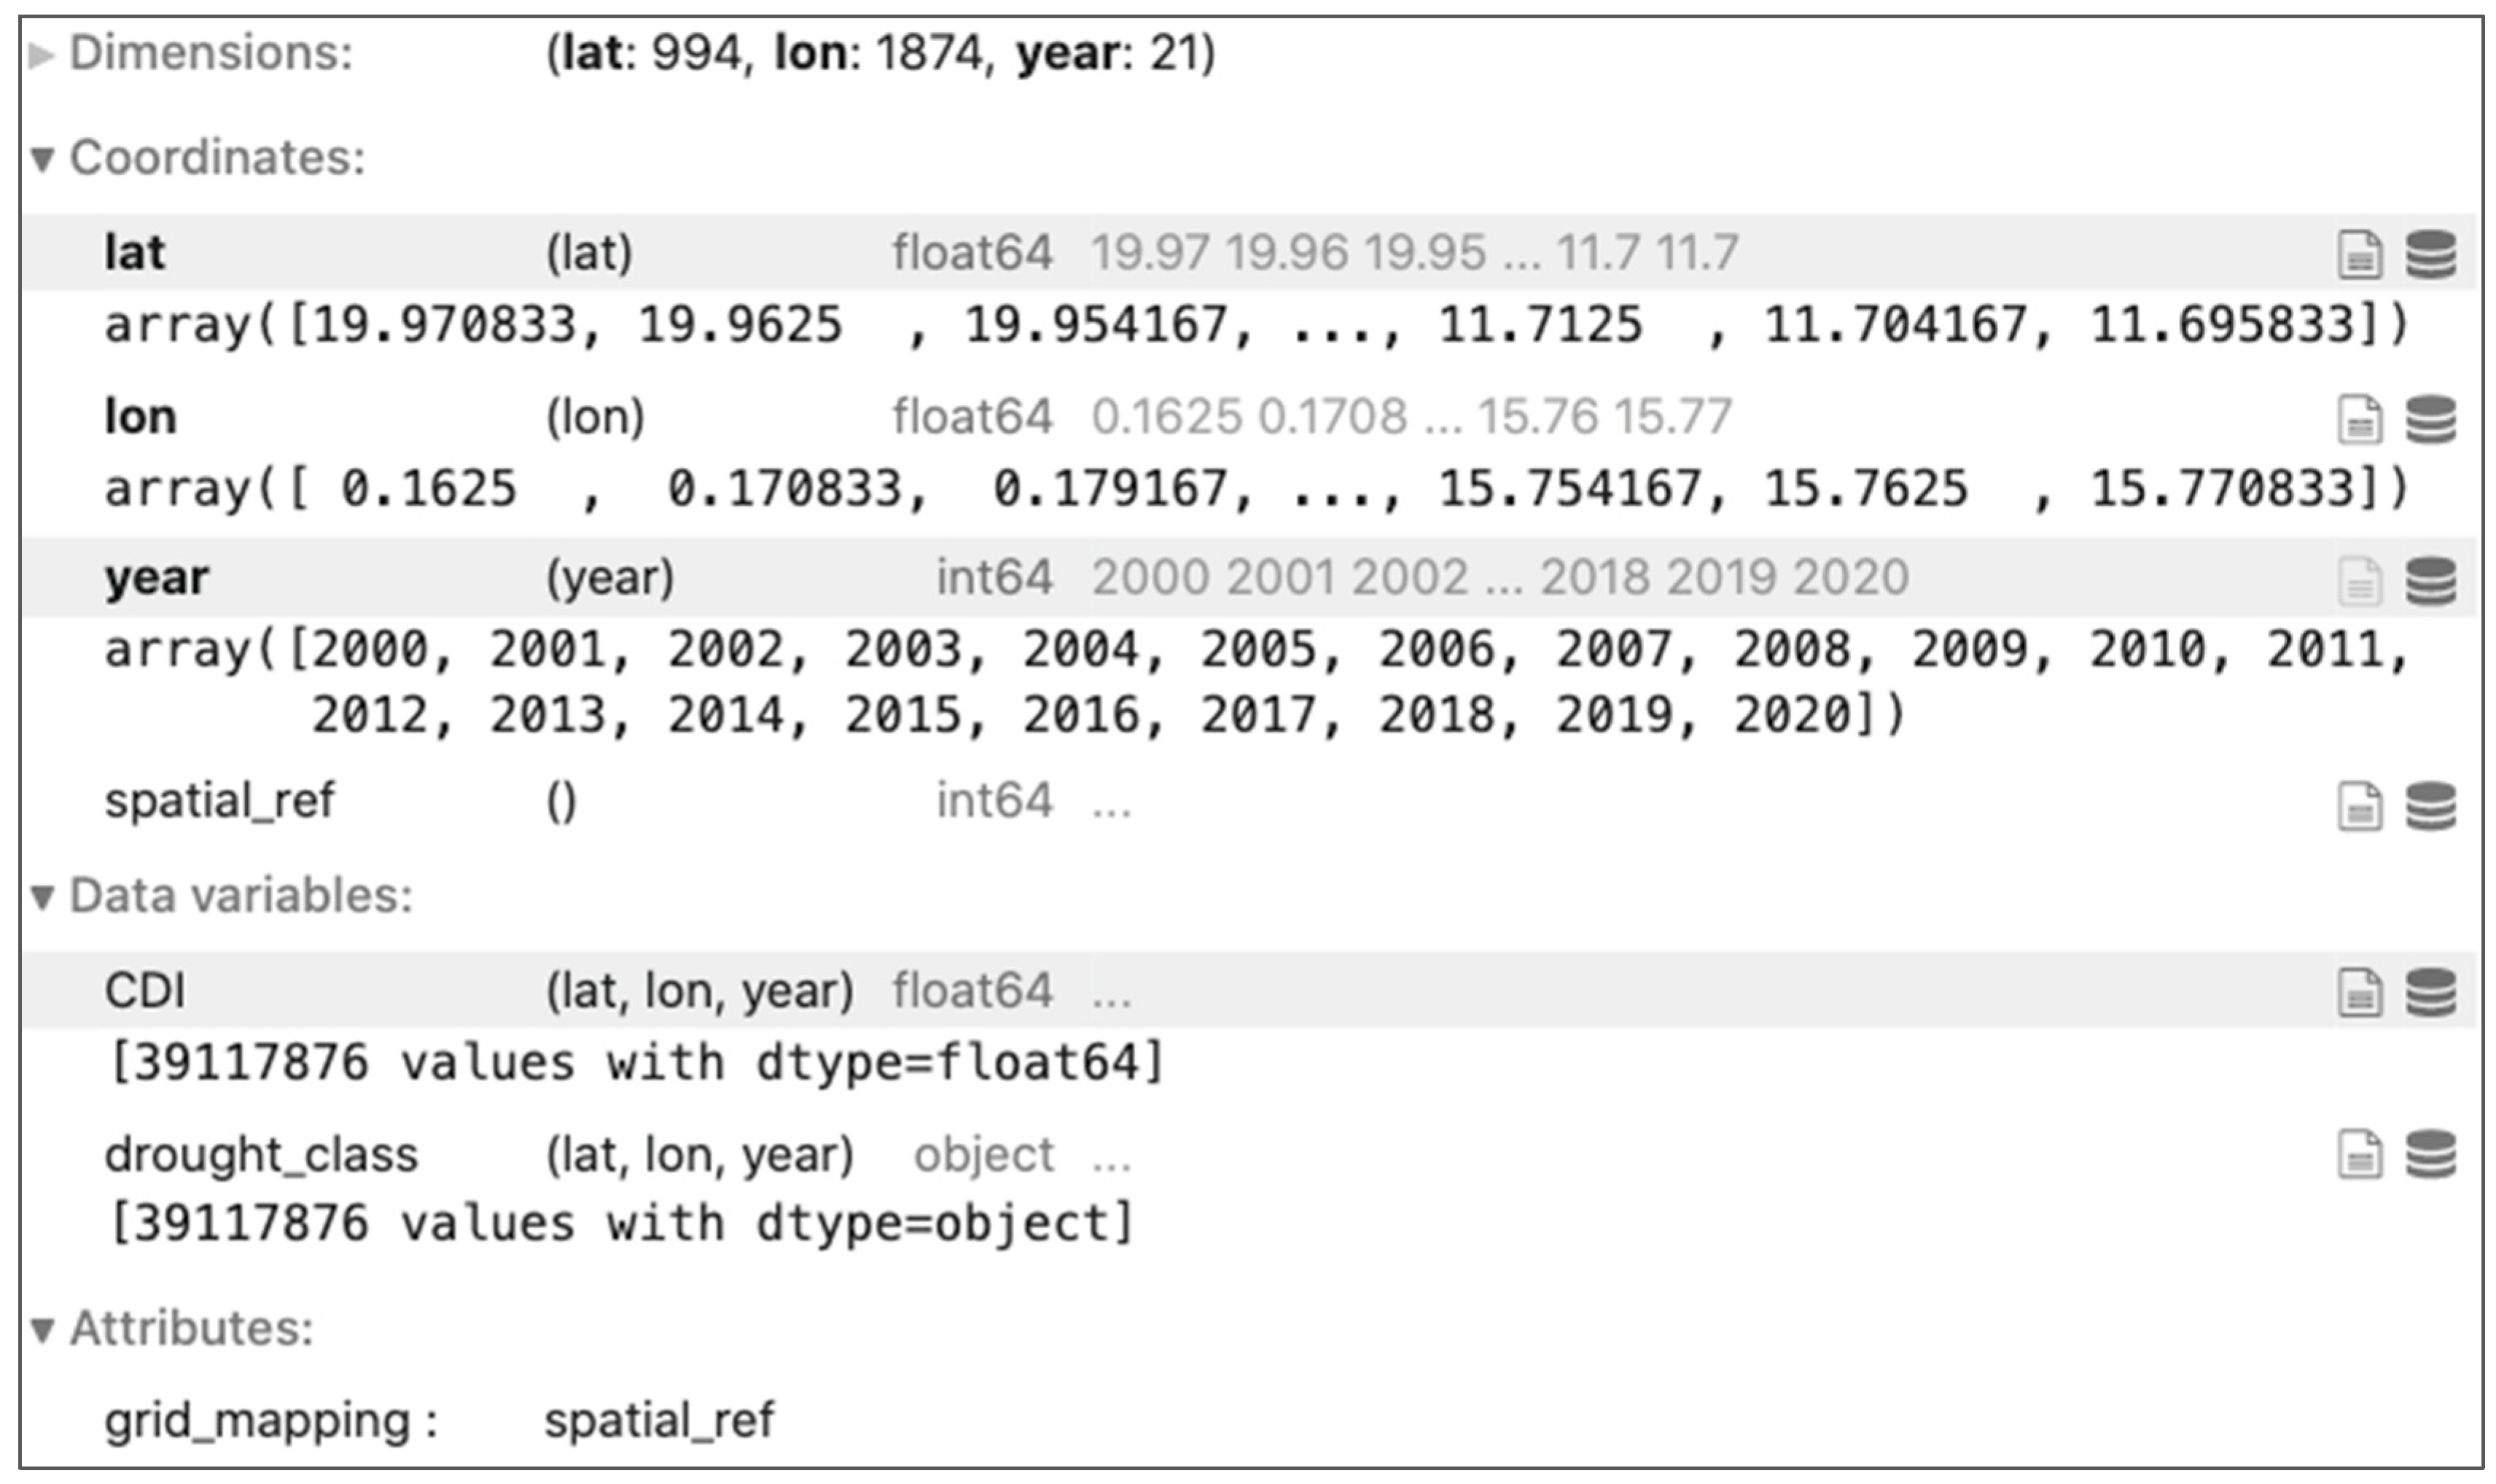
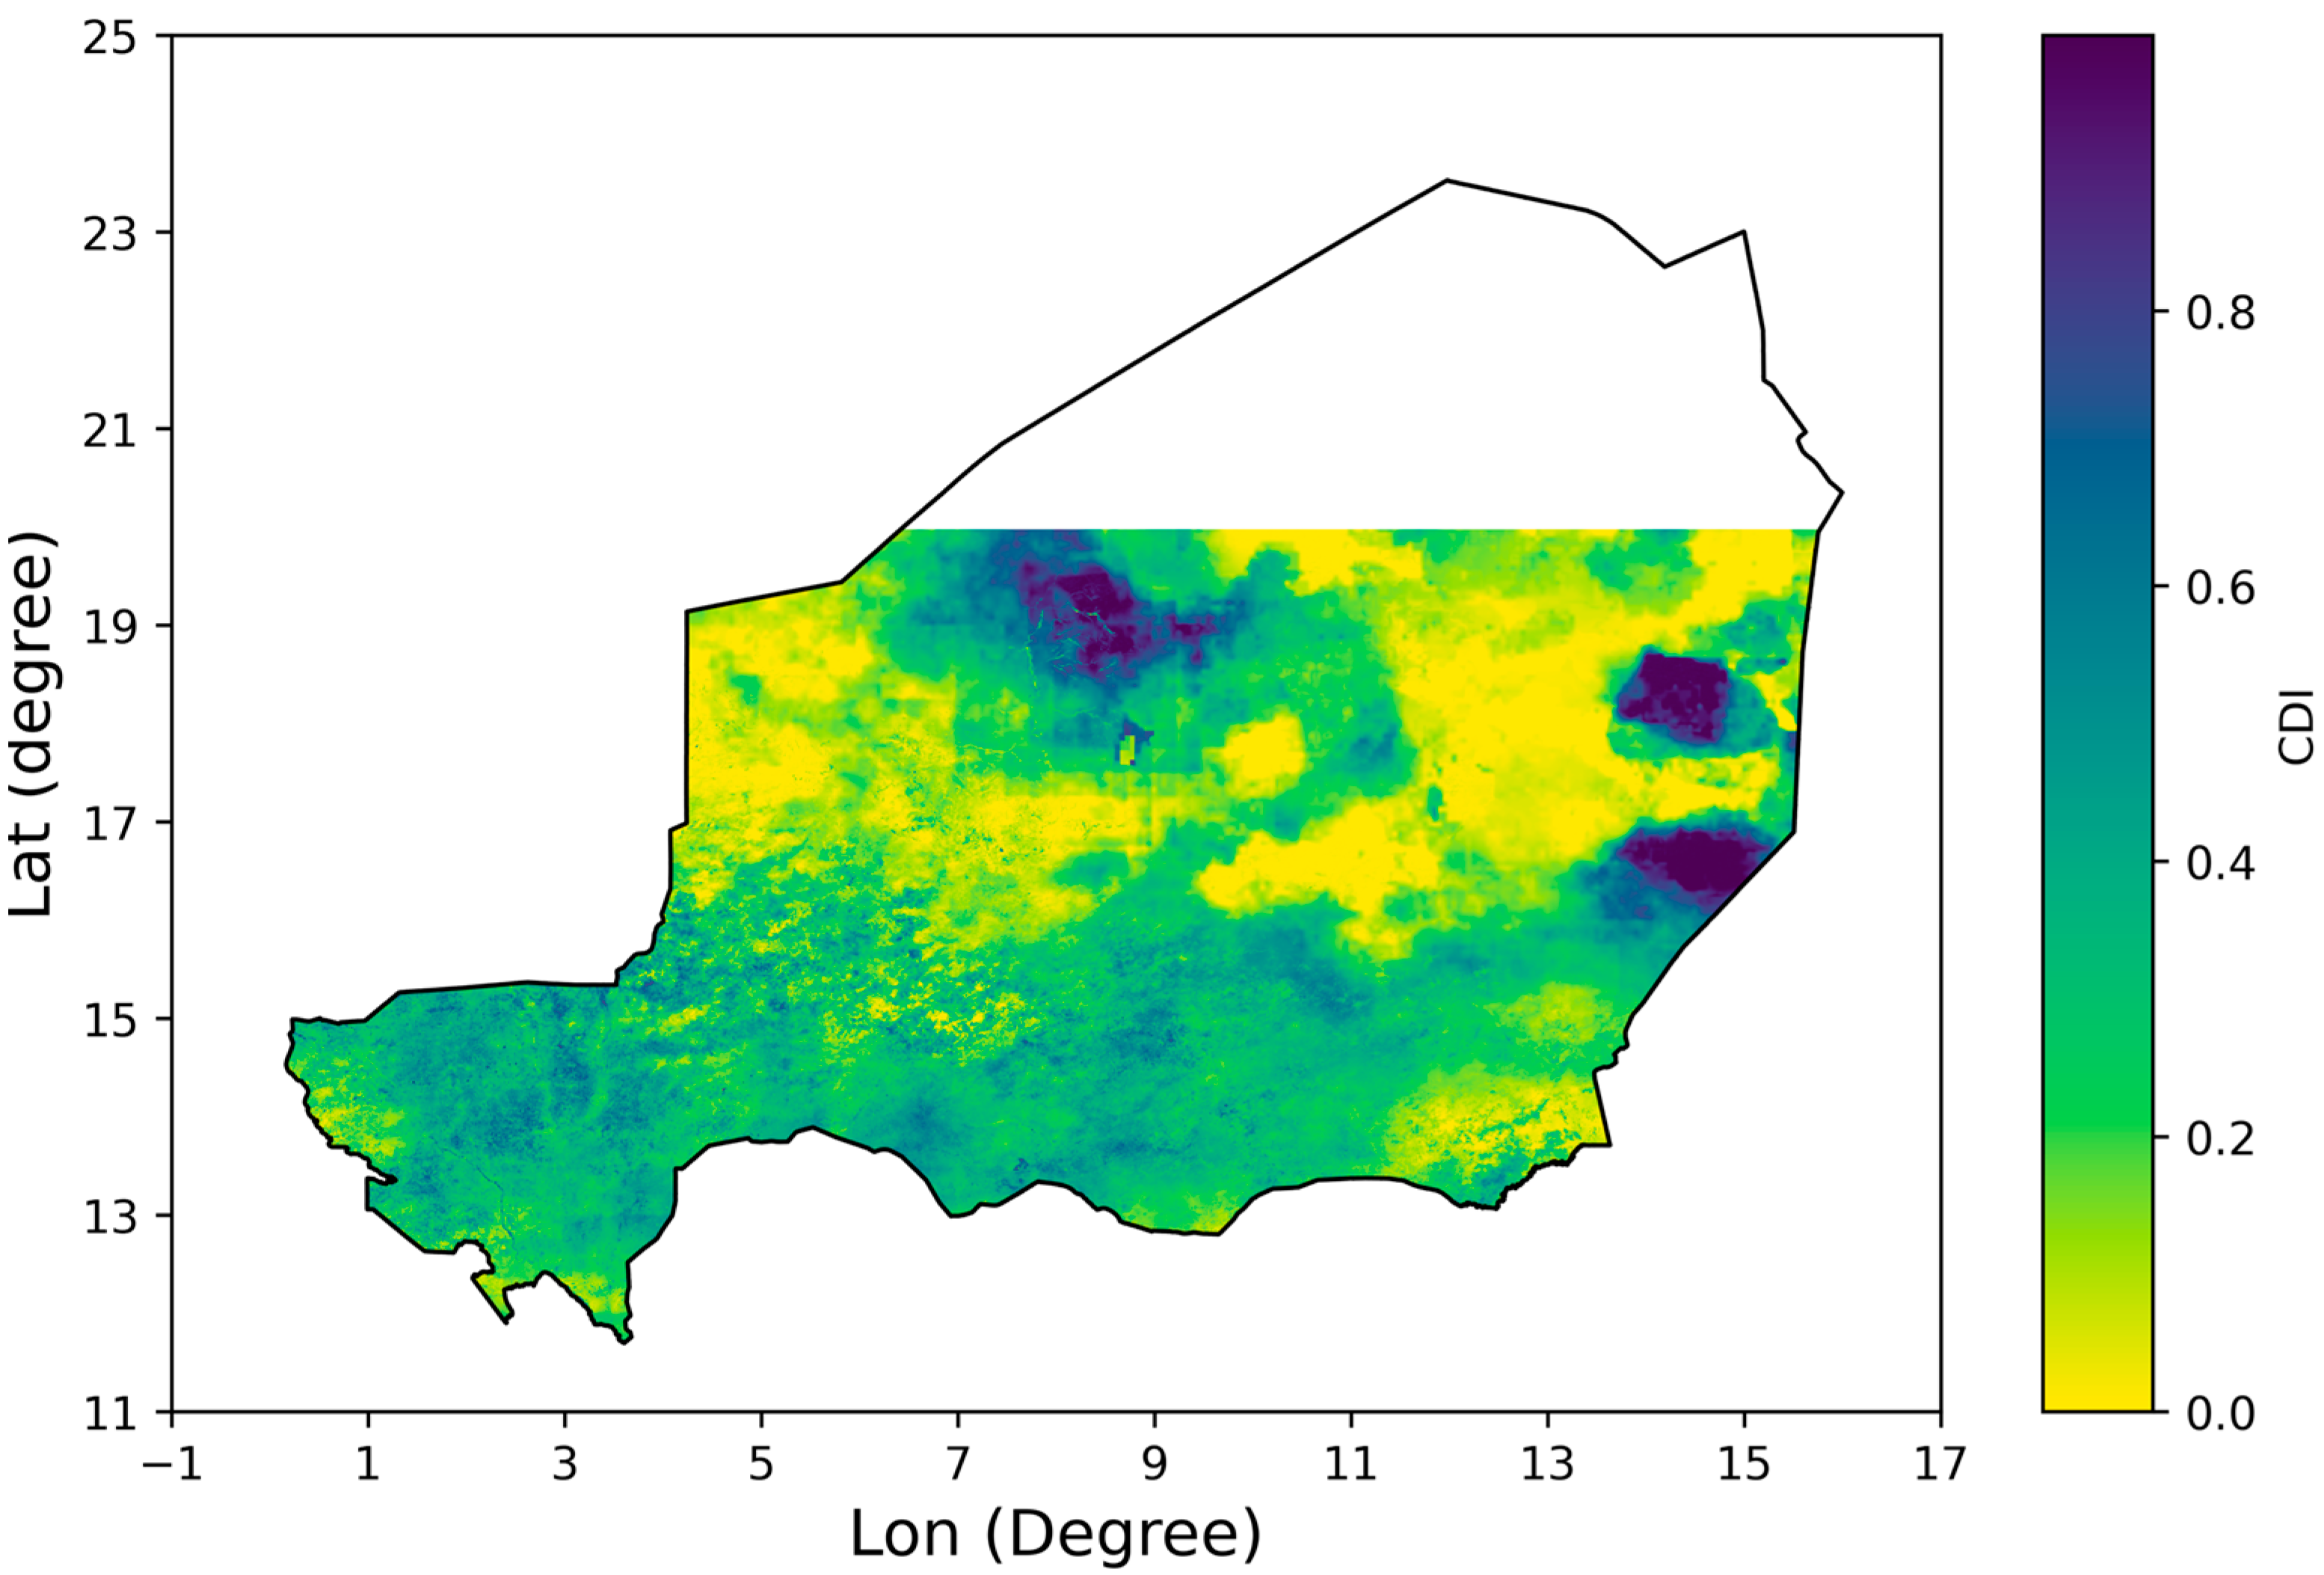
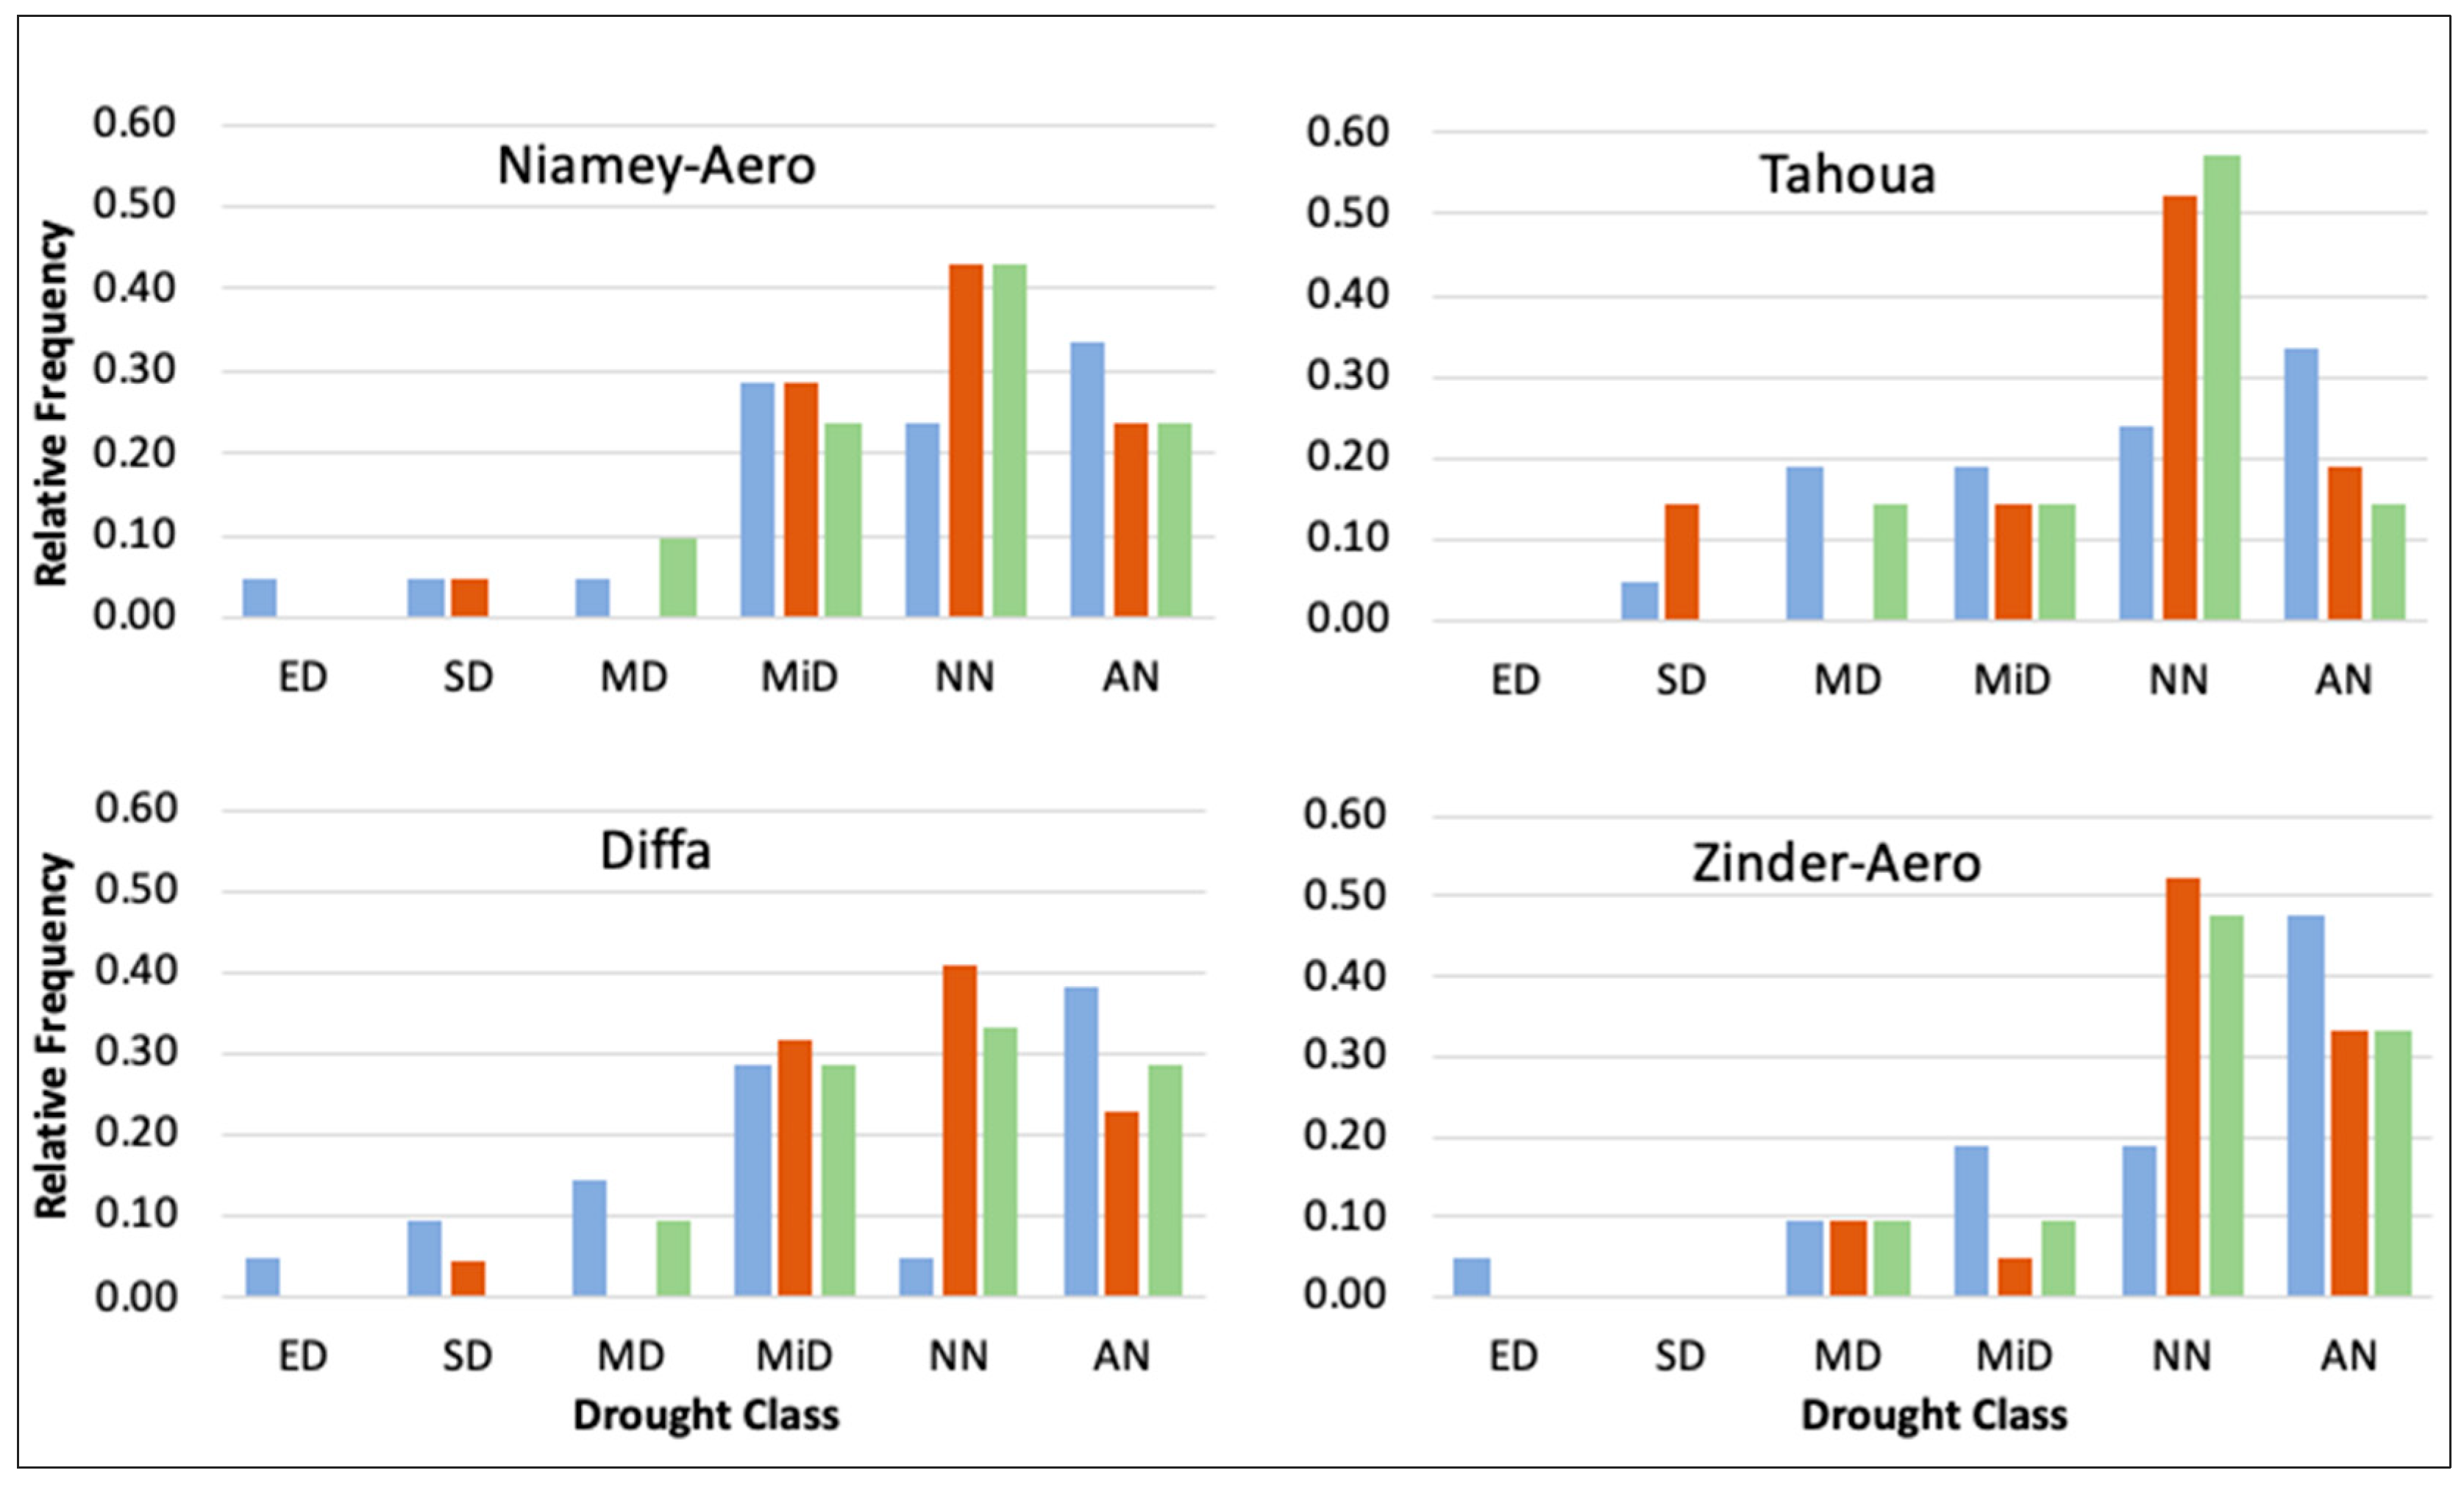
3. Data Description
4. Conclusions
Author Contributions
Funding
Institutional Review Board Statement
Informed Consent Statement
Data Availability Statement
Acknowledgments
Conflicts of Interest
References
- Wilhite, D.; Pulwarty, R.S. (Eds.) Drought and Water Crises: Integrating Science, Management, and Policy; CRC Press: Boca Raton, FL, USA, 2017. [Google Scholar]
- Guha-Sapir, D.; Below, R.; Hoyois, P. EM-DAT: International Disaster Database. Brussels, Belgium: Université Catholique de Louvain. 2014. Available online: www.emdat.be (accessed on 20 May 2022).
- CRED. Human Cost of Natural Disasters: A Global Perspective; CRED and UNISDR: Brussels, Belgium, 2015; p. 59. [Google Scholar]
- Hein, L.; De Ridder, N. Desertification in the Sahel: A reinterpretation. Glob. Change Biol. 2006, 12, 751–758. [Google Scholar] [CrossRef]
- Molua, E.L. The Economic Impact of Climate Change on Agriculture in Cameroon; World Bank Policy Research Working Paper 2007; World Bank: Washington, DC, USA, 2007; Volume 4364. [Google Scholar]
- Abdourahamane, Z.S.; Acar, R.; Serkan, Ş. Wavelet–copula-based mutual information for rainfall forecasting applications. Hydrol. Process. 2019, 33, 1127–1142. [Google Scholar] [CrossRef]
- World Bank Group. Republic of Niger Priorities for Ending Poverty and Boosting Shared Prosperity: Systematic Country Diagnostic. World Bank, Washington, DC, USA, 2017. World Bank, License: CC BY 3.0 IGO. Available online: https://openknowledge.worldbank.org/handle/10986/28994 (accessed on 16 June 2022).
- Zargar, A.; Sadiq, R.; Naser, B.; Khan, F.I. A review of drought indices. Environ. Rev. 2011, 19, 333–349. [Google Scholar] [CrossRef] [Green Version]
- McKee, T.B.; Doesken, N.J.; Kleist, J. The relationship of drought frequency and duration to time scales. In Proceedings of the 8th Conference on Applied Climatology, Anaheim, CA, USA, 17–22 January 1993; pp. 179–183. [Google Scholar]
- Abdourahamane, Z.S.; Garba, I.; Boukary, A.G.; Mirzabaev, A. Spatiotemporal characterization of agricultural drought in the Sahel region using a composite drought index. J. Arid Environ. 2022, 204, 104789. [Google Scholar] [CrossRef]
- Liu, Q.; Zhang, S.; Zhang, H.; Bai, Y.; Zhang, J. Monitoring drought using composite drought indices based on remote sensing. Sci. Total Environ. 2020, 711, 134585. [Google Scholar] [CrossRef] [PubMed]
- Anderson, M.C.; Hain, C.; Wardlow, B.; Pimstein, A.; Mecikalski, J.R.; Kustas, W.P. Evaluation of drought indices based on thermal remote sensing of evapotranspiration over the continental United States. J. Clim. 2011, 24, 2025–2044. [Google Scholar] [CrossRef]
- Vicente-Serrano, S.M.; Cabello, D.; Tomás-Burguera, M.; Martín-Hernández, N.; Beguería, S.; Azorin-Molina, C.; El Kenawy, A. Drought variability and land degradation in semiarid regions: Assessment using remote sensing data and drought indices (1982–2011). Remote Sens. 2015, 7, 4391–4423. [Google Scholar] [CrossRef] [Green Version]
- Balint, Z.; Mutua, F.; Muchiri, P.; Omuto, C.T. Monitoring drought with the combined drought index in Kenya. In Developments in Earth Surface Processes; Elsevier: Amsterdam, The Netherlands, 2013; Volume 16, pp. 341–356. [Google Scholar]
- Al Adaileh, H.; Al Qinna, M.; Barta, K.; Al-Karablieh, E.; Rakonczai, J.; Alobeiaat, A. A drought adaptation management system for groundwater resources based on combined drought index and vulnerability analysis. Earth Syst. Environ. 2019, 3, 445–461. [Google Scholar] [CrossRef] [Green Version]
- Folland, C.K.; Owen, J.; Ward, M.N.; Colman, A. Prediction of seasonal rainfall in the Sahel region using empirical and dynam- ical methods. J. Forecast 1991, 10, 21–56. [Google Scholar] [CrossRef]
- Janicot, S.; Moron, V.; Fontaine, B. Sahel droughts and ENSO dynamics. Geophys. Res. Lett. 1996, 23, 515–518. [Google Scholar] [CrossRef]
- Joly, M.; Voldoire, A.; Douville, H.; Terray, P.; Royer, J.-F. African monsoon teleconnections with tropical SSTs: Validation and evolution in a set of IPCC4 simulations. Clim Dyn. 2007, 29, 1–20. [Google Scholar] [CrossRef] [Green Version]
- Giannini, A.; Michel, M.; Verstraete, M. A climate model-based re- view of drought in the Sahel: Desertification, the re-greening and climate change. Glob. Planet Chang. 2008, 64, 119–128. [Google Scholar] [CrossRef]
- Funk, C.C.; Peterson, P.J.; Landsfeld, M.F.; Pedreros, D.H.; Verdin, J.P.; Rowland, J.D.; Romero, B.E.; Husak, G.J.; Michaelsen, J.C.; Verdin, A.P. A quasi-global precipitation time series for drought monitoring. US Geol. Surv. Data Ser. 2014, 832, 1–12. [Google Scholar]
- Rouse, J.W., Jr.; Haas, R.H.; Schell, J.A.; Deering, D.W. Monitoring Vegetation Systems in the Great Plains with Erts; NASA Special Publication: Washington, DC, USA, 1974; Volume 351, p. 309. [Google Scholar]
- Didan, K. MOD13A3 MODIS/Terra vegetation Indices Monthly L3 Global 1km SIN Grid V006 [Data set]. NASA EOSDIS Land Processes DAAC 2015. Available online: https://doi.org/10.5067/MODIS/MOD13A3.006 (accessed on 15 April 2021).
- Wan, Z. New refinements and validation of the collection-6 MODIS land-surface temperature/emissivity product. Remote Sense Environ. 2014, 140, 36–45. [Google Scholar] [CrossRef]
- Gbode, I.E.; Intsiful, J.D.; Akinsanola, A.A.; Abolude, A.T.; Ogunjobi, K.O. Uncertainties in daily rainfall over West Africa: Assessment of gridded products and station gauges. In Climate Impacts on Extreme Weather; Elsevier: Amsterdam, The Netherlands, 2022; pp. 65–82. [Google Scholar]
- Brandt, M.; Hiernaux, P.; Rasmussen, K.; Mbow, C.; Kergoat, L.; Tagesson, T.; Fensholt, R. Assessing woody vegetation trends in Sahelian drylands using MODIS based seasonal metrics. Remote Sens. Environ. 2016, 183, 215–225. [Google Scholar] [CrossRef] [Green Version]
- Malakar, N.; Hulley, G.C. A water vapor scaling model for improved land surface temperature and emissivity separation of MODIS thermal infrared data. Remote Sens. Environ. 2016, 182, 252–264. [Google Scholar] [CrossRef]
- Coll, C.; Garcia-Santos, V.; Niclos, R.; Caselles, V. Test of the MODIS land surface temperature and emissivity separation algorithm with ground measurements over a rice paddy. IEEE Trans. Geosci. Remote Sens. 2016, 54, 3061–3069. [Google Scholar] [CrossRef]
- Hulley, G.C.; Hughes, C.G.; Hook, S.J. Quantifying uncertainties in land surface temperature and emissivity retrievals from ASTER and MODIS thermal infrared data. J. Geophys. Res. Atmos. 2012, 117, D23113. [Google Scholar] [CrossRef] [Green Version]
- Waseem, M.; Ajmal, M.; Kim, T.-W. Development of a new composite drought index for multivariate drought assessment. J. Hydrol. 2015, 527, 30–37. [Google Scholar] [CrossRef]
- Van Rossum, G.; Drake, F.L. Python 3 Reference Manual; CreateSpace: Scotts Valley, CA, USA, 2009. [Google Scholar]
- Food and Agriculture Organization of the United Nations. FAOSTAT Statistical Database; FAO: Rome, Italy, 1997; Available online: https://www.fao.org/faostat/en/#data (accessed on 11 August 2022).


| CDI Interval | Classification |
|---|---|
| <0.1 | Extreme Drought |
| 0.1–0.2 | Severe Drought |
| 0.2–0.3 | Moderate Drought |
| 0.3–0.4 | Mild Drought |
| 0.4–0.5 | Near Normal |
| >0.5 | Above Normal |
| Year | CDI-3 | Drought Class |
|---|---|---|
| 2000 | 0.313 | Mild drought |
| 2001 | 0.478 | Near normal |
| 2002 | 0.403 | Near normal |
| 2003 | 0.368 | Mild drought |
| 2004 | 0.368 | Mild drought |
| 2005 | 0.511 | Above normal |
| 2006 | 0.642 | Above normal |
| 2007 | 0.528 | Above normal |
| 2008 | 0.409 | Near normal |
| 2009 | 0.454 | Near normal |
| 2010 | 0.442 | Near normal |
| 2011 | 0.000 | Extreme drought |
| 2012 | 0.601 | Above normal |
| 2013 | 0.604 | Above normal |
| 2014 | 0.261 | Moderate drought |
| 2015 | 0.722 | Above normal |
| 2016 | 0.350 | Mild drought |
| 2017 | 0.447 | Near normal |
| 2018 | 0.590 | Above normal |
| 2019 | 0.447 | Near normal |
| 2020 | 0.780 | Above normal |
| Event Order | Onset | End | Duration (Year) | Severity | Average Return Period (Year) |
|---|---|---|---|---|---|
| 1 | 2000 | 2000 | 1 | 0.087 | 3.33 |
| 2 | 2003 | 2004 | 2 | 0.064 | |
| 3 | 2011 | 2011 | 1 | 0.400 | |
| 4 | 2014 | 2014 | 1 | 0.139 |
| Station Name | Longitude | Latitude | Correlation Coefficients | |
|---|---|---|---|---|
| CDI-SPI | CDI-SPEI | |||
| Niamey-Aero | 2.17 | 13.48 | 0.64 | 0.7 |
| Tahoua | 5.30 | 14.90 | 0.74 | 0.78 |
| Diffa | 12.62 | 13.42 | 0.73 | 0.77 |
| Zinder | 8.98 | 13.78 | 0.66 | 0.67 |
Disclaimer/Publisher’s Note: The statements, opinions and data contained in all publications are solely those of the individual author(s) and contributor(s) and not of MDPI and/or the editor(s). MDPI and/or the editor(s) disclaim responsibility for any injury to people or property resulting from any ideas, methods, instructions or products referred to in the content. |
© 2023 by the authors. Licensee MDPI, Basel, Switzerland. This article is an open access article distributed under the terms and conditions of the Creative Commons Attribution (CC BY) license (https://creativecommons.org/licenses/by/4.0/).
Share and Cite
Garba, I.; Abdourahamane, Z.S.; Mirzabaev, A. A Drought Dataset Based on a Composite Index for the Sahelian Climate Zone of Niger. Data 2023, 8, 28. https://doi.org/10.3390/data8020028
Garba I, Abdourahamane ZS, Mirzabaev A. A Drought Dataset Based on a Composite Index for the Sahelian Climate Zone of Niger. Data. 2023; 8(2):28. https://doi.org/10.3390/data8020028
Chicago/Turabian StyleGarba, Issa, Zakari Seybou Abdourahamane, and Alisher Mirzabaev. 2023. "A Drought Dataset Based on a Composite Index for the Sahelian Climate Zone of Niger" Data 8, no. 2: 28. https://doi.org/10.3390/data8020028