1. Summary
Even in Europe and North America, e-marketplaces are for retailers where either they themselves or, in some cases big companies, sell all kinds of products to a single customer, in South America or in Asia [
1]; the most popular e-marketplaces such as Linio or Mercadolibre offer a person who does not own a formal company themselves the opportunity to sell products to single customers, commonly known as a C2C.
Moreover, it is important to underline how e-marketplaces have changed how shoppers buy all kinds of products, since, in a highly competitive environment where the net margins are narrow, the implementation of several kinds of marketing strategies by e-marketplaces becomes critical. Some of the most common strategies put in place by those e-businesses are customer satisfaction [
2,
3], brand equity [
4], brand loyalty [
5], and trust [
2]. Furthermore, a common marketing strategy used by online businesses is micro-segmentation.
Micro-segmentation allows e-retailers to find profitable niche markets [
5], communicate almost individually to each customer [
6], and adapt offers and promotions to each customer according to their needs and personal interests. Nevertheless, studies of micro-segmentation in marketing remain scarce, and this study has the objective of contributing to the increase in knowledge surrounding the construct. Regarding the literature review, customer satisfaction was defined as “a cognitive or affective reaction” that emerges as a response to a single or prolonged set of service encounters [
7]. Brand equity was initially conceptualised by Brady et al. [
8] and referred to as the perception of a brand that can be extended to superiority. The following construct included in the search model is trust, which is defined as a disposition to depend on an exchange partner whom someone has confidence with (Moorman et al. [
9]), as well as the partner’s perceived reliability and integrity [
10]. The last variable considered in this research is brand loyalty, defined as the attachment between the consumer and a brand [
11] and which reflects the consumer’s preferences for certain brands [
12].
The data was collected through an online questionnaire distributed to people who bought a product in a C2C e-marketplace in the six months before the data collection, which took place for five weeks at the end of the year 2021. Social media platforms such as WhatsApp, Instagram, Facebook, and Tik-Tok were used to spread the questionnaire. The dataset was used to develop a PLS-SEM with six hypotheses. Three hypotheses were set up to validate the positive influence of the micro-segmentation strategies put in place by the C2C e-marketplaces on customer satisfaction, trust, brand equity and brand loyalty. The other three hypotheses were proposed to find how customer satisfaction, brand equity, and trust positively influence brand loyalty.
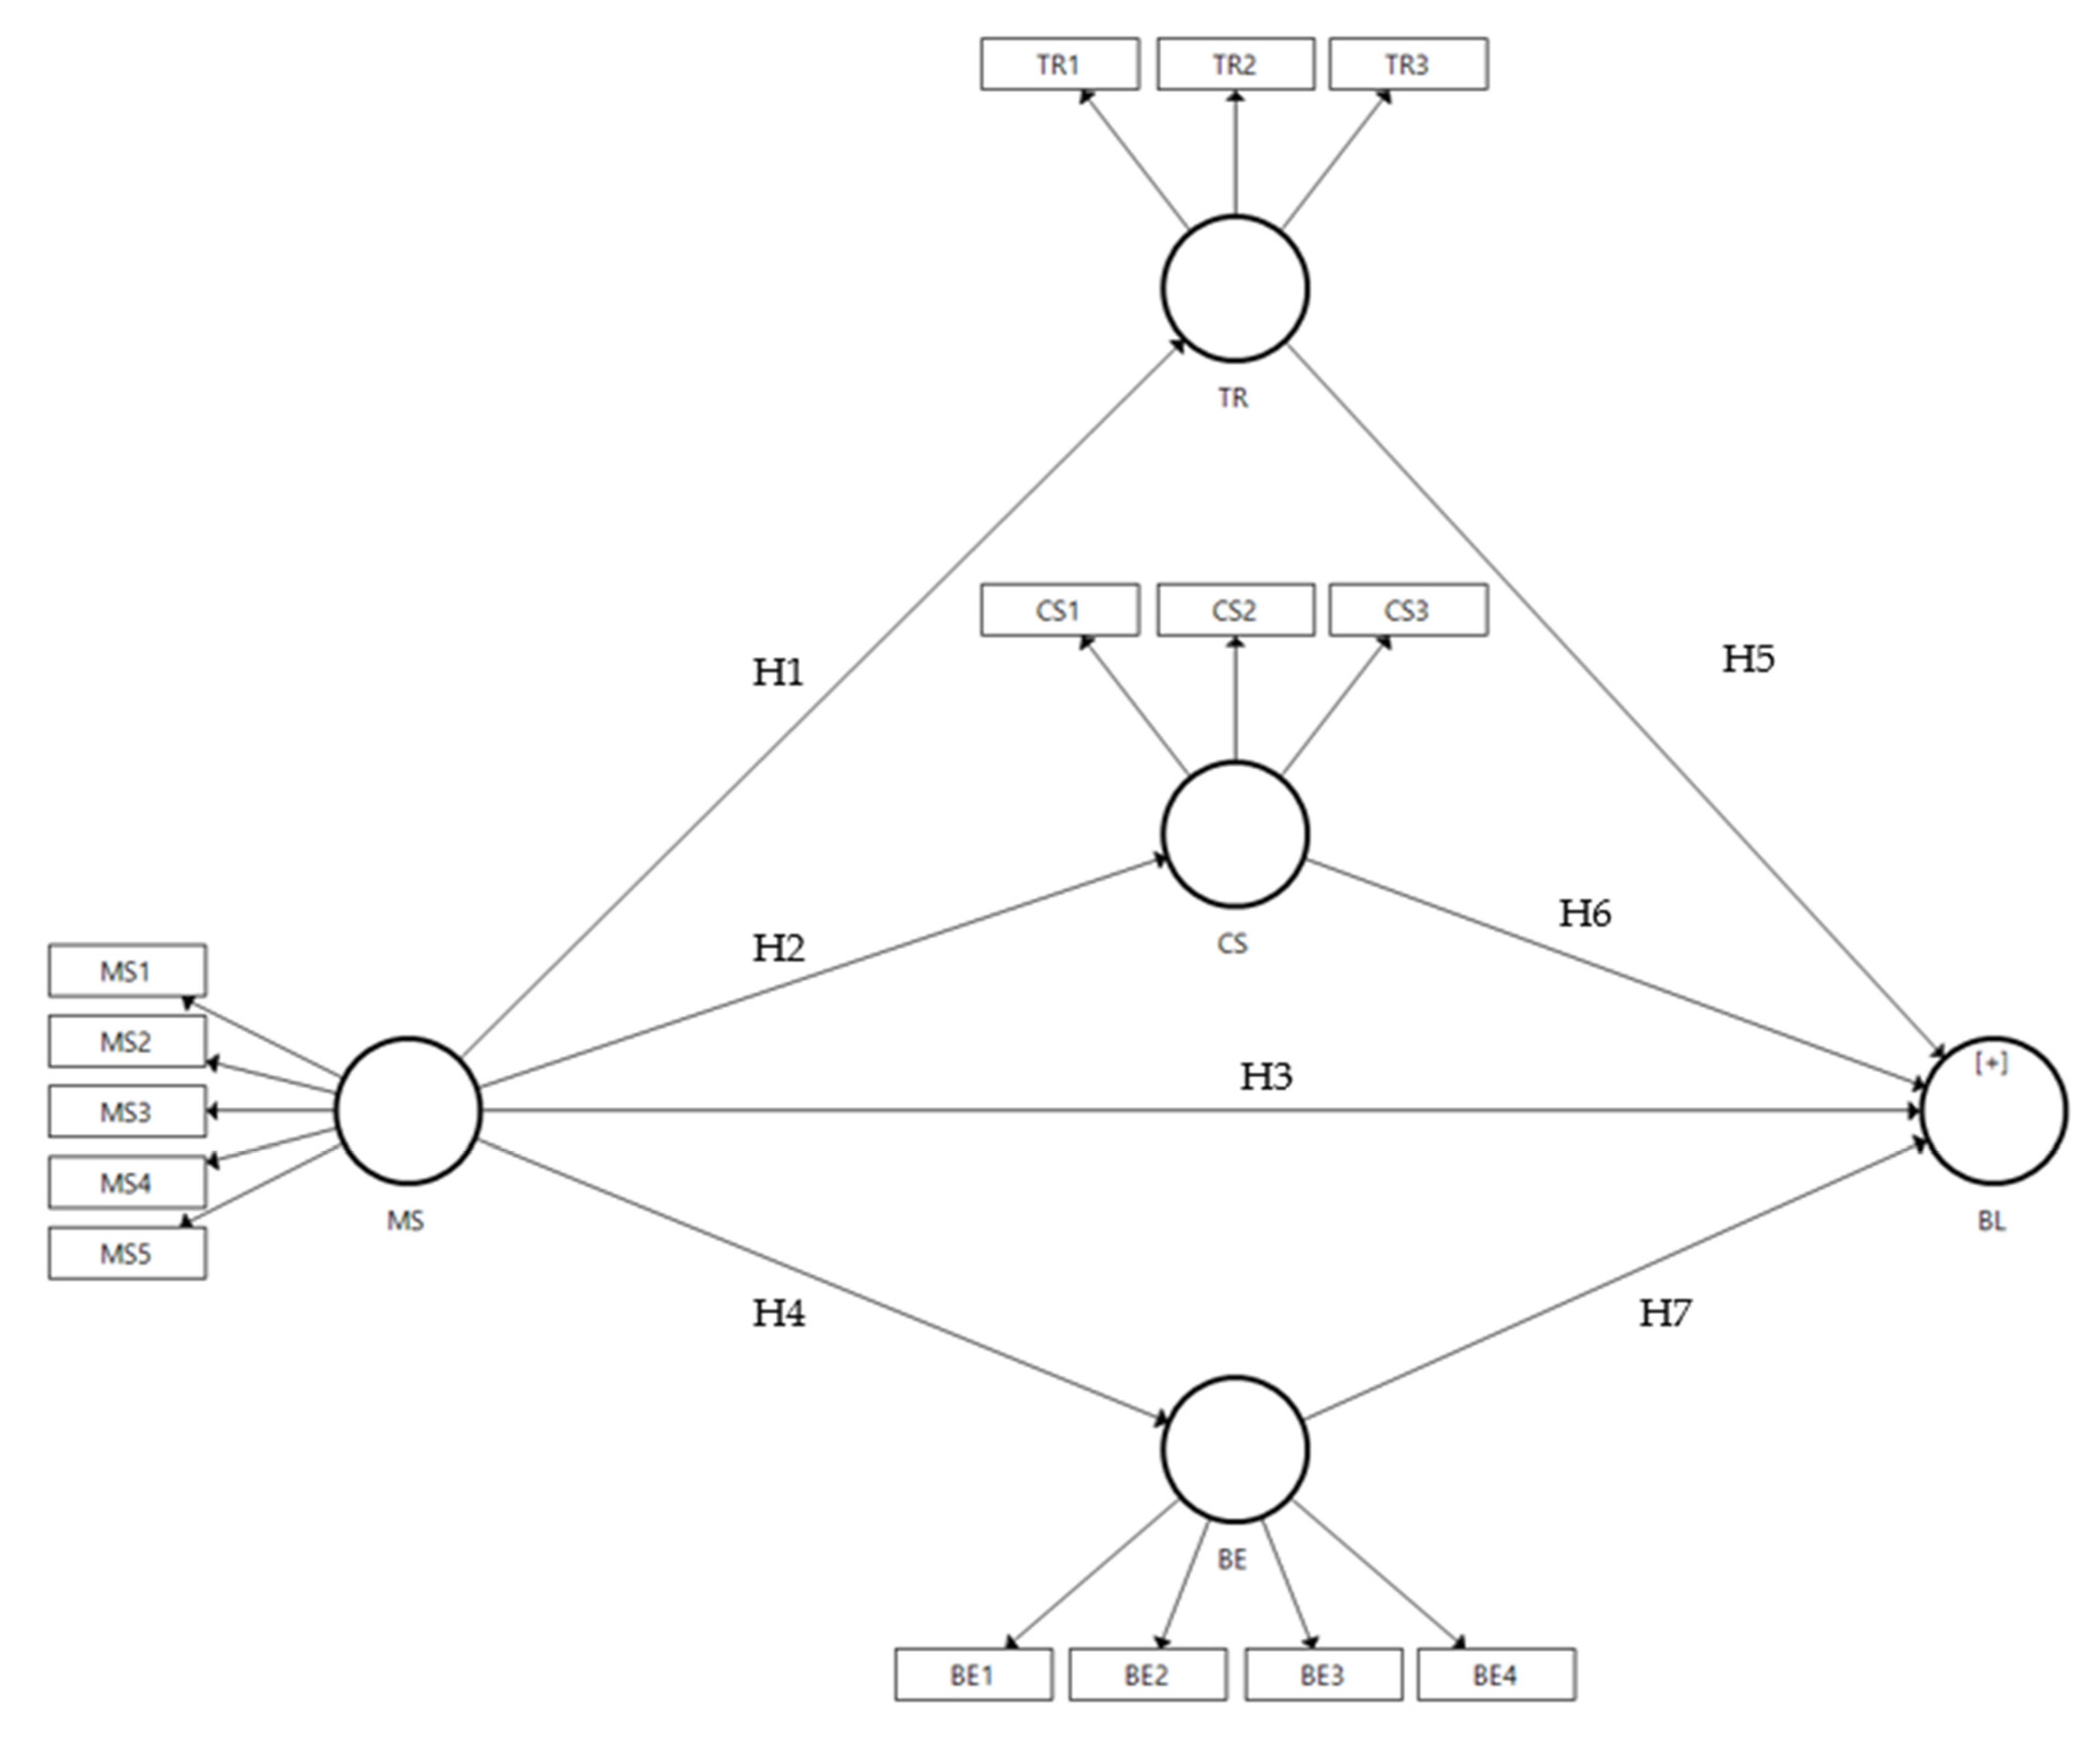
The first hypothesis (H1) postulated that micro-segmentation in C2C e-marketplaces positively influenced trust. The second hypothesis (H2) hypothesised that micro-segmentation in C2C e-marketplaces positively influenced customer satisfaction. That micro-segmentation positively influenced brand loyalty was the third hypothesis formulated. Despite the fact that micro-segmentation is a variable recently proposed as a Tier 1 research priority for modern marketing by the Marketing Science Institute (MSI) [
2,
13], the amount of research about the construct remains limited. Therefore, the amount of previous research supporting the hypotheses is scarce. Nevertheless, the fourth hypothesis was that micro-segmentation influenced positively brand equity. The first four hypotheses were supported by the previous literature findings [
14,
15,
16].
The fifth hypothesis (H5) was supported by the results of past literature concerning websites [
17,
18,
19] and postulated that trust in a C2C e-marketplace had a positive influence on brand loyalty. That customer satisfaction in a C2C e-marketplace positively influenced brand loyalty was the sixth hypothesis (H6). The hypothesis was supported by the previous findings of Voss et al. [
20], Beerli et al. [
21] and Sai Vijay et al. [
22]. The final hypothesis (H7) posited that brand equity in a C2C e-marketplace positively influenced brand loyalty. As the previous hypotheses, H7 was postulated based on the previous literature equity [
23,
24].
2. Data Description
The data of this study is divided into three parts. The first section includes data collected about the sociodemographic and purchase behaviour of the customers of C2C e-marketplaces. Gender, range of age, C2C e-marketplace preference, and purchasing preference were evaluated in this part. Detailed information from this part can be found in
Table 1.
The second part of the data description comprises the evaluation of nineteen items by the participants. Three items were used to evaluate brand equity (BE), trust (TR), and customer satisfaction (CS). Four items measured brand loyalty, and five items micro-segmentation (MS). Next, the nineteen items are present, both in English and Spanish. BE1. “I am loyal to buying on this C2C e-marketplace”, BE2. “I have a positive attitude about this C2C e-marketplace”, BE3. “I feel that this C2C e-marketplace has a positive image”, BE4. “I consider that this C2C e-marketplace delivers a correct quality of service”, BE5. “I am willing to pay more for a product in a C2C e-marketplace than on another website”, TR1. “I trust the brands the sellers sell on this C2C e-marketplace”, TR2. “I recognise the quality and reliability of the products sold by sellers on this C2C e-marketplace”, TR3. “I think brands sold by sellers in this C2C e-marketplace are very good and trustworthy”, CS1. “The service in this C2C e-marketplace is excellent”, CS2. “I am very satisfied with my shopping experience at this C2C e-marketplace”, CS3. “This C2C e-marketplace meets my expectations”, BL1. “I prefer this C2C e-marketplace to others”, BL2. “When I go shopping, I don’t even consider the competing C2C e-marketplaces”, BL3. “If my favourite C2C e-marketplace is out of products, I’ll postpone buying”, BL4. “I’ll do without rather than buy from another C2C e-marketplace”, MS1. “I always find the product(s) I am looking for in this C2C e-marketplace”, MS2. “I perceived that there were personalised recommendations in this C2C e-marketplace”, MS3. “I received personalised advertising or promotions of products that are interesting to me after visiting this C2C e-marketplace”, MS4. “I perceived that this C2C e-marketplace constantly updates its personalised recommendations based on my searches”, MS5.” I’ve encountered a product I like or want without having searched for it”. BE1. “Soy leal al mercado electrónico C2C”, BE2. “Tengo una actitud positiva hacia al mercado electrónico C2C”, BE3. “Siento que este mercado electrónico C2C tiene una imagen positiva”, BE4. “Considero que este mercado electrónico C2C ofrece una calidad de servicio correcta”, BE5. “Estoy dispuesto a pagar más por un producto que se vende en un mercado electrónico C2C que en otro sitio web”, TR1. “Confío en las marcas que los vendedores venden en este mercado electrónico C2C”, TR2. “Reconozco que los productos vendidos por los vendedores en este mercado electrónico C2C son de calidad y fiables”, TR3. “Creo que las marcas que venden los vendedores en este mercado electrónico C2C son muy buenas y confiables”, CS1. “El servicio de este mercado electrónico C2C es excelente”, CS2. “Estoy muy satisfecho con mi experiencia de compra en este mercado electrónico C2C”, CS3. “Este mercado electrónico C2C cumple con mis expectativas”, BL1. “Prefiero este mercado electrónico C2C que otros”, BL2. “Cuando voy de compras, ni considero los mercados electrónicos C2C de la competencia”, BL3. “Si mi mercado electrónico C2C favorito se queda sin productos, pospondré la compra”, BL4. “Prescindiré del producto que quiero, en lugar de comprar en otro mercado electrónico C2C”, MS1. “Siempre encuentro los productos que busco en este mercado electrónico C2C”, MS2. “Percibí que había recomendaciones personalizadas en este mercado electrónico C2C”, MS3. “Recibí publicidad personalizada o promociones de productos que me interesan después de visitar este mercado electrónico C2C”, MS4. “Me di cuenta de que este mercado electrónico C2C actualiza constantemente sus recomendaciones personalizadas sobre mis búsquedas”, MS5. “He encontrado un producto que me gusta o quiero sin haberlo buscado”. The descriptive measures of all items such as mean and standard deviation are shown in
Table 2.
The third stage of the data description includes the data evaluation using a variance-based approach. Consequently, a Partial Least Square–Structural Equation Model PLS-SEM was used (See
Figure 1), since this combines regression-based path analysis with principal components [
25], allowing the measurement and estimation of complex models with many constructs. The results of the PLS-SEM were evaluated in two stages.
Table 2,
Table 3 and
Table 4 summarise the results of the first phase, consisting of the evaluation of the reflective measurement of the model. The reliability and validity of the measures were evaluated using the outer loading estimation, Cronbach´s Alpha, Rho A and Convergence Validity (CR). As shown in
Table 1, all the measures were accurate [
26]. The average variance started (AVE) was estimated to evaluate the data´s validity. All items had an AVE above 0,5. Finally, in the first stage the discriminant validity was checked using two statistical methods, the Fornell-Larcker Criterion (See
Table 3) and the Heterotrait-Monotrait Ratio (HTMT) (See
Table 4). Both methods confirmed the discriminant validity of the reflective model [
27].
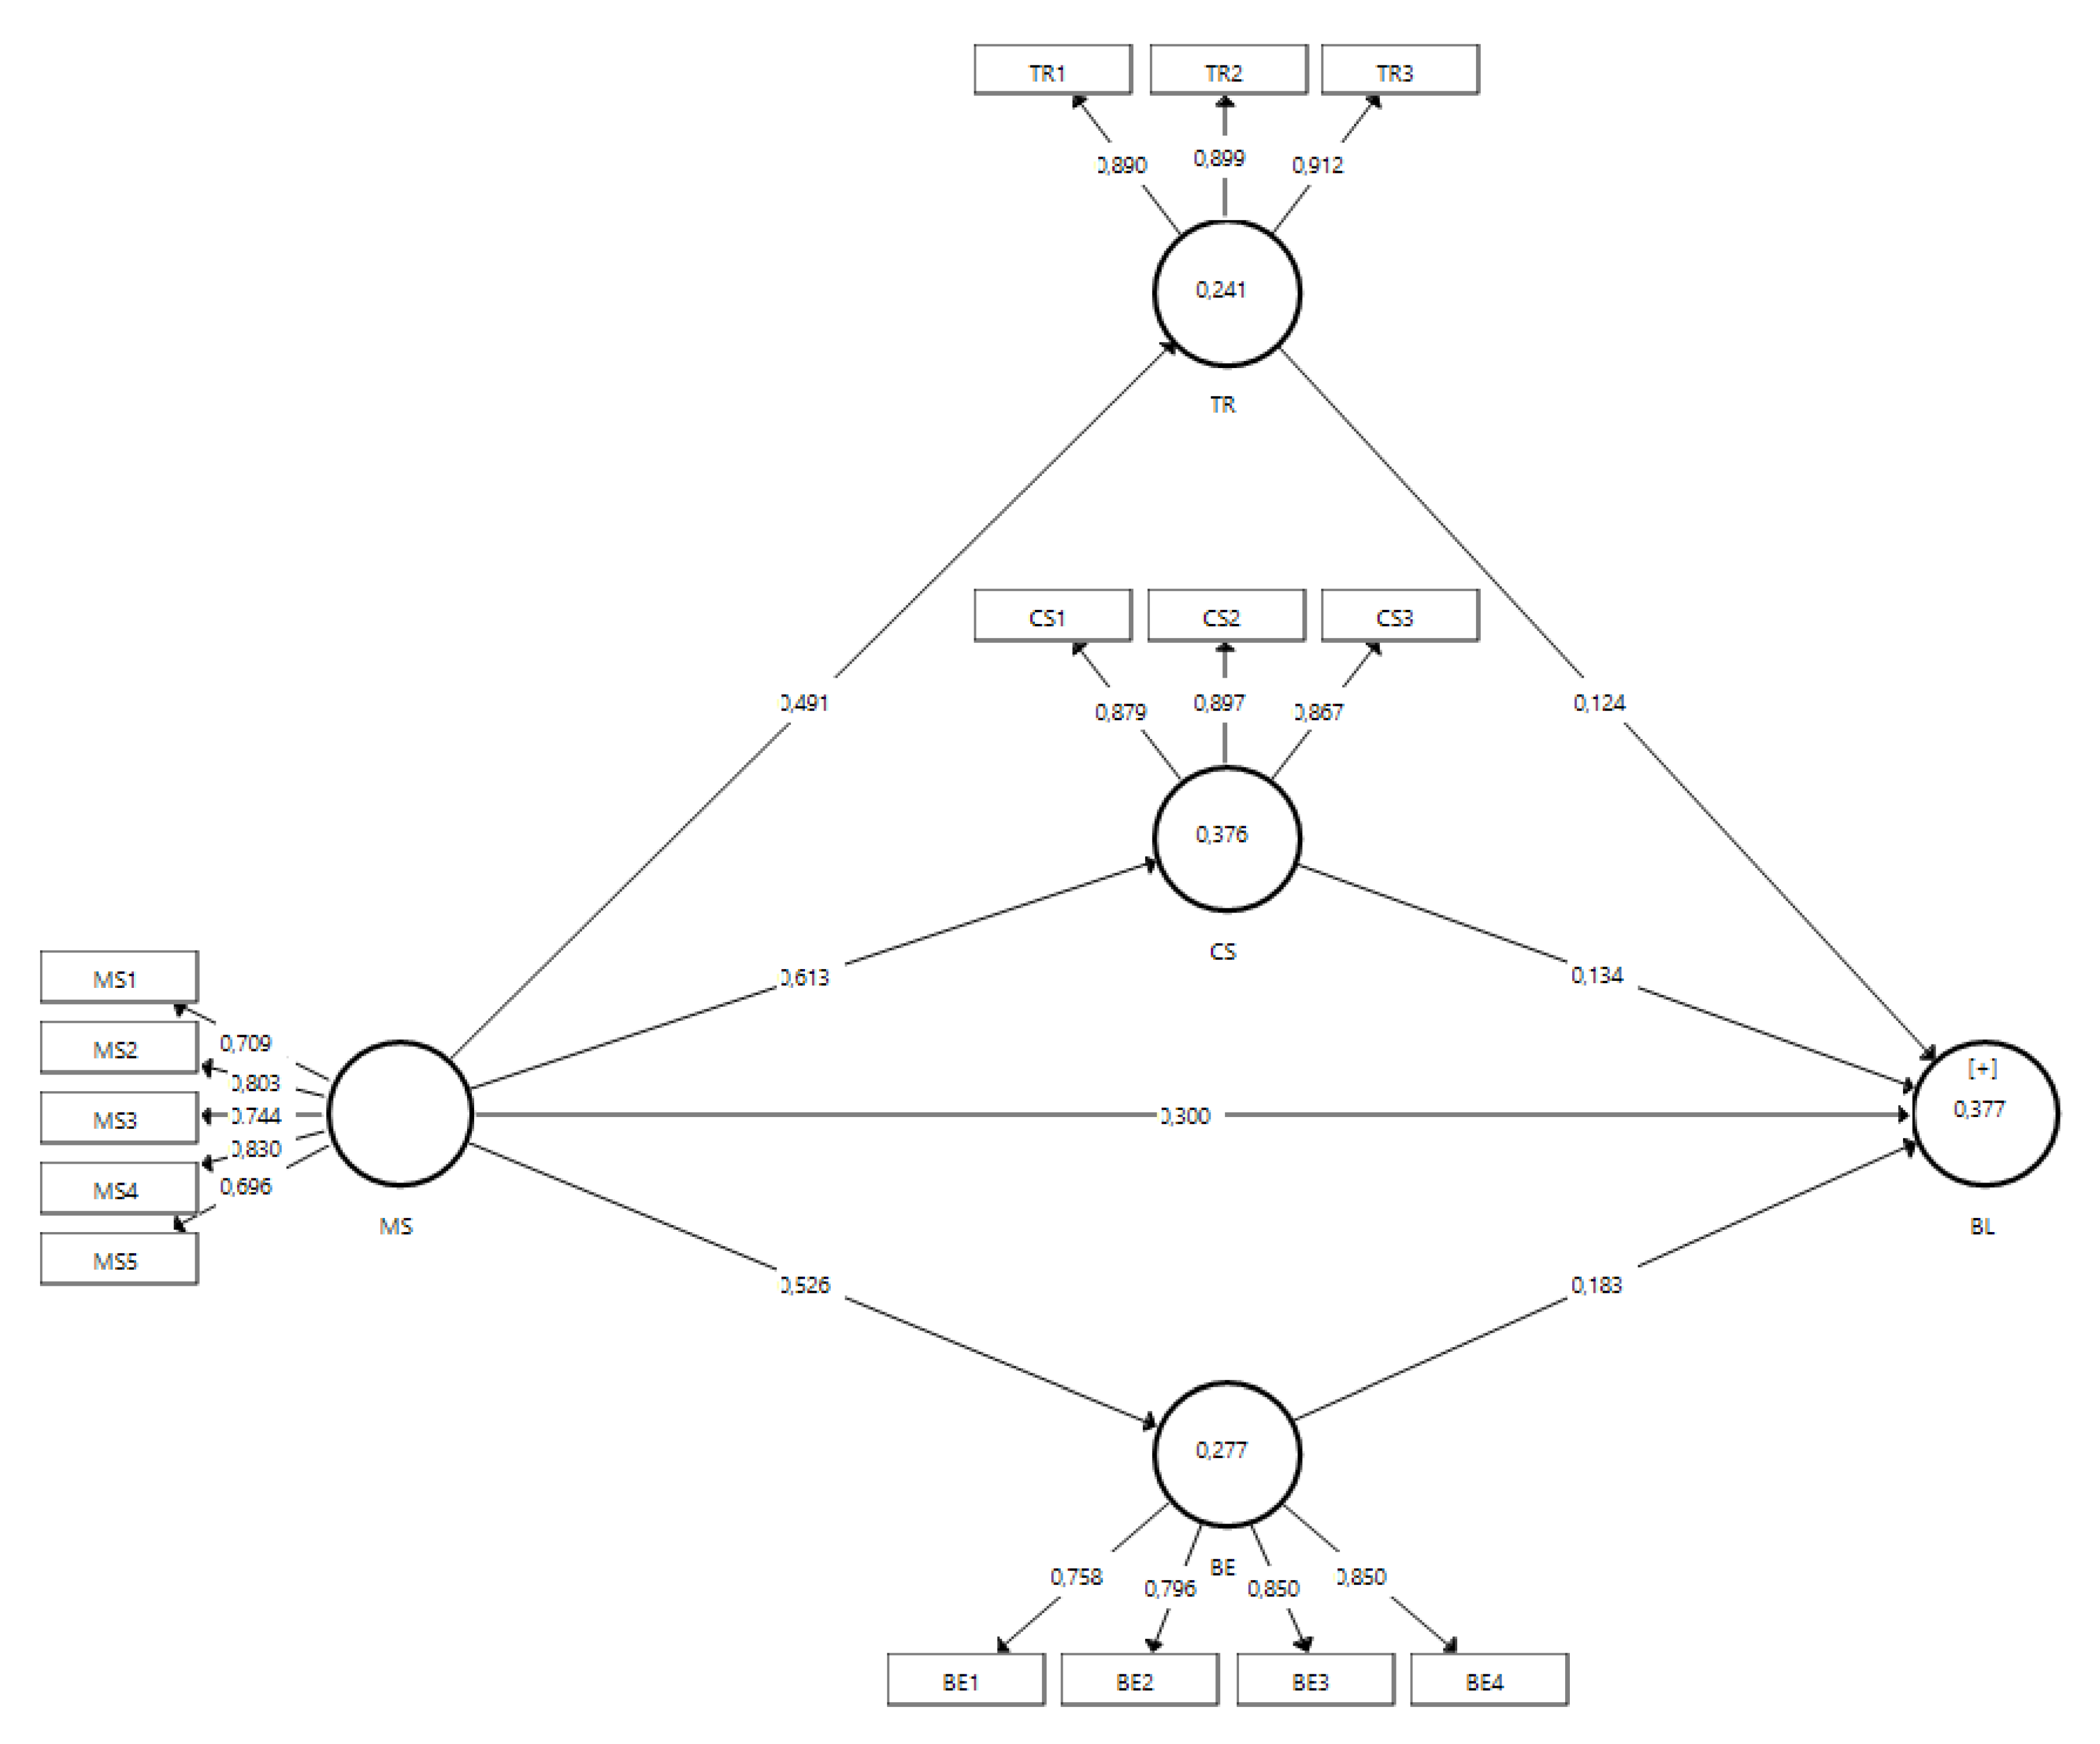
In the second stage, the results of the structural model were estimated (See
Table 5 and
Figure 2). To validate the PLS model, the R² of TR, BL, CS and BE was calculated (See
Table 2) [
28,
29]. The seven hypotheses were tested using a Bootstrapping of 10,000 samples and a
p-value of 0.05. As can be observed in
Table 5, six hypotheses were supported, while one was rejected.
3. Methods
The methods section is divided into three subsections. First, participants provide information about the population and the sample. Secondly, instruments refers to the questionnaire and its structure. Finally, data collection offers information about the techniques used to collect the data.
3.1. Participants
The population was C2C e-marketplace customers. Specifically, the target population for this study were personal customers who bought all kinds of products, new, second- hand or both, from other users (not companies). Both the sellers and the buyers did the transactions through the most popular e-marketplaces in Peru, such as Linio, Amazon, or Facebook Marketplace, in the last six months before the data collection. A total of 403 people correctly answered all the questions included in an online questionnaire. As can be observed in
Table 1, the most popular C2C e-marketplace was Facebook Marketplace (161 answers) followed by Amazon (86 answers). In reference to purchasing preference, most respondents preferred to buy new products (66.3%). In terms of the age range, the sample shows that 53.6% of the respondents were in the age range between 18 to 29 years old. Finally, their gender was asked, and according to the answers, 277 women and 196 men completed the online survey.
3.2. Instruments
To understand how micro-segmentation (MI) influences trust, brand loyalty, brand equity, and customer loyalty of customers of C2C e-marketplaces, and to simultaneously study what the antecedents of brand loyalty are, a questionnaire was developed. The instrument was divided into three sections. First of all, a filter question was included to ensure that people answering the survey complied with the target population. In the second section, four questions were made to know the sociodemographic characteristics and purchase habits of the sample. Gender and age range were asked in the sociodemographic data. Meanwhile, preferences of the C2C e-marketplace and the nature of the product (new or second-hand) were questioned to better understand the sample purchasing behaviour. The third block in the questionnaire was used to collect data from the target population’s evaluation of the five variables included in the research model.
The five constructs were evaluated using Likert scales from 1 to 5, where 1 meant totally disagree, and 5 totally agree. All the scales used in this research were previously validated in other studies. Nevertheless, all scales were adapted to a C2C context. Moreover, since all the scales were originally written in English they were translated into Spanish, since the target population was not familiar with the English language.
The scale from Brady et al. [
8] was adapted to measure Brand Equity, and this scale was composed of five items. Trust composed of four items was adapted from the original scale of Zhao et al. [
30]. The Vásquez and Vera-Martínez [
31] scale was chosen to collect data of customer satisfaction; the original scale was designed with three items. Brand Loyalty was evaluated with four items, as Carroll & Ahuvia [
32] proposed in their study. The last variable, micro-segmentation, was measured using a scale developed by the authors. Before the micro-segmentation scale was included in the final instrument, a pilot study was conducted on 20 C2C e-marketplace users to confirm that the new scale accurately measured micro-segmentation. The new scale was composed of five items. All five items evaluated how users perceived the micro-segmentation’s actions put in place by the e-marketplaces.
3.3. Data Collection
The data collection was done through an auto-assisted online survey since it was perceived by the authors as the most suitable method to reach the study population at a reasonable cost. Moreover, the fact that the research population was familiar with online shopping determined the collection of the data in an online questionnaire. Data were collected during five weeks at the end of the year 2021. To distribute the online questionnaire, the ProQuest online survey platform [
33] was used. A snowball and viral technique were chosen to spread the online survey to the population. Social media sources such as WhatsApp, Facebook, and Instagram were the main distribution sources.
The final sample was composed of 473 people. Those participants answered all the questions correctly. The 473 records were edited, coded, and transformed from an initial excel file with the extension.xls to a new one with the extension .csv. The final file was analysed with the software Smart-PLS version 3.3.7 [
34]. The measure of the structural model and the reflective measures of the model were calculated.
4. Conclusions
Even though this research is preliminary in nature, it contributes to the framework of research previously developed mainly in the B2C context, since research in the consumer-to-consumer dynamic is scarce. For that reason, as well as because relevant authors suggested it in previous research, the first contribution has been the selection of variables for this study, such as brand loyalty, trust, brand equity, customer satisfaction, and especially the micro-segmentation, which has been cited as a tier 1 research priority for the academia.
The first contribution of this study has been the reinforcement of the previous findings about the relationship between customer satisfaction and brand loyalty and the strong effect the former has on the latter, which validates the hypothesis and the contributions of Anderson and Srinivasan [
35], Beerli et al. [
21], Veloutsou [
36], Voss et al. [
20], and Wang et al. [
37].
Therefore, it can be inferred that a correct micro-segmentation strategy will establish brand loyalty, customer satisfaction, trust, and brand equity. In order for this to be achieved, it is essential that C2C e-marketplaces work efficiently, implementing micro-segmentation strategies to ensure customer satisfaction, which enables potential circumstances in which consumers may lose their attributed trust, since the C2C dynamic requires more control methods to reduce the risks of unethical sellers. Thus, it can be identified that consumers of a C2C e-marketplace will become brand loyal if they obtain a satisfactory experience with the purchase, trusting the brand and determining that they are valuable. However, this loyalty is very volatile, since a bad experience will lead consumers to cease such loyalty, despite their previous experience with the brand.
Furthermore, another contribution made by this study is the confirmation of the positive influence trust has over brand loyalty. This aligns with the concept that overall trust can help decrease the perceived risk of transactions with a vendor within the e-commerce dynamic [
38,
39,
40].
Moreover, the research allows us to infer the importance of the e-marketplace in itself, which requires a well-developed brand equity that is aligned with the micro-segmentation strategies. In effect, improving the brand positioning, based on its positive micro-segmentation, will potentially lead consumers to become more prone to loyalty and, therefore, make more frequent repurchase transactions.
Accordingly, this research recommends that companies invest resources in further-developing their C2C e-marketplaces and improve on micro-segmentation tools that enhance brand equity and consequently affect customer satisfaction, trust, and brand loyalty. One particular tool suggested is the implementation of seller reviews amongst their consumer’s purchase records, in addition to a filter system that deactivates accounts that deliver below-average customer satisfaction levels. This is believed to predict an improvement in the seller’s attention standards and, consequently, in the attributed trust towards the e-marketplace’s brand. These recommendations can significantly enhance the overall online purchase market and loyalty rate for both the consumer-to-consumer and business-to-consumer dynamic. Moreover, emerging markets show considerable potential since there is a latent increment of micro-companies and informal workers who actively partake in the C2C e-marketplace seller dynamic. This is considered to provide substantial opportunity for the local e-marketplaces and contribute to the area’s economic growth.
5. Limitations and Future Research
This study has a series of limitations, all of which could be covered in future research. First, it intended to carry out a study and data collection from all of Latin America; however, it could only be carried out in Perú. For that reason, it is recommended to expand the sample to other Latin-American emerging markets to identify how the variables behave in these scenarios. Moreover, it was a non-probabilistic sampling. Therefore, it is suggested to do a probabilistic sampling to universalise the results.
Furthermore, the study of micro-segmentation as a moderating variable upon the other construct in the research is suggested, since it is a relatively new and relevant concept for modern marketing. In addition, for future studies, it is crucial to delve into the effect of this variable on the scales. Since the research is based on a preliminary scale, studying micro-segmentation in-depth will contribute to improving the scale in measure. Finally, it is suggested that the research is opened to other markets. These constructs can be analysed in important sectors of the market, as well as specific categories. Because the results may be different, this will accomplish relevant contributions to marketing. For example, these variables can also be studied in the context of C2C e-marketplaces for cars, services, and even on a B2B e-marketplace spectrum. Lastly, the second-hand sector is considered to be an essential field of study with these variables, since this type of sales interaction is predominant within the consumer-to-consumer transaction dynamic.
6. User Notes
The dataset measures the customer’s perception of the micro-segmentation strategies put in place by C2C e-marketplaces that contribute to customer satisfaction, brand equity, brand loyalty, and trust. The sample size of 473 people and the optimal results of the validity and reliability analyses warrant the quality of the data and allow the adoption of multiple statistical studies. For example, a multi-group analysis could be considered (MGA). Moreover, the rich sociodemographic data collected could be used to include moderator variables such as gender and preferred C2C e-marketplace. However, the dataset could have some limitations that could be considered. Data was collected using a non-probabilistic method and the responders were from Peru, which could condition the results since the C2C e-marketplace customer perceptions could be different in other countries.
Author Contributions
Conceptualization, S.C.-S., N.G.-C. and M.L.L.-Z.; methodology, S.C.-S., N.G.-C. and M.L.L.-Z.; software, M.L.L.-Z.; validation, M.L.L.-Z.; formal analysis, M.L.L.-Z.; data curation, M.L.L.-Z.; writing—original draft preparation, M.L.L.-Z.; writing—review and editing, M.L.L.-Z.; supervision, M.L.L.-Z.; project administration, M.L.L.-Z.; funding acquisition, M.L.L.-Z. All authors have read and agreed to the published version of the manuscript.
Funding
Universidad Peruana de Ciencias Aplicadas/UPC-EXPOST-2022-2.
Institutional Review Board Statement
Not applicable.
Informed Consent Statement
Informed consent was obtained from all subjects involved in the study. In the online questionnaire, all responders were asked for their permission to collect the data and analysis it globally. No personal or confidential information was asked for or collected during the research process.
Data Availability Statement
Acknowledgments
We would like to thank the Research Directorate of the Universidad Peruana de Ciencias Aplicadas for the support provided to carry out this research work through the UPC-EXPOST-2022-2.
Conflicts of Interest
The authors declare no conflict of interest.
References
- Ou, T.Y.; Perng, C. Constructing the e-commerce clustering platform and innovative business model-a case study for chinese herbal medicine industry. Int. J. Electron. Bus. 2014, 12, 136–144. [Google Scholar]
- Jones, K.; Leonard, L.N.K. Trust in consumer-to-consumer electronic commerce. Inf. Manag. 2008, 45, 88–95. [Google Scholar] [CrossRef]
- Pappu, R.; Quester, P. Does customer satisfaction lead to improved brand equity An empirical examination of two categories of retail brands. J. Prod. Brand Manag. 2006, 15, 4–14. [Google Scholar] [CrossRef] [Green Version]
- Dick, A.S.; Basu, K. Customer loyalty: Toward an integrated conceptual framework. J. Acad. Mark. Sci. 1994, 22, 99–113. [Google Scholar] [CrossRef]
- Wilson, R.; Pettijohn, J.B. Using keyword research software to assist in the search for high-demand, low-supply online niches: An overview. J. Internet Commer. 2007, 6, 101–117. [Google Scholar] [CrossRef]
- Holtzhausen, D. Datafication: Threat or opportunity for communication in the public sphere? J. Commun. Manag. 2016, 20, 21–36. [Google Scholar] [CrossRef]
- Rust, R.T.; Oliver, R.L. Service Quality: Insights and Managerial Implications from the Frontier. Serv. Qual. New Dir. Theory Pract. 1994, 7, 1–19. [Google Scholar] [CrossRef]
- Brady, M.K.; Cronin, J.J.; Fox, G.L.; Roehm, M.L. Strategies to offset performance failures: The role of brand equity. J. Retail. 2008, 84, 151–164. [Google Scholar] [CrossRef]
- Moorman, C.; Zaltman, G.; Deshpande, R. Relationships between Providers and Users of Market Research: The Dynamics of Trust within and between Organizations. J. Mark. Res. 1992, 29, 314. [Google Scholar] [CrossRef]
- Morgan, R.M.; Hunt, S.D. The Commitment-Trust Theory of Relationship Marketing. J. Mark. 1994, 58, 20. [Google Scholar] [CrossRef]
- Aaker, D.A. Measuring Brand Equity across Products and Markets. Calif. Manag. Rev. 1996, 38, 102–120. [Google Scholar] [CrossRef]
- Chaudhuri, A.; Holbrook, M.B. The Chain of Effects from Brand Trust and Brand Affect to Brand Performance: The Role of Brand Loyalty. J. Mark. 2001, 65, 81–93. [Google Scholar] [CrossRef] [Green Version]
- Gruen, T.W.; Osmonbekov, T.; Czaplewski, A.J. eWOM: The impact of customer-to-customer online know-how exchange on customer value and loyalty. J. Bus. Res. 2006, 59, 449–456. [Google Scholar] [CrossRef]
- Keller, K.L. Conceptualizing, Measuring, and Managing Customer-Based Brand Equity. J. Mark. 1993, 57, 1–22. [Google Scholar] [CrossRef]
- Lemon, K.N.; Mark, T. Basis of Customer Segmentation. J. Relatsh. Mark. 2006, 5, 55–69. [Google Scholar] [CrossRef]
- Ziliani, C. Retail micro-marketing: Strategic advance or gimmick? Int. Rev. Retail Distrib. Consum. Res. 2011, 10, 355–368. [Google Scholar] [CrossRef]
- Ribbink, D.; Streukens, S.; van Riel, A.C.R.; Liljander, V. Comfort your online customer: Quality, trust and loyalty on the internet. Manag. Serv. Qual. Int. J. 2004, 14, 446–456. [Google Scholar] [CrossRef] [Green Version]
- Chaparro-Peláez, J.; Hernández-García, Á.; Urueña-López, A. The Role of Emotions and Trust in Service Recovery in Business-to-Consumer Electronic Commerce. J. Theor. Appl. Electron. Commer. Res. 2015, 10, 77–90. [Google Scholar] [CrossRef] [Green Version]
- Flavián, C.; Guinalíu, M.; Gurrea, R. The role played by perceived usability, satisfaction and consumer trust on website loyalty. Inf. Manag. 2006, 43, 1–14. [Google Scholar] [CrossRef]
- Voss, G.B.; Godfrey, A.; Seiders, K. How Complementarity and Substitution Alter the Customer Satisfaction–Repurchase Link. J. Mark. 2010, 74, 111–127. [Google Scholar] [CrossRef]
- Beerli, A.; Martín, J.D.; Quintana, A. A model of customer loyalty in the retail banking market. Eur. J. Mark. 2004, 38, 253–275. [Google Scholar] [CrossRef]
- Vijay, T.S.; Prashar, S.; Sahay, V. The Influence of Online Shopping Values and Web Atmospheric Cues on E-Loyalty: Mediating Role of E-Satisfaction. J. Theor. Appl. Electron. Commer. Res. 2019, 14, 1–15. [Google Scholar] [CrossRef] [Green Version]
- Torres, A.; Tribó, J.A. Customer satisfaction and brand equity. J. Bus. Res. 2011, 64, 1089–1096. [Google Scholar] [CrossRef] [Green Version]
- Chang, T.Y.; Horng, S.C. Conceptualizing and measuring experience quality: The customer’s perspective. Serv. Ind. J. 2010, 30, 2401–2419. [Google Scholar] [CrossRef]
- Hair, J.F., Jr.; Sarstedt, M.; Ringle, C.M.; Gudergan, S.P. Advanced Issues in Partial Least Squares Structural Equation Modeling; Sage publications: Thousand Oaks, CA, USA, 2017. [Google Scholar]
- Hair, T.; Sarstedt, F.; Hult, C. A Primer on Partial Least Squares Structural Equation Modeling. Long Range Plann 2017, 46, 184–185. [Google Scholar] [CrossRef]
- Hair, J.; Ringle, C.; Sarstedt, M. PLS-SEM: Indeed and Silver Bullet. J. Mark. Theory Pract. 2011, 19, 139–152. [Google Scholar] [CrossRef]
- Sarstedt, M.; Ringle, C.M.; Hair, J.F. Handbook of Market Research; Springer: Cham, Switzerland, 2017. [Google Scholar] [CrossRef]
- Sarstedt, M.; Ringle, C.M.; Hair, J.F. Partial Least Squares Structural Equation Modeling. In Handbook of Market Research; Springer International Publishing: Cham, Switzerland, 2017; pp. 1–40. [Google Scholar] [CrossRef]
- di Zhao, J.; Huang, J.S.; Su, S. The effects of trust on consumers’ continuous purchase intentions in C2C social commerce: A trust transfer perspective. J. Retail. Consum. Serv. 2019, 50, 42–49. [Google Scholar] [CrossRef]
- Vásquez, F.; Vera-Martínez, J. From E-Quality and Brand Perceptions to Repurchase: A Model to Explain Purchase Behaviour in a Web-Store. J. Theor. Appl. Electron. Commer. Res. 2020, 15, 20–36. [Google Scholar] [CrossRef]
- Carroll, B.A.; Ahuvia, A.C.; Carroll, B.A.; Ahuvia, A.C. Some antecedents and outcomes of brand love. Mark. Lett. 2006, 17, 79–89. [Google Scholar] [CrossRef]
- QuestionPro Latinoamérica QuestionPro; Software Para Encuestas Questionpro: Beaverton, Oregon, 2021.
- Ringle, C.M.; Wende, S.; Becker, J.-M. SmartPLS 3. Boenningstedt: SmartPLS GmbH. 2015. Available online: http://www.smartpls.com (accessed on 14 October 2022).
- Anderson, R.E.; Srinivasan, S.S. E-Satisfaction and E-Loyalty: A Contingency Framework. Psychol. Mark. 2003, 20, 123–138. [Google Scholar] [CrossRef]
- Veloutsou, C. Brand evaluation, satisfaction and trust as predictors of brand loyalty: The mediator-moderator effect of brand relationships. J. Consum. Mark. 2015, 32, 405–421. [Google Scholar] [CrossRef] [Green Version]
- Wang, Y.-S.; Tang, T.-I.; Tang, J. An Instrument for Measuring Customer Satisfaction Toward Web Sites That Market Digital Products and Services. J. Electron. Commer. Res. 2001, 2, 89–102. [Google Scholar]
- Gefen, D.; Karahanna, E.; Straub, D.W. Trust and tam in online shopping: An integrated model. MIS Q. 2003, 27, 51–90. [Google Scholar] [CrossRef]
- Jarvenpaa, S.L.; Tractinsky, N.; Vitale, M. Consumer trust in an Internet store. Inf. Technol. Manag. 2000, 1, 45–71. [Google Scholar] [CrossRef]
- Pavlou, P.A.; Fygenson, M. Understanding and predicting electronic commerce adoption: An extension of the theory of planned behavior. MIS Q. 2006, 30, 115–143. [Google Scholar] [CrossRef]
| Disclaimer/Publisher’s Note: The statements, opinions and data contained in all publications are solely those of the individual author(s) and contributor(s) and not of MDPI and/or the editor(s). MDPI and/or the editor(s) disclaim responsibility for any injury to people or property resulting from any ideas, methods, instructions or products referred to in the content. |
© 2023 by the authors. Licensee MDPI, Basel, Switzerland. This article is an open access article distributed under the terms and conditions of the Creative Commons Attribution (CC BY) license (https://creativecommons.org/licenses/by/4.0/).


