
How to Reach Green Word of Mouth through Green Trust, Green Perceived Value and Green Satisfaction
 and
and
Abstract
:1. Summary
2. Data Description
3. Methods
4. Conclusions
Author Contributions
Funding
Institutional Review Board Statement
Informed Consent Statement
Data Availability Statement
Acknowledgments
Conflicts of Interest
References
- Pareja, J.; Roy, Q. Valor Percibido. Riesgo Verde y Confianza Verde en Relación a la Intención de Compra de Productos Green; Universidad Peruana de Ciencias Aplicadas: Lima, Peru, 2021. [Google Scholar]
- Kautish, P.; Sharma, R. Study on relationships among terminal and instrumental values, environmental consciousness and behavioral intentions for green products. J. Indian Bus. Res. 2018, 13, 1–29. [Google Scholar] [CrossRef]
- Lu, L.; Bock, D.; Joseph, M. Green marketing: What the Millennials buy. J. Bus. Strategy 2013, 34, 3–10. [Google Scholar] [CrossRef]
- Amoako, G.K.; Dzogbenuku, R.K.; Doe, J.; Adjaison, G.K. Green marketing and the SDGs: Emerging market perspective. Mark. Intell. Plan. 2020, 40, 310–327. [Google Scholar] [CrossRef]
- Chen, Y.S.; Chang, C.H. Enhance green purchase intentions: The roles of green perceived value, green perceived risk, and green trust. Manag. Decis. 2012, 50, 502–520. [Google Scholar] [CrossRef]
- Ahmad, W.; Zhang, Q. Green purchase intention: Effects of electronic service quality and customer green psychology. J. Clean Prod. 2020, 267, 122053. [Google Scholar] [CrossRef]
- Chen, Y.S. The drivers of green brand equity: Green brand image, green satisfaction, and green trust. J. Bus. Ethics 2010, 93, 307–319. [Google Scholar] [CrossRef]
- Chen, C.F.; Chen, F.S. Experience quality, perceived value, satisfaction and behavioral intentions for heritage tourists. Tour Manag. 2010, 31, 29–35. [Google Scholar] [CrossRef]
- McDougall, G.H.G.; Levesque, T. Customer satisfaction with services: Putting perceived value into the equation. J. Serv. Mark. 2000, 14, 392–410. [Google Scholar] [CrossRef]
- Kardes, F.R.; Posavac, S.S.; Cronley, M.L. Consumer inference: A review of processes, bases, and judgment contexts. J. Consum. Psychol. 2004, 14, 230–256. [Google Scholar] [CrossRef]
- Oliver, R.L. Conceptual Issues in the Structural Analysis of Consumption Emotion, Satisfaction, and Quality: Evidence in a Service Setting Richard L. Oliver, Conceptual Issues in the Structural Analysis of Consumption Emotion, Satisfaction and Qualit. Adv. Consum. Res. 1994, 21, 16–22. [Google Scholar]
- Zulfiqar, Z.; Shafaat, M. Green Marketing: Environmental Concern and Customer Satisfaction. Eur. J. Bus. Manag. 2015, 7, 2222–2839. [Google Scholar]
- Chen, Y.S.; Lin, C.L.; Chang, C.H. The influence of greenwash on green word-of-mouth (green WOM): The mediation effects of green perceived quality and green satisfaction. Qual. Quant. 2014, 48, 2411–2425. [Google Scholar] [CrossRef]
- Karatu, V.M.H.; Mat, N.K.N. The Mediating effects of green trust and perceived behavioral control on the direct determinants of intention to purchase green products in Nigeria. Mediterr. J. Soc. Sci. 2015, 6, 256–265. [Google Scholar] [CrossRef] [Green Version]
- Lutfie, H.; Marcelino, D. Consumer Trust to Buy Green Product: Investigation of Green Perceived Value with Green Satisfaction Mediation. In Proceedings of the 2020 8th International Conference on Cyber and IT Service Management, CITSM 2020, Pangkal, Indonesia, 23–24 October 2020. [Google Scholar] [CrossRef]
- Pahlevi, M.R.; Suhartanto, D. The integrated model of green loyalty: Evidence from eco-friendly plastic products. J. Clean Prod. 2020, 257, 120844. [Google Scholar] [CrossRef]
- Román-Augusto, J.A.; Garrido-Lecca-Vera, C.; Lodeiros-Zubiria, M.L.; Mauricio-Andia, M. Green Marketing: Drivers in the Process of Buying Green Products—The Role of Green Satisfaction, Green Trust, Green WOM and Green Perceived Value. Sustainability 2022, 14, 10580. [Google Scholar] [CrossRef]
- Chen, Y.S. Towards green loyalty: Driving from green perceived value, green satisfaction, and green trust. Sustain. Dev. 2013, 21, 294–308. [Google Scholar] [CrossRef]
- Wang, H.J. Antecedents of behavioral intentions for green city tourists. Environ. Dev. Sustain. 2022, 24, 377–398. [Google Scholar] [CrossRef]
- Issock, P.B.I.; Mpinganjira, M.; Roberts-Lombard, M. Modelling green customer loyalty and positive word of mouth: Can environmental knowledge make the difference in an emerging market? Int. J. Emerg. Mark. 2019, 15, 405–426. [Google Scholar] [CrossRef]
- Hameed, I.; Hussain, H.; Khan, K. The role of green practices toward the green word-of-mouth using stimulus-organism-response model. J. Hosp. Tour. Insights, 2021; ahead-of-print. [Google Scholar] [CrossRef]
- Suhartanto, D.; Kartikasari, A.; Hapsari, R.; Budianto, B.S.; Najib, M.; Astor, Y. Predicting young customers’ intention to repurchase green plastic products: Incorporating trust model into purchase intention model. J. Asia Bus. Stud. 2021, 15, 441–456. [Google Scholar] [CrossRef]
- Ringle, C.M.; Becker, J.-M. SmartPLS 3. Boenningstedt: SmartPLS GmbH. Available online: https://www.smartpls.com (accessed on 1 November 2022).
- Hair, T.; Sarstedt, F.; Hult, C. A Primer on Partial Least Squares Structural Equation Modeling. Long Range Plann 2017, 46, 184–185. [Google Scholar] [CrossRef]
- Sarstedt, M.; Ringle, C.M.; Hair, J.F. Partial Least Squares Structural Equation Modeling; Springer International Publishing: Cham, Switzerland, 2017. [Google Scholar]
- Sarstedt, M.; Ringle, C.M.; Hair, J.F. Handbook of Market Research; Springer: Berlin/Heidelberg, Germany, 2017. [Google Scholar]
- Hair, J.F.; Sarstedt, M.; Ringle, C.M. Rethinking some of the rethinking of partial least squares. Eur. J. Mark. 2019, 53, 566–584. [Google Scholar] [CrossRef]
- QuestionPro Latinoamérica. QuestionPro; Software para Encuestas Questionpro: Beaverton, OR, USA, 2021. [Google Scholar]
- Ringle, C.M.; Sarstedt, M. Gain more insight from your PLS-SEM results. Ind. Manag. Data Syst. 2016, 116, 1865–1886. [Google Scholar] [CrossRef]
- Hair, J.F.; Ringle, C.M.; Sarstedt, M. PLS-SEM: Indeed a Silver Bullet. J. Mark. Theory Pract. 2011, 19, 139–152. [Google Scholar] [CrossRef]
- Wang, J.; Wang, S.; Xue, H.; Wang, Y.; Li, J. Green image and consumers’ word-of-mouth intention in the green hotel industry: The moderating effect of Millennials. J. Clean. Prod. 2018, 181, 426–436. [Google Scholar] [CrossRef]
- Zhang, X.; Dong, F. Why Do Consumers Make Green Purchase Decisions? Insights from a Systematic Review. Int, J. Environ. Res. Public Health 2020, 17, 6607. [Google Scholar] [CrossRef]
- Lam, A.Y.C.; Lau, M.M.; Cheung, R. Modelling the Relationship among Green Perceived Value, Green Trust. Satisfaction, and Repurchase Intention of Green Products. Contemp. Manag. Res. 2016, 12, 47–60. [Google Scholar] [CrossRef]


| Demographic | n | % | Demographic | n | % |
|---|---|---|---|---|---|
| Age | Gender | ||||
| Under 18 | 9 | 3% | Female | 189 | 64% |
| 18 to 25 years old | 147 | 49% | Male | 108 | 36% |
| 26 to 35 years old | 95 | 32% | Mode | Female | |
| 36 to 45 years old | 40 | 13% | Frequency of purchase | ||
| 46 and over | 6 | 2% | Weekly | 52 | 18% |
| Mode | 18 to 25 years old. | More than once a month | 59 | 20% | |
| Place of purchase | Monthly | 134 | 45% | ||
| Eco-fair | 58 | 20% | Infrequently | 52 | 18% |
| Specialised shops | 95 | 32% | Mode | Monthly | |
| Online websites | 54 | 18% | Products | ||
| Supermarkets | 90 | 30% | Dairy | 102 | 15% |
| Mode | Specialised shops | Snacks (cereal bars, biscuits) | 175 | 26% | |
| Occupation | Health drinks | 84 | 12% | ||
| Student | 102 | 34% | Oils and vinegars | 96 | 14% |
| Employee | 126 | 42% | Granola and corn flakes | 154 | 23% |
| Self-employed | 59 | 20% | Other | 62 | 9% |
| Unemployed or retired | 10 | 3% | Mode | Snacks (cereal bars, biscuits) | |
| Mode | Employee | ||||
| Construct | Indicator | M | SD | Loadings | α | ρ A | CR | AVE |
|---|---|---|---|---|---|---|---|---|
| Green Perceived Value (GPV) Pahlevi. M.R.. Suhartanto. D. (2020) [15] | GPV1 | 4.16 | 0.72 | 0.70 | 0.72 | 0.74 | 0.84 | 0.64 |
| GPV2 | 4.39 | 0.67 | 0.83 | |||||
| GPV3 | 4.43 | 0.66 | 0.86 | |||||
| Green Trust (GT) Pahlevi. M.R.. Suhartanto. D. (2020) [15] | GT1 | 4.26 | 0.75 | 0.79 | ||||
| GT2 | 4.15 | 0.72 | 0.81 | 0.84 | 0.84 | 0.89 | 0.68 | |
| GT3 | 3.91 | 0.90 | 0.84 | |||||
| GT4 | 4.05 | 0.84 | 0.86 | |||||
| Green Satisfaction (GS) Pahlevi. M.R.. Suhartanto. D. (2020) [15] | GS1 | 4.28 | 0.62 | 0.79 | 0.73 | 0.73 | 0.85 | 0.65 |
| GS2 | 4.25 | 0.61 | 0.85 | |||||
| GS3 | 4.12 | 0.80 | 0.76 | |||||
| Green Word of Mouth (GW) Ahmad. W.. Zhang. Q. (2020) [16] | GW1 | 4.12 | 0.76 | 0.71 | 0.82 | 0.83 | 0.88 | 0.65 |
| GW2 | 4.22 | 0.62 | 0.81 | |||||
| GW3 | 4.25 | 0.69 | 0.86 | |||||
| GW4 | 4.21 | 0.68 | 0.82 |
| GPV | GS | GT | GW | |
|---|---|---|---|---|
| GPV | 0.80 | |||
| GS | 0.53 | 0.80 | ||
| GT | 0.63 | 0.66 | 0.82 | |
| GW | 0.51 | 0.63 | 0.60 | 0.81 |
| GPV | GS | GT | GW | |
|---|---|---|---|---|
| GPV | ||||
| GS | 0.73 | |||
| GT | 0.80 | 0.84 | ||
| GW | 0.66 | 0.81 | 0.71 |
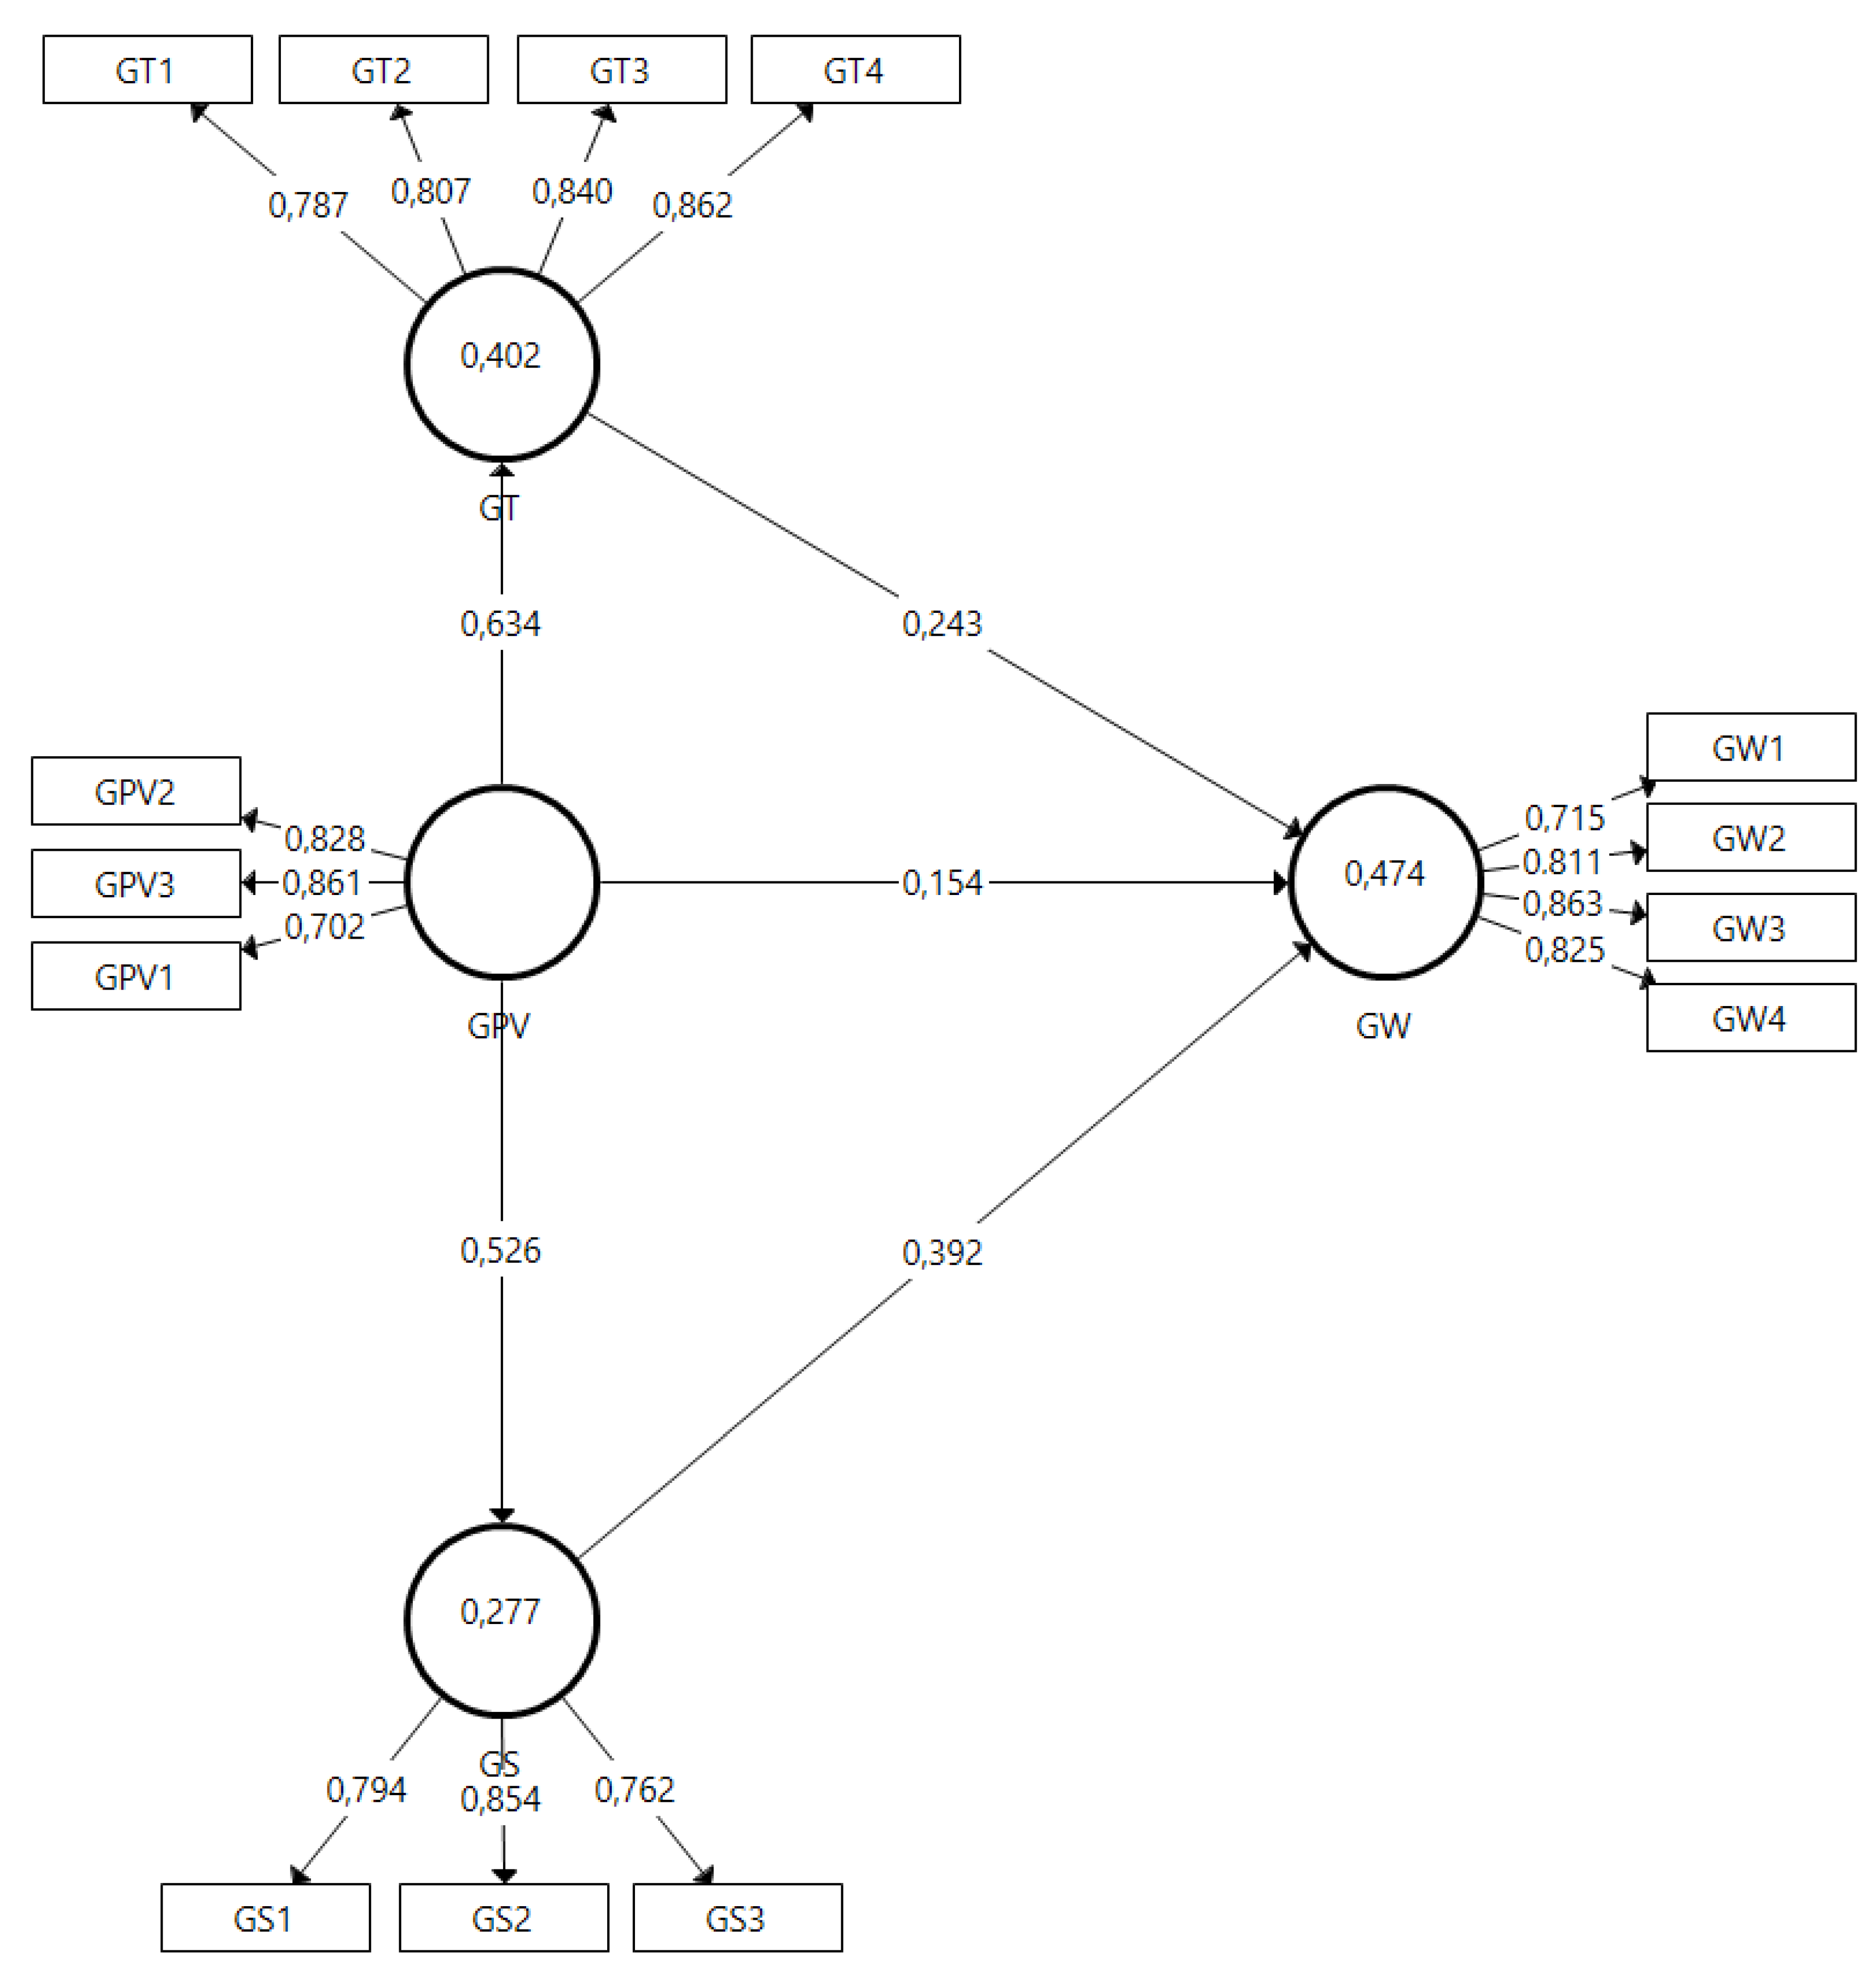
| Criterion | Predictor | β | t-Value | R² | Inner VIF Values |
|---|---|---|---|---|---|
| Green Word of Mouth (GW) | Green Perceived Value (GPV) | 0.15 | 2.29 | 0.47 | 1.73 |
| Green Trust (GT) | 0.24 | 3.44 | 2.24 | ||
| Green Satisfaction (GS) | 0.39 | 5.15 | 1.85 | ||
| Green Satisfaction (GS) | Green Perceived Value (GPV) | 0.53 | 9.15 | 0.28 | 1.00 |
| Green Trust (GT) | Green Perceived Value (GPV) | 0.63 | 13.12 | 0.40 | 1.00 |
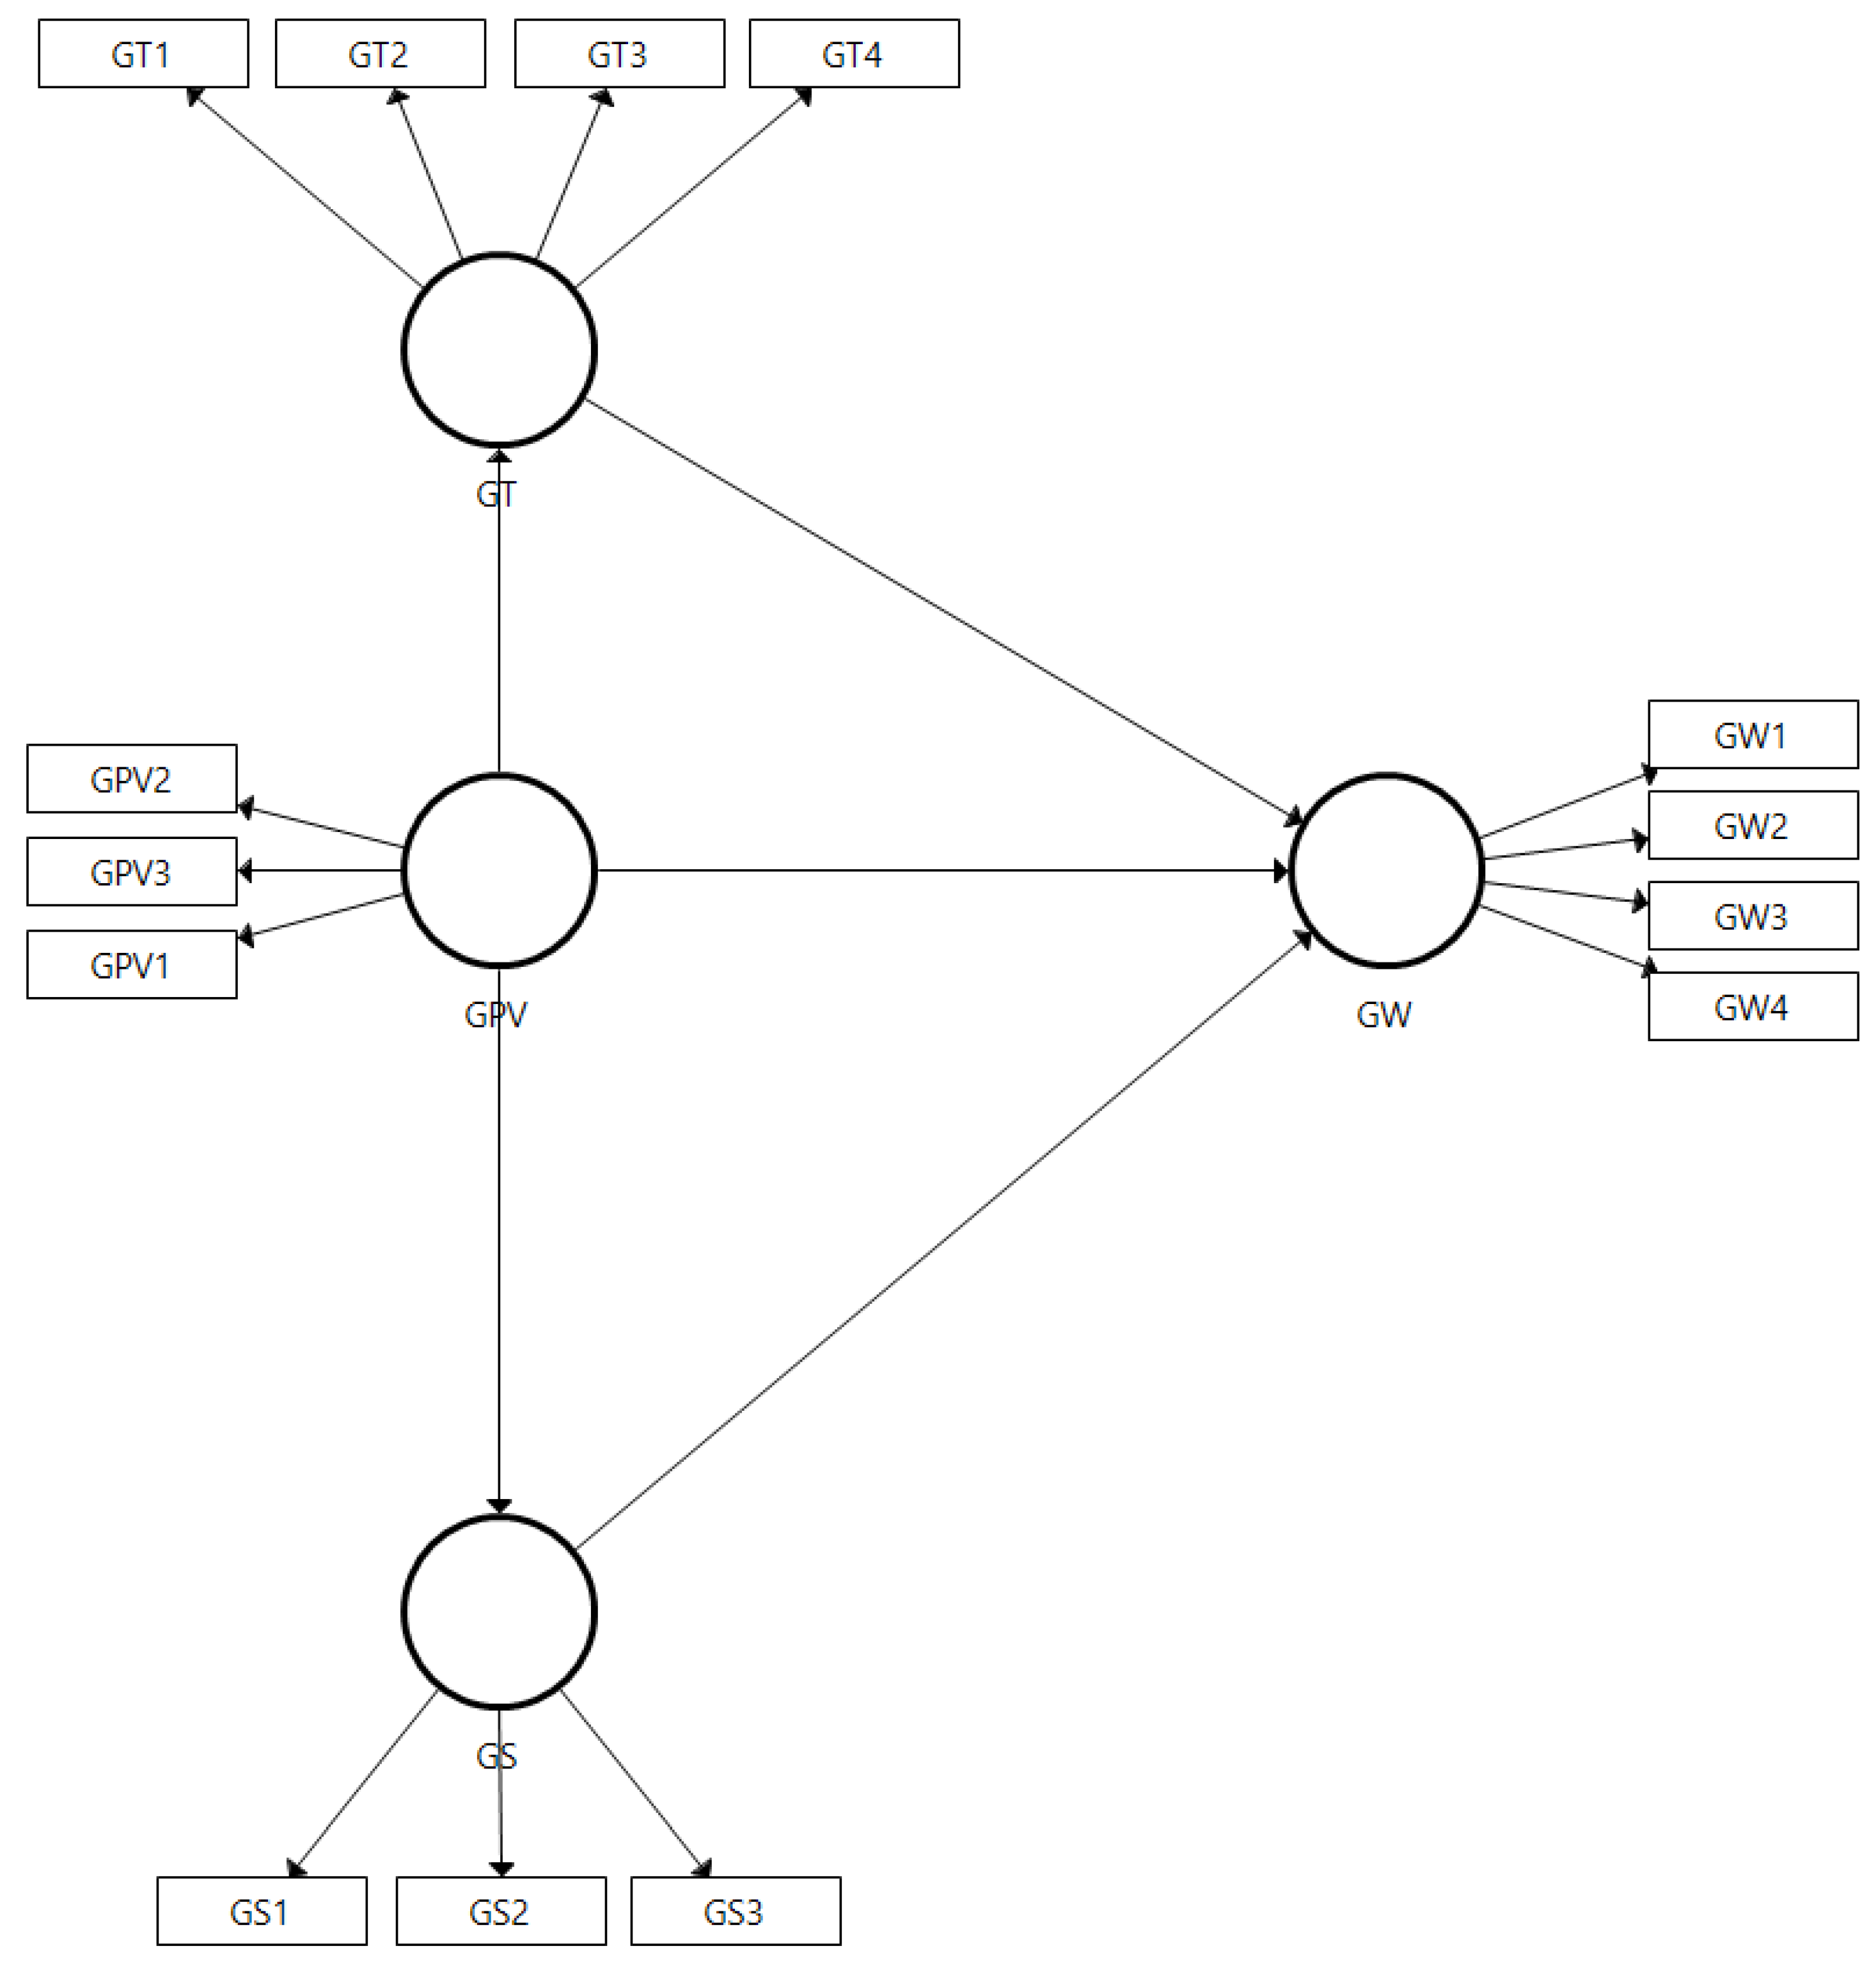
| Hypotheses | p-Value | Sign | Result | |
|---|---|---|---|---|
| H1 | Green Perceived Value (GPV) → Green Trust (GT) | 0.00 | + | Supported |
| H2 | Green Perceived Value (GPV) → Green Satisfaction (GS) | 0.00 | + | Supported |
| H3 | Green Trust (GT) → Green Word of Mouth (GW) | 0.00 | + | Supported |
| H4 | Green Perceived Value (GPV) → Green Word of Mouth (GW) | 0.02 | + | Not Suported |
| H5 | Green Satisfaction (GS) → Green Word of Mouth (GW) | 0.00 | + | Supported |
Disclaimer/Publisher’s Note: The statements, opinions and data contained in all publications are solely those of the individual author(s) and contributor(s) and not of MDPI and/or the editor(s). MDPI and/or the editor(s) disclaim responsibility for any injury to people or property resulting from any ideas, methods, instructions or products referred to in the content. |
© 2023 by the authors. Licensee MDPI, Basel, Switzerland. This article is an open access article distributed under the terms and conditions of the Creative Commons Attribution (CC BY) license (https://creativecommons.org/licenses/by/4.0/).
Share and Cite
Román-Augusto, J.A.; Garrido-Lecca-Vera, C.; Lodeiros-Zubiria, M.L.; Mauricio-Andia, M. How to Reach Green Word of Mouth through Green Trust, Green Perceived Value and Green Satisfaction. Data 2023, 8, 25. https://doi.org/10.3390/data8020025
Román-Augusto JA, Garrido-Lecca-Vera C, Lodeiros-Zubiria ML, Mauricio-Andia M. How to Reach Green Word of Mouth through Green Trust, Green Perceived Value and Green Satisfaction. Data. 2023; 8(2):25. https://doi.org/10.3390/data8020025
Chicago/Turabian StyleRomán-Augusto, Jose Antonio, Camila Garrido-Lecca-Vera, Manuel Luis Lodeiros-Zubiria, and Martin Mauricio-Andia. 2023. "How to Reach Green Word of Mouth through Green Trust, Green Perceived Value and Green Satisfaction" Data 8, no. 2: 25. https://doi.org/10.3390/data8020025