Communication

Basic Input Data for Audiences’ Geotargeting by Destinations’ Partial Accessibility: Notes from Slovakia

Department of Geo and Mining Tourism, Faculty of Mining, Ecology, Process Control and Geotechnologies, Technical University of Košice, Letná 9, 042 00 Kosice, Slovakia
*
Author to whom correspondence should be addressed.
Submission received: 27 November 2022 / Revised: 12 January 2023 / Accepted: 13 January 2023 / Published: 19 January 2023
(This article belongs to the Special Issue Data-Driven Approach on Urban Planning and Smart Cities)

Abstract

:
The presented notes focus partially on two of the basic elements (accessibility and image) of any managed tourism destination from the perspective of basic ETL processes over open and third-party data. The specific case aims to investigate the usability of open government data on occupancy in combination with third-party data on online audiences’ engagement for DMOs’ potential seasonal geotargeting via utilizing Openrouteservice’s APIs. For the pilot case, a Slovak (Central Europe) destination’s data on occupancy, and the DMO’s website and social media engagement by origin were used to determine potential audiences’ accessibility by car. Testing of the pilot results on a sample of foreign markets indicates that by a partial mix of the means of transportation, the vast majority of audiences are within a 4 h long incoming trip. Although the preliminary tests indicate a linear correlation between the destination’s occupancy and online audiences’ share accessibility by car, for further extrapolation, the list of missing input remains long. The main addition to the field of tourism and destination management may be the partial reusability of developed techniques for data extraction, and transformation for further data overlays, which may save some time.

1. Introduction

Destinations’ inner and outer accessibility and image are some of the base elements in the field of destination management [1]. By definition, a destination should be accessible via relevant means of transportation to a large population, while administrative processes (Visa requirements and other entry conditions) are to be considered as part of the destination’s accessibility [1]. The image of a destination, representing the intangible and untestable offer, may be considered one of the selling points; however, the awareness of potential visitors (consumers) about the destination’s image is nevertheless critical [1].
Data gathering and analysis itself is one of the main pillars of market intelligence, which is among the critical functions of any destination management organization (hereinafter, DMO) [2]. Looking closely at the concept of smart destinations and its founding pillars (Governance, Innovation, Technology, Accessibility, and Sustainability), data themselves may be considered as the concept’s fuel [2].
Subjectively, DMOs, based on their public–private partnership nature, market the image of destinations and partially market the image of their members. As de las Heras-Pedrosa et al. (2020) point out, the literature on the importance of social media in tourism is quite extensive, with more focus on content communication strategies and utilization of user-generated content (hereinafter, UGC), and less on the role of destination stakeholders within the process [3]. Tran et al.’s (2022) review identified that many studies focusing on the relationship between social media and destination branding aim to deal with UGC analysis, while Facebook is among the top platforms for data collection [4]. Interestingly, Mariani’s (2020) quantitative literature review of Web 2.0 and Destination marketing-related research identified that 94.2% of the papers analyzed used primary data as a source of extrapolation [5].
A newer systematic literature review by Mariani et al. (2021) identified that researchers in the field of tourism often utilize application programming interfaces (hereinafter, API) for extracting aggregated metrics of user-generated content (hereinafter, UGC) from websites and social media platforms for a wide range of uses, from gaining better understanding of tourists’ profile, forecasting demand and occupancy, and sentiment analysis to measuring tourism sustainability [6]. Major social media APIs such as Facebook, Twitter, and Instagram are commonly accessible with a relevant Access Token; however, the easiest way to retrieve data on users from online booking platforms and tourism experience-related platforms such as Booking, Airbnb, and TripAdvisor is still via the application of automated web scraping techniques [7,8].
The European Union and member states adopt several open data initiatives to grant free access to harmonized public sector data [9]. For the market analysis of destinations, basic metrics on visitors’ origin at the lowest possible granularity are subjectively essential; therefore, APIs of national statistical offices may eliminate repetitive manual tasks within data extraction processes. Subjectively, a practical way to reason online marketing’s importance in European destination management is via data from the last IPSOS (2021) survey on EU citizens’ attitudes toward tourism (carried out on a relevant sample of EU citizens) [10]. In terms of the most important information sources when making travel plans, the majority of respondents (56%) consider recommendations from familiar people as crucial, followed by Web 2.0-based technologies (34%—websites collecting reviews and ratings from travelers; 21%—websites or social media page of the service provider) [10]. More interestingly, almost one-fourth of respondents are most likely to use online platforms combining travel services to organize their travel and tourism activities [10].
The importance of data on destinations’ accessibility may be summarized by quoting Yen et al. (2021): “Understanding the accessibility of a destination can help destination managers and governments identify tourism opportunities and execute appropriate strategies” [11]. Mansour et al.’s (2022) spatial assessment of the accessibility of selected POIs, applying conventional geostatistical approaches, is subjectively a great example of how data may help to determine a destination’s inner accessibility [12]. Costa et al.’s (2021) utilization of the Openrouteservice API for focusing on measuring the attractiveness of a sampled destination’s inner accessibility by means of travel and routes circuity is subjectively a great example of how open data and solutions may save time within destination management [13].
The purpose of the presented notes is to demonstrate a replicable simple way of utilizing:
  • Statistical Office of the Slovak republic’s official open JSON-stat-based API (hereinafter, SOSR API) for retrieving monthly metrics on visitors’ origin by country [14];
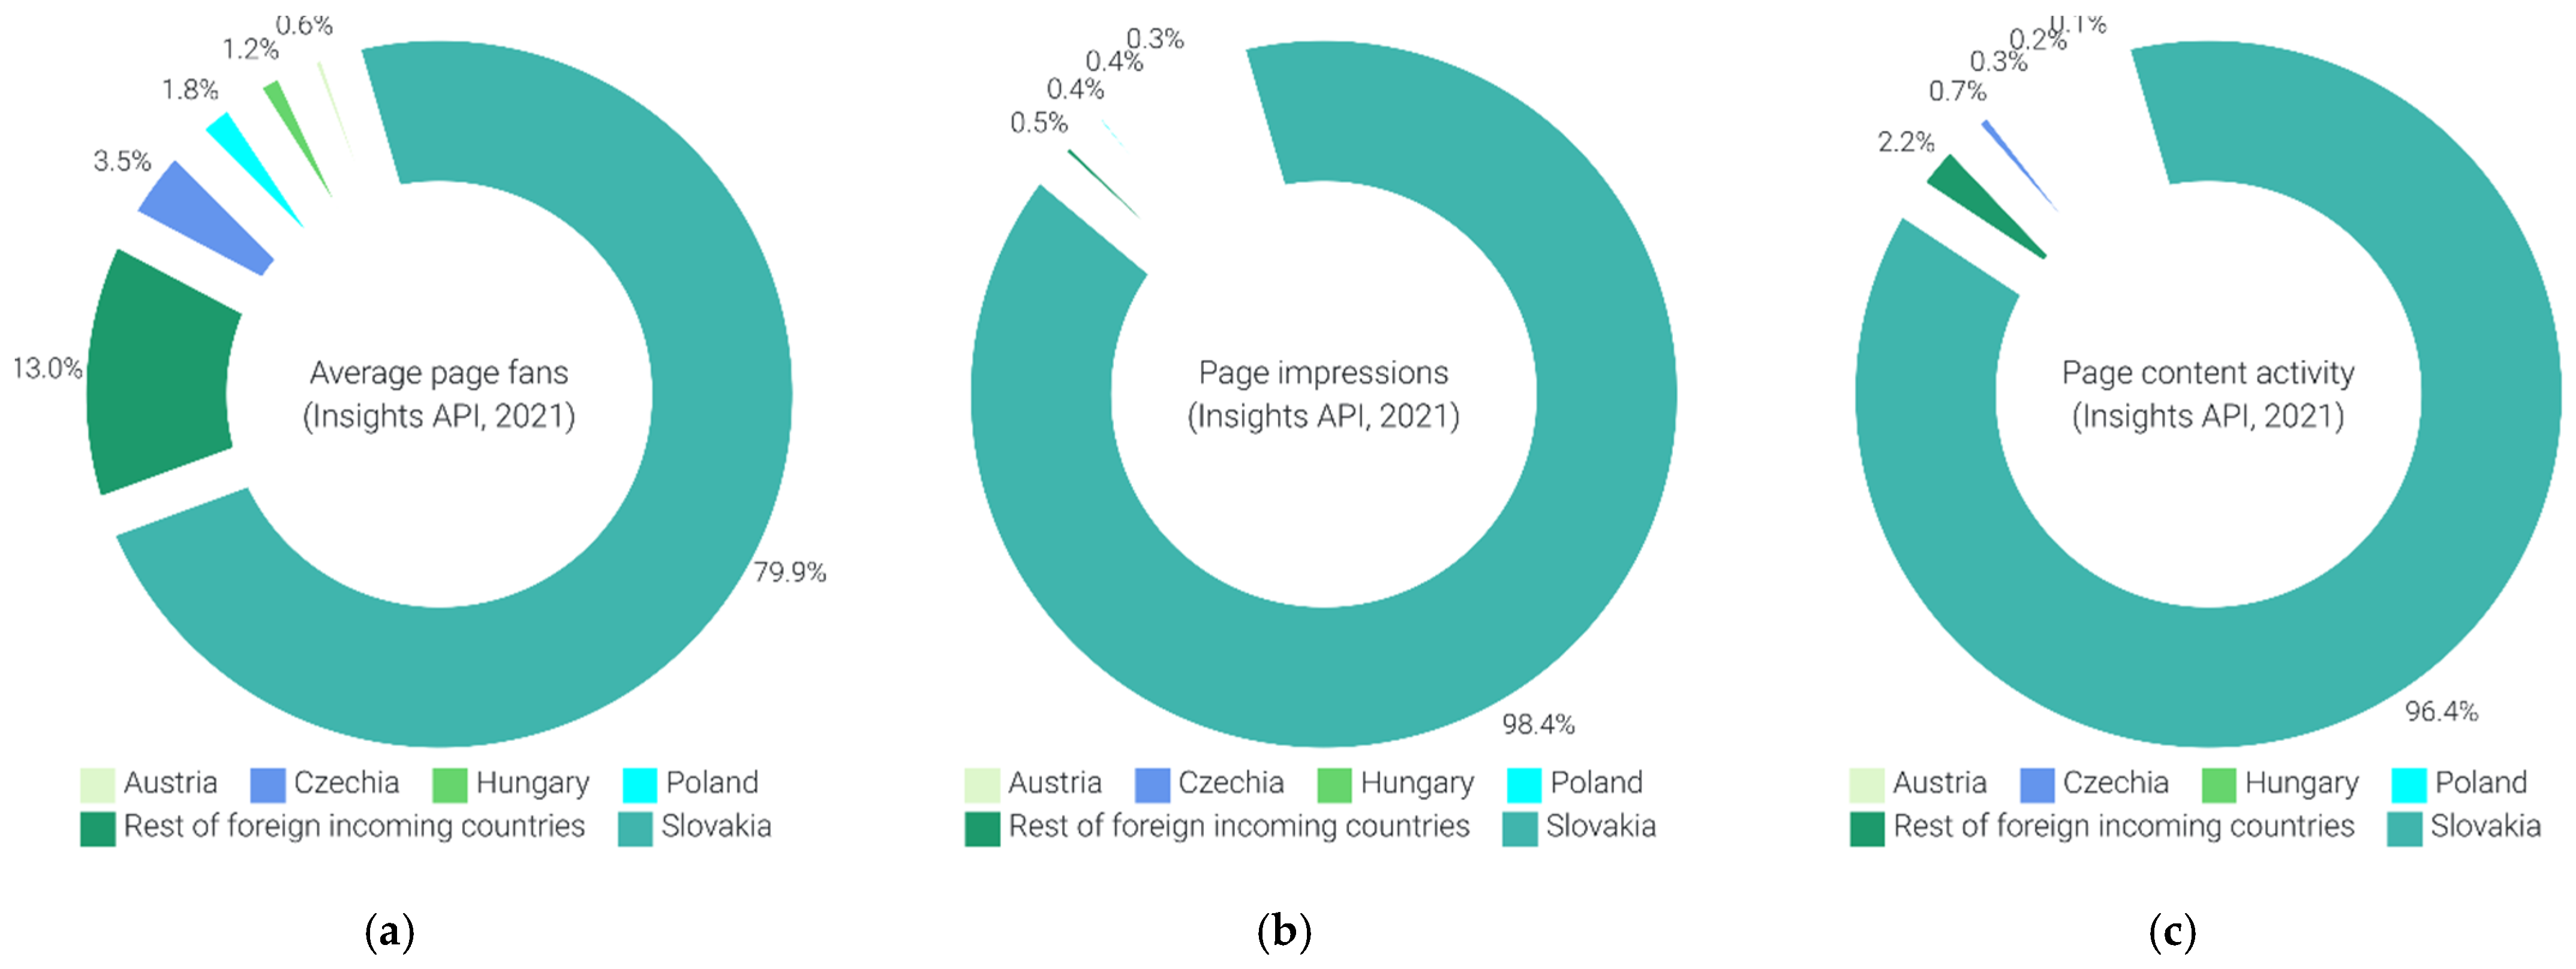
  • Facebook’s Page Insights Graph API (hereinafter, Insight API) for retrieving aggregated metrics on contents’ reach and interactivity by origin country and city [15];
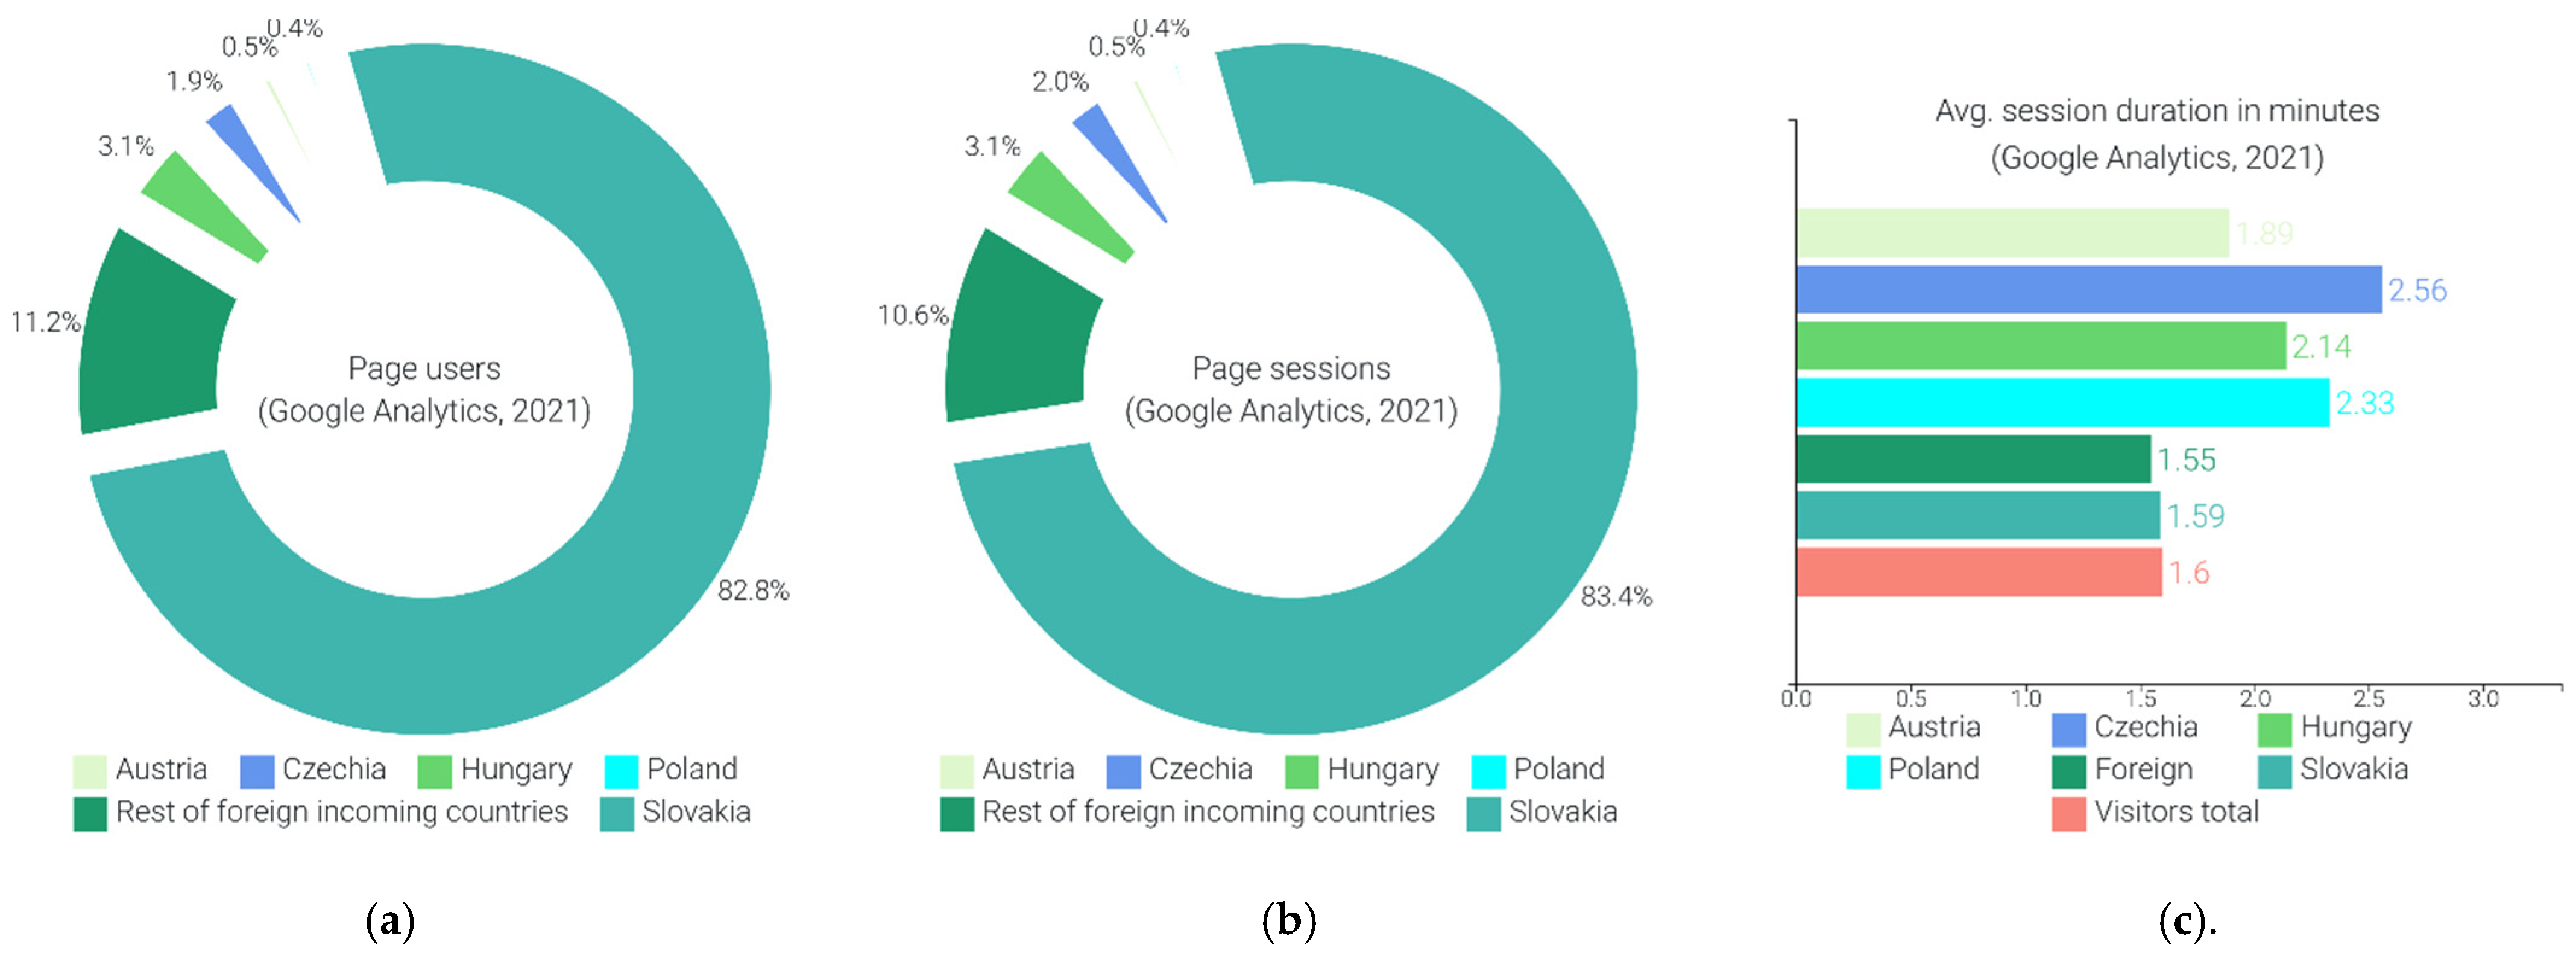
  • Google Analytics data dumps with basic metrics on a website’s performance [16];
  • Openrouteservice’s Geocode API and Distance Matrix API [17,18];
for the identification of the underlying relationship between a destination’s partial accessibility and online audiences’ origin, which may help DMOs within seasonal geotargeting. Furthermore, the testing of the techniques generated the motivation for creating a simple reusable dashboard for interactive publication via pilot data overlays.
For the practical reason of cooperation with the sampled DMO, the pilot case focuses on the destination of Kosice city (Slovakia, Central Europe) and the partial analysis of domestic and neighboring audiences of Austria, Czechia, Hungary, and Poland. Since the developed procedures may be applied separately, results may be replicated not only for any Slovak DMO but partially for any DMO using Facebook as an online communication channel or Google Analytics for monitoring their website’s performance. Subjectively, the notes may have the potential also to raise the share of works in the field of tourism and destination data analytics-related research that provide simple, but open and reusable data extraction techniques.
Each of the following sections has its purpose. The second section describes the methodological approach of data extraction, transformation, and loading processes (hereinafter, ETL). Furthermore, it describes the implemented methods used for the statistical processing of the resulting samples. The third section describes the purposes and reusability of the semiautomated ETL processes and statistical processing of the resulting pilot. The fourth section presents and discusses the basic statistical relations of analyzed markets. The fifth section summarizes the notes’ results, their possible practical application, and future expansion.

2. Materials and Methods

As already mentioned, for the practical reason of cooperation with the sampled DMO Visit Kosice, the pilot case focuses on the destination of Kosice city (Slovakia, Central Europe) and the partial analysis of domestic and neighboring audiences of Austria, Czechia, Hungary, and Poland. For simple practical reasons, the selected base timeline for ETL processes was set between January and December 2021.

2.1. Input Data Extraction

The subsections describe the basic characteristics of input data extracted from the Statistical Office of the Slovak republic, Facebook Graph API, and Google Analytics.

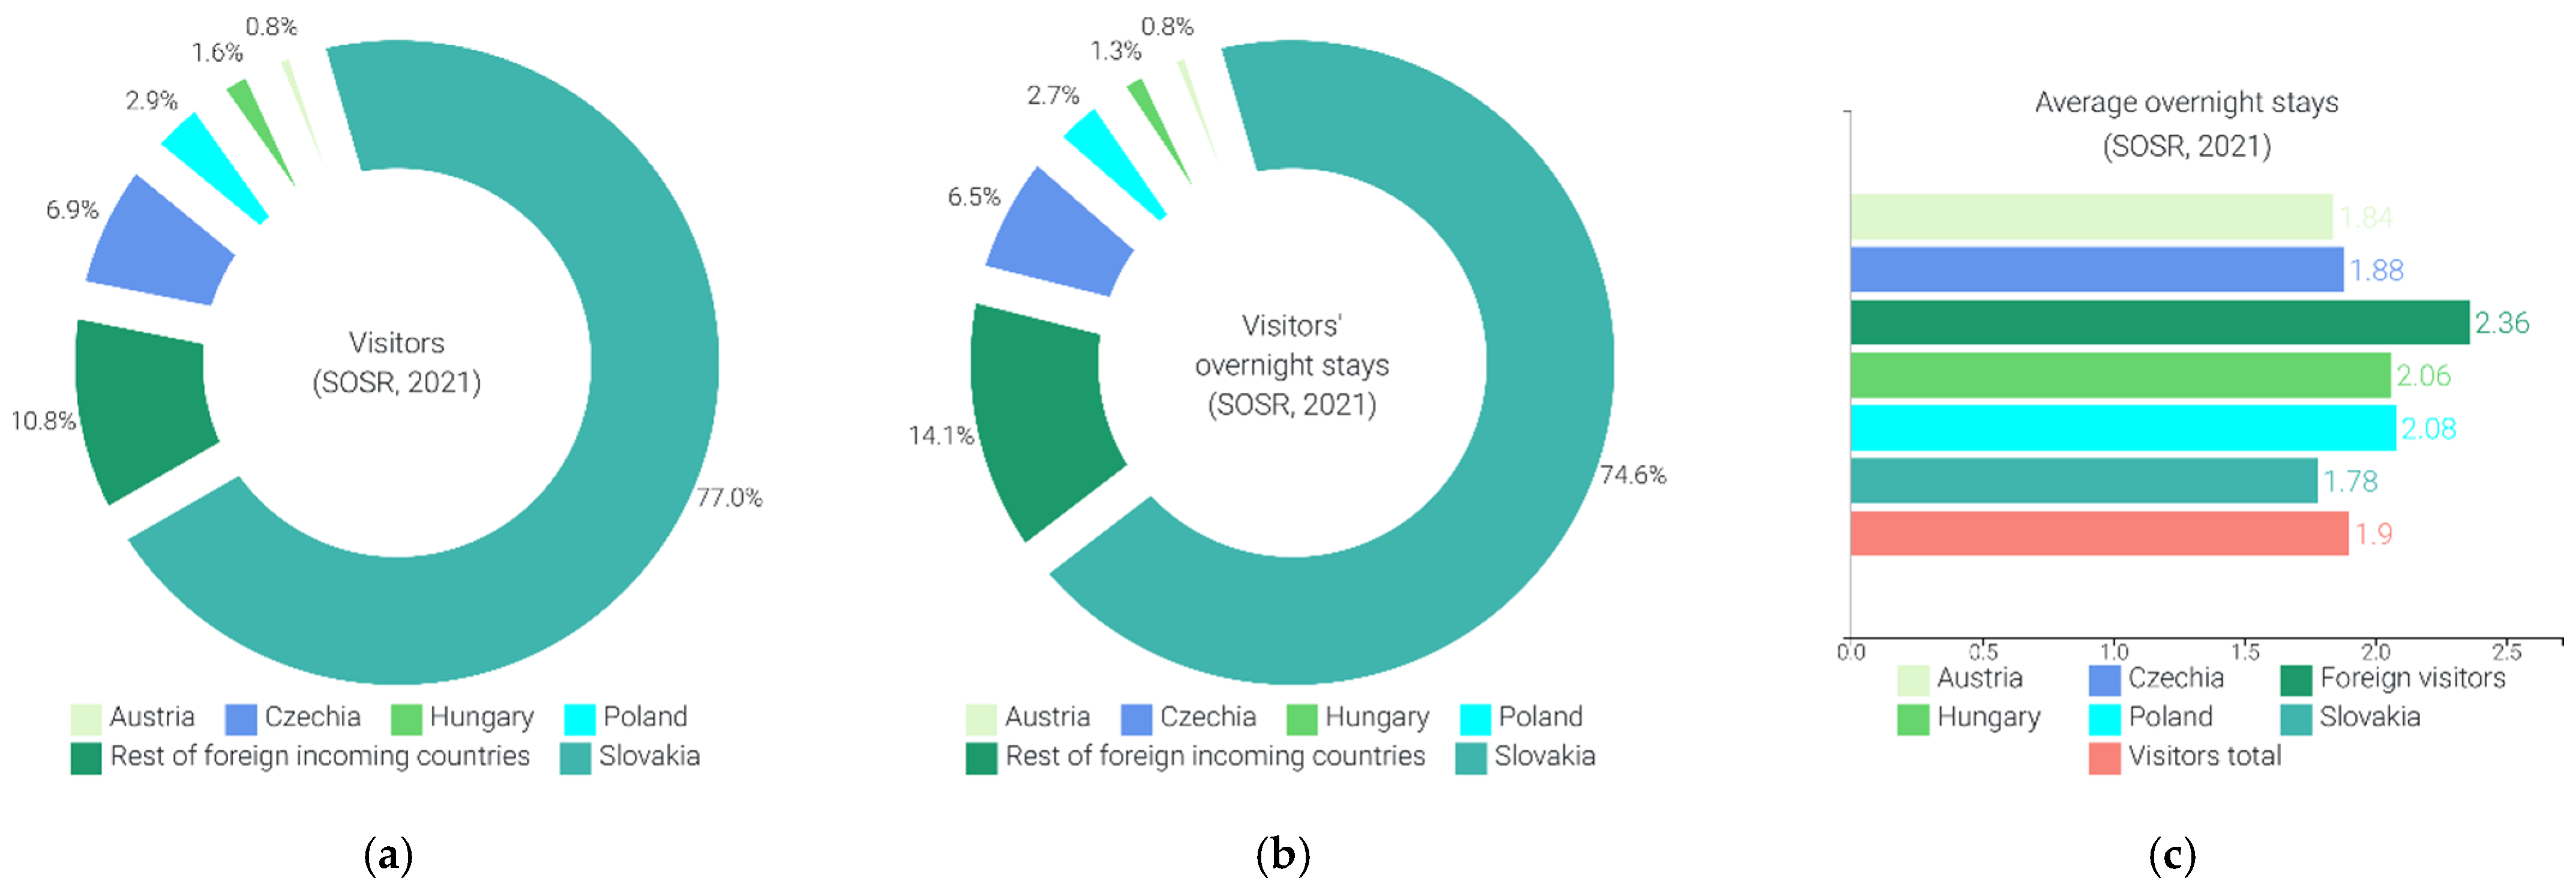
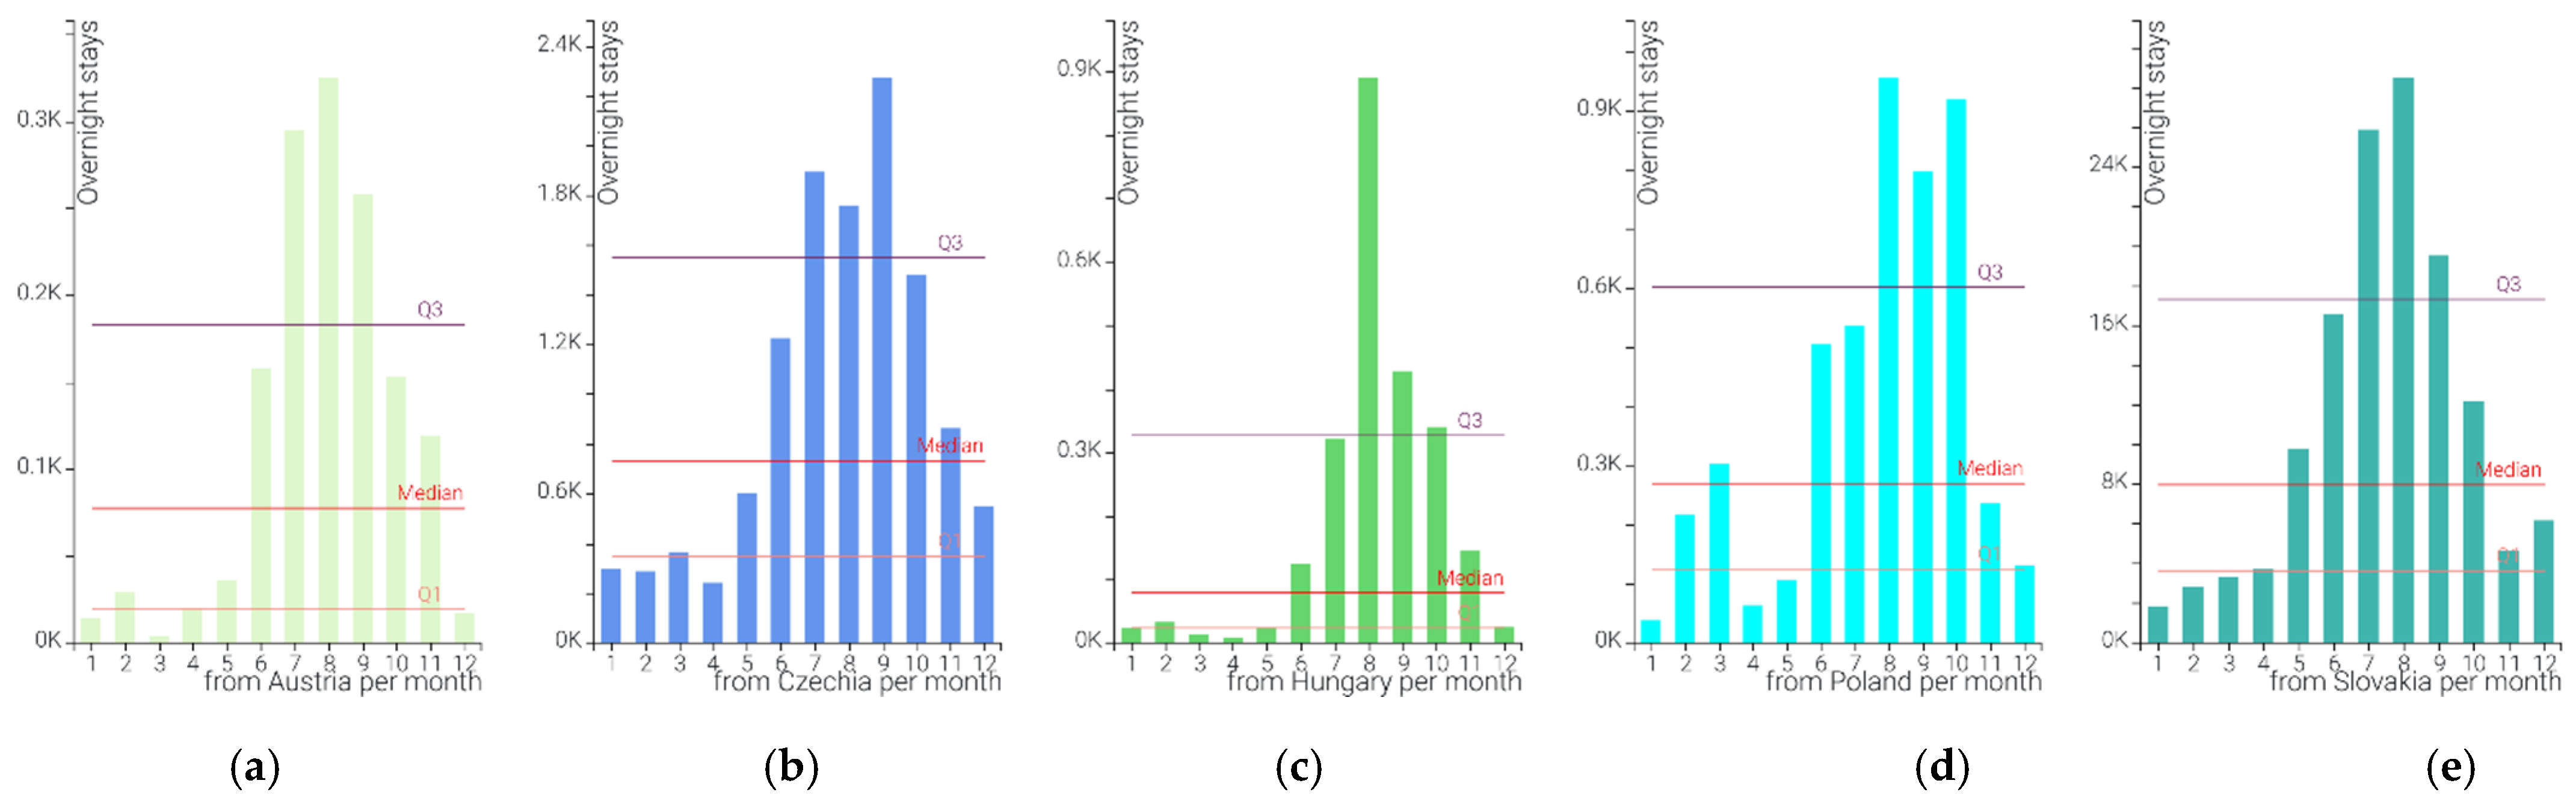
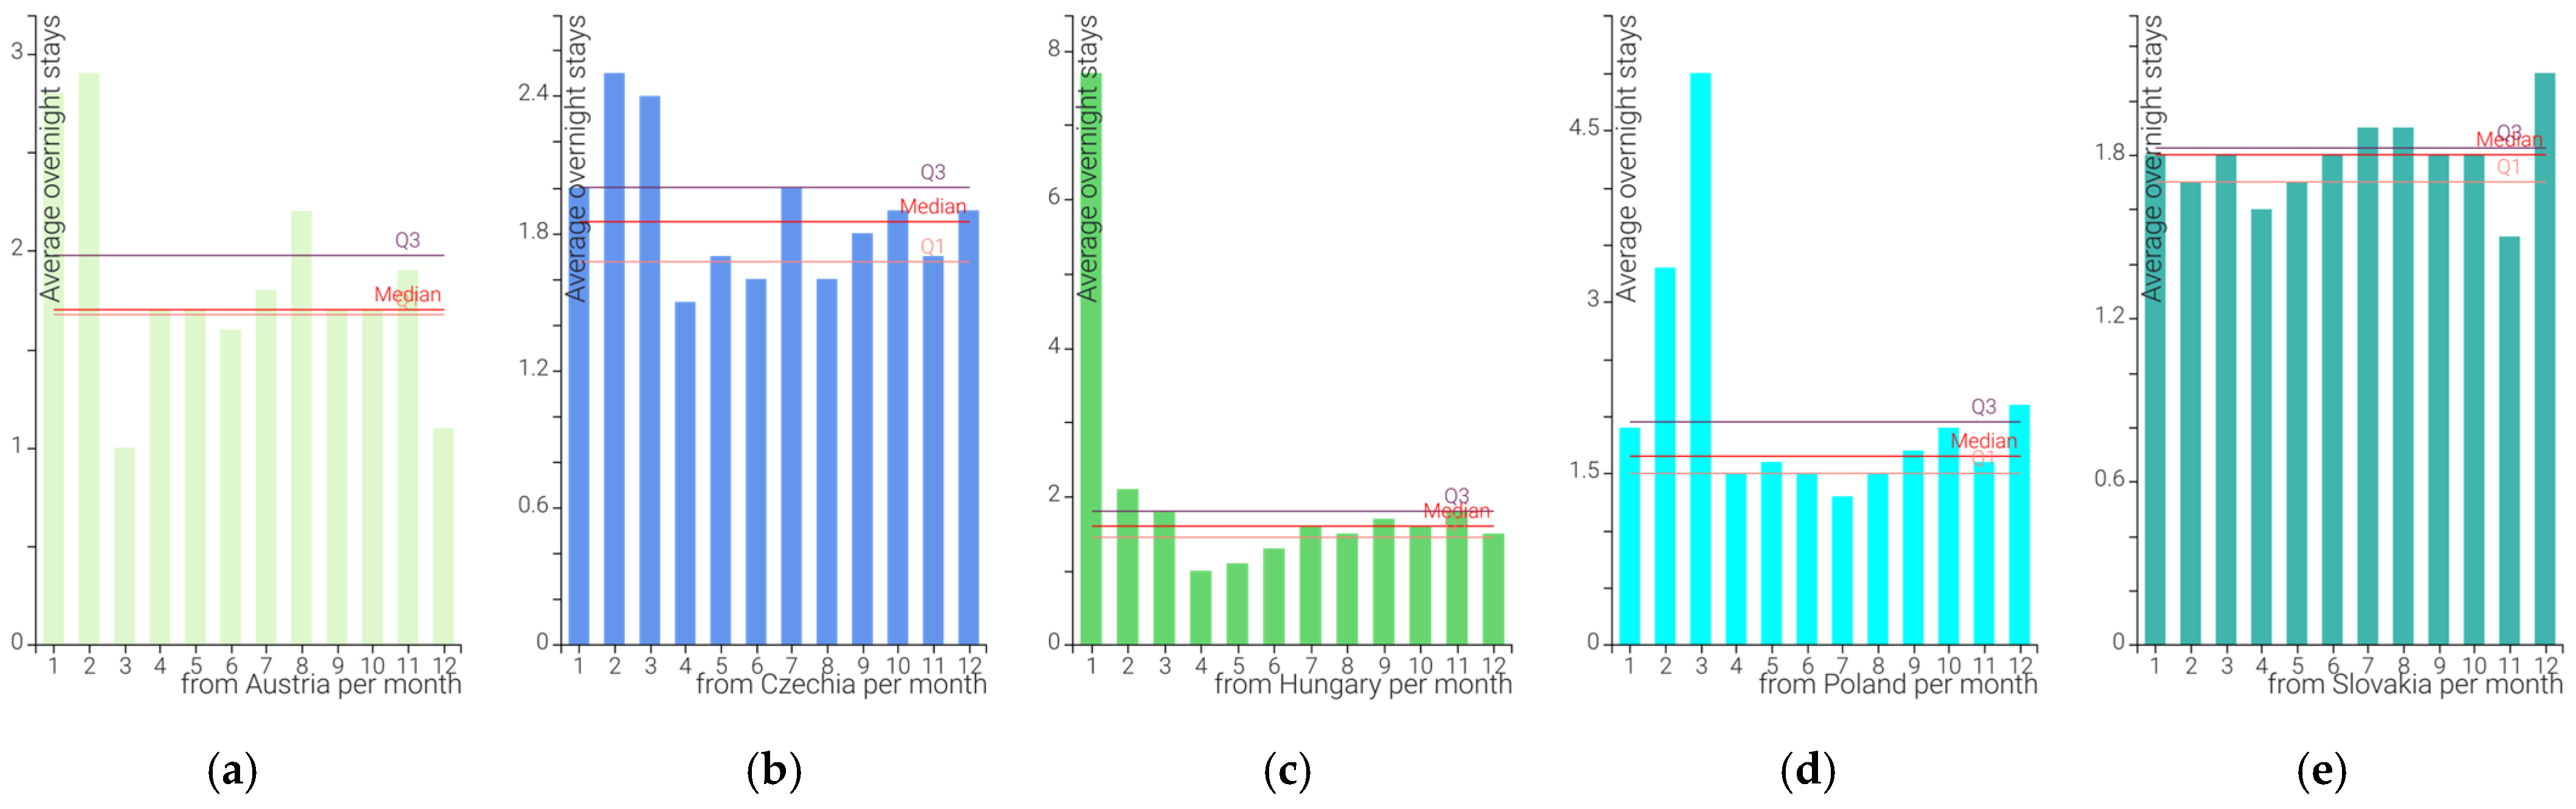
2.1.1. Data on Destination Occupancy

Monthly data on destination occupancy of the selected destination were acquired via simple calls in Python to the Statistical Office of the Slovak republic’s official open JSON-stat-based API [14,19]. Specifically, data set cr3804mr, named Occupancy of accommodation establishments—districts (countries), containing monthly data on visitor rates by country of origin at district level (LAU1) was called with the following parameters:
  • ID of requested district: SK042_0242—covering all four district of Kosice city;
  • ID of the requested year: 2021;
  • IDs of requested months: 1 to 12;
  • IDs of requested variables:
  • UKAZ04—Number of visitors in total;
  • UKAZ07—Number of nights spent by visitors;
  • UKAZ10—Average number of nights spent by visitors;
  • IDs of requested dimensions:
  • DIM01 to DIM90—representing all available country dimensions and country aggregates.
For replication of the above-mentioned calls, a simpler version of the Python code is available [19]. The raw tabular data sets were loaded into a locally hosted PostgreSQL database.

2.1.2. Data on Destination Audiences Engagement on Facebook

Data on the examined destination’s (DMO’s) audiences at Facebook were acquired via simple calls in Python towards the JSON-based Page Insights Graph API [15,19]. For the pilot case, data containing the below enlisted daily metrics were extracted:
  • Metric ID: page_fans_country—the aggregated number of users per country that liked the page. It must be noted that only the 45 countries with the most people were included [15];
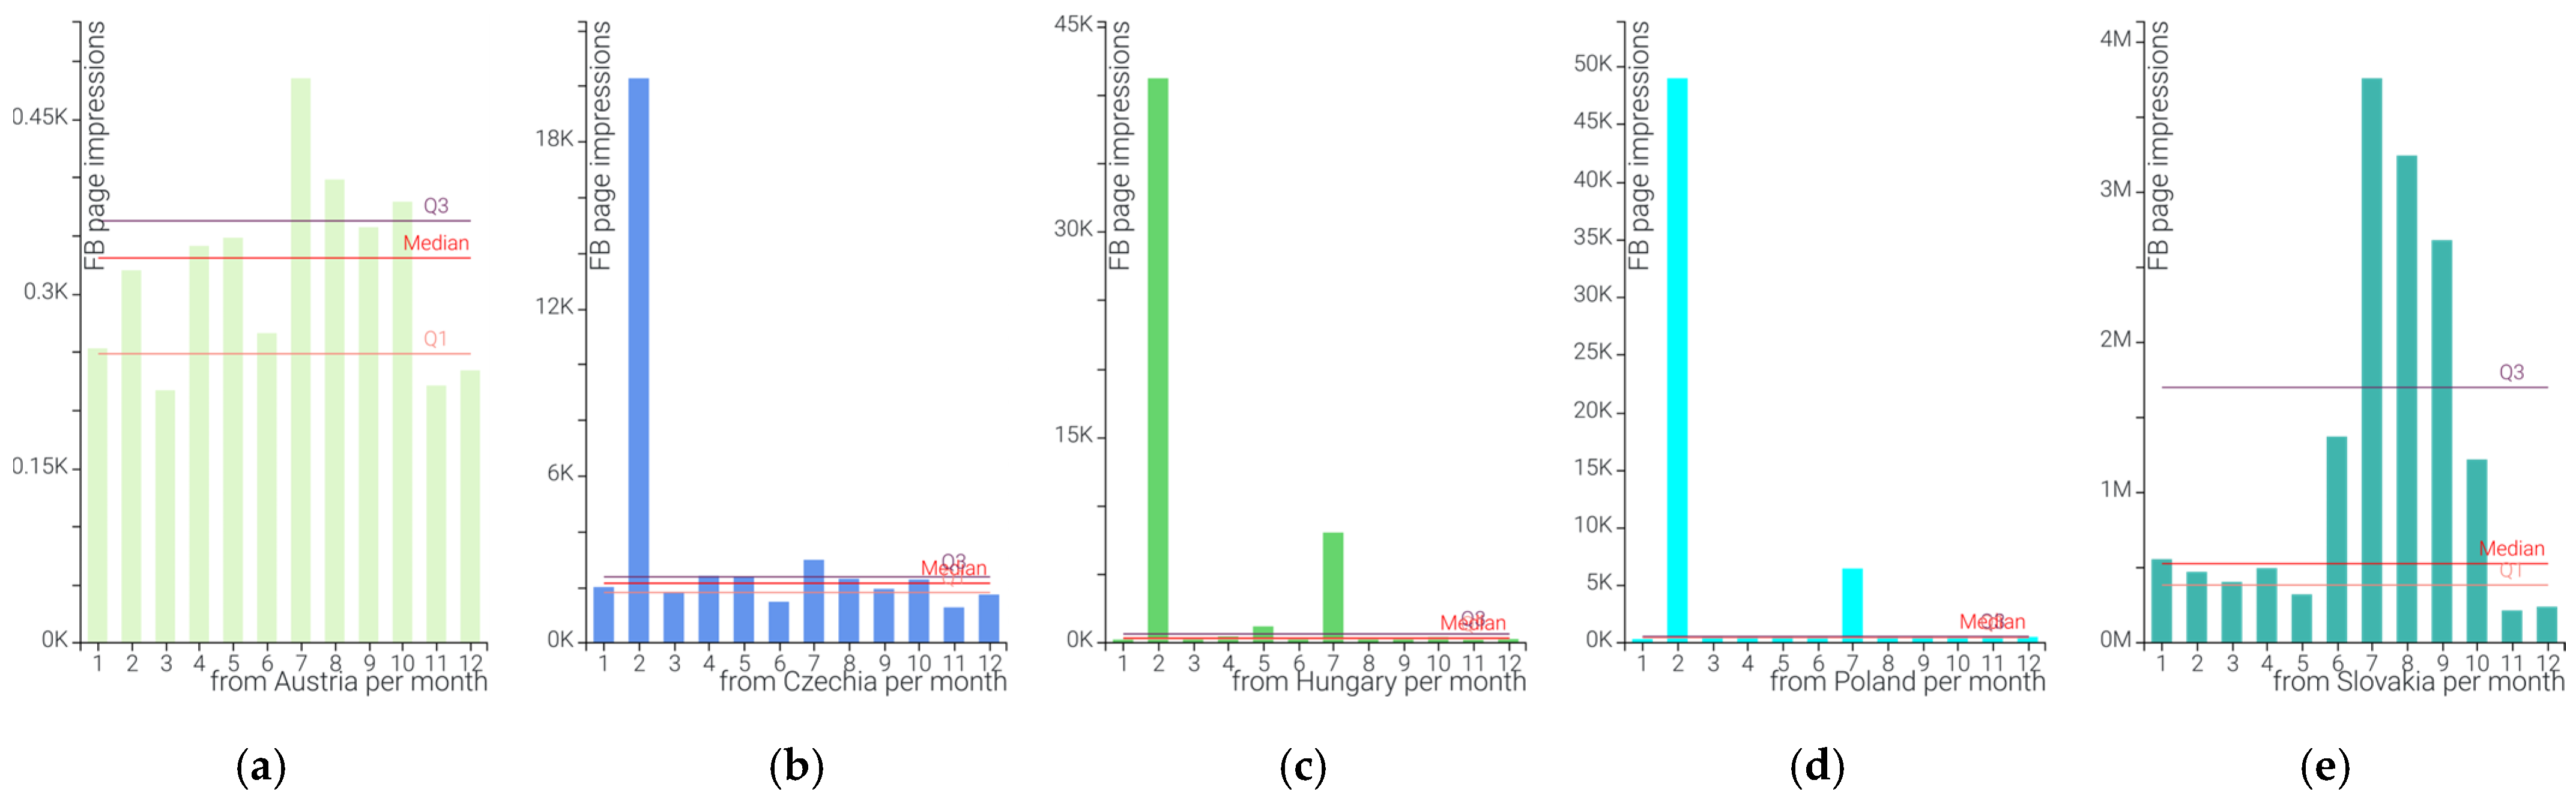
  • Metric ID: page_impressions_by_country_unique—the aggregated number of users per country who had seen any content associated with the page [15];
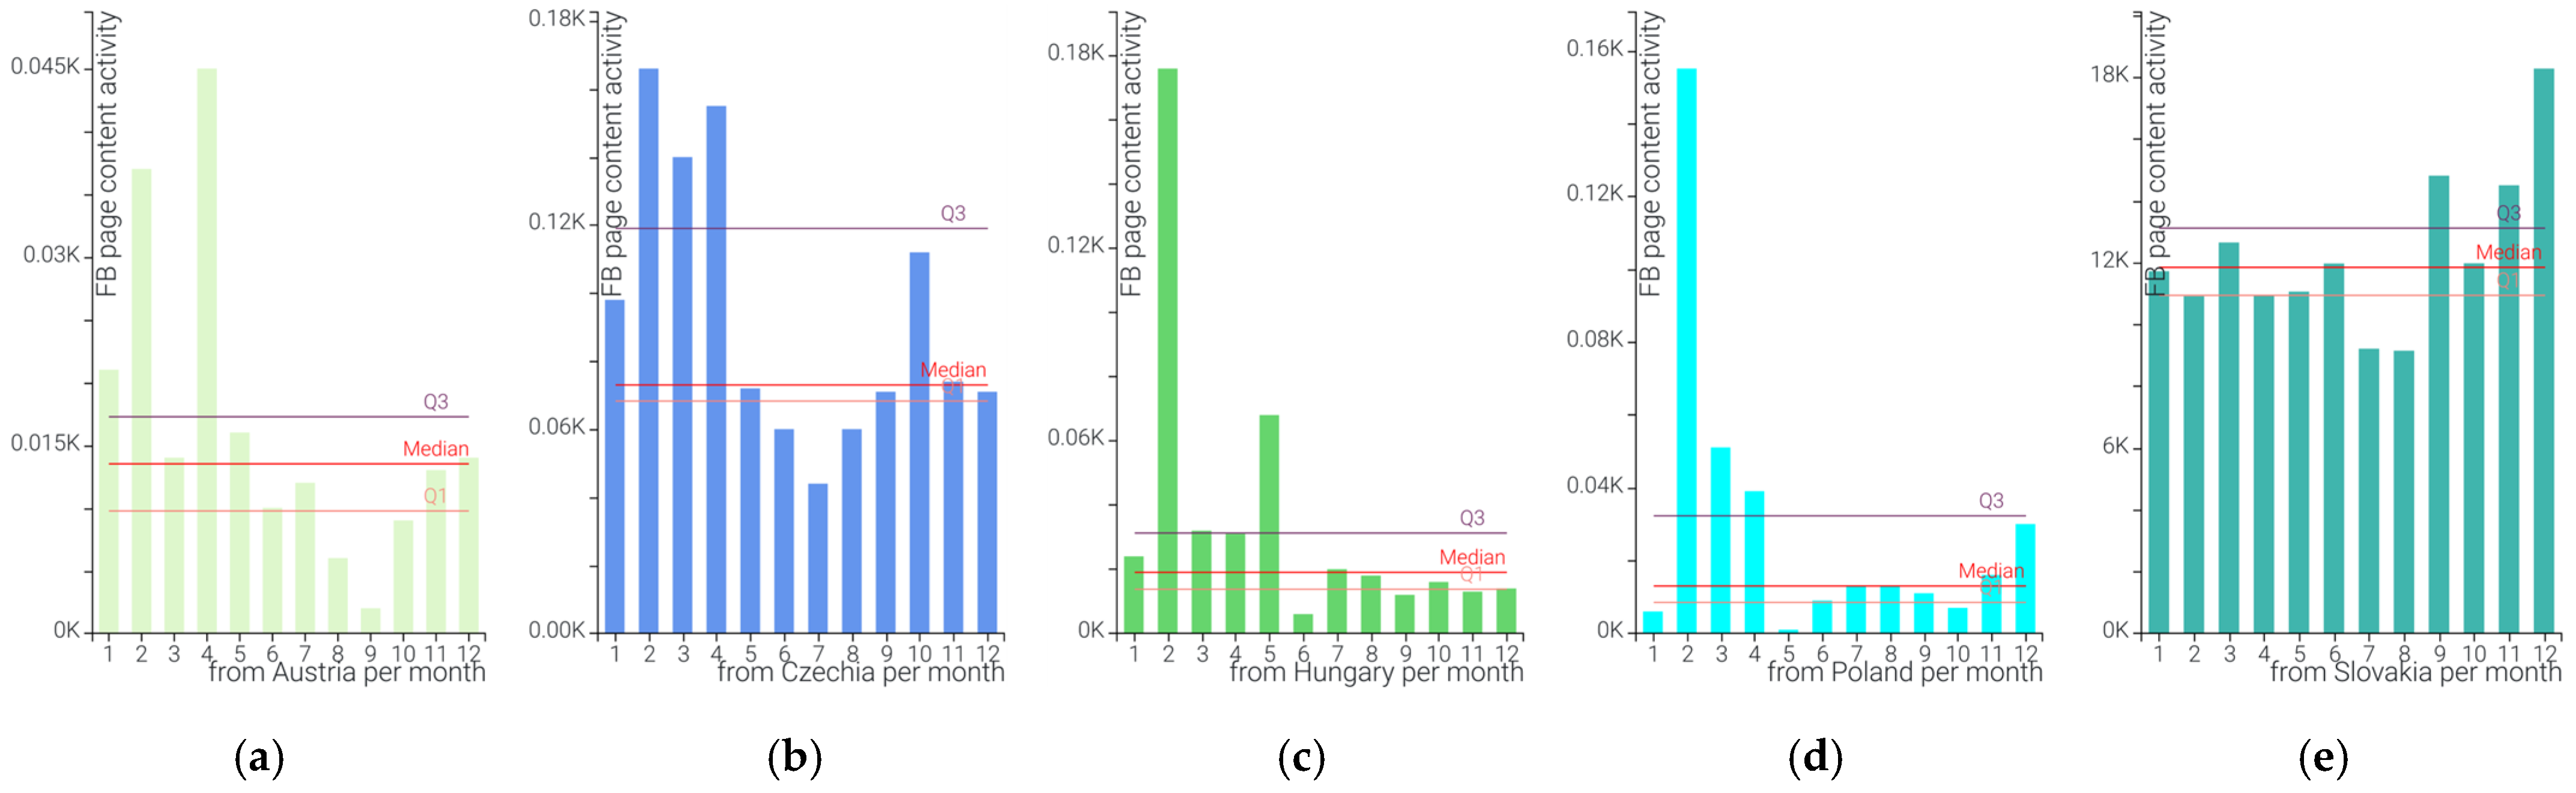
  • Metric ID: page_content_activity_by_country_unique—the aggregated number of users per country who were talking about the page for the given period. It must be noted that only the 45 countries with the most people were included [15];
  • Metric ID: page_impressions_by_city_unique—the aggregated number of users per city for the given period who had seen any content associated with the Page for the given period [15];
  • Metric ID: page_content_activity_by_city_unique—the aggregated number of users per city that were talking about the Page for the given period [15].
For the replication of the above-mentioned calls, a simpler version of the Python code is available [19]. However, it must be noted that for calling the relevant page’s data, an access token is necessary, which may be only granted by the DMO’s (account holder) written consent. The raw tabular data sets were loaded into a locally hosted PostgreSQL database.

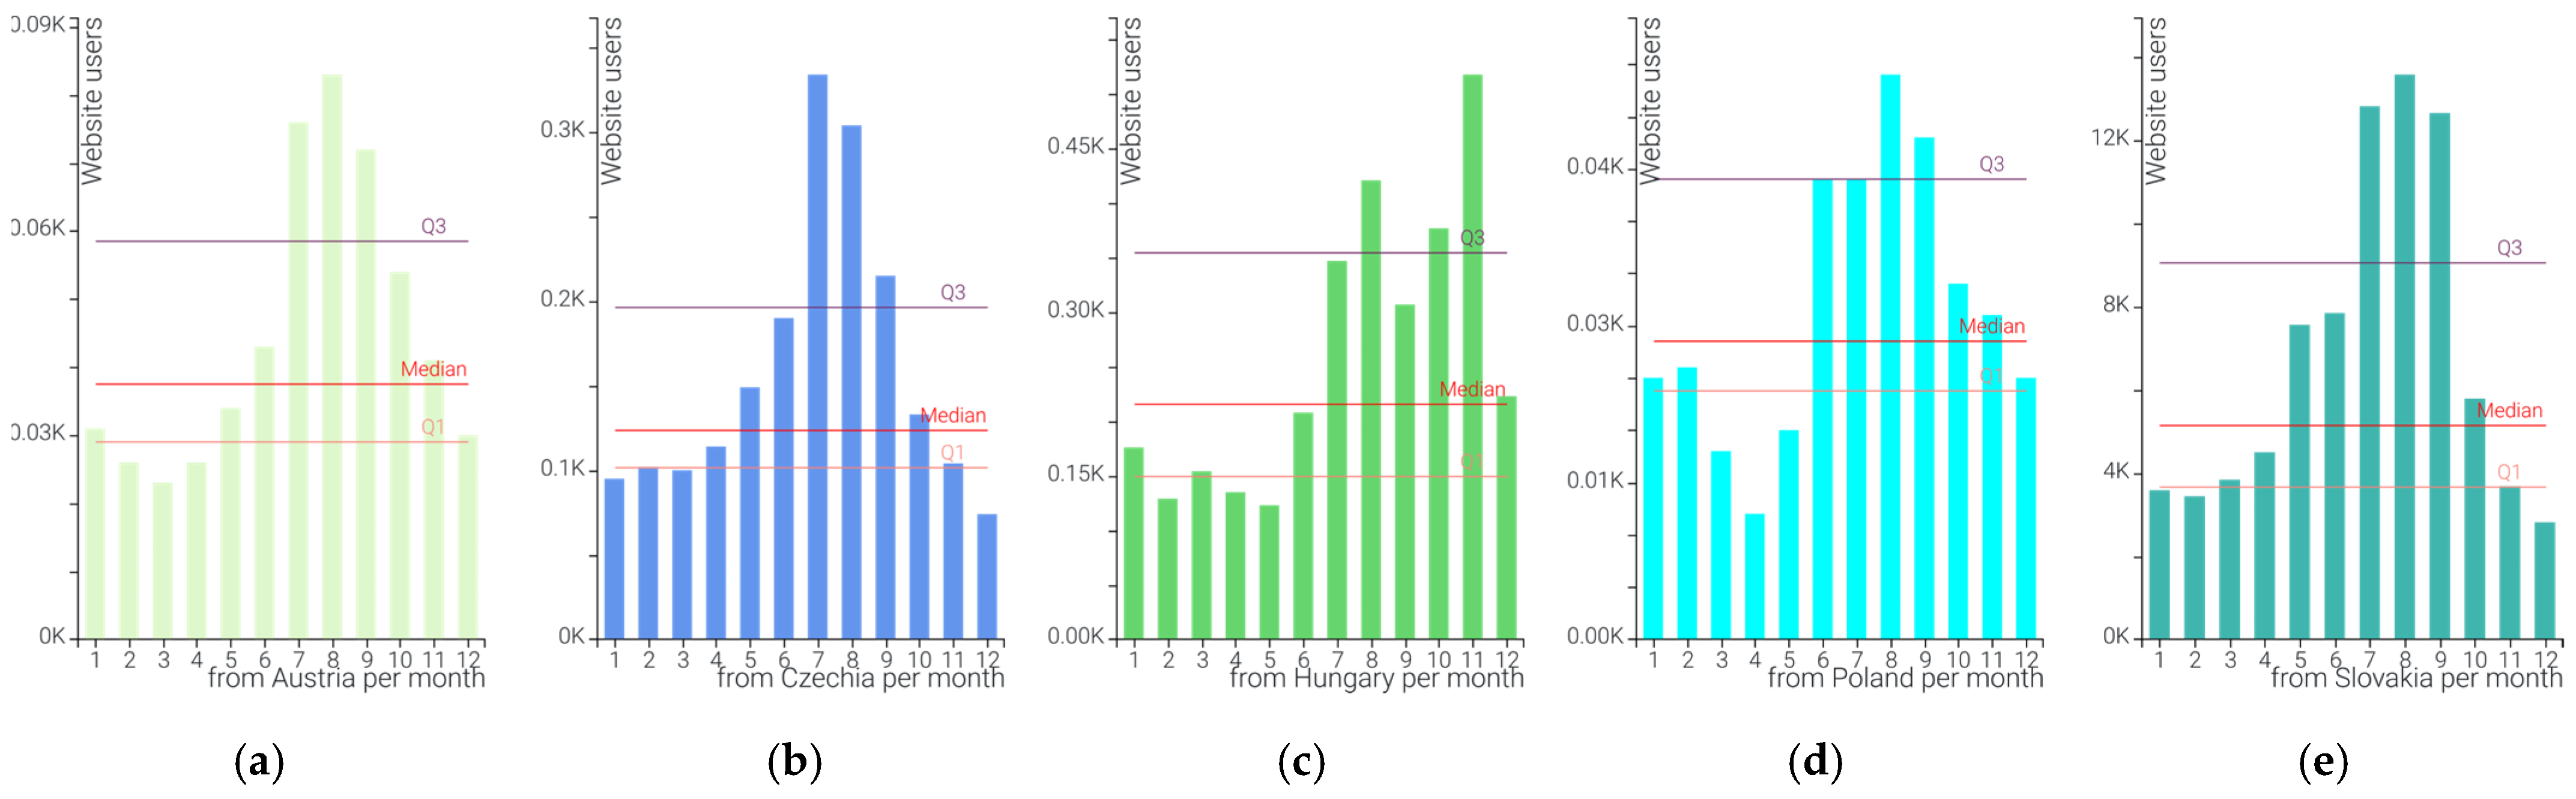
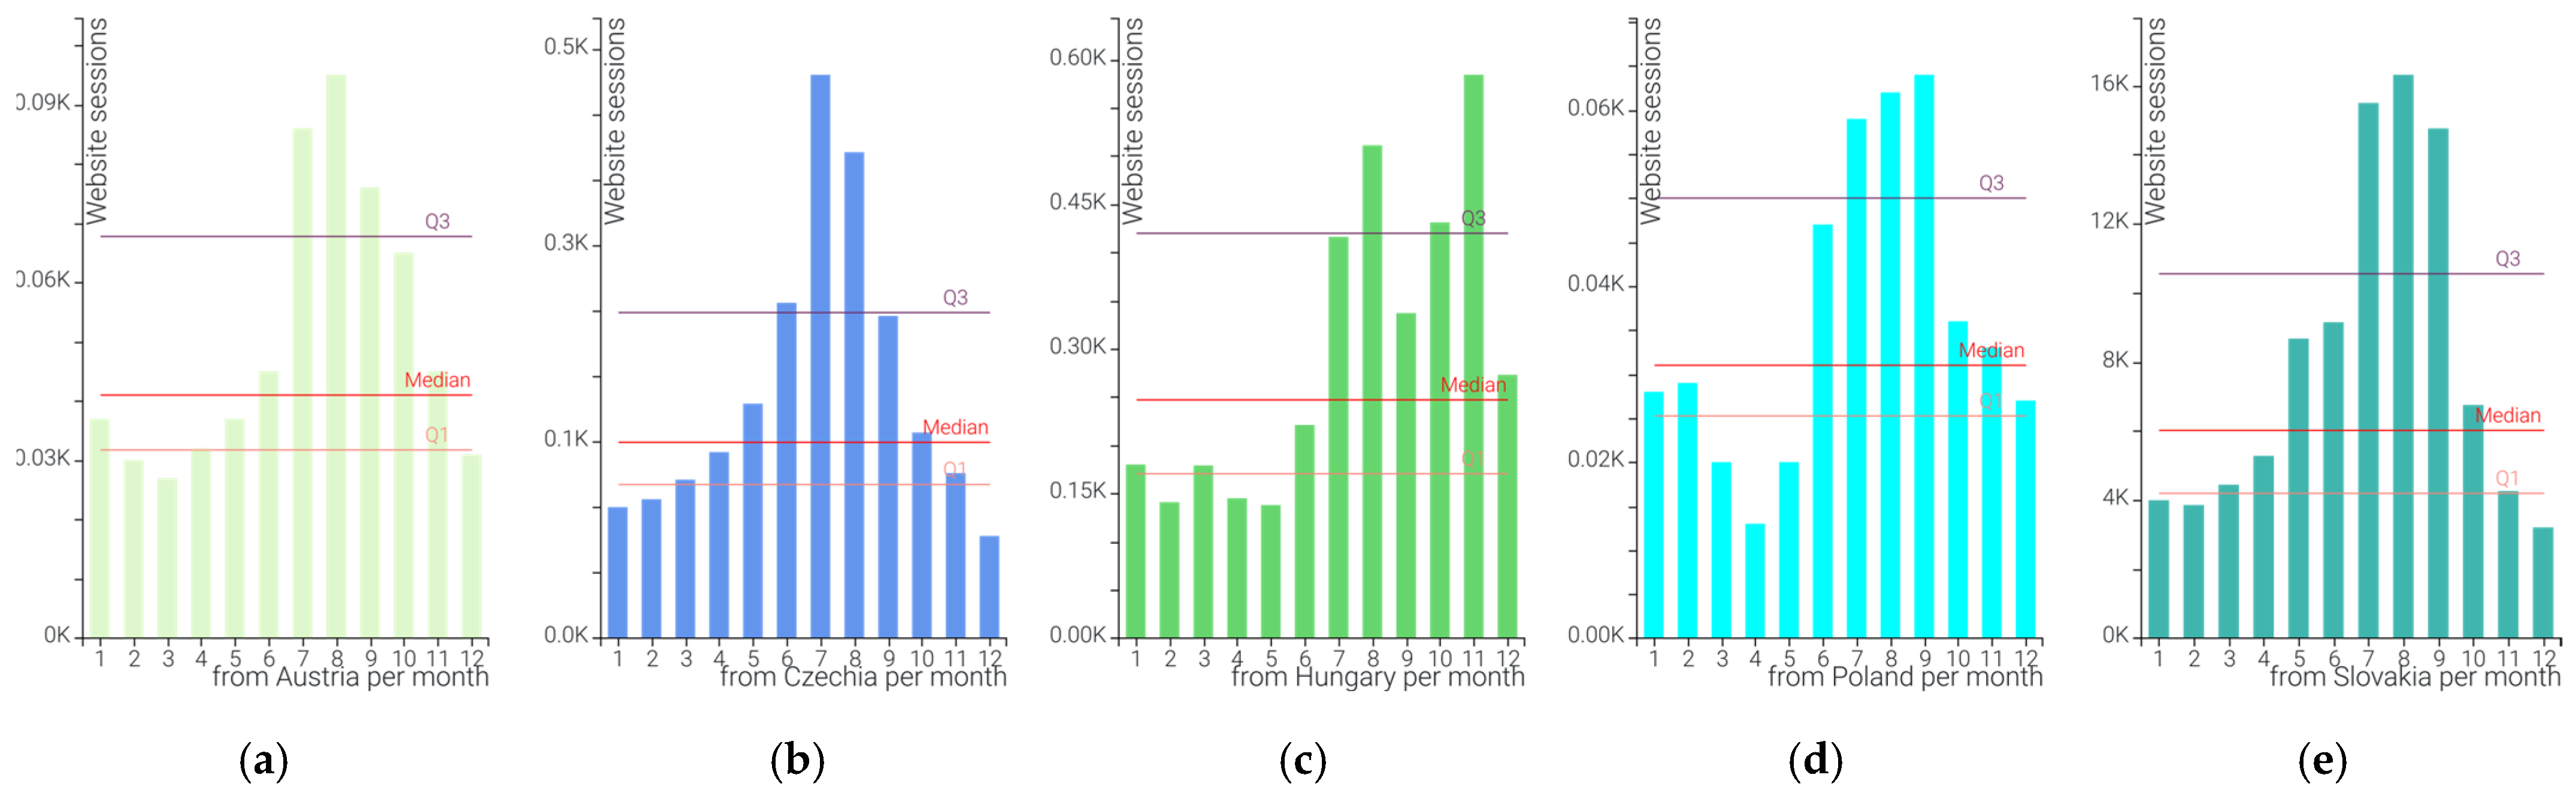
2.1.3. Data on Destination Website’s Audiences Engagement via Google Analytics

Data on the examined destination’s (DMO’s) website’s audiences were acquired via Excel data dumps from the DMO’s Google Analytics account and imported via simple Python code into a locally hosted PostgreSQL database [19]. For the pilot case, data containing the below enlisted monthly metrics were extracted:
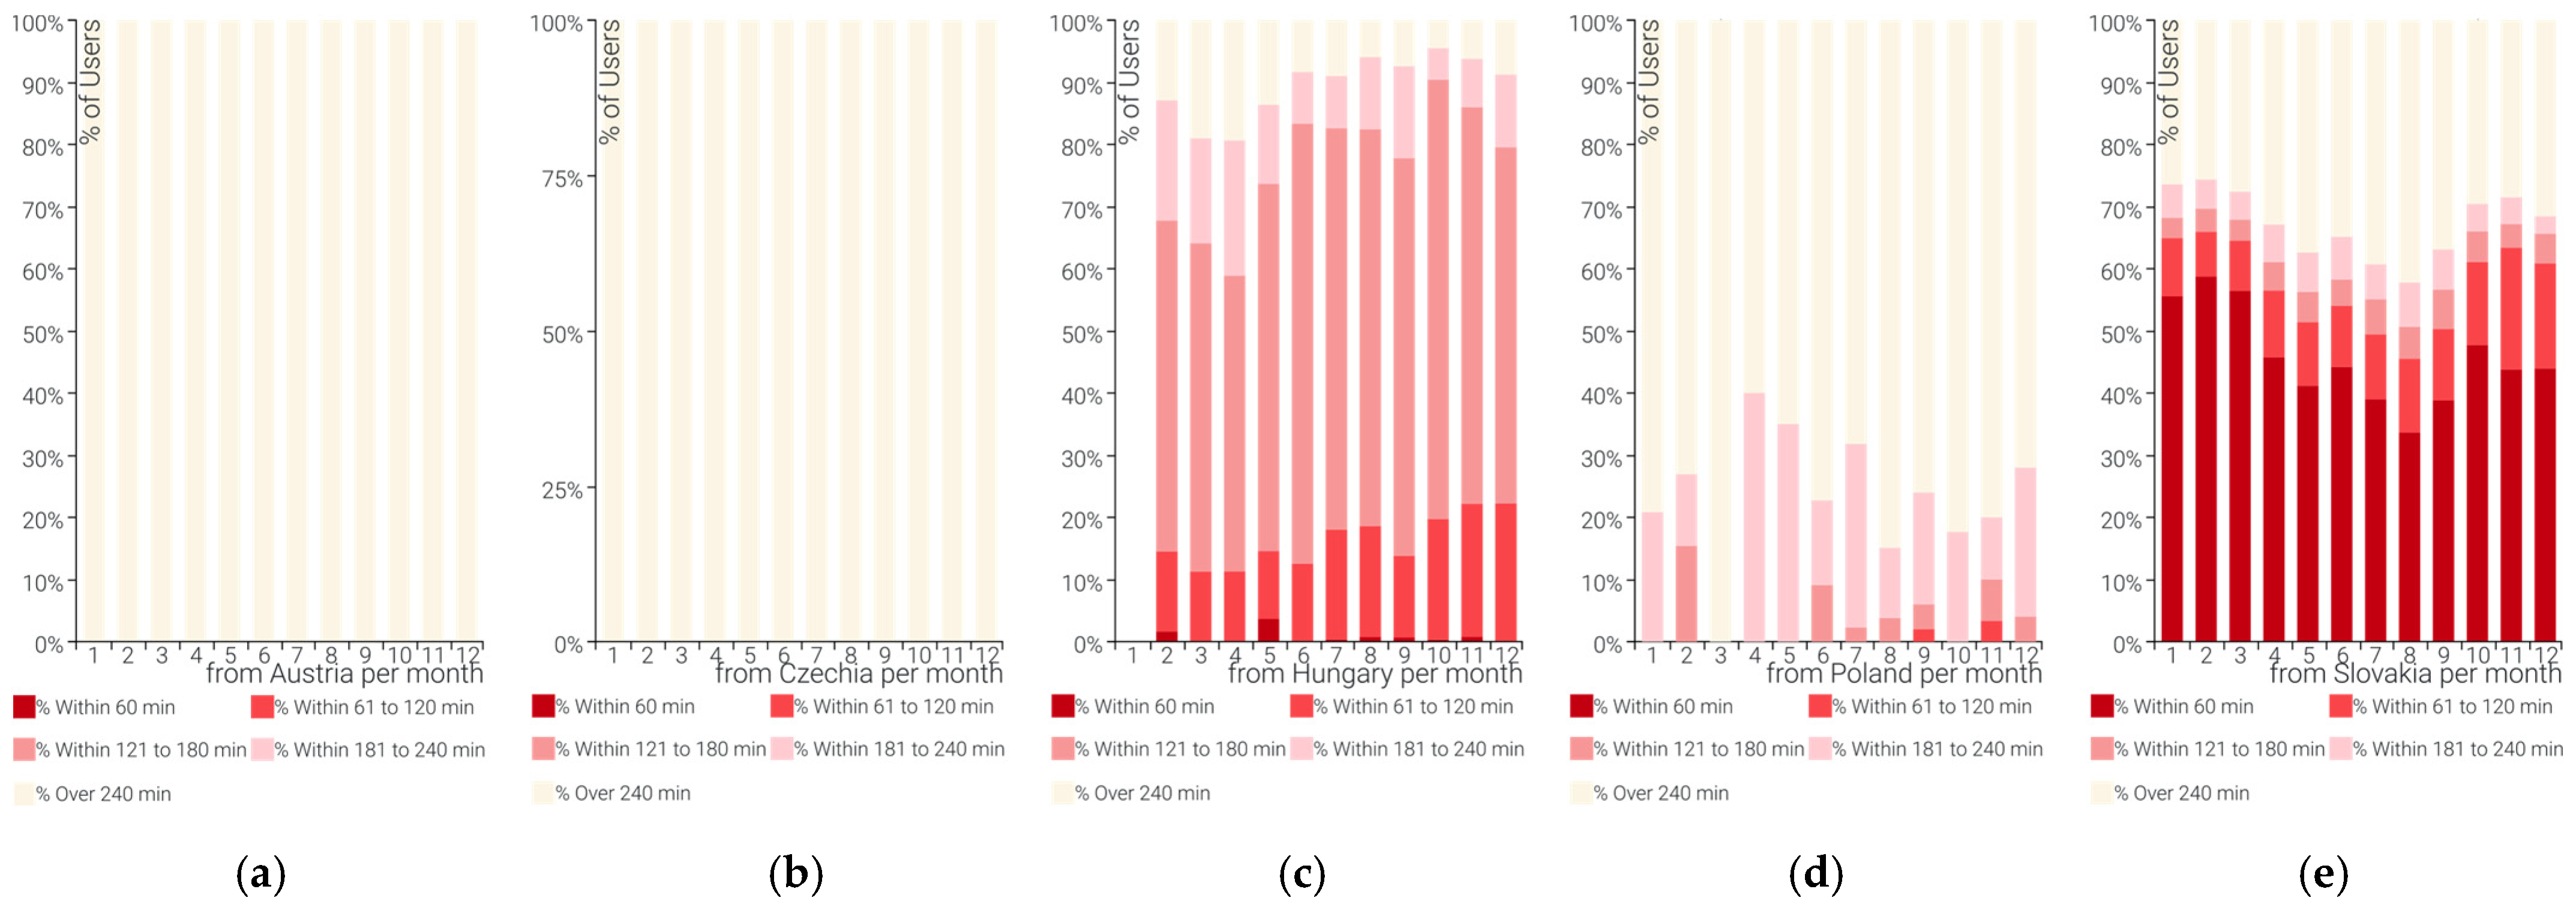
  • Metric name: Monthly users per country—aggregated number of the website’s visitors per country for the given period [20];
  • Metric name: Monthly sessions per country—aggregated number of the website visitors’ actions per country for the given period [21];
  • Metric name: Monthly session’s average duration per country—average duration of visitors’ session per country in minutes [22];
  • Metric name: Monthly users per city—aggregated number of the website’s visitors per city for the given period [20];
  • Metric name: Monthly sessions per city—aggregated number of the website visitors’ actions per city for the given period [21].

2.2. Extracted Data Transformation

All processes of data transformation were executed via simple SQL queries. Since all three data extracts contained a different format for the month attribute (string format A vs. string format B vs. string format C), a new integer attribute representing the month attribute was created. A similar obstacle was identified for country names. For the creation of harmonized names of countries, the nomenclature of the Statistical Office of the Slovak republic was chosen. For practical reasons, additional attributes were added (e.g., source name) to outcome layers for a merged data set at the country level.
Extracted data on audience engagement at the city level were treated separately based on the source, but with the same procedure. For the acquirement of data on the destination’s accessibility (distance in kilometers and trips’ duration by car in minutes), the first step was geocoding the cities. This was achieved via simple calls in Python towards the Openrouteservice Geocode API [17,19].
It must be noted that due to errors in Google Analytics city names (e.g., name was not set, the city did not exist, the city was in a different country), not all cities were geocoded. For this reason, Section 2.2 elaborates only on partial data (Table 1). Afterwards, geocoding was achieved via simple calls in Python towards the Openrouteservice DistanceMatrix API [18,19].

2.3. Data Aggregation, Basic Statistical Characteristics, and Data Loading

All aggregations and statistical computations were carried out over the resulting samples via simple PostgreSQL queries. The resulting statistical layers were visualized via the open JavaScript library Billboard.js [19,23]. Resulted data, statistical layers, and data visualizations are publicly available [19,39]. All basic statistical formulas are listed below.
The percentual share of variables (1) (e.g., market share by country of origin, share of accessibility by trip’s duration) was computed via simple fractions:
% x i = x i   x i     x n   100 ,
where:
  • % x i —percentual share of the ith number in the array;
  • x i   —the ith number in the array;
  •   x i     x n —sum of the array of numbers.
The Median, 25th Percentile, and 75th Percentile were computed via the PostgreSQL function PERCENTILE_CONT, which adopts the equation of a continuous distribution’s percentiles (2) [24,25]:
p = F(ηp) = P(X ≤ ηp),
where:
  • p—desired percentile;
  • ηp—100th percentile of X;
  • X—random variable of the array;
  • F(ηp)—cumulative distribution function of ηp;
  • P(X)—continuous probability distribution of X.
The monthly coefficients of growth (3) were computed as month over month rates, via a simple query that uses the LAG function by the partition of the variable’s fractions [24,25]:
M o M = ( x i   x i 1 1 ) 100 % ,
where:
  • M o M —monthly coefficient of growth;
  • x i   —the value of the variable for the ith month.
The geometric mean (4) of the variable was computed from the exponential average of MoM‘s natural logarithm [26]:
x ˜ = ( i = 1 n x i ) 1 n = x 1 × x 1 x n n ,
where:
  • x ˜ —geometric mean;
  • n —length of the array;
  • x 1 —first object of the array;
  • x n —last object of the array.
The correlation coefficients (5) were computed via the PostgreSQL function COOR, which adopts the following formula [27]:
r x , y = 1 n i = 1 n ( x i x ¯ ) ( y i y ¯ )
where:
  • r x , y —correlation coefficient of the given x and y arrays;
  • n —length of the array;
  • x i —the ith object of the x array;
  • x ¯ —the mean of the x array;
  • y i —the ith object of the y array;
  • y ¯ —the mean of the y array.
The coefficients of determination (6) were computed via the square of the correlation coefficient [28]:
r 2 = r x , y 2 ,
where:
  • r 2 —coefficient of determination;
  • r x , y 2 —square of the correlation coefficient.

3. Interpretation of Pilot ETL Procedures’ Purpose, Reusability, and Limitations

The below paragraphs describe each step’s purpose, prerequisites, limitations, and possible extension of use as added value. All steps may be replicated within a minimum of a Python 3.7 environment connected to a PostgreSQL database without the necessity of deeper programming skills. All results are available with a short technical description on GitHub, all necessary input changes are incorporated directly into the scripts [19].
1.
Batch extraction of data from the SOSR API
The script calls the SOSR API and retrieves the data on monthly occupancy by incoming markets’ origin for the specified year and districts, and by default loads the resulting data set into the database for further processing [29]. The resulting data may be also exported as an XLSX file format. The script’s main purpose is to eliminate the necessity of repeating manual tasks at the SOSR’s official web platform [29].
The main limitation is the granularity of available data for administrative units. While for cities covering whole districts (Kosice and Bratislava), the data may be considered whole, for destinations arising from several local administrative units (LAU2), data at the district level (LAU1) may be considered referential. Since the SOSR API’s contents structure is quite transparent, with a little editing the script may be easily reused for invoking any other data theme at the district level.
2.
Batch extraction of data from the Facebook’s Insights API
The script calls the Insights API for a Facebook page’s daily metrics (for further processing) on users, their basic interaction, and communicated content’s reach of audiences by origin country, and origin city [30]. By default, the resulting data is loaded into a database. Due to the extent of data, exports into tabular format files are not recommended. The only critical input prerequisite is Facebook page ID and its Access Token. By default, the script is set to retrieve daily metrics within monthly intervals, mainly for the possible risk of overloading the limit of several calls at one instance [30].
While the case focuses on a specific group of metrics aggregated by months, the script itself may be used for a wider range of metrics. The scalability of intervals and metrics may be beneficial also for narrower periods (e.g., weekends; periods of working holidays; specific days representing a life cycle of a DMOs event or campaign).
3.
Automated importing of Google Analytics dump files
At the time of carrying out the pilot case, an Access Token for Google Analytics Data API (GA4) was not at our disposal; for this, monthly aggregates of metrics within the scope of the case were manually extracted from the DMO Google Account as Excel dumps. The script’s only purpose is to connect to the folders containing data at the country or city level, extracting the paths of files, which then are used for creating joined datasets for further processing in a database. In other words, the purpose is to spare time [31]. Although the process is easily replicable for data from any other Google Analytics account, it is only recommended for people without deeper programming skills.
4.
Automated data harmonization and basic aggregation
In terms of purpose the script has several dimensions [32]:
  • The first is to harmonize the before-extracted data into joinable structures over the database by invoking simple SQL commands from a separate file. Mainly by transforming Facebook and Google nomenclature of countries’ names to be compatible with the SOSR nomenclature, and reformatting different representations of months’ notation.
  • Secondly, it replicates partial country aggregates of variables used for the graphs in the fourth section of the manuscript, with the possibility of extracting them as Excel dumps.
  • Thirdly, it creates two separate, but evenly harmonized sets of Facebook (hereinafter, FB) and Google Analytics (hereinafter, GA) data at the city level for further processing.
  • Fourthly, it creates a predefined set of distinct cities’ geocodable nomenclature from the FB and GA data, for further geocoding. The purpose is to exclude unidentifiable place entries and create a single set of geocoded cities, thus lowering the necessity of repetitive geocoding.
By default, the second, third, and fourth dimensions are set to countries within the scope of the case; of course, this may be easily changed. Other parts also may be easily scaled by changing the state of command to a comment. The automated assignment of FB country names to the source abbreviations and other time-saving actions may be considered a benefit.
5.
Predefined samples’ batch geocoding and validation
The sole purpose of the script is to geocode via the Openrouteservice Geocode API the before-created set of distinct cities’ nomenclature [33]. The only obligatory necessity for replication is a free API Access Token. The script incorporates a simple validator for flagging potential incorrect records of cities that may have been previously missed [33].
6.
Primary (valid city entries) batch acquisition of distance matrixes
The script uses the Openrouteservice Distance Matrix API to compute and update the routes’ duration and distance from the before-created and geocoded unique set of distinct cities’ nomenclature [34]. The only necessity for replication is a free API Access Token. By default, the routes are set to the destination within the scope of the case, which may be easily changed.
7.
Automated interval aggregation of cities’ distance matrixes
The purpose of the script is mainly to replicate the partial city aggregates of variables used for the graphs in the fourth section of the manuscript, with the possibility of extracting them as Excel dumps [35]. The script joins the before-created set of geocoded distance matrixes of distinct places with the GA and FB layers at the city level and sorts the monthly aggregated data into 1 h interval bins.
8.
Secondary (airports) batch acquisition of distance matrixes
The component computes the selected cities’ distance matrix to assigned airports by car. By default, it invokes foreign administrative units being originally over a 240 min trip by car from the destination, and this may be changed and scaled [36].
9.
Automated interval aggregation of airports’ distance matrixes
The purpose of the script is mainly to replicate the partial city aggregates of variables used for the graphs in the fourth section of the manuscript, with the possibility of extracting them as Excel dumps [37]. The script joins the before-created temporary set of geocoded distance matrixes to selected airports with the GA and FB layers at the city level and sorts the annual aggregated data into 1 h interval bins.
10.
Batch computation of basic relationships’ linearity
The script just computes correlation coefficients and coefficients of determination between selected variables [38]. Its main purpose is to test the functionality of before-presented scripts’ temporal outcomes. Furthermore, its outcomes extend the discussion.

4. Resulting Aggregations’ Interpretation and Discussion

To test the usability of the pilot runs’ outcomes, all statistical layers were incorporated into a simple yet interactive web dashboard. Due to the limits of exported graphs’ rendering within the manuscript, it is encouraged to visit their native source [39]. All resulting statistical layers are publicly available as exported Excel dumps [19].
All interpretations refer only to the extent of processed data described in the second and fifth sections of the manuscript. None of the interpretations tend to evaluate the examined DMO’s marketing or management activities but refer only to the extent of sampled data in the form “as is“. It must be noted that for the longer part of the sampled year, the examined destination was under strict COVID-19-related restrictions; thus, the resulting limitations of statistical interpretations should be considered.

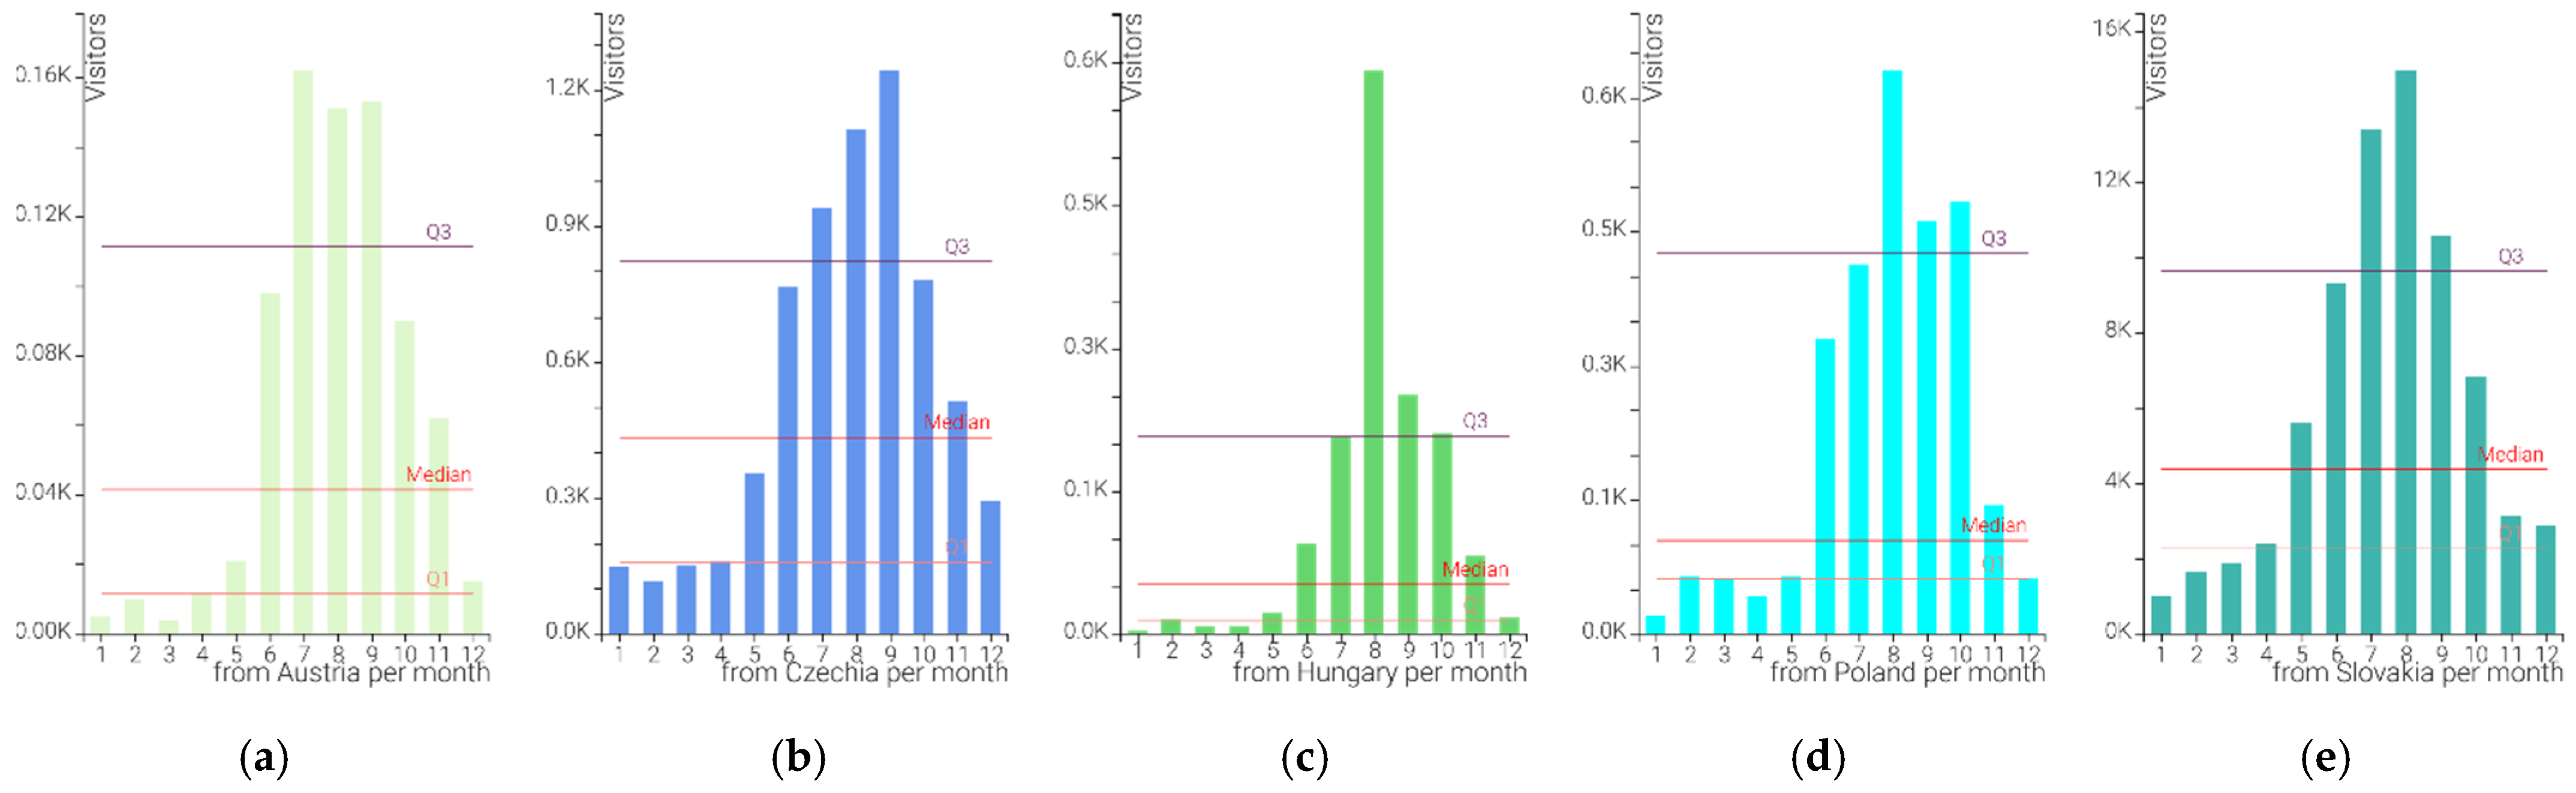
4.1. Overview of Selected Incoming Markets’ Position in the Sample Year of 2021

The selected countries as incoming markets represented the vast majority (89.2%) of the number of officially registered visitors (Figure 1a) and the majority (85.9%) of overnight stays (hereinafter, ONSs) (Figure 1b). Domestic tourism’s dominance is indicated by both the share (77.0%) of Slovak visitors and their share of overnight stays (74.6%) (Figure 1a,b). From the selected neighboring incoming markets (hereinafter, sampled foreign markets), only Czechia had a subjectively significant share (Figure 1a,b). The annual average number of ONSs per visitor was around two, this may indicate that most trips did not exceed the length of an extended weekend trip or short-term business trip (Figure 1c).
In terms of annual engagement with the DMO’s website, the sampled markets represented the majority of users (89.2%) (Figure 2a) and sessions (89.4%) (Figure 2b). It should be noted that the vast majority of both metrics were generated by Slovak users. At the same time, none of the sampled foreign markets reached a significant share. None of the sampled markets exceeded the average session duration of 3 min (Figure 2c).
The DMO’s Facebook page audiences were mostly represented by domestic Slovak users (79.8%), while the sampled foreign markets did not combine a significant share (Figure 3a). Similarly, the DMO’s Facebook content reached mostly Slovak users (Figure 3b). Domestic audiences also represented the largest share of interactions with communicated content (Figure 3c). None of the sampled foreign markets reached a 1% share of impressions or content activity.

Sampled Markets’ Monthly Overview in 2021

In terms of destination visitors’ seasonality, Austria (Figure 4a), Czechia (Figure 4b), and Slovakia (Figure 4e), all of them having their weakest season (≤0.25 percentile) from January to March and their strongest season (≥0.75 percentile) from July to September, shared a similar trend. A similar shared seasonality trend may be observed between Hungary (Figure 4c) and Poland (Figure 4d), having their weakest season (≤0.25 percentile) in January, March, and April, and strongest season (≥0.75 percentile) from August to October.
While their weakest season (≤0.25 percentile) slightly varied, all sampled markets shared the weakest month of ONS in January. Czechia (Figure 5b), Hungary (Figure 5c), and Poland (Figure 5d) shared April among their weakest. Slovakia (Figure 5e) and Czechia slightly copied their trend of the weakest season from January to March. Altogether it may be stated that the first quarter of the year represented the weakest season of the year, for Austria, Czechia, and Slovakia, the strongest season (≥0.75 percentile) was from July to September, and for Hungary, the strongest period was identified to be between August and October.
Even though the average number of ONSs was low, some seasonal extremes may be observed. For Austria (Figure 6a), the months of January, February, and August were the strongest (≥0.75 percentile). For Czechia (Figure 6b) and Poland (Figure 6d), February and March were the strongest. For Hungary (Figure 6c), the month of January was extremely high. For Slovakia (Figure 6e), December, being one of the weaker months in terms of ONSs, generated the highest average of ONSs.
In terms of monthly website users, Austria (Figure 7a), Czechia (Figure 7b), Poland (Figure 7d), and Slovakia (Figure 7e) copied each other’s strongest seasons in July and August. Hungary (Figure 7c) peaked between August and November.
The seasonality of monthly website sessions also shared some similarities. Austria (Figure 8a), Poland (Figure 8d), and Slovakia (Figure 8e) peaked between July and September. Czechia (Figure 8c) peaked earlier between June and August, while Hungary (Figure 8c) later, between August and November.
Monthly impressions indicate the peak for Austria (Figure 9a) and Slovakia (Figure 9e) was between July and September. Czechia (Figure 9b), Hungary (Figure 9c), and Poland (Figure 9d) peaked in February; however, it must be noted that in comparison to other months, their peaks were extreme anomalies.
Monthly content activity peaked for Austria (Figure 10a), Czechia (Figure 10b), Hungary (Figure 10c), and Poland (Figure 10d) in the first half of the year between January and May, as opposed to Slovakia, where the peak was observable between September and December. It must be noted that peaks for Hungary and Poland indicated extreme anomalies.

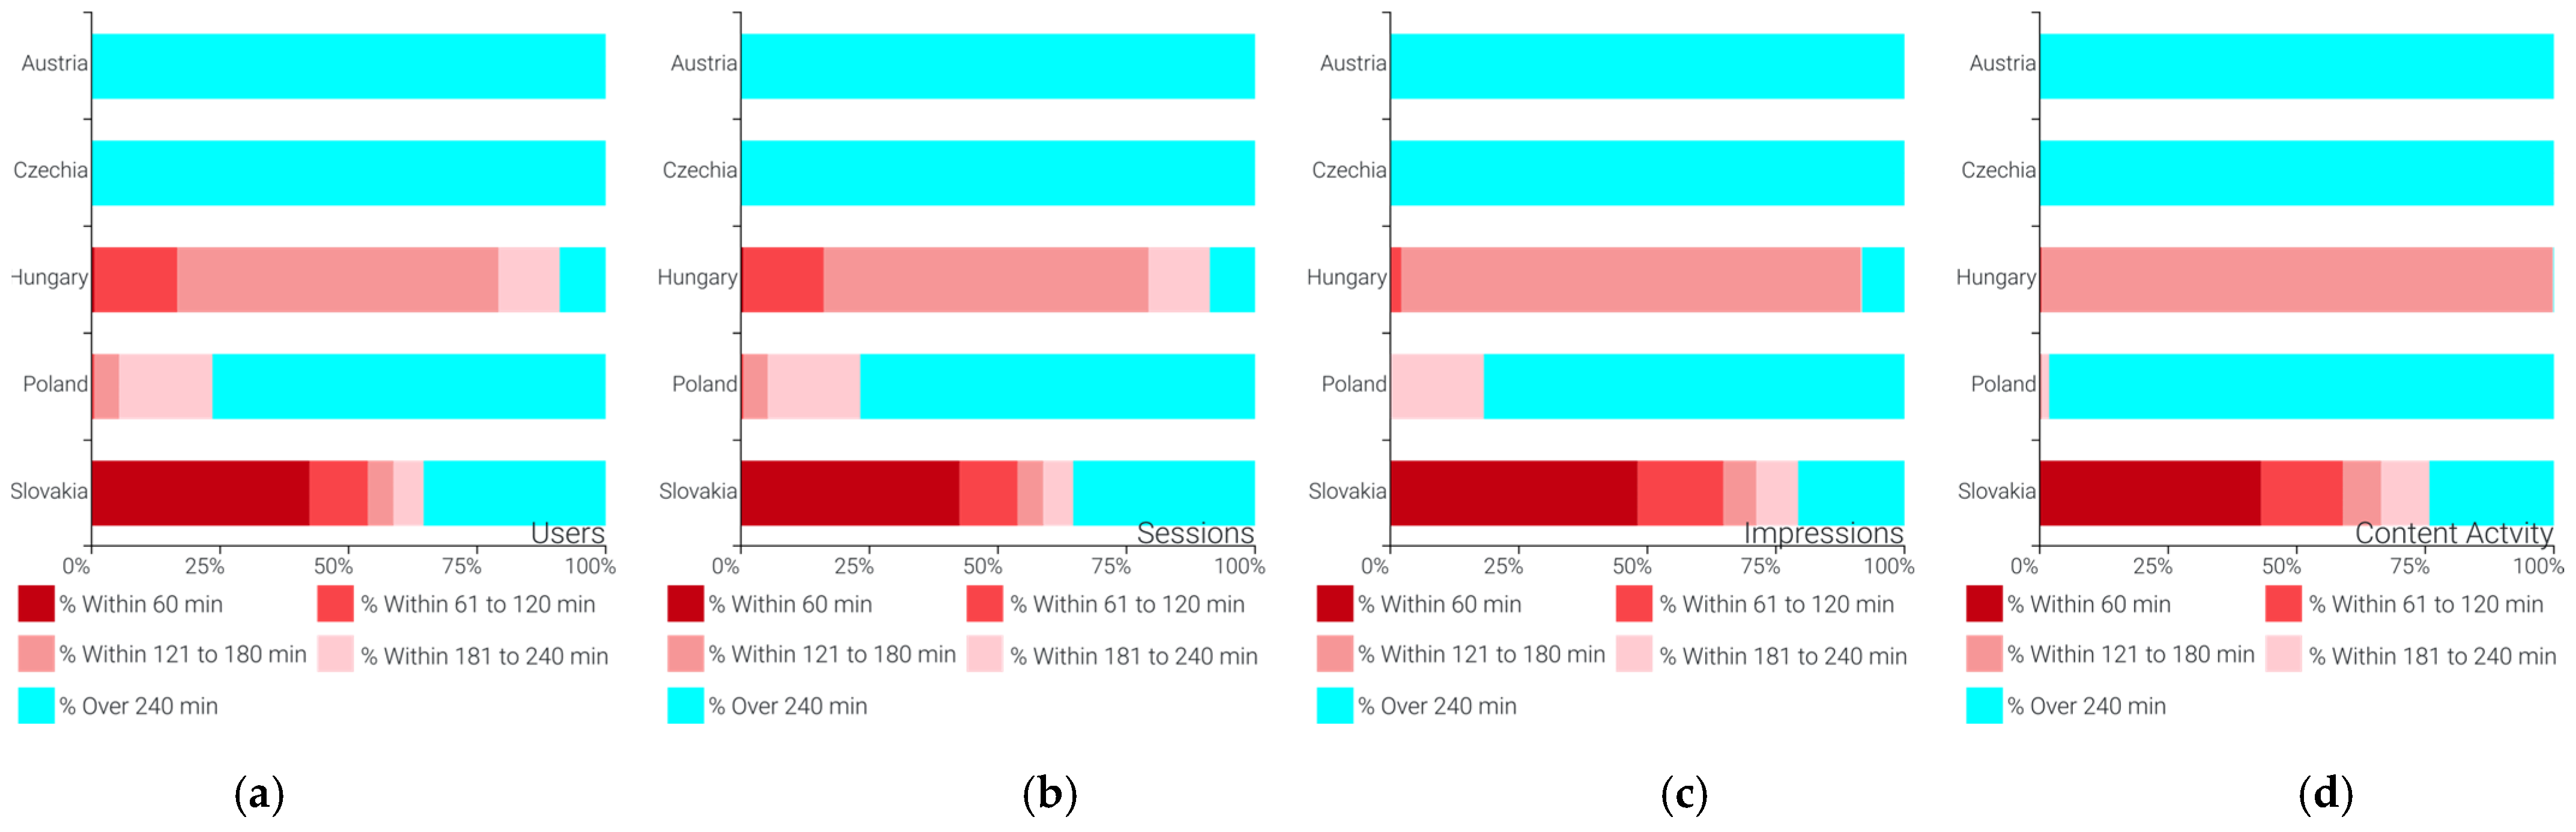
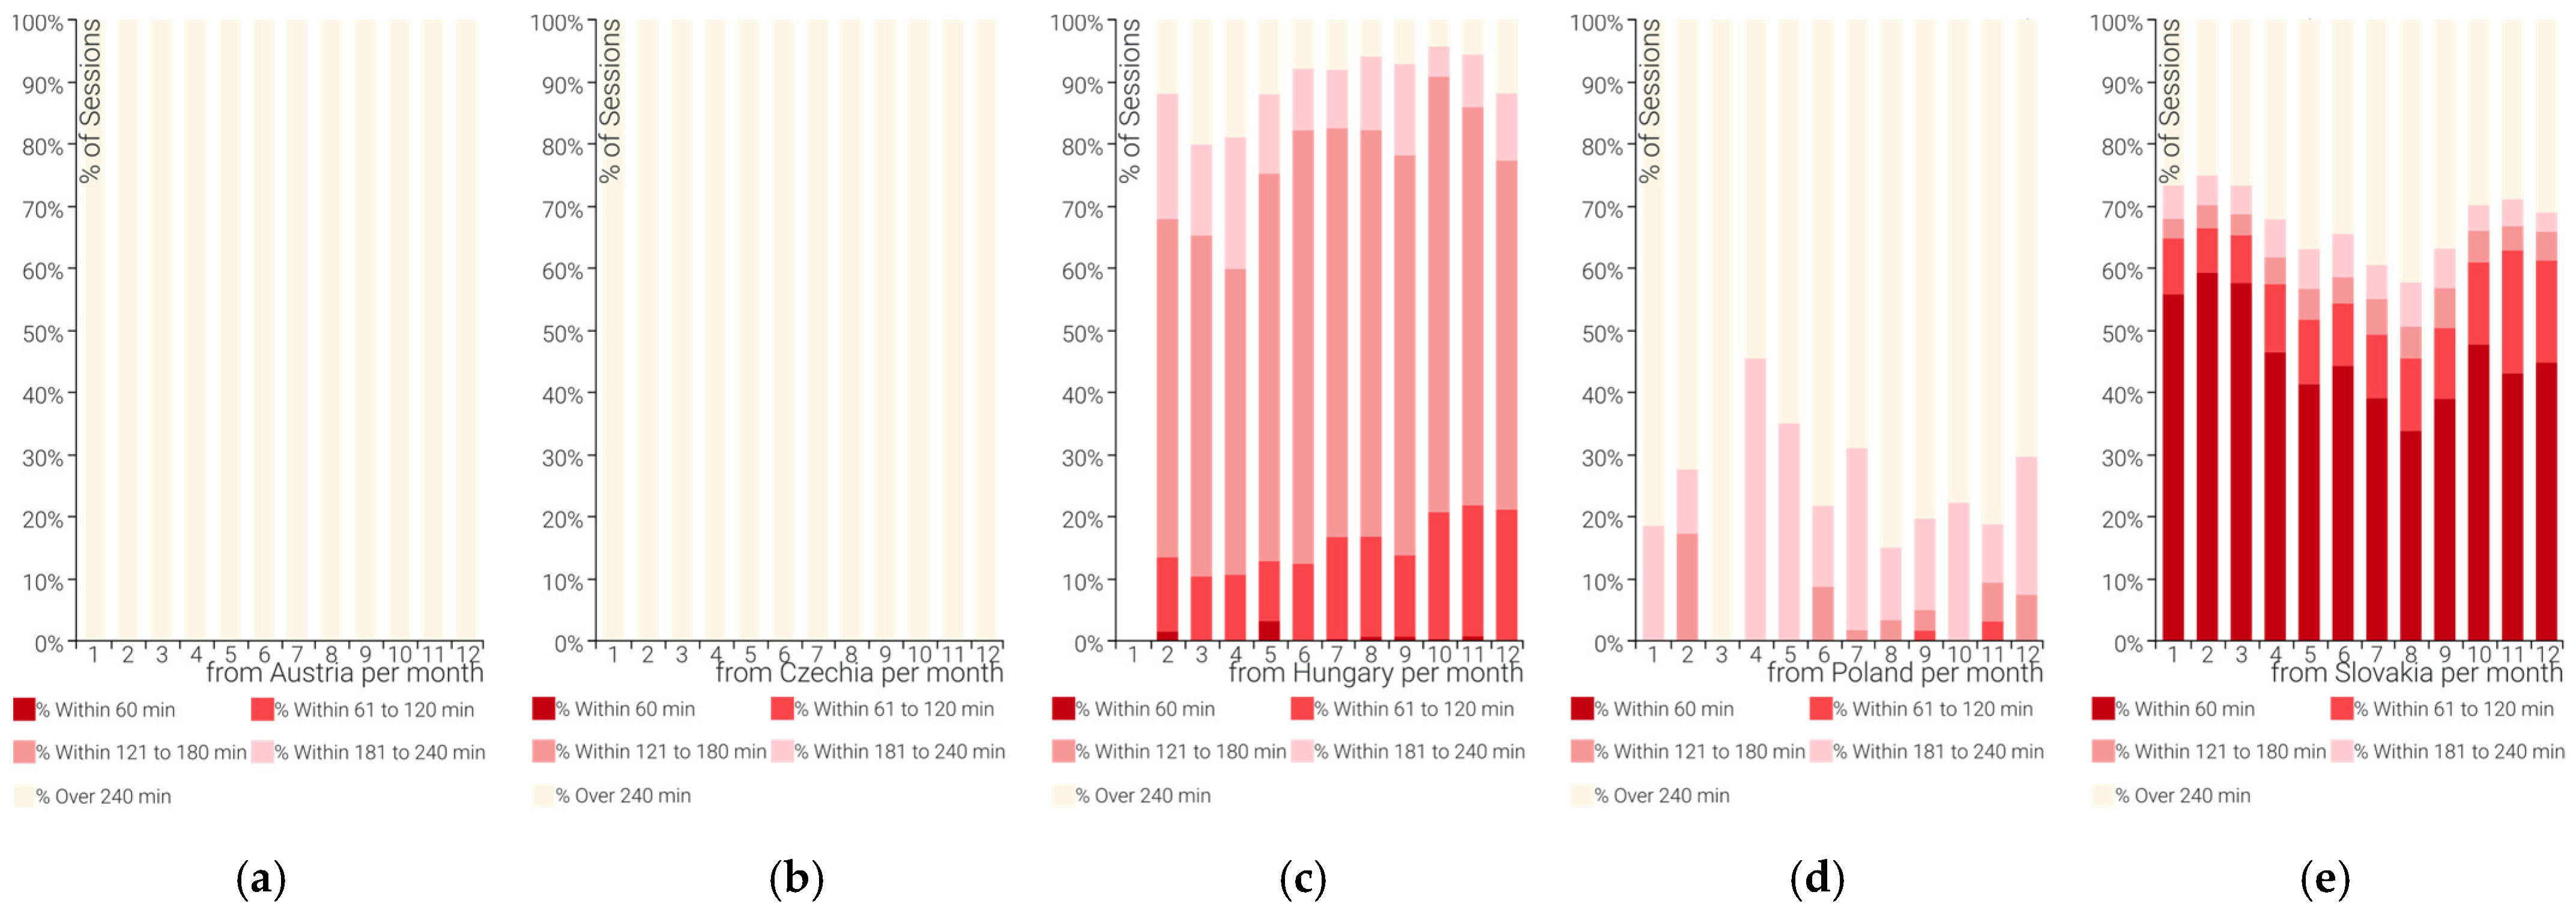
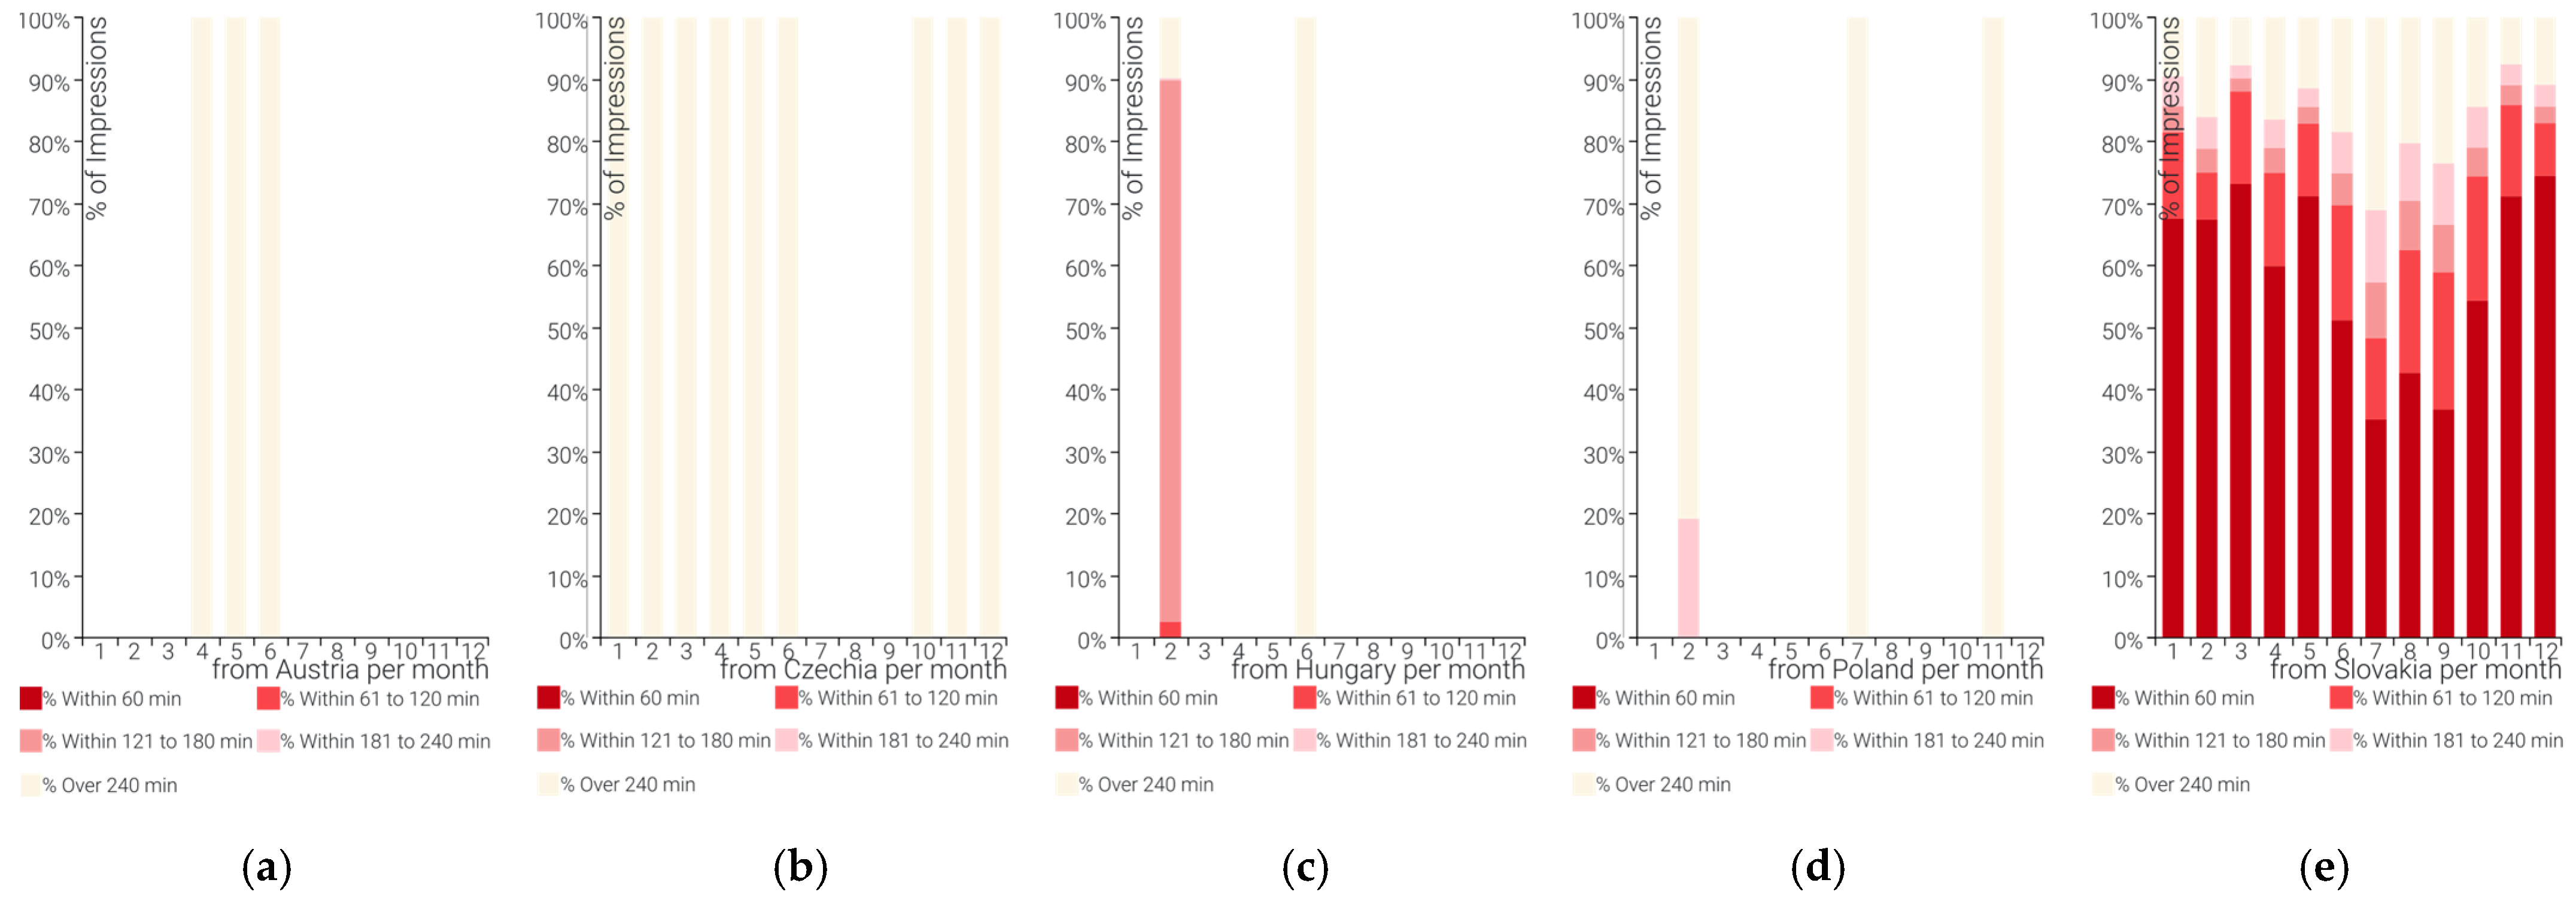
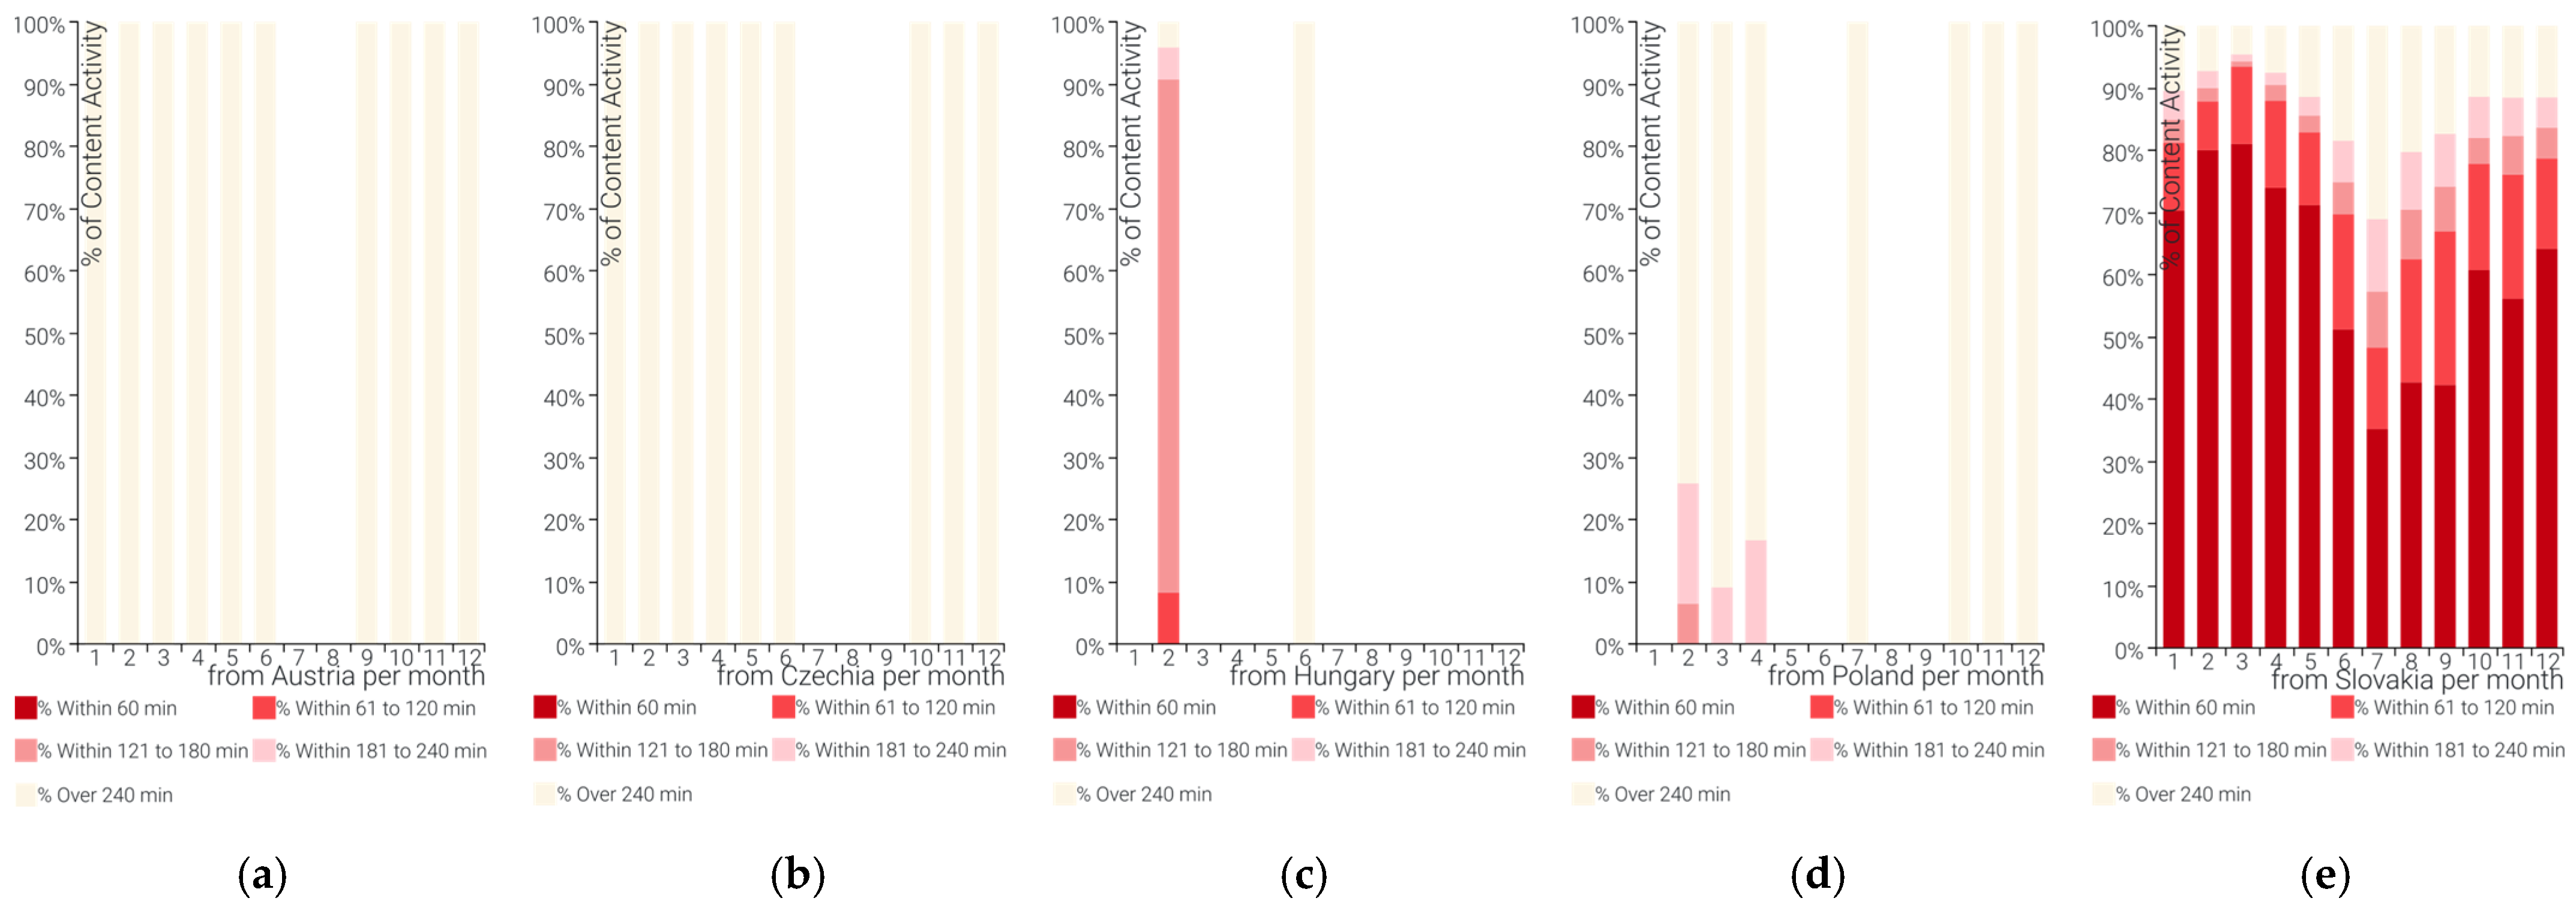
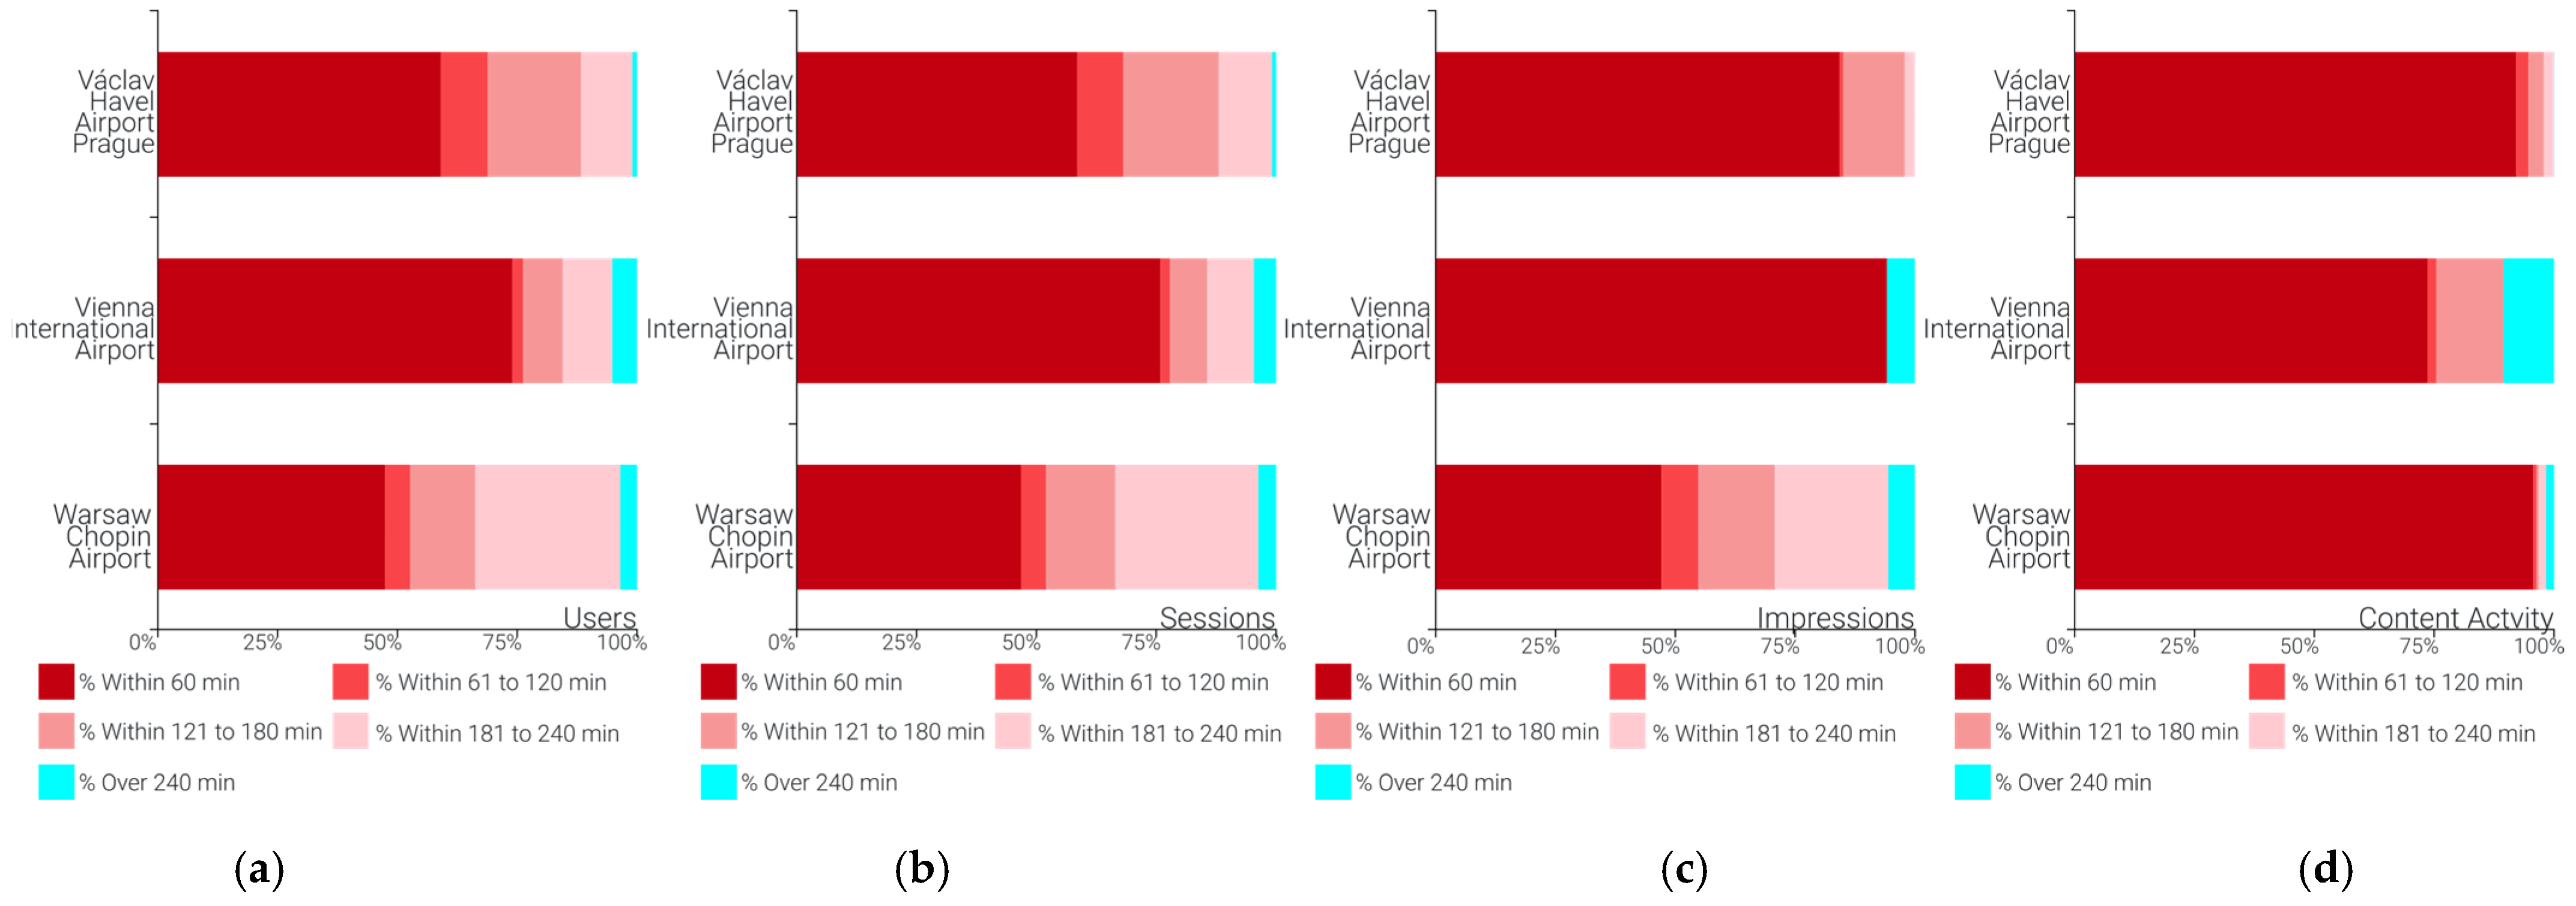
4.2. Sampled Market Audiences in Terms of the Destination’s Accessibility via Car

In the following section, the term “duration bin” refers to aggregations of data by incoming journeys to the destination by car in 1 h intervals.
The computed sample of audiences’ aggregated distance matrixes indicates that all Austrian (Figure 11) and Czech (Figure 11) online interactions with the DMO’s website and Facebook content were from places from which a trip by car would take more than 4 h. This may partially indicate the validity of geocoded data.
The majority of Hungarian website users (62.5%), sessions (63.17%), impressions (89.9%), and content activity (99.4%) were from places within the range of 121 to 180 min. The majority of Polish website users (76.5%), sessions (76.8%), impressions (81.8%), and content activity (98.2%) were from places over 240 min away. The majority of Slovak website users (53.75%), sessions (53.8%), impressions (64.78%), and content activity (58.9%) were from places within the range of 120 min.
The computed monthly shares of duration bins of users (Figure 12), sessions (Figure 13), impressions (Figure 14), and content activity (Figure 15) for Austrian and Czech audiences are visualized for geocoded data validation.
Hungarian users (Figure 12a) were mainly in the duration bin between 121 and 180 min, with an annual geometric mean (hereinafter, AGM) of −5.51%, and the highest monthly coefficient of increase (hereinafter, MoMi) in May (+24.19%), and lowest MoM decrease (hereinafter, MoMd) in December (−10.19%). Hungarian users in the duration bin between 61 and 120 min were the only ones to achieve a positive GM (+7.24%), with the two highest MoMis in July (+41.6%) and October (+48.06%). Polish users (Figure 12d) were mostly represented in the duration over 240 min, with a negative annual GM (−0.86%), the highest MoMi in March (+36.84%), and the lowest MoMd in April (−40.0%).
Monthly aggregations of Slovak users (Figure 12e) were represented mainly in the duration bin within 60 min, with a negative AGM (−2.21%), with the highest MoMi in October (+22.89%), and lowest MoMd in April (−18.95%). Slovak users in the duration bin between 61 and 120 min achieved a positive AGM (+5.51%), with the highest MoMi in November (+47.15%), and lowest MoMd in February (−23.13%). Slovak users in the duration between 121 and 180 min achieved a positive AGM (+3.51%), with the highest MoMi in April (+35.10%) and July (+33.65%), and MoMd in November (−23.94%).
The share of monthly sessions in terms of audience accessibility (Figure 13) more or less copies the monthly shares of users.
Due to an insufficient volume of geocodable data of monthly aggregations of impressions by city, Austria (Figure 14a), Czechia (Figure 14b), Hungary (Figure 14c), and Poland (Figure 14d) are only visualized.
Slovak audiences’ impressions (Figure 14e) were mainly represented by the duration bin within 60 min, with a positive AGM (+0.88%), with the highest MoMi in October (+47.73%), and lowest MoMd in July (−31.25%). Slovak impressions in the duration between 61 and 120 min achieved a negative AGM (−4.37%), with the highest MoMi in March (+96.83%), and the lowest MoMd in February (−45.8%). Domestic impressions falling into the bin between 121 and 180 min achieved a negative AGM (−4.06%), with the highest MoMi in April (+91.0%) and June (+91.08%), and the lowest MoMd in March (−45.34%). Domestic impressions in the duration bin between 180 and 240 min achieved a negative AGM (−2.83%), with the highest MoMi in April (+116.51%) and June (+122.67%), and lowest MoMd in March (−58.43%). Slovak impressions in the duration bin over 240 min had a positive AGM (+1.22%), with the highest MoMi in April (+113.21%), and the lowest MoMd in March (−51.99%).
Due to an insufficient volume of geocodable data of monthly aggregations of content activity by city, Austria (Figure 15a), Czechia (Figure 15b), Hungary (Figure 15c), and Poland (Figure 15d) are only visualized.
Monthly Slovak content activity was represented mainly in the duration bin within 60 min, with a negative AGM (−0.83), with the highest MoMi in October (+43.69%), and the lowest MoMd in July (−31.25%). Slovak content activity in the duration bin between 61 and 120 min achieved a negative AGM (−2.65%), with the highest MoMi in March (+58.62%), June (+58.16), and August (+51.22), and the lowest MoMd in October (−30.7%). Slovak content activity in the duration bin between 121 and 180 min achieved a negative AGM (−2.64%), with the highest MoMi in April (+195.4%) and June (+91.08%), and the lowest MoMd in March (−59.53%). Domestic content activity falling in the duration bin between 180 and 240 min achieved a positive AGM (+0.4%), with the highest MoMi in April (+75.89%) and June (+122.67%), and the lowest MoMd in March (−59.27%). Slovak content activity within a duration bin over 240 min achieved a positive AGM (+0.87%), with the highest MoMi in April (+63.91%) and July (+68.05%), and the lowest MoMd in March (−36.81%).
Even though the interim results of Austrian, Czech, and Polish audiences’ accessibility by car do not fit in the set limit of a 4 h long incoming trip, considering the examined destination’s accessibility via its airport indicates otherwise.
Putting into consideration the direct flight’s duration from Vienna (55 min), Warsaw (70 min), and Prague (70 min), and estimating a very rough average time necessary for airport check-in and boarding (60 min), a time reserve of around 2 h arises (rough estimation of incoming by mixed transportation means: Vienna 125 min, Warsaw 110 min, Prague 110 min).
Thus, by recomputing the distance matrixes of relevant audiences’ samples (originally in the duration bin over 240 min), it may be seen (Figure 16a) that the majority of Austrian (76.2%) Czech (68.84%), and Polish (52.62%) users are within the range of a 2 h long drive from their connecting airports. The same majority may be seen for Austrian (77.85%), Czech (68.11%), and Polish (52%) sessions (Figure 16b). For impressions (Figure 16c), the vast majority of Austrian (94.12%) and Czech (85.03%) fall in the bin within 60 min. In terms of content activity (Figure 16c), the majority of all three samples fit within the limit of 2 h. Subjectively, it may be noted that if transportation by plane is added to the sampled audiences’ mix of transportation mean, the vast majority is indeed within the limit of 4 h for the incoming trip’s duration.
As was already noted, during the period of the sampled year (2021), partial industries of travel and tourism were heavily impacted by both local and international restrictions aiming to ease the disasters of the COVID-19 pandemic. The example of potential usage represents purely theoretical considerations that elaborate from incomplete data (narrow extent of sampled data, validation of statistical distribution, etc.), without the comparison with an adequate sample of primary data describing the profiles of actual visitors of the destination (e.g., origin by city/city; purpose of visit; mean of preferred transportation; source motivation to visit the destination; anonymized timestamps of stay in the destination) and most importantly, general impact factors on tourism (e.g., travel restrictions).
Looking at Slovakia, in terms of the linear relationship of sampled variables as a dependent (number of visitors) and independent (number and share of users, impressions, and content activity by bins of duration), a strong direct linear relationship (rx,y > 0) may be observed between the number of visitors and sampled quantities of variables for all duration bins [40]. This changes into an indirect linear relationship (rx,y < 0) for shares of duration representing shorter incoming trips (within 60 min), and in one case, almost no linear relationship is indicated (share of users within 61 to 120 min) [40].
Looking at the percentage of explainable variation of the sampled dependent variable (number of visitors) by the share of independent variables’ duration bins via the percentual coefficients of determination, the following may be observed.
For website users’, the duration bin over 240 min indicates the strongest linear relationship [40]. For impressions, the weakest relationship may be observed for the duration between 61 and 120 min [40]. For content activity, the strongest relationship may be observed in the duration bin within 60 min, followed by the bin over 240 min, and the bin between 181 and 240 min [40].
The directness of the relationships’ linearity, and coefficients of determination, may indicate that the share of Slovak website users in duration bins over 240 min may have an impact on the number of destination visitors. Considering the annual average number of Slovak ONSs at 1.6, the months with visitors’ rates under the median (between January and April; between November and December), and national holidays, one could test the upper-mentioned potential impact in the year 2023.
January 6th (Friday) as a national holiday creates a potential 3 days trip, without the necessity of using employee vacation days. The same 3 days trip may be modeled for the 17th of November (Friday). Between the 7th (Friday) and 10th of April (Monday), a four-day trip may be modeled. Since the Google Analytics data indicate no advertisement purchases in 2021, targeting audiences in duration bins over 240 min with content connected to the modeled periods could show some interesting results.

5. Conclusions

The results’ simplified summarization from two points of view is in place. Firstly, from a technical stance, the presented reusable ETL scripts for the aforementioned data sources may be used both altogether and individually. In terms of used techniques, it must be admitted that future extraction of Google Analytics data should be carried out via an API connection. The pilot results indicate that both Facebook’s Insights API and the SOSR API are quite straightforward. The unification of different country nomenclatures with the nomenclature used by SOSR is modifiable, as is any other part of the results. Subjectively, for the pilot case, the share of non-geocodable cities did not cause a drastic distortion for the elaborated statistical interpretation, but it should be considered as a possible obstacle for future replication. While the Openrouteservice Geocode API does return a variable for the geometry’s confidence, the created validator flags inappropriate results, even if geocoded.
In terms of the pilot results’ statistical interpretation, it can be stated that for the given period, the majority of both visitors staying overnight and online audiences of the examined destinations are domestic. This may be stated both for annual and for monthly data; on the other hand, some seasonal similarities between the examined markets may be identified. Given the aforementioned majority of domestic online audiences, the share of users, sessions, impressions, and content activity within a 1 h long drive by car is quite disturbing at first sight, mainly due to the subjective opinion that audiences in the given range are more likely to be one-day visitors than tourists staying overnight. However, the seasonal trends indicate that the share of domestic audiences from more distant places (over 180 min and more) and with a bigger potential for staying overnight grows in the peaks of seasonal occupancy. The mix of means of transportation (by car and airborne) clearly show that the majority of examined foreign market audiences are within the range of a 4 h trip.
Even though the notes’ results are limited by the pilot’s dimensions, the processes behind them may be reused partially without any deeper programming skills by any DMO or service provider that has a necessity of investigating the seasonal relations of online audiences and partial accessibility. The SOSR API is mainly beneficial for Slovak cases, but the other presented results in the third section may be beneficial in terms of saving time within ETL processes. The simple yet reusable dashboard presented in the fourth section may save some time within data visualization tasks.
The presented notes are part of broader independent research focusing on delivering data-driven techniques and knowledge for DMOs and tourism services providers within the Visegrad Group countries. The global aim is to lower the dependency on recurring manual data extraction and processing tasks. The next step for the current pilot is the incorporation of additional open data pipelines necessary for complete seasonal geotargeting based on destinations’ occupancy by origin market, online audiences’ activity, and external accessibility. Firstly, the population distribution by age at LAU2 (municipality/city) for sampled countries will be determined, to gain knowledge on local market sizes. Secondly, the incorporation of connectivity by other means of transportation (airborne, rails, coach) will be considered to assess destinations’ complete accessibility. The secondary goal is to incorporate the developed data models of accessibility by road into Visegrad Group’s raw materials supply chains’ innovation [41].

Author Contributions

Each author (C.S., B.K. and Ľ.Š.) has equally contributed to this publication. All authors have read and agreed to the published version of the manuscript.

Funding

This contribution/publication is the result of the project “Research of alternative energy sources‘ implementation impact on industries of energy management processes“ supported by Operational Program Integrated Infrastructure (ITMS: 3131011T564).

Institutional Review Board Statement

Not applicable.

Informed Consent Statement

Not applicable.

Data Availability Statement

All input data, materials and codes may be found at https://github.com/csabasidor/notesData2092724 (accessed on 9 December 2022).

Acknowledgments

The authors would like to acknowledge DMO Visit Kosice for enabling remote access to the organization’s Facebook page and Google Analytics account.

Conflicts of Interest

The authors declare no conflict of interest. The funders had no role in the design of the study; in the collection, analyses, or interpretation of data; in the writing of the manuscript, or in the decision to publish the results.

References

  1. United Nations World Tourism Organization. A Practical Guide to Tourism Destination Management; World Tourism Organization: Madrid, Spain, 2007; ISBN 978-92-844-1243-3. [Google Scholar]
  2. World Tourism Organization. UNWTO Guidelines for Institutional Strengthening of Destination Management Organizations (DMOs)–Preparing DMOs for new challenges. UNWTO Madrid 2019, 1, 10–12. [Google Scholar] [CrossRef]
  3. De las Heras-Pedrosa, C.; Millan-Celis, E.; Iglesias-Sánchez, P.P.; Jambrino-Maldonado, C. Importance of Social Media in the Image Formation of Tourist Destinations from the Stakeholders’ Perspective. Sustainability 2020, 12, 4092. [Google Scholar] [CrossRef]
  4. Tran, N.L.; Rudolf, W. Social Media and Destination Branding in Tourism: A Systematic Review of the Literature. Sustainability 2022, 14, 13528. [Google Scholar] [CrossRef]
  5. Mariani, M. Web 2.0 and Destination Marketing: Current Trends and Future Directions. Sustainability 2020, 12, 3771. [Google Scholar] [CrossRef]
  6. Mariani, M.M.; Baggio, R. Big data and analytics in hospitality and tourism: A systematic literature review. Int. J. Contemp. Hosp. Manag. 2021, 34, 231–278. [Google Scholar] [CrossRef]
  7. Martin-Fuentes, E.; Mateu, C.; Fernandez, C. Does Verifying Uses Influence Rankings? Analyzing Booking.Com and Tripadvisor. Tour. Anal. 2018, 23, 1–15. [Google Scholar] [CrossRef] [Green Version]
  8. Adamiak, C. Current state and development of Airbnb accommodation offer in 167 countries. Curr. Issues Tour. 2019, 25, 3131–3149. [Google Scholar] [CrossRef] [Green Version]
  9. Schauppenlehner, T.; Muhar, A. Theoretical Availability versus Practical Accessibility: The Critical Role of Metadata Management in Open Data Portals. Sustainability 2018, 10, 545. [Google Scholar] [CrossRef] [Green Version]
  10. Ipsos European Public Affairs. Flash Eurobarometer 499–Attitudes of Europeans towards Tourism–October 2021. 2021. Available online: https://europa.eu/eurobarometer/surveys/detail/2283 (accessed on 5 December 2022).
  11. Yen, H.P.; Chen, P.C.; Ho, K.C. Analyzing Destination Accessibility From the Perspective of Efficiency Among Tourism Origin Countries. SAGE Open 2021, 11, 2–8. [Google Scholar] [CrossRef]
  12. Mansour, S.; Alahmadi, M.; Abulibdeh, A. Spatial assessment of audience accessibility to historical monuments and museums in Qatar during the 2022 FIFA World Cup. Transp. Policy 2022, 127, 116–129. [Google Scholar] [CrossRef]
  13. Costa, M.; Marques, M.; Moura, F. A Circuity Temporal Analysis of Urban Street Networks Using Open Data: A Lisbon Case Study. ISPRS Int. J. Geo-Inf. 2021, 10, 453. [Google Scholar] [CrossRef]
  14. API Open Data SO, SR. 2022. Available online: https://slovak.statistics.sk/wps/portal/ext/Databases/Open_data/ (accessed on 5 December 2022).
  15. Graph API Version-Page Insights. Available online: https://developers.facebook.com/docs/graph-api/reference/v15.0/insights (accessed on 5 December 2022).
  16. Google Analytics. Available online: https://analytics.withgoogle.com/ (accessed on 9 December 2022).
  17. Geocode API. Available online: https://openrouteservice.org/dev/#/api-docs/geocode (accessed on 9 December 2022).
  18. Directions API. Available online: https://openrouteservice.org/dev/#/api-docs/v2/directions/{profile}/get (accessed on 9 December 2022).
  19. csabasidor. notesData2092724. 2022. Available online: https://github.com/csabasidor/notesData2092724 (accessed on 20 November 2022).
  20. How Users are Identified for User Metrics. Available online: https://support.google.com/analytics/answer/2992042?hl=en (accessed on 5 December 2022).
  21. How a Web Session is Defined in Universal Analytics. Available online: https://support.google.com/analytics/answer/2731565?hl=en#zippy=%2Cin-this-article (accessed on 5 December 2022).
  22. GA avg Session Duration Column. Available online: https://support.google.com/searchads/answer/4529176?hl=en (accessed on 5 December 2022).
  23. Billboard.js. Available online: https://naver.github.io/billboard.js/ (accessed on 10 December 2022).
  24. Measures of Central Tendency- Mean, Median and Mode. Available online: https://stats.libretexts.org/Courses/City_University_of_New_York/Introductory_Statistics_with_Probability_(CUNY)/02%3A_Descriptive_Statistics/2.04%3A_Measures_of_Central_Tendency-_Mean_Median_and_Mode (accessed on 4 December 2022).
  25. Discrete Data Percentiles and Quartiles. Available online: https://stats.libretexts.org/Sandboxes/admin/Introduction_to_Applied_Statistics_for_Psychology_Students_(Sarty)/06%3A_Percentiles_and_Quartiles/6.02%3A_Discrete_Data_Percentiles_and_Quartiles (accessed on 4 December 2022).
  26. Geometric Mean. Available online: https://stats.libretexts.org/Bookshelves/Applied_Statistics/Introductory_Business_Statistics_(OpenStax)/02%3A_Descriptive_Statistics/2.05%3A_Geometric_Mean (accessed on 4 December 2022).
  27. Correlation. Available online: https://stats.libretexts.org/Bookshelves/Applied_Statistics/Book%3A_Natural_Resources_Biometrics_(Kiernan)/07%3A_Correlation_and_Simple_Linear_Regression/7.01%3A_Correlation (accessed on 4 December 2022).
  28. The Coefficient of Determination. Available online: https://stats.libretexts.org/Bookshelves/Introductory_Statistics/Book%3A_Introductory_Statistics_(Shafer_and_Zhang)/10%3A_Correlation_and_Regression/10.06%3A_The_Coefficient_of_Determination (accessed on 4 December 2022).
  29. callCR3804MR.py. Available online: https://github.com/csabasidor/notesData2092724/blob/main/callCR3804MR.py (accessed on 20 November 2022).
  30. callGraphApi.py. Available online: https://github.com/csabasidor/notesData2092724/blob/main/callGraphApi.py (accessed on 20 November 2022).
  31. importMultipleExcelDumpsGoogleAnalytics.py. Available online: https://github.com/csabasidor/notesData2092724/blob/main/importMultipleExcelDumpsGoogleAnalytics.py (accessed on 20 November 2022).
  32. runCountryAggregates.py. Available online: https://github.com/csabasidor/notesData2092724/blob/main/ExportDataLayers/runCountryAggregates.py (accessed on 20 November 2022).
  33. geocodeBatchSimple.py. Available online: https://github.com/csabasidor/notesData2092724/blob/main/geocodeBatchSimple.py (accessed on 20 November 2022).
  34. distanceMatrixBatchSimple.py. Available online: https://github.com/csabasidor/notesData2092724/blob/main/distanceMatrixBatchSimple.py (accessed on 20 November 2022).
  35. runCityDuratioBins.py. Available online: https://github.com/csabasidor/notesData2092724/blob/main/ExportDataLayers/runCityDuratioBins.py (accessed on 20 November 2022).
  36. AirportsDistanceMatrixBatch.py. Available online: https://github.com/csabasidor/notesData2092724/blob/main/AirportsDistanceMatrixBatch.py (accessed on 20 November 2022).
  37. runAirportAggregates.py. Available online: https://github.com/csabasidor/notesData2092724/blob/main/ExportDataLayers/runAirportAggregates.py (accessed on 20 November 2022).
  38. ComputeCorrDetermination.py. Available online: https://github.com/csabasidor/notesData2092724/blob/main/ExportDataLayers/CoorCoefDforSampleMarket.py (accessed on 20 November 2022).
  39. Sidor, C. Dashboard 22a. 2022. Available online: http://cases.idoaba.eu/ccors22/ (accessed on 11 October 2022).
  40. tab1_2.xlsx. Available online: https://github.com/csabasidor/notesData2092724/blob/main/ExportDataLayers/graphData/ (accessed on 12 October 2022).
  41. Šimková, Z.; Krzyżewska, I.; Koščová, K.; Danda, R. Evaluation of the connection of innovation activities within selected OECD countries in the area of Construction Minerals. Acta Montan. Slov. 2022, 27, 190–200. [Google Scholar] [CrossRef]
Figure 1. Dominant position of sampled markets on incoming tourism [39]: (a) share of visitors; (b) share of overnight stays; (c) average overnight stays per visitor.
Data 08 00024 g001
Figure 2. Sampled markets’ position among DMO’s website audiences [39]: (a) share of users; (b) share of sessions; (c) average session duration.
Data 08 00024 g002
Figure 3. Sampled markets’ position among DMO’s Facebook audiences [39]: (a) share of page fans; (b) share of impressions; (c) share of activity.
Data 08 00024 g003
Figure 4. Monthly distribution of incoming visitors from sampled markets in 2021 [39]: (a) Austria; (b) Czechia; (c) Hungary; (d) Poland; (e) Slovakia.
Data 08 00024 g004
Figure 5. Monthly distribution of overnight stays from sampled incoming markets in 2021 [39]: (a) Austria; (b) Czechia; (c) Hungary; (d) Poland; (e) Slovakia.
Data 08 00024 g005
Figure 6. Monthly distribution of average length of visitors’ stay from sampled incoming markets in 2021: (a) Austria; (b) Czechia; (c) Hungary; (d) Poland; (e) Slovakia.
Data 08 00024 g006
Figure 7. Monthly distribution of website users from sampled incoming markets in 2021 [39]: (a) Austria; (b) Czechia; (c) Hungary; (d) Poland; (e) Slovakia.
Data 08 00024 g007
Figure 8. Monthly distribution of website sessions from sampled incoming markets in 2021 [39]: (a) Austria; (b) Czechia; (c) Hungary; (d) Poland; (e) Slovakia.
Data 08 00024 g008
Figure 9. Monthly distribution of Facebook impressions from sampled incoming markets in 2021 [39]: (a) Austria; (b) Czechia; (c) Hungary; (d) Poland; (e) Slovakia.
Data 08 00024 g009
Figure 10. Monthly distribution of Facebook content activity from sampled incoming markets in 2021 [39]: (a) Austria; (b) Czechia; (c) Hungary; (d) Poland; (e) Slovakia.
Data 08 00024 g010
Figure 11. Annual classification of the share of audience variables in hourly intervals of incoming journeys to the destination by car [39]: (a) website users; (b) website sessions; (c) Facebook page impressions; (d) Facebook page content activity.
Data 08 00024 g011
Figure 12. Monthly distribution of the share of website users in hourly intervals of incoming journeys to the destination by car [39]: (a) Austria; (b) Czechia; (c) Hungary; (d) Poland; (e) Slovakia.
Data 08 00024 g012
Figure 13. Monthly distribution of the share of website sessions in hourly intervals of incoming journeys to the destination by car [39]: (a) Austria; (b) Czechia; (c) Hungary; (d) Poland. (e) Slovakia.
Data 08 00024 g013
Figure 14. Monthly distribution of the share of Facebook impressions in hourly intervals of incoming journeys to the destination by car [39]: (a) Austria; (b) Czechia; (c) Hungary; (d) Poland; (e) Slovakia.
Data 08 00024 g014
Figure 15. Monthly distribution of the share of Facebook content activity in hourly intervals of incoming journeys to the destination by car [39]: (a) Austria; (b) Czechia; (c) Hungary; (d) Poland; (e) Slovakia.
Data 08 00024 g015
Figure 16. Classification of the share of relevant audience variables in hourly intervals of incoming journeys to airports by car with direct airborne connections with the destination [39]: (a) website users; (b) website sessions; (c) Facebook page impressions; (d) Facebook page content activity.
Data 08 00024 g016
Table 1. Share of geocoded Google Analytics cities, users, and sessions.
Country% Geocoded Cities% Geocoded Users% Geocoded Sessions
Austria98.51%99.82%99.83%
Czechia90.40%90.68%91.09%
Hungary90.32%84.16%83.61%
Poland98.61%96.40%96.58%
Slovakia49.10%75.53%75.65%
Disclaimer/Publisher’s Note: The statements, opinions and data contained in all publications are solely those of the individual author(s) and contributor(s) and not of MDPI and/or the editor(s). MDPI and/or the editor(s) disclaim responsibility for any injury to people or property resulting from any ideas, methods, instructions or products referred to in the content.

