Next Issue
Volume 8, February
Previous Issue
Volume 7, December


Data, Volume 8, Issue 1 (January 2023) – 21 articles

Cover Story (view full-size image): 
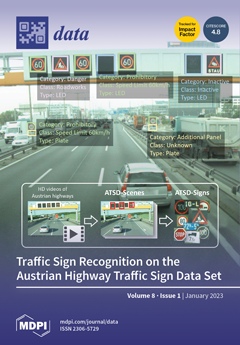
Advanced driver assistance systems rely on automated traffic sign recognition. Today, deep learning methods outperform other approaches in terms of accuracy and processing time, but they require vast and well-curated data sets for training. We therefore present the Austrian Highway Traffic Sign Data Set (ATSD), a comprehensive annotated data set of images of almost all traffic signs on Austrian highways in 2014, and corresponding images of full traffic scenes in which they are contained. Altogether, the data set consists of almost 7500 scene images with more than 28,000 detailed annotations of more than 100 distinct traffic sign classes. It covers diverse environments, ranging from urban to rural and mountainous areas, and includes many images recorded in tunnels. View this paper
  • Issues are regarded as officially published after their release is announced to the table of contents alert mailing list.
  • You may sign up for e-mail alerts to receive table of contents of newly released issues.
  • PDF is the official format for papers published in both, html and pdf forms. To view the papers in pdf format, click on the "PDF Full-text" link, and use the free Adobe Reader to open them.
Order results
Result details
Section
Select all
Export citation of selected articles as:
9 pages, 2209 KiB  
Article
Shapley Value as a Quality Control for Mass Spectra of Human Glioblastoma Tissues
by Denis S. Zavorotnyuk, Anatoly A. Sorokin, Stanislav I. Pekov, Denis S. Bormotov, Vasiliy A. Eliferov, Konstantin V. Bocharov, Eugene N. Nikolaev and Igor A. Popov
Data 2023, 8(1), 21; https://doi.org/10.3390/data8010021 - 16 Jan 2023
Viewed by 1554
Abstract
The automatic processing of high-dimensional mass spectrometry data is required for the clinical implementation of ambient ionization molecular profiling methods. However, complex algorithms required for the analysis of peak-rich spectra are sensitive to the quality of the input data. Therefore, an objective and [...] Read more.
The automatic processing of high-dimensional mass spectrometry data is required for the clinical implementation of ambient ionization molecular profiling methods. However, complex algorithms required for the analysis of peak-rich spectra are sensitive to the quality of the input data. Therefore, an objective and quantitative indicator, insensitive to the conditions of the experiment, is currently in high demand for the automated treatment of mass spectrometric data. In this work, we demonstrate the utility of the Shapley value as an indicator of the quality of the individual mass spectrum in the classification task for human brain tumor tissue discrimination. The Shapley values are calculated on the training set of glioblastoma and nontumor pathological tissues spectra and used as feedback to create a random forest regression model to estimate the contributions for all spectra of each specimen. As a result, it is shown that the implementation of Shapley values significantly accelerates the data analysis of negative mode mass spectrometry data alongside simultaneous improving the regression models’ accuracy. Full article
(This article belongs to the Special Issue Artificial Intelligence and Big Data Applications in Diagnostics)
Show Figures

Figure 1

11 pages, 4137 KiB  
Data Descriptor
A Low-Resolution Used Electronic Parts Image Dataset for Sorting Application
by Praneel Chand
Data 2023, 8(1), 20; https://doi.org/10.3390/data8010020 - 14 Jan 2023
Cited by 1 | Viewed by 2041
Abstract
The accumulation of electronic waste (e-waste) is becoming a problem in society. Old parts and components are conveniently discarded instead of being recycled. Economic and environmental measures should be taken by individuals and organizations to enhance sustainability. This could include desoldering and reusing [...] Read more.
The accumulation of electronic waste (e-waste) is becoming a problem in society. Old parts and components are conveniently discarded instead of being recycled. Economic and environmental measures should be taken by individuals and organizations to enhance sustainability. This could include desoldering and reusing parts from electronic circuit boards. Hence, the purpose of the dataset presented in this paper is for the classification of used electronic parts in linear voltage regulator power supply circuits. The dataset presented in this paper comprises low-resolution (30 × 30 pixels) grayscale images of major reusable electronic parts from a typical adjustable regulated linear voltage power supply kitset. The three major reusable parts are capacitors, potentiometers, and voltage regulator ICs. These are typically the most relatively expensive components. Data representing the parts are extracted from 960 × 720 pixel workspace images containing multiple parts. This permits the dataset to be used with multiple types of classifiers, such as lightweight shallow neural networks (SNNs), support vector machines (SVMs), or convolutional neural networks (CNNs). Classification accuracies of 93.5%, 94.9%, and 98.4% were achieved with SNNs, SVMs, and CNNs, respectively. Successful detection and classification of parts will permit a Niryo Ned robotic arm to pick and place parts in the desired locations. The dataset can be used by other academics and researchers working with the Niryo Ned robot and Matlab to handle electronic parts. It can be expanded to include relatively expensive components from other types of electronic circuit boards. Full article
Show Figures

Figure 1

13 pages, 59333 KiB  
Data Descriptor
Airborne Spectral Reflectance Dataset of Submerged Plastic Targets in a Coastal Environment
by Apostolos Papakonstantinou, Argyrios Moustakas, Polychronis Kolokoussis, Dimitris Papageorgiou, Robin de Vries and Konstantinos Topouzelis
Data 2023, 8(1), 19; https://doi.org/10.3390/data8010019 - 11 Jan 2023
Cited by 3 | Viewed by 1890
Abstract
Among the emerging applications of remote sensing technologies, the remote detection of plastic litter has observed successful applications in recent years. However, while the number of studies and datasets for spectral characterization of plastic is growing, few studies address plastic litter while being [...] Read more.
Among the emerging applications of remote sensing technologies, the remote detection of plastic litter has observed successful applications in recent years. However, while the number of studies and datasets for spectral characterization of plastic is growing, few studies address plastic litter while being submerged in natural seawater in an outdoor context. This study aims to investigate the feasibility of hyperspectral characterization of submerged plastic litter in less-than-ideal conditions. We present a hyperspectral dataset of eight different polymers in field conditions, taken by an unmanned aerial vehicle (UAV) on different days in a three-week period. The measurements were carried out off the coast of Mytilene, Greece. The team collected the dataset using a Bayspec OCI-F push broom sensor from 25 m and 40 m height above the water. For a contextual background, the dataset also contains optical (RGB) high-resolution orthomosaics. Full article
(This article belongs to the Section Spatial Data Science and Digital Earth)
Show Figures

Figure 1

18 pages, 2885 KiB  
Article
Introducing UWF-ZeekData22: A Comprehensive Network Traffic Dataset Based on the MITRE ATT&CK Framework
by Sikha S. Bagui, Dustin Mink, Subhash C. Bagui, Tirthankar Ghosh, Russel Plenkers, Tom McElroy, Stephan Dulaney and Sajida Shabanali
Data 2023, 8(1), 18; https://doi.org/10.3390/data8010018 - 11 Jan 2023
Cited by 9 | Viewed by 4157
Abstract
With the rapid rate at which networking technologies are changing, there is a need to regularly update network activity datasets to accurately reflect the current state of network infrastructure/traffic. The uniqueness of this work was that this was the first network dataset collected [...] Read more.
With the rapid rate at which networking technologies are changing, there is a need to regularly update network activity datasets to accurately reflect the current state of network infrastructure/traffic. The uniqueness of this work was that this was the first network dataset collected using Zeek and labelled using the MITRE ATT&CK framework. In addition to identifying attack traffic, the MITRE ATT&CK framework allows for the detection of adversary behavior leading to an attack. It can also be used to develop user profiles of groups intending to perform attacks. This paper also outlined how both the cyber range and hadoop’s big data platform were used for creating this network traffic data repository. The data was collected using Security Onion in two formats: Zeek and PCAPs. Mission logs, which contained the MITRE ATT&CK data, were used to label the network attack data. The data was transferred daily from the Security Onion virtual machine running on a cyber range to the big-data platform, Hadoop’s distributed file system. This dataset, UWF-ZeekData22, is publicly available at datasets.uwf.edu. Full article
Show Figures

Figure 1

8 pages, 2131 KiB  
Data Descriptor
UIBVFED-Mask: A Dataset for Comparing Facial Expressions with and without Face Masks
by Miquel Mascaró-Oliver, Ramon Mas-Sansó, Esperança Amengual-Alcover and Maria Francesca Roig-Maimó
Data 2023, 8(1), 17; https://doi.org/10.3390/data8010017 - 11 Jan 2023
Cited by 1 | Viewed by 2848
Abstract
After the COVID-19 pandemic the use of face masks has become a common practice in many situations. Partial occlusion of the face due to the use of masks poses new challenges for facial expression recognition because of the loss of significant facial information. [...] Read more.
After the COVID-19 pandemic the use of face masks has become a common practice in many situations. Partial occlusion of the face due to the use of masks poses new challenges for facial expression recognition because of the loss of significant facial information. Consequently, the identification and classification of facial expressions can be negatively affected when using neural networks in particular. This paper presents a new dataset of virtual characters, with and without face masks, with identical geometric information and spatial location. This novelty will certainly allow researchers a better refinement on lost information due to the occlusion of the mask. Full article
(This article belongs to the Section Information Systems and Data Management)
Show Figures

Figure 1

15 pages, 5903 KiB  
Data Descriptor
Traffic Sign Detection and Classification on the Austrian Highway Traffic Sign Data Set
by Alexander Maletzky, Nikolaus Hofer, Stefan Thumfart, Karin Bruckmüller and Johannes Kasper
Data 2023, 8(1), 16; https://doi.org/10.3390/data8010016 - 09 Jan 2023
Cited by 3 | Viewed by 5135
Abstract
Advanced Driver Assistance Systems rely on automated traffic sign recognition. Today, Deep Learning methods outperform other approaches in terms of accuracy and processing time; however, they require vast and well-curated data sets for training. In this paper, we present the Austrian Highway Traffic [...] Read more.
Advanced Driver Assistance Systems rely on automated traffic sign recognition. Today, Deep Learning methods outperform other approaches in terms of accuracy and processing time; however, they require vast and well-curated data sets for training. In this paper, we present the Austrian Highway Traffic Sign Data Set (ATSD), a comprehensive annotated data set of images of almost all traffic signs on Austrian highways in 2014, and corresponding images of full traffic scenes they are contained in. Altogether, the data set consists of almost 7500 scene images with more than 28,000 detailed annotations of more than 100 distinct traffic sign classes. It covers diverse environments, ranging from urban to rural and mountainous areas, and includes many images recorded in tunnels. We further evaluate state-of-the-art traffic sign detectors and classifiers on ATSD to establish baselines for future experiments. The data set and our baseline models are freely available online. Full article
Show Figures

Figure 1

8 pages, 936 KiB  
Data Descriptor
Visual Lip Reading Dataset in Turkish
by Ali Berkol, Talya Tümer-Sivri, Nergis Pervan-Akman, Melike Çolak and Hamit Erdem
Data 2023, 8(1), 15; https://doi.org/10.3390/data8010015 - 05 Jan 2023
Cited by 1 | Viewed by 2914
Abstract
The promised dataset was obtained from daily Turkish words and phrases pronounced by various people in videos posted on YouTube. The purpose of compiling the dataset was to provide a method for the detection of the spoken word by recognizing patterns or classifying [...] Read more.
The promised dataset was obtained from daily Turkish words and phrases pronounced by various people in videos posted on YouTube. The purpose of compiling the dataset was to provide a method for the detection of the spoken word by recognizing patterns or classifying lip movements with supervised, unsupervised, and semi-supervised learning, and machine learning algorithms. Most of the datasets related to lip reading consist of people recorded on camera with fixed backgrounds and the same conditions, but the dataset presented here consists of images compatible with machine learning models developed for real-life challenges. It contains a total of 2335 instances taken from TV series, movies, vlogs, and song clips on YouTube. The images in the dataset vary due to factors such as the way people say words, accents, speaking rate, gender, and age. Furthermore, the instances in the dataset consist of videos with different angles, shadows, resolution, and brightness that are not created manually. The most important feature of our lip reading dataset is that we contribute to the non-synthetic Turkish dataset pool, which does not have wide dataset varieties. Machine learning studies can be carried out in many areas, such as education, security, and social life with this dataset. Full article
(This article belongs to the Section Information Systems and Data Management)
Show Figures

Figure 1

38 pages, 4788 KiB  
Data Descriptor
UTMInDualSymFi: A Dual-Band Wi-Fi Dataset for Fingerprinting Positioning in Symmetric Indoor Environments
by Asim Abdullah, Muhammad Haris, Omar Abdul Aziz, Rozeha A. Rashid and Ahmad Shahidan Abdullah
Data 2023, 8(1), 14; https://doi.org/10.3390/data8010014 - 01 Jan 2023
Cited by 4 | Viewed by 2221
Abstract
Recent studies on indoor positioning using Wi-Fi fingerprinting are motivated by the ubiquity of Wi-Fi networks and their promising positioning accuracy. Machine learning algorithms are commonly leveraged in indoor positioning works. The performance of machine learning based solutions are dependent on the availability, [...] Read more.
Recent studies on indoor positioning using Wi-Fi fingerprinting are motivated by the ubiquity of Wi-Fi networks and their promising positioning accuracy. Machine learning algorithms are commonly leveraged in indoor positioning works. The performance of machine learning based solutions are dependent on the availability, volume, quality, and diversity of related data. Several public datasets have been published in order to foster advancements in Wi-Fi based fingerprinting indoor positioning solutions. These datasets, however, lack dual-band Wi-Fi data within symmetric indoor environments. To fill this gap, this research work presents the UTMInDualSymFi dataset, as a source of dual-band Wi-Fi data, acquired within multiple residential buildings with symmetric deployment of access points. UTMInDualSymFi comprises the recorded dual-band raw data, training and test datasets, radio maps and supporting metadata. Additionally, a statistical radio map construction algorithm is presented. Benchmark performance was evaluated by implementing a machine-learning-based positioning algorithm on the dataset. In general, higher accuracy was observed, on the 5 GHz data scenarios. This systematically collected dataset enables the development and validation of future comprehensive solutions, inclusive of novel preprocessing, radio map construction, and positioning algorithms. Full article
Show Figures

Figure 1

11 pages, 6989 KiB  
Data Descriptor
A Consistent Land Cover Map Time Series at 2 m Spatial Resolution—The LifeWatch 2006-2015-2018-2019 Dataset for Wallonia
by Julien Radoux, Axel Bourdouxhe, Thomas Coppée, Mathilde De Vroey, Marc Dufrêne and Pierre Defourny
Data 2023, 8(1), 13; https://doi.org/10.3390/data8010013 - 31 Dec 2022
Cited by 1 | Viewed by 1712
Abstract
Ecosystem accounting is based on the definition of the extent and the status of an ecosystem. Land cover maps extents are representative of several ecosystems and can therefore be used to support ecosystem accounting if reliable change information is available. The dataset described [...] Read more.
Ecosystem accounting is based on the definition of the extent and the status of an ecosystem. Land cover maps extents are representative of several ecosystems and can therefore be used to support ecosystem accounting if reliable change information is available. The dataset described in this paper aims to provide land cover information (13 classes) for biodiversity monitoring, which has driven two key features. On one hand, open areas were described in more details (5 classes) than in the other maps available in the study area in order to increase their relevance for biodiversity models. On the other hand, monitoring means that the time series must consist of comparable layers. The time series integrate information from existing high quality land cover maps that are not fully comparable, as well as thematic products (crop type, road network and forest type) and remote sensing data (25 cm orthophotos, 0.8 pts/m2 LIDAR and Sentinel-1&2 data). Because of the high spatial resolution of the data and the fragmented landscape, boundary errors could cause a large proportion of false change detection if the maps are classified independently. Buildings and forests were therefore consolidated across time in order to build a time series where these changes can be trusted. Based on an independent validation, the overall accuracy was 93.1%, 92.6%, 94.8% and 93.9% +/−1.3% for the years 2006, 2015, 2018 and 2019, respectively. The specific assessment of forest patch change highlighted a 98% +/−2.7% user accuracy across the 4 years and 85% of forest cut detection. This time series will be completed and further consolidated with other dates using the same protocol and legend. Full article
(This article belongs to the Section Spatial Data Science and Digital Earth)
Show Figures

Figure 1

14 pages, 444 KiB  
Review
Lying-People Pressure-Map Datasets: A Systematic Review
by Luís Fonseca, Fernando Ribeiro and José Metrôlho
Data 2023, 8(1), 12; https://doi.org/10.3390/data8010012 - 30 Dec 2022
Cited by 3 | Viewed by 1682
Abstract
Bedded or lying-people pressure-map datasets can be used to identify patients’ in-bed postures and can be very useful in numerous healthcare applications. However, the construction of these datasets is not always easy, and many researchers often resort to existing datasets to carry out [...] Read more.
Bedded or lying-people pressure-map datasets can be used to identify patients’ in-bed postures and can be very useful in numerous healthcare applications. However, the construction of these datasets is not always easy, and many researchers often resort to existing datasets to carry out their experiments and validate their solutions. This systematic review aimed to identify and characterise pressure-map datasets on lying-people- or bedded-people positions. We used a systematic approach to select nine studies that were thoroughly reviewed and summarised them considering methods of data collection, fields considered in the datasets, and results or their uses after collection. As a result of the review, six research questions were answered that allowed a characterisation of existing datasets regarding of the types of data included, number and types of poses considered, participant characteristics and size of the dataset, and information on how the datasets were built. This study might represent an important basis for academics and researchers to understand the information collected in each pressure-map dataset, the possible uses of such datasets, or methods to build new datasets. Full article
(This article belongs to the Section Featured Reviews of Data Science Research)
Show Figures

Figure 1

15 pages, 1500 KiB  
Article
Natural Language Processing to Extract Information from Portuguese-Language Medical Records
by Naila Camila da Rocha, Abner Macola Pacheco Barbosa, Yaron Oliveira Schnr, Juliana Machado-Rugolo, Luis Gustavo Modelli de Andrade, José Eduardo Corrente and Liciana Vaz de Arruda Silveira
Data 2023, 8(1), 11; https://doi.org/10.3390/data8010011 - 29 Dec 2022
Cited by 5 | Viewed by 2551
Abstract
Studies that use medical records are often impeded due to the information presented in narrative fields. However, recent studies have used artificial intelligence to extract and process secondary health data from electronic medical records. The aim of this study was to develop a [...] Read more.
Studies that use medical records are often impeded due to the information presented in narrative fields. However, recent studies have used artificial intelligence to extract and process secondary health data from electronic medical records. The aim of this study was to develop a neural network that uses data from unstructured medical records to capture information regarding symptoms, diagnoses, medications, conditions, exams, and treatment. Data from 30,000 medical records of patients hospitalized in the Clinical Hospital of the Botucatu Medical School (HCFMB), São Paulo, Brazil, were obtained, creating a corpus with 1200 clinical texts. A natural language algorithm for text extraction and convolutional neural networks for pattern recognition were used to evaluate the model with goodness-of-fit indices. The results showed good accuracy, considering the complexity of the model, with an F-score of 63.9% and a precision of 72.7%. The patient condition class reached a precision of 90.3% and the medication class reached 87.5%. The proposed neural network will facilitate the detection of relationships between diseases and symptoms and prevalence and incidence, in addition to detecting the identification of clinical conditions, disease evolution, and the effects of prescribed medications. Full article
Show Figures

Figure 1

7 pages, 246 KiB  
Data Descriptor
Antimicrobial Susceptibility Data for Six Lactic Acid Bacteria Tested against Fifteen Antimicrobials
by Ivana Nikodinoska, Jouni Heikkinen and Colm A. Moran
Data 2023, 8(1), 10; https://doi.org/10.3390/data8010010 - 29 Dec 2022
Cited by 3 | Viewed by 2140
Abstract
Antimicrobial resistance is a rising threat in the agrifood sector. The misuse of antibiotics exerts selective pressure, driving resistance mechanisms in bacteria, which could ultimately spread through many routes and render treatments for infectious diseases inefficient in humans and animals. Herein, we report [...] Read more.
Antimicrobial resistance is a rising threat in the agrifood sector. The misuse of antibiotics exerts selective pressure, driving resistance mechanisms in bacteria, which could ultimately spread through many routes and render treatments for infectious diseases inefficient in humans and animals. Herein, we report antimicrobial susceptibility data obtained for six lactic acid bacteria, the members of which are commonly used in the food and feed chain. Fifteen antimicrobials were considered for the phenotypic testing: ampicillin, gentamicin, kanamycin, tetracycline, erythromycin, clindamycin, chloramphenicol, streptomycin, vancomycin, quinupristin-dalfopristin, bacitracin, sulfamethoxazole, ciprofloxacin, linezolid, and rifampicin. The reported dataset could be used for the comparison, generation, and reconsideration of new and/or existing cut-off values when considering lactic acid bacteria, particularly lactobacilli and pediococci. Full article
19 pages, 34962 KiB  
Article
PERSIST: A Multimodal Dataset for the Prediction of Perceived Exertion during Resistance Training
by Justin Amadeus Albert, Arne Herdick, Clemens Markus Brahms, Urs Granacher and Bert Arnrich
Data 2023, 8(1), 9; https://doi.org/10.3390/data8010009 - 28 Dec 2022
Cited by 2 | Viewed by 4245
Abstract
Measuring and adjusting the training load is essential in resistance training, as training overload can increase the risk of injuries. At the same time, too little load does not deliver the desired training effects. Usually, external load is quantified using objective measurements, such [...] Read more.
Measuring and adjusting the training load is essential in resistance training, as training overload can increase the risk of injuries. At the same time, too little load does not deliver the desired training effects. Usually, external load is quantified using objective measurements, such as lifted weight distributed across sets and repetitions per exercise. Internal training load is usually assessed using questionnaires or ratings of perceived exertion (RPE). A standard RPE scale is the Borg scale, which ranges from 6 (no exertion) to 20 (the highest exertion ever experienced). Researchers have investigated predicting RPE for different sports using sensor modalities and machine learning methods, such as Support Vector Regression or Random Forests. This paper presents PERSIST, a novel dataset for predicting PERceived exertion during reSIStance Training. We recorded multiple sensor modalities simultaneously, including inertial measurement units (IMU), electrocardiography (ECG), and motion capture (MoCap). The MoCap data has been synchronized to the IMU and ECG data. We also provide heart rate variability (HRV) parameters obtained from the ECG signal. Our dataset contains data from twelve young and healthy male participants with at least one year of resistance training experience. Subjects performed twelve sets of squats on a Flywheel platform with twelve repetitions per set. After each set, subjects reported their current RPE. We chose the squat exercise as it involves the largest muscle group. This paper demonstrates how to access the dataset. We further present an exploratory data analysis and show how researchers can use IMU and ECG data to predict perceived exertion. Full article
Show Figures

Figure 1

8 pages, 245 KiB  
Article
Aggregation of Multimodal ICE-MS Data into Joint Classifier Increases Quality of Brain Cancer Tissue Classification
by Anatoly A. Sorokin, Denis S. Bormotov, Denis S. Zavorotnyuk, Vasily A. Eliferov, Konstantin V. Bocharov, Stanislav I. Pekov, Evgeny N. Nikolaev and Igor A. Popov
Data 2023, 8(1), 8; https://doi.org/10.3390/data8010008 - 27 Dec 2022
Viewed by 1285
Abstract
Mass spectrometry fingerprinting combined with multidimensional data analysis has been proposed in surgery to determine if a biopsy sample is a tumor. In the specific case of brain tumors, it is complicated to obtain control samples, leading to model overfitting due to unbalanced [...] Read more.
Mass spectrometry fingerprinting combined with multidimensional data analysis has been proposed in surgery to determine if a biopsy sample is a tumor. In the specific case of brain tumors, it is complicated to obtain control samples, leading to model overfitting due to unbalanced sample cohorts. Usually, classifiers are trained using a single measurement regime, most notably single ion polarity, but mass range and spectral resolution could also be varied. It is known that lipid groups differ significantly in their ability to produce positive or negative ions; hence, using only one polarity significantly restricts the chemical space available for sample discrimination purposes. In this work, we have developed an approach employing mass spectrometry data obtained by eight different regimes of measurement simultaneously. Regime-specific classifiers are trained, then a mixture of experts techniques based on voting or mean probability is used to aggregate predictions of all trained classifiers and assign a class to the whole sample. The aggregated classifiers have shown a much better performance than any of the single-regime classifiers and help significantly reduce the effect of an unbalanced dataset without any augmentation. Full article
(This article belongs to the Special Issue Artificial Intelligence and Big Data Applications in Diagnostics)
7 pages, 1006 KiB  
Data Descriptor
Numerical and Experimental Data of the Implementation of Logic Gates in an Erbium-Doped Fiber Laser (EDFL)
by Samuel Mardoqueo Afanador Delgado, José Luis Echenausía Monroy, Guillermo Huerta Cuellar, Juan Hugo García López and Rider Jaimes Reátegui
Data 2023, 8(1), 7; https://doi.org/10.3390/data8010007 - 26 Dec 2022
Cited by 1 | Viewed by 1464
Abstract
In this article, the methods for obtaining time series from an erbium-doped fiber laser (EDFL) and its numerical simulation are described. In addition, the nature of the obtained files, the meaning of the changing file names, and the ways of accessing these files [...] Read more.
In this article, the methods for obtaining time series from an erbium-doped fiber laser (EDFL) and its numerical simulation are described. In addition, the nature of the obtained files, the meaning of the changing file names, and the ways of accessing these files are described in detail. The response of the laser emission is controlled by the intensity of a digital signal added to the modulation, which allows for various logical operations. The numerical results are in good agreement with experimental observations. The authors provide all of the time series from an experimental implementation where various logic gates are obtained. Full article
Show Figures

Figure 1

15 pages, 37687 KiB  
Data Descriptor
A Large-Scale Dataset of Conservation and Deep Tillage in Mollisols, Northeast Plain, China
by Fahui Jiang, Shangshu Huang, Yan Wu, Mahbub Ul Islam, Fangjin Dong, Zhen Cao, Guohui Chen and Yuming Guo
Data 2023, 8(1), 6; https://doi.org/10.3390/data8010006 - 24 Dec 2022
Cited by 1 | Viewed by 1477
Abstract
One of the primary challenges of our time is to feed a growing and more demanding world population with degraded soil environments under more variable and extreme climate conditions. Conservation tillage (CS) and deep tillage (DT) have received strong international support to help [...] Read more.
One of the primary challenges of our time is to feed a growing and more demanding world population with degraded soil environments under more variable and extreme climate conditions. Conservation tillage (CS) and deep tillage (DT) have received strong international support to help address these challenges but are less used in major global food production in China. Hence, we conducted a large-scale literature search of English and Chinese publications to synthesize the current scientific evidence to evaluate the effects of CS and DT on soil protection and yield maintenance in the Northeast China Plain, which has the most fertile black soil (Mollisols) and is the main agricultural production area of China. As a result, we found that CS had higher soil bulk density, strong soil penetration resistance, greater water contents, and lower soil temperature, and was well-suited for dry and wind erosion-sensitive regions i.e., the southwest areas of the Northeast. Conversely, DT had better performance in the middle belt of the Northeast China Plain, which contained a lower soil temperature and humid areas. Finally, we created an original dataset from papers [dataset 1, including soil physio-chemical parameters, such as soil water, bulk density, organic carbon, sand, silt, clay, pH, total and available nitrogen (N), phosphorus (P), and potassium (K), etc., on crop biomass and yield], by collecting data directly from publications, and two predicted datasets (dataset 2 and dataset 3) of crop yield changes by developing random forest models based on our data. Full article
Show Figures

Figure 1

6 pages, 2860 KiB  
Data Descriptor
Thermal Data of Perfluorinated Carboxylic Acid Functionalized Aluminum Nanoparticles
by Nathan J. Weeks, Bradley Martin, Enrique Gazmin and Scott T. Iacono
Data 2023, 8(1), 5; https://doi.org/10.3390/data8010005 - 23 Dec 2022
Viewed by 1345
Abstract
Improving the performance of composite energetic materials comprised of a solid metal fuel and a source of oxidizer (known as thermites) has long been pursued as thermites for pyrolant flares and rocket propellants. The performance of thermites, involving aluminum as the fuel, can [...] Read more.
Improving the performance of composite energetic materials comprised of a solid metal fuel and a source of oxidizer (known as thermites) has long been pursued as thermites for pyrolant flares and rocket propellants. The performance of thermites, involving aluminum as the fuel, can be dramatically improved by utilizing nanometer-sized aluminum particles (nAl) leading to vastly higher reaction velocities, owing to the high surface area of nAl. Despite the benefits of the increased surface area, there are still several problems inherent to nanoscale reactants including particle aggregation, and higher viscosity composited materials. The higher viscosity of nAl composites is cumbersome for processing with inert polymer binder formulations, especially at the high mass loadings of metal fuel necessary for industry standards. In order to improve the viscosity of high mass loaded nAl energetics, the surface of the nAl was passivated with covalently bound monolayers of perfluorinated carboxylic acids (PFCAs) utilizing a novel fluorinated solvent washing technique. This work also details the quantitative binding of these monolayers using infrared spectroscopy, in addition to the energetic output from calorimetric and thermogravimetric analysis. Full article
(This article belongs to the Section Chemoinformatics)
Show Figures

Figure 1

22 pages, 8746 KiB  
Data Descriptor
LoRaWAN Path Loss Measurements in an Urban Scenario including Environmental Effects
by Mauricio González-Palacio, Diana Tobón-Vallejo, Lina M. Sepúlveda-Cano, Santiago Rúa, Giovanni Pau and Long Bao Le
Data 2023, 8(1), 4; https://doi.org/10.3390/data8010004 - 22 Dec 2022
Cited by 3 | Viewed by 2736
Abstract
LoRaWAN is a widespread protocol by which Internet of things end nodes (ENs) can exchange information over long distances via their gateways. To deploy the ENs, it is mandatory to perform a link budget analysis, which allows for determining adequate radio parameters like [...] Read more.
LoRaWAN is a widespread protocol by which Internet of things end nodes (ENs) can exchange information over long distances via their gateways. To deploy the ENs, it is mandatory to perform a link budget analysis, which allows for determining adequate radio parameters like path loss (PL). Thus, designers use PL models developed based on theoretical approaches or empirical data. Some previous measurement campaigns have been performed to characterize this phenomenon, primarily based on distance and frequency. However, previous works have shown that weather variations also impact PL, so using the conventional approaches and available datasets without capturing important environmental effects can lead to inaccurate predictions. Therefore, this paper delivers a data descriptor that includes a set of LoRaWAN measurements performed in Medellín, Colombia, including PL, distance, frequency, temperature, relative humidity, barometric pressure, particulate matter, and energy, among other things. This dataset can be used by designers who need to fit highly accurate PL models. As an example of the dataset usage, we provide some model fittings including log-distance, and multiple linear regression models with environmental effects. This analysis shows that including such variables improves path loss predictions with an RMSE of 1.84 dB and an R2 of 0.917. Full article
Show Figures

Figure 1

9 pages, 831 KiB  
Data Descriptor
Pilot Study of the Metabolomic Profile of an Athlete after Short-Term Physical Activity
by Kristina A. Malsagova, Arthur T. Kopylov, Vasiliy I. Pustovoyt, Alexander A. Stepanov, Dmitry V. Enikeev, Natalia V. Potoldykova, Evgenii I. Balakin and Anna L. Kaysheva
Data 2023, 8(1), 3; https://doi.org/10.3390/data8010003 - 21 Dec 2022
Cited by 3 | Viewed by 1255
Abstract
A comprehensive analysis of indicators of the state of the body between training and recovery allows a comprehensive evaluation of various aspects of health, athletic performance, and recovery. In this pilot study, an assessment of the metabolomic profile of athletes was performed, and [...] Read more.
A comprehensive analysis of indicators of the state of the body between training and recovery allows a comprehensive evaluation of various aspects of health, athletic performance, and recovery. In this pilot study, an assessment of the metabolomic profile of athletes was performed, and the immunological reaction of the athlete’s body to food before exercise and 48 h after exercise was studied. As a result, 15 amino acids and 3 hormones were identified, the plasma levels of which differed between the training and recovery states. In addition, immunological reactions or hyperreactivity to food allergens were assessed using an enzyme immunoassay. It is likely that for the athletes in the study sample, 48 h is not enough time for the complete recovery of the body. Full article
Show Figures

Figure 1

10 pages, 1536 KiB  
Data Descriptor
Spectral Library of Maize Leaves under Nitrogen Deficiency Stress
by Maria C. Torres-Madronero, Manuel Goez, Manuel A. Guzman, Tatiana Rondon, Pablo Carmona, Camilo Acevedo-Correa, Santiago Gomez-Ortega, Mariana Durango-Flórez, Smith V. López, July Galeano and Maria Casamitjana
Data 2023, 8(1), 2; https://doi.org/10.3390/data8010002 - 21 Dec 2022
Cited by 1 | Viewed by 2138
Abstract
Maize crops occupy an important place in world food security. However, different conditions, such as abiotic stress factors, can affect the productivity of these crops, requiring technologies that facilitate their monitoring. One such technology is spectroscopy, which measures the energy reflected and emitted [...] Read more.
Maize crops occupy an important place in world food security. However, different conditions, such as abiotic stress factors, can affect the productivity of these crops, requiring technologies that facilitate their monitoring. One such technology is spectroscopy, which measures the energy reflected and emitted by a surface along the electromagnetic spectrum. Spectral data can help to identify abiotic factors in plants, since the spectral signature of vegetation has discriminating features associated with the plant’s health condition. This paper introduces a spectral library captured on maize crops under different nitrogen-deficiency stress levels. The datasets will be of potential interest to researchers, ecologists, and agronomists seeking to understand the spectral features of maize under nitrogen-deficiency stress. The library includes three datasets captured at different growth stages of 10 tropical maize genotypes. The spectral signatures collected were in the visible to near-infrared range (450–950 nm). The data were pre-processed to reduce noise and anomalous signatures. This study presents a spectral library of the effects of nitrogen deficiency on ten maize genotypes, highlighting that some genotypes show tolerance to this type of stress at different phenological stages. Most of the evaluated genotypes showed discriminate spectral features 4–6 weeks after sowing. Higher reflectance was obtained at approximately 550 nm for the lowest nitrogen fertilization treatments. Finally, we describe some potential applications of the spectral library of maize leaves under nitrogen-deficiency stress. Full article
Show Figures

Figure 1

9 pages, 1427 KiB  
Data Descriptor
Gene Expression Datasets for Two Versions of the Saccharum spontaneum AP85-441 Genome
by Nicolás López-Rozo, Mauricio Ramirez-Castrillon, Miguel Romero, Jorge Finke and Camilo Rocha
Data 2023, 8(1), 1; https://doi.org/10.3390/data8010001 - 20 Dec 2022
Viewed by 1806
Abstract
Sugarcane is a species of tall grass with high biomass and sucrose production, and the world’s largest crop by production quantity. Its evolutionary environment adaptation and anthropogenic breeding response have resulted in a complex autopolyploid genome. Few efforts have been reported in the [...] Read more.
Sugarcane is a species of tall grass with high biomass and sucrose production, and the world’s largest crop by production quantity. Its evolutionary environment adaptation and anthropogenic breeding response have resulted in a complex autopolyploid genome. Few efforts have been reported in the literature to document this organism’s gene co-expression and annotation, and, when available, use different gene identifiers that cannot be easily associated across studies. This data descriptor paper presents a dataset that consolidates expression matrices of two Saccharum spontaneum AP85-441 genome versions and an algorithm implemented in Python to mechanically obtain this dataset. The data are processed from the allele-level information of the two sources, with BLASTn used bidirectionally to suggest feasible mappings between the two sets of alleles, and a graph-matching optimization algorithm to maximize global identity and uniqueness of genes. Association tables are used to consolidate the expression values from alleles to genes. The contributed expression matrices comprise 96 experiments and 109,050 and 35,516 from the two genome versions. They can represent significant computational cost reduction for further research on, e.g., sugarcane co-expression network generation, functional annotation prediction, and stress-specific gene identification. Full article
Show Figures

Figure 1

Previous Issue
Next Issue
Back to TopTop