Article

PERSIST: A Multimodal Dataset for the Prediction of Perceived Exertion during Resistance Training

1
Digital Health-Connected Healthcare, Hasso Plattner Institute, University of Potsdam, 14482 Potsdam, Germany
2
Division of Training and Movement Sciences, University of Potsdam, 14469 Potsdam, Germany
3
Exercise and Human Movement Science, Department of Sport and Sport Science, University of Freiburg, 79102 Freiburg im Breisgau, Germany
*
Authors to whom correspondence should be addressed.
Submission received: 25 November 2022 / Revised: 15 December 2022 / Accepted: 21 December 2022 / Published: 28 December 2022

Abstract

:
Measuring and adjusting the training load is essential in resistance training, as training overload can increase the risk of injuries. At the same time, too little load does not deliver the desired training effects. Usually, external load is quantified using objective measurements, such as lifted weight distributed across sets and repetitions per exercise. Internal training load is usually assessed using questionnaires or ratings of perceived exertion (RPE). A standard RPE scale is the Borg scale, which ranges from 6 (no exertion) to 20 (the highest exertion ever experienced). Researchers have investigated predicting RPE for different sports using sensor modalities and machine learning methods, such as Support Vector Regression or Random Forests. This paper presents PERSIST, a novel dataset for predicting PERceived exertion during reSIStance Training. We recorded multiple sensor modalities simultaneously, including inertial measurement units (IMU), electrocardiography (ECG), and motion capture (MoCap). The MoCap data has been synchronized to the IMU and ECG data. We also provide heart rate variability (HRV) parameters obtained from the ECG signal. Our dataset contains data from twelve young and healthy male participants with at least one year of resistance training experience. Subjects performed twelve sets of squats on a Flywheel platform with twelve repetitions per set. After each set, subjects reported their current RPE. We chose the squat exercise as it involves the largest muscle group. This paper demonstrates how to access the dataset. We further present an exploratory data analysis and show how researchers can use IMU and ECG data to predict perceived exertion.

1. Introduction

Controlling the exercise load during resistance and aerobic training is crucial for optimal training programming. While excessive training loads increase the risk of injuries, training loads below a certain threshold do not induce optimal training effects [1]. Usually, the external load is quantified by objective measurements, such as the distance traveled or the weight lifted. However, subjective measurements, such as questionnaires or Ratings of Perceived Exertion (RPEs), can provide valuable information about the internal load of athletes [2]. An RPE scale is a numerical scale where athletes rate their perceived exertion. A standard scale is the Borg scale [3], which ranges from 6 to 20, where 6 represents no exertion, and 20 is the highest fatigue ever experienced. In recent years, research efforts have been made to predict RPE values during physical exercise on the fly using unobtrusive sensor systems. According to a study by Davidson et al. [4], manual reporting of RPE values is challenging due to compliance errors, recall bias, peer pressure, or dishonest reporting. Developing data-driven models trained on sensor data could predict subjective RPE values in real-time and alleviate the aforementioned issues in RPE reporting. Especially during the COVID pandemic, the need for home monitoring systems increased, as many people could not attend gym or sports lessons. By predicting the perceived exertion in the form of RPE values, an automated exercise feedback coach could help to pose warnings once the training load exceeds.
Many studies have investigated physical exertion prediction for different protocols using machine learning on sensor data. For this, various sensor modalities, such as Electromyography (EMG), heart rate (HR), Inertial Measurement Units (IMUs), Electrodermal activity (EDA), optical Motion Capture (MoCap), and Global Positioning System (GPS) have been used. Moreover, different training environments have been investigated, ranging from unrestricted outdoor training, such as free running or football training, to controlled lab studies, including resistance training protocols. An overview of related studies aiming to predict RPE values is provided in Table 1. It shows the cohort information, the sensor modalities used, and information about the training protocol used. The studies have used different versions of the RPE scale, including the classic Borg scale, the Borg CR-10 scale, and custom scales. The Borg CR-10 scale is a modified version of the Borg scale, which ranges from 1 to 10. Some studies have modified the target for the RPE prediction by normalizing the RPE values or dividing the RPE scale into different intensity classes. Table 1 also presents the different prediction targets in more detail. The older studies presented here have used traditional machine learning approaches, such as Random Forest (RF), Gradient Boosting Regression Trees (GBRT), and Support Vector Regression (SVR). Recent studies, e.g., by Jiang et al. [5], have also investigated deep learning-based methods, such as Convolutional Neural Networks (CNNs).
As shown in Table 1, the presented studies have the same goal of predicting RPE but have different study setups. Pernek et al. [6] only included upper limb strength exercises performed using dumbbells, which raises the question if the exercises induced fatigue in subjects properly. Other existing studies were conducted during team training sessions [7,8,10]. Unrestricted experiment settings have the disadvantage of potentially including independent variables and thus lack reproducibility for other researchers. The most related study to ours was conducted by Jiang et al. [5]. This study also included the squat exercise, among two other exercises. However, the authors did not define strict inclusion criteria. Subjects performed sets of five repetitions each until exhaustion. However, the exertion was not confirmed, e.g., by taking lactate measurements. The authors showed that subjects performed differently, where the lowest number of sets was nine, while the best subject performed 52 sets. Our dataset contributes to the existing body of research, as it contains a homogeneous cohort performing a single exercise in a controlled lab environment. The induced muscle fatigue was confirmed by blood lactate analysis. We have chosen the squat exercise to exhaust the lower extremity muscles, the body’s largest muscle group. The squat is one of the integral exercises in resistance and condition training and represents an overall measure of lower-body strength [11]. A squat simultaneously activates many large muscles in the body, including the glutes, the quadriceps, and the hamstrings. Instead of using an external weight with a barbell and plates, we decided to use a Flywheel platform, a training device that generates load independently of gravity. The training device allows to generate an eccentric overload, when lengthening of a muscle occurs while it is contracting. Studies have shown that Flywheel training is effective in increasing muscle mass and strength, while also offering benefits for rehabilitation and injury prevention [12]. In particular, the Flywheel can induce significant fatigue to the lower extremity muscles, while preventing axial loading on the spine, a factor which could greatly increase injury risk, especially under fatigue. In this respect it offers an advantage over free weight exercises, which often use barbells and dumbbells. From a technical perspective, the Flywheel platform is advantageous because the cameras are able to observe the participant without obstruction, as could be the case when using barbells and dumbbells. We recorded multiple sensor modalities, including Electrocardiography (ECG), IMU, 3D cameras, and physical measurements obtained from a Flywheel training device. To the best of our knowledge, the data sets presented in Table 1 are not publicly available or only upon request, which makes it hard to reproduce the results or improve the machine learning algorithms. We aim to contribute to the field of estimating RPE ratings via machine learning by making our dataset available to other researchers.
The rest of the paper is structured as follows: Section 2 provides an overview of the collection of this data set and the measurement methods used. Section 3 provides an explanation of the data set structure as well as highlights methods on how to process the obtained data. In Section 4, we present data analysis of multiple modalities. The paper ends with a conclusion in Section 5.

2. Materials and Methods

This section presents the study setup, defined protocol, and the sensors used for the data collection. We have selected the squat exercise for our protocol as it targets the largest muscle groups of the body and, therefore, should induce fatigue quickly and reliably. Instead of performing squats with a weighted barbell placed on the shoulders, we chose a Flywheel training platform. The Flywheel works with inertial weight induced by the athletes by accelerating an inertial weight plate. The load in Flywheel training is determined by the diameter of the inertial disc as well as by its angular velocity [13]. The ethics review board (ERB) of the University of Potsdam approved this study (Application no. 21/2021). The data recording took place between April and May 2021 in the lab of the Connected Healthcare chair at the Hasso Plattner Institute, University of Potsdam.

2.1. Participants

For our study, we recruited sixteen young and healthy male participants. Participants were between 18 and 30 years old and underwent screening using the Physical Activity Readiness Questionnaire (PAR-Q), a frequently used questionnaire to assess the physical state [14]. Furthermore, participants needed to perform regular resistance training for at least one year. Table 2 shows the anthropometric data and the athlete’s average weekly workout times. Due to the SARS-CoV-2 pandemic, we inquired about the athlete’s weekly training times and how the training times changed since the second lockdown in Germany with the closing of gyms. At this early stage, we only included male participants to have a homogeneous population. Additionally, subjects had to be able to execute the squat exercise correctly, i.e., bringing the thighs parallel to the floor. Every participant gave written consent before the data recording. Of the 16 individuals who participated in this study, 12 gave their consent to share data anonymously.

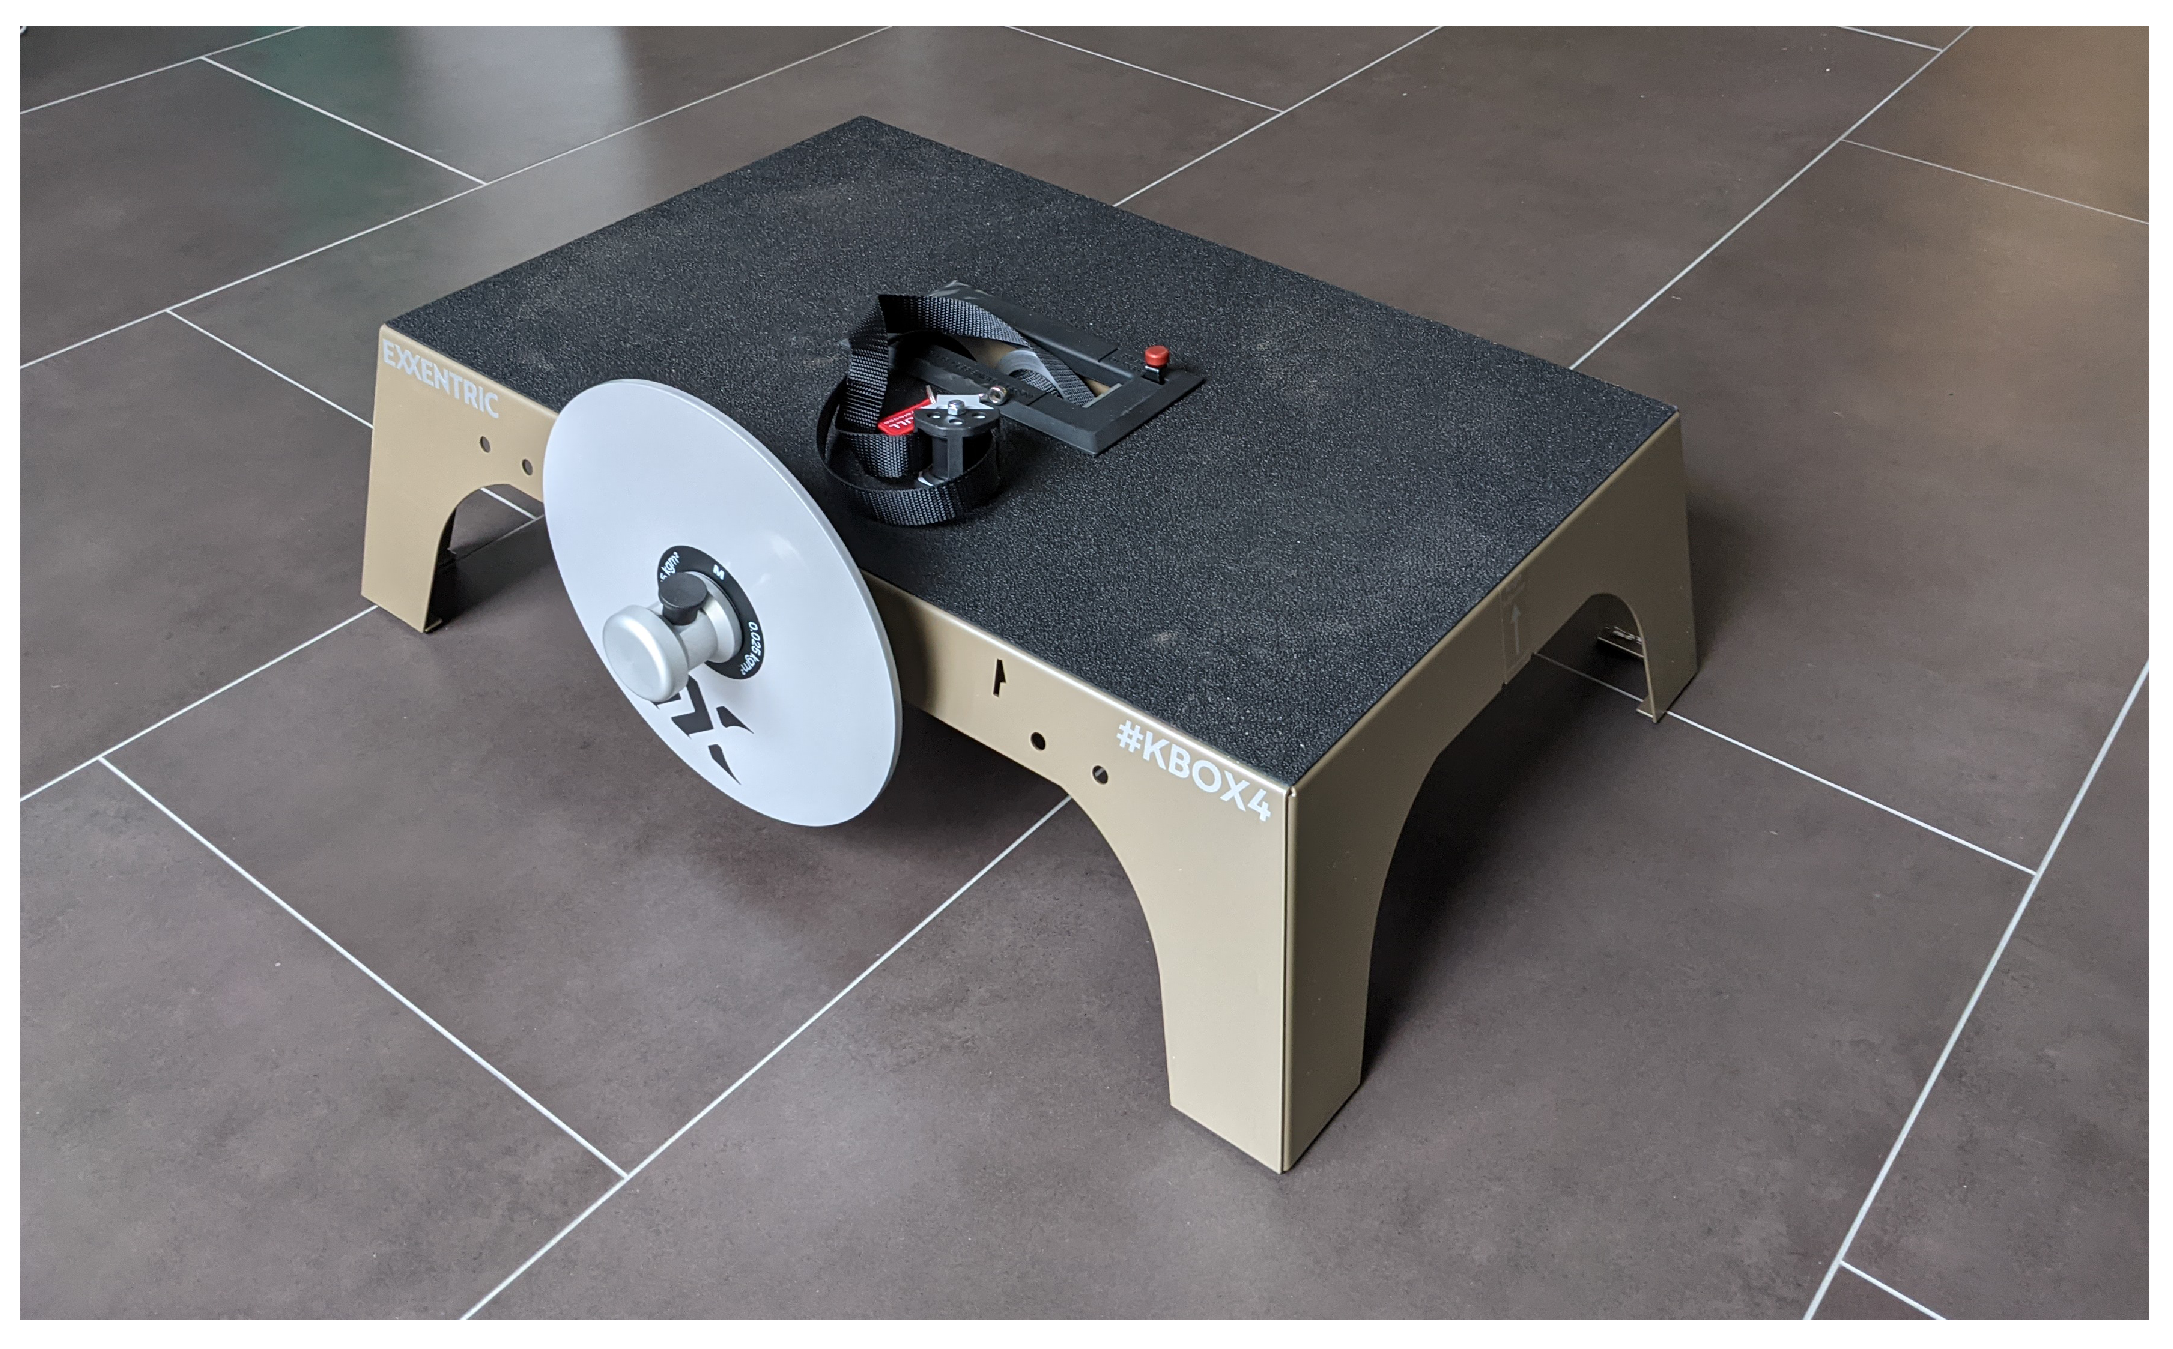
2.2. Flywheel Training Machine

The Flywheel training machine (Exxentric Training, Sweden), as shown in Figure 1, does not work with external weight, which is accelerated towards the ground by gravity, but creates and controls the force and training intensity by a spinning inertial weight plate. The Flywheel consists of a platform with a wheel connected to a harness. Pulling the harness up accelerates the wheel and creates a moment of force. The wheel can be stopped by maintaining a static position or performing a countermovement that neutralizes the energy.
For the squat exercise, the athlete is wearing a hip harness that is connected to the wheel via a belt that is wrapped around a transmission shaft fixed to the Flywheel on the other end. The starting position is in a squat, as shown in Figure 2a. Thus, when a participant extends his knees and hips to move his center of mass upwards, they unwrap the belt from the shaft and spin up the Flywheel. The upward motion is caused by concentric contraction of the knee and hip extensors. At the topmost position, as shown in Figure 2b, the Flywheel induces a downward pull on the belt, which the athlete has to counteract. Biomechanically, the participant neutralizes the Flywheel’s rotational energy by controlling the motion downwards with an eccentric movement. When halting the motion, the subject will again be in the starting position. In contrast to barbell squats, the starting position is in the squat itself, not the standing position. The Flywheel platform can be operated with plates of different sizes. All of the participants in our experiment used the medium-sized plate (0.025 kgm 2 ). For squats with external weight, such as a barbell, load is typically determined by measuring the one-repetition maximum (1 RM) of an athlete and using a certain percentage of that value for training. However, such load quantification in Flywheel training is impossible [13]. We determined the training load for each participant by having them perform several repetitions with maximum effort. Here, they had to apply force against the belt strapped around their waist as fast and hard as possible. This force was transferred via a strap to an axle around which the inertial weight was secured. The approach is similar to that reported by Raeder et al. [11]. During this test, the so-called max speed test, the time of each repetition was first measured. Then, the participants had to perform all subsequent squats at 90% of this velocity. To ensure the timing was correct, all repetitions during the fatigue protocol were guided by a visual metronome.
The Flywheel platform comes with an optional measurement unit, the so-called kMeter. This sensor measures the Flywheel’s rotation with 500 Hz. It calculates information, such as the concentric, eccentric, and average power (in watts), energy (in kilojoules), number of repetitions, and vertical movement (in cm). The accuracy of the kMeter sensor was evaluated using a force plate as a reference, as shown in the study by Weakley et al. [15]. The kMeter device is positioned underneath the Flywheel platform. We recorded the kMeter data during the experiments by streaming the sensor data to an Android smartphone in real-time using the kMeter app.

2.3. Study Setup

We used multiple sensor sources during our experiments, including IMU, ECG, RGB-D cameras, and the kMeter device (as mentioned in the previous section). Figure 3a shows the study setup in the laboratory, including the camera placement. Figure 3b shows the placement of IMU and ECG sensors, as further explained in the following sections.

2.4. Inertial Measurement Unit Sensors

IMU sensors measure their movement in three dimensions. They measure linear acceleration (m/s 2 ) and angular velocity (deg/s) with three accelerometers and gyroscopes placed orthogonally to each other, respectively. For our data collection, we used six Physilog 5 (GaitUp® Corporation, Lausanne, Switzerland) IMU sensors that recorded 3D acceleration and gyroscope. Figure 3b shows a sensor unit with its 3D axes. The sensors sampled data at a frequency of 128 Hz.
We decided on our sensor locations based on related studies and our own experiences. Following the study by O’Reilly et al. [16], we placed a sensor on the back at the height of the fifth lumbar vertebra. We placed another sensor on the sternum to measure chest displacement respective to the lower back. Increasing the relative movement between the sternum and lower back might indicate an incorrect pose of the participant that could be prominent in the data. Four IMU sensors were placed on the right and left thigh and the right and left calf, as proposed by Lee et al. [17]. Figure 3b shows the entire sensor placement. The six sensors streamed the data in real-time to a custom Android application developed for online streaming of sensor data (SensorHub [18]) via Bluetooth.

2.5. Electrocardiography Device

ECG data was recorded using the one-channel Faros 180 sensor (Bittium® Corporation, Oulu, Finland). ECG sensors measure the electrical activity of the heart muscle, where the QRS complex is the most prominent pattern in every heartbeat. The QRS complex reflects the ventricular stimulation, with the R peak as the point of maximum expansion of stimulation of the heart muscle cells. This is reflected as the peak with the maximum amplitude in the ECG signal. The electrode placement of our 1-channel system is shown in Figure 3b. The Faros 180 sampled the ECG data at 1000 Hz, which was directly sent to the SensorHub app. The ECG signal was recorded during the entire session, including the resting phases of the protocol. From that ECG data, so-called Heart Rate Variability (HRV) parameters can be calculated by measuring the distance between successive R peaks. HRV parameters are deduced from the change in intervals between R peaks and can be interpreted to provide a wealth of information about the status of a subject [19]. A higher heart rate implies a greater strain on the cardiovascular system, for example as a result of exercising. Overall, HRV parameters can be split into time-domain, frequency-domain, and non-linear. The Faros 180 also integrates an accelerometer that samples 3D acceleration data at a sampling frequency of 100 Hz.

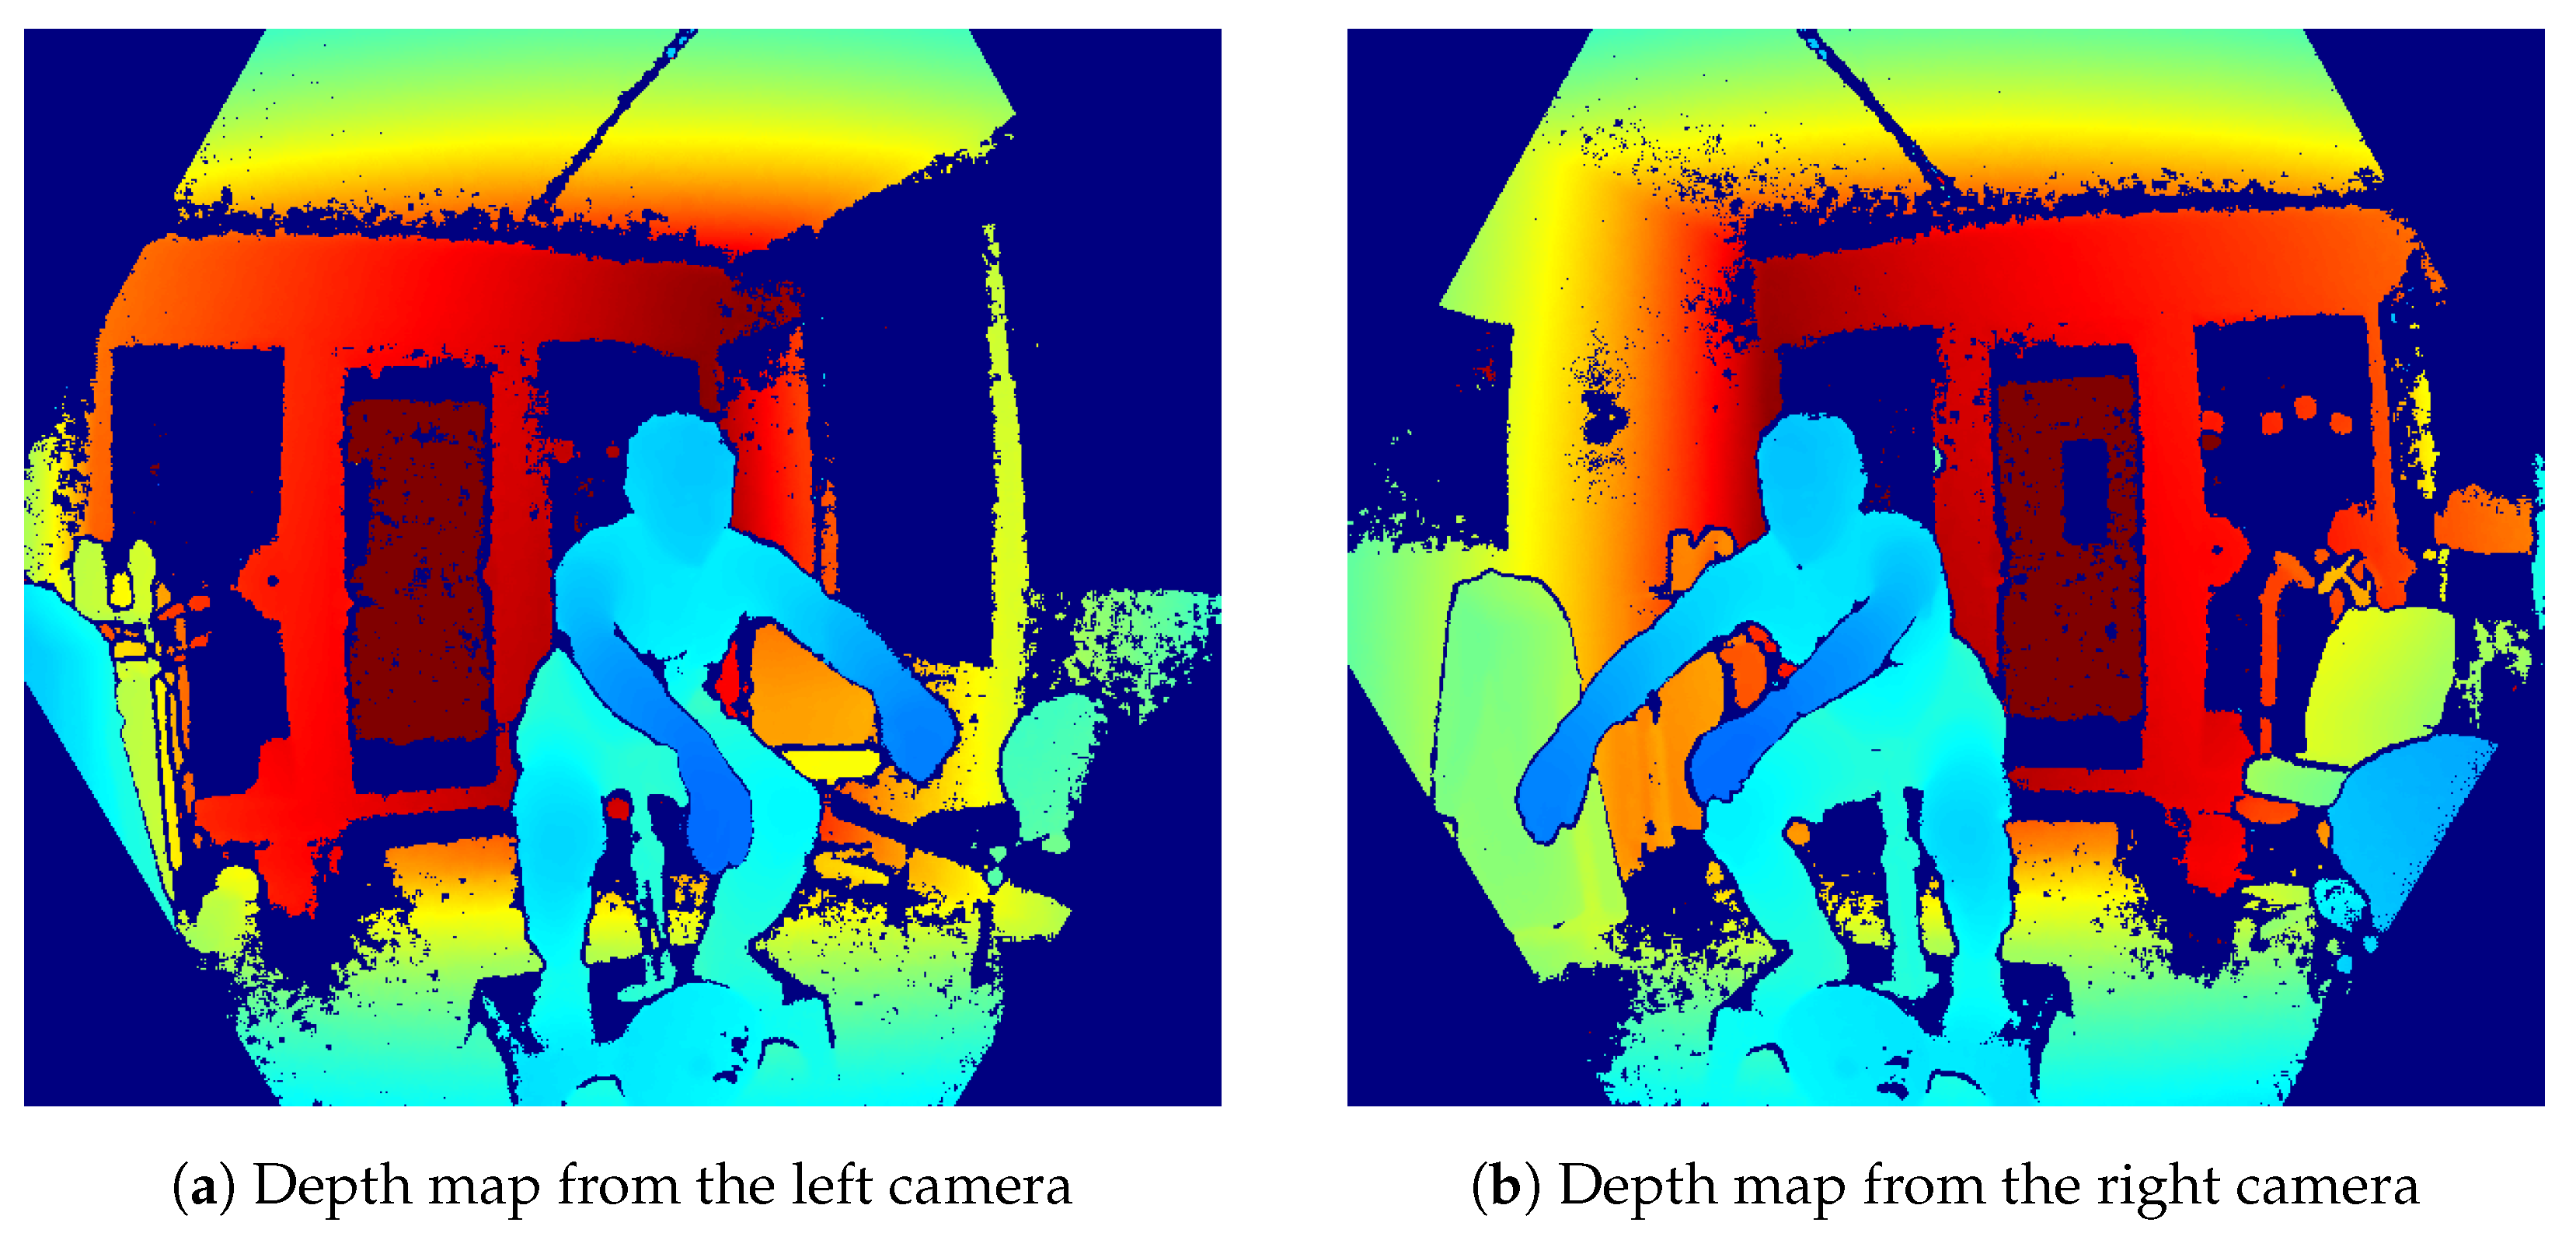
2.6. Microsoft Azure Kinect Cameras

During the exercise part of the protocol, the subjects were recorded using two Microsoft Azure Kinect cameras. This camera combines a 12 MP RGB camera, an infrared emitter and receiver, a 7-microphone array, and an IMU sensor. The camera uses time-of-flight technology to create depth images with a 1 MP resolution (1024 × 1024 px). The core feature of this Kinect camera and its predecessors is the available skeleton tracking algorithm, which can track up to 32 landmarks of users in 3D space. As investigated in the study by Ryselis et al. [20], markerless skeleton tracking on monocular camera systems has problems detecting complicated poses that deviate from standard poses. This problem also occurs in functional movements, such as the squat exercise. Therefore, their study investigated a three-camera Kinect system that fused kinematic data from all cameras and was tested during a functional sport protocol. They analyzed limb length, which is the distance between two adjacent joints. Limb length should stay constant as bones are rigid. The authors assessed the intra-session variability of normalized limb lengths obtained from the camera system using the intraclass correlation coefficient (ICC). They defined an intra-session as a single session divided into two parts of equal lengths. The authors obtained a test–retest reliability of I C C = 0.892 . Another study by Kotsifaki et al. [21] investigated the reliability of a dual Kinect camera system using the predecessor, Microsoft Kinect v2. They evaluated the single-leg squat using a gold-standard marker-based MoCap system. This study found that agreement improved using a dual Kinect system instead of a single camera. The authors found high agreement in the peak angles during the single-leg squat, with an I C C ( 2 , k ) of 0.665 I C C 0.932 . Moreover, the SEM ranged between 2.5 S E M 4.1 degrees. In a previous study, we evaluated the pose-tracking accuracy of the Microsoft Kinect v2 and Azure Kinect to a Vicon gold-standard MoCap system during treadmill walking [22]. The results indicated that the skeleton tracking algorithms deliver similar pose tracking errors, while Azure Kinect provides better foot and ankle markers accuracy. Therefore, we have used multiple Azure Kinect cameras to improve the skeleton tracking quality, similar to the study presented by Xing et al. [23]. The Kinect cameras were placed at an approximately 45 degrees angle each. Figure 4 shows two simultaneously captured depth images. Both cameras captured data at 30 Hz.
The Microsoft Azure Kinect offers an easy-to-use temporal synchronization of multiple devices via hardware using a 3.5 mm audio cable. It allows for two different configurations, the star and daisy chain. We have defined one camera as the master and the other as a subordinate device and connected both using the appropriate wiring on the sync ports. Data were recorded using the Microsoft Azure Kinect recorder tool, which saved the incoming RGB and depth camera streams in the Matroska file format (.mkv). After the recording, the skeleton data was extracted using the Microsoft Azure Kinect Body Tracking SDK version 1.1.2, the latest version at the time of writing. Due to data protection regulations, we only share 2D and 3D joint positions and 3D joint orientations.

2.7. Protocol Definition

The protocol of this study is shown in Figure 5 and took approx. 90 min. As a first step, lactate measurements were taken from the earlobe (EKF Diagnostics, Cardiff, UK). This was followed by five minutes of rest, i.e., watching a relaxing video. Then a second blood sample was taken from the earlobe. Afterwards, the participants performed a warm-up set for two minutes. Then, the target repetition time was determined by asking the participants to perform a few repetitions as fast as possible. Ninety percent of the mean duration of the repetitions were set as target time for each repetition during the protocol. The fatigue protocol consisted of four series, each followed by a break of 180 s to allow for adequate rest during the exercise. All series consisted of three sets that took about 35 s each. Breaks of 60 s were included after each series’s first and second set, while the 180 s series break was included after each series’s third and last set. Each set contained 12 squats on the Flywheel training machine. After every set, subjects reported their current RPE rating. After the fatigue protocol, blood lactate was measured a last time. A significant increase in blood lactate indicates intense exercise, as the body can no longer process all the lactate consumed [24]. Then subjects rested for 20 min, during which ECG data was measured to confirm the return of the heart parameters to baseline. Finally, 15 min after the last squat, subjects reported their session RPE.

3. Data

This section describes the dataset’s structure and presents various data processing methods.

3.1. Dataset Structure

The dataset is organized in a subject-centered structure, as shown in Figure 6. The root level of each subject folder contains meta files with subject-specific information, which is explained in the following paragraph. Each sensor modality (MoCap, IMU, ECG) is stored in a respective folder. The IMU and ECG data are available in two versions: the truncated and untruncated version. The truncated version does not contain data from the resting phases. For the IMU and ECG data, the recorded sensor timestamps are relative to the recording time, i.e., starting from the second zero. We further provide preprocessed HRV and MoCap data, as explained in Section 3.2 and Section 3.3, respectively.
  • anthro.json: contains anthropometric data and subject information, such as age, weight, height, lactate values, session RPE, and repetition time from the max speed test.
  • rpe.json: contains RPE values for each set.
  • kmeter.json: contains Flywheel data, such as peak speed, average power, power concentric, power eccentric, force, and range for each repetition.
  • time_selection.json: contains manually selected timestamps for the start and end of the entire fatigue protocol as well as for each set
  • truncate_info.json: This file contains information regarding additional cropping of the selection from time_selection.json using an automated process to remove even more sensor data not observed during a squat movement

3.2. ECG Data Processing

The Faros 180 sensor saves the ECG data in the European Data Format (EDF). The sensor’s accelerometer data is stored in a comma-separated value (CSV) file. It is hard to interpret raw ECG signals directly. We have calculated HRV parameters using the proprietary Kubios Premium [25] software to gain more insights. Kubios calculates many HRV parameters for a recording in time windows of adjustable lengths. Table 3 shows the set of available HRV parameters. The minimum window length of the Kubios software is 30 s. Larger windows contain more information. However, a set of twelve squats in the protocol usually took around 35 s, with the heart starting recovery to baseline immediately after. Therefore, we chose a short window size to minimize the effects of other repetitions or breaks on the measured data. The Kubios report files are stored in .txt format and are machine readable after skipping the header information.
The HRV parameters in the time domain are derived based on the RR interval, the temporal distance between two consecutive R peaks measured in ms. The mean RR parameter is the mean duration of RR intervals within a given window. The heart rate is the average number of heartbeats per minute. The Training Impulse (TRIMP) parameter is a more complex parameter. It shows how the training load has accumulated in the training session. It is the product of training volume in minutes and the training intensity, modeled as the heart rate reserve information Δ H R (as shown in Equation (1)), according to Morton et al. [26].
Δ H R = H R s a m p l e H R r e s t H R m a x H R r e s e t
In this equation, H R s a m p l e , H R r e s t , and H R m a x refer to the heart rate of the current window, the resting heart rate, and the maximum heart rate. The final TRIMP parameter is calculated as shown in Equation (2), where T refers to the training duration.
T R I M P = T · Δ H R · 0.64 e 1.92 · Δ H R

3.3. Skeleton Data Processing

As mentioned in Section 2.6, we used two Microsoft Azure Kinect cameras from two different viewpoints. Thus, the two skeletons’ time series are in two different local 3D camera coordinate systems. Each skeleton contains measurement errors, so we aim to fuse both skeletons to compensate for one camera’s measurement errors with the other. Therefore, we begin by transforming both skeletons into a global coordinate system before applying fusion methods. We solve this problem by finding a rotation R R 3 , 3 and translation t R 3 , to register the left skeleton to the right skeleton. To this end, the left and right skeletons are denoted as R i j , L i j R 3 for joints j { 1 , , 32 } and timestamps i { 1 , , M } . We re-order both skeletons in point sets P = { p 1 , , p n } and Q = { q 1 , , q n } by flattening all joints and timestamps, with p i , q i R 3 . We then use the SVD-based Kabsch algorithm to minimize the cost function given in Equation (3).
( R , t ) = arg min R R 3 × 3 , t R 3 i = 1 n ( R p i + t ) q i 2
The intermediate result is two overlapping skeletons that contain measurement errors and potentially large outliers, as shown in Figure 7a. When fusing both skeletons using a simple average filter, the final result would be affected by outliers from one of the two skeletons. Thus, we implemented a more advanced fusion method that considers the nature of the human movement. The assumption is that human movement is generally smooth, so measurement errors cause higher jumps between frames. Therefore, we increase the weights w i R or w i L of the respective camera if the joint has a smaller gradient between two consecutive frames, as shown in Equation (4). In our experiments, the exponent α further punishes the weights and is set to α = 1.4 . The final result is a fused skeleton F with joints f i calculated as shown in Equation (5).
w i R = 1 R i j R i 1 j α , w i L = 1 L i j L i 1 j α
F i j = w i R R i j + w i L L i j w i R + w i L
Figure 7 shows an example of the knee joint where both cameras show large outliers that are compensated by the other camera. Finally, a 4th order Butterworth filter was applied to the fused skeleton data.

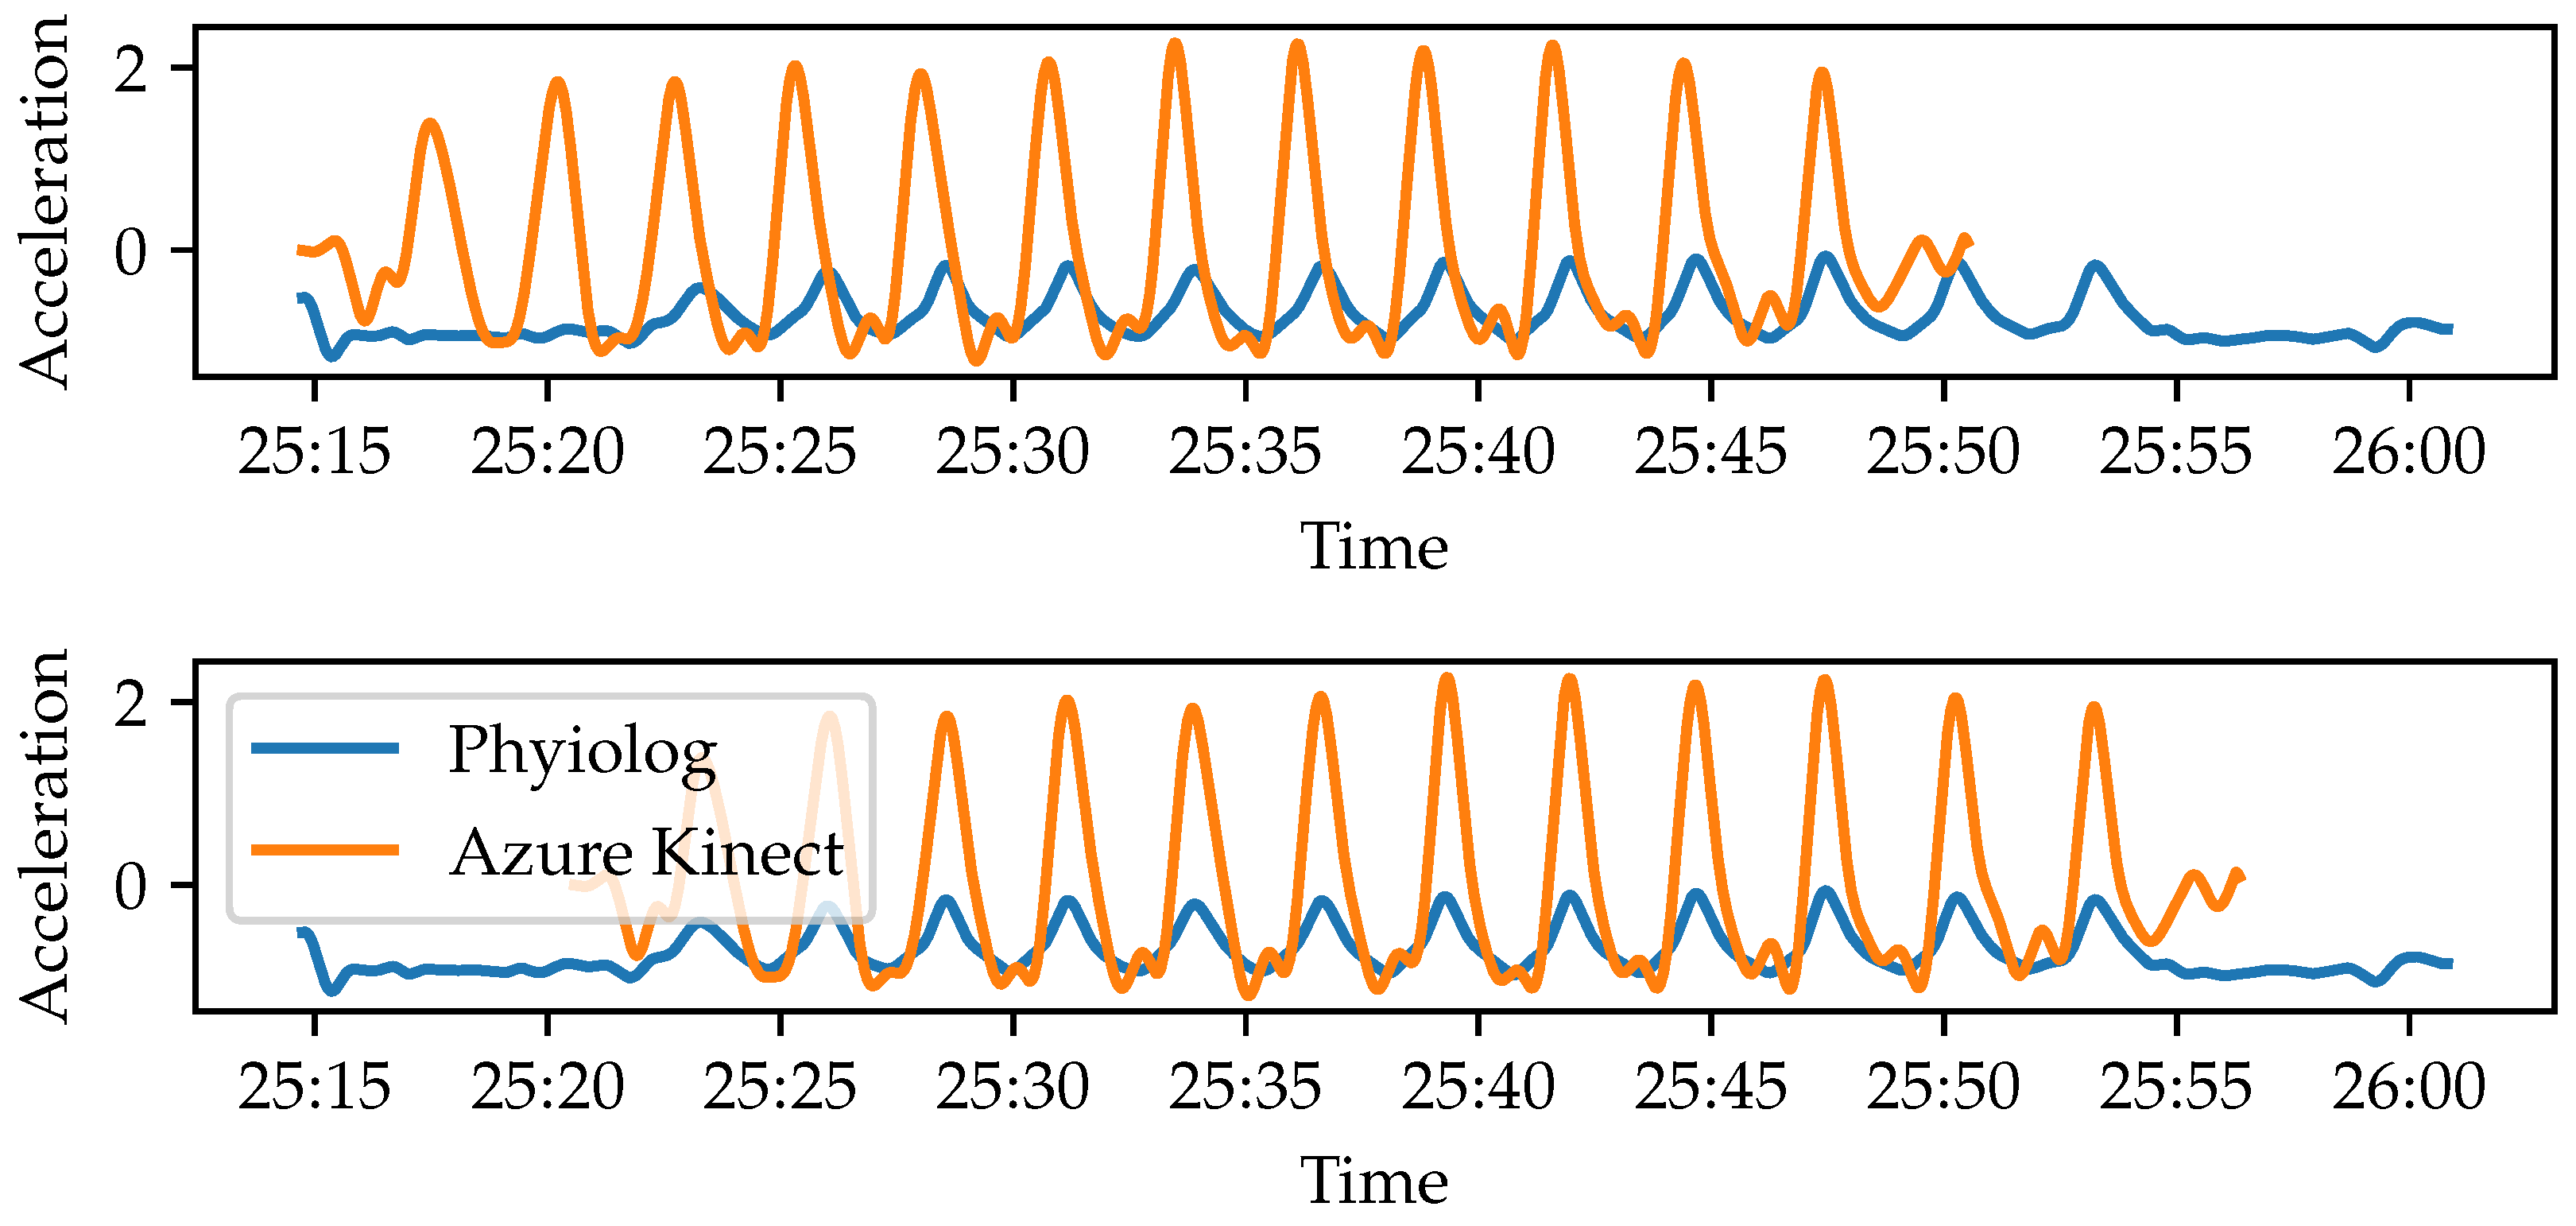
3.4. Synchronization of Azure Kinect and IMU Data

As already mentioned, the ECG and Physilog IMU sensors were already temporally synchronized. The Azure Kinect cameras only recorded data during the physical exercise. The Kinect and ECG or IMU modalities must be temporally synchronized for sensor fusion use cases. For this purpose, we have selected an IMU sensor at a similar location to one of the Kinect markers, which is, e.g., the chest IMU sensor and sternum marker. We calculated acceleration in the vertical axis of the Kinect marker. Successively, both acceleration data can be synchronized using cross-correlation. Figure 8 shows an example set where the Azure Kinect camera was temporally aligned with the IMU signals. We filtered the IMU data using a 4th order Butterworth filter before applying cross-correlation.

4. Evaluation

In this section, we investigate the dataset by conducting an exploratory data analysis, mainly on the Flywheel data modalities. Further, we present a prior study to predict perceived exertion on IMU and HRV data.

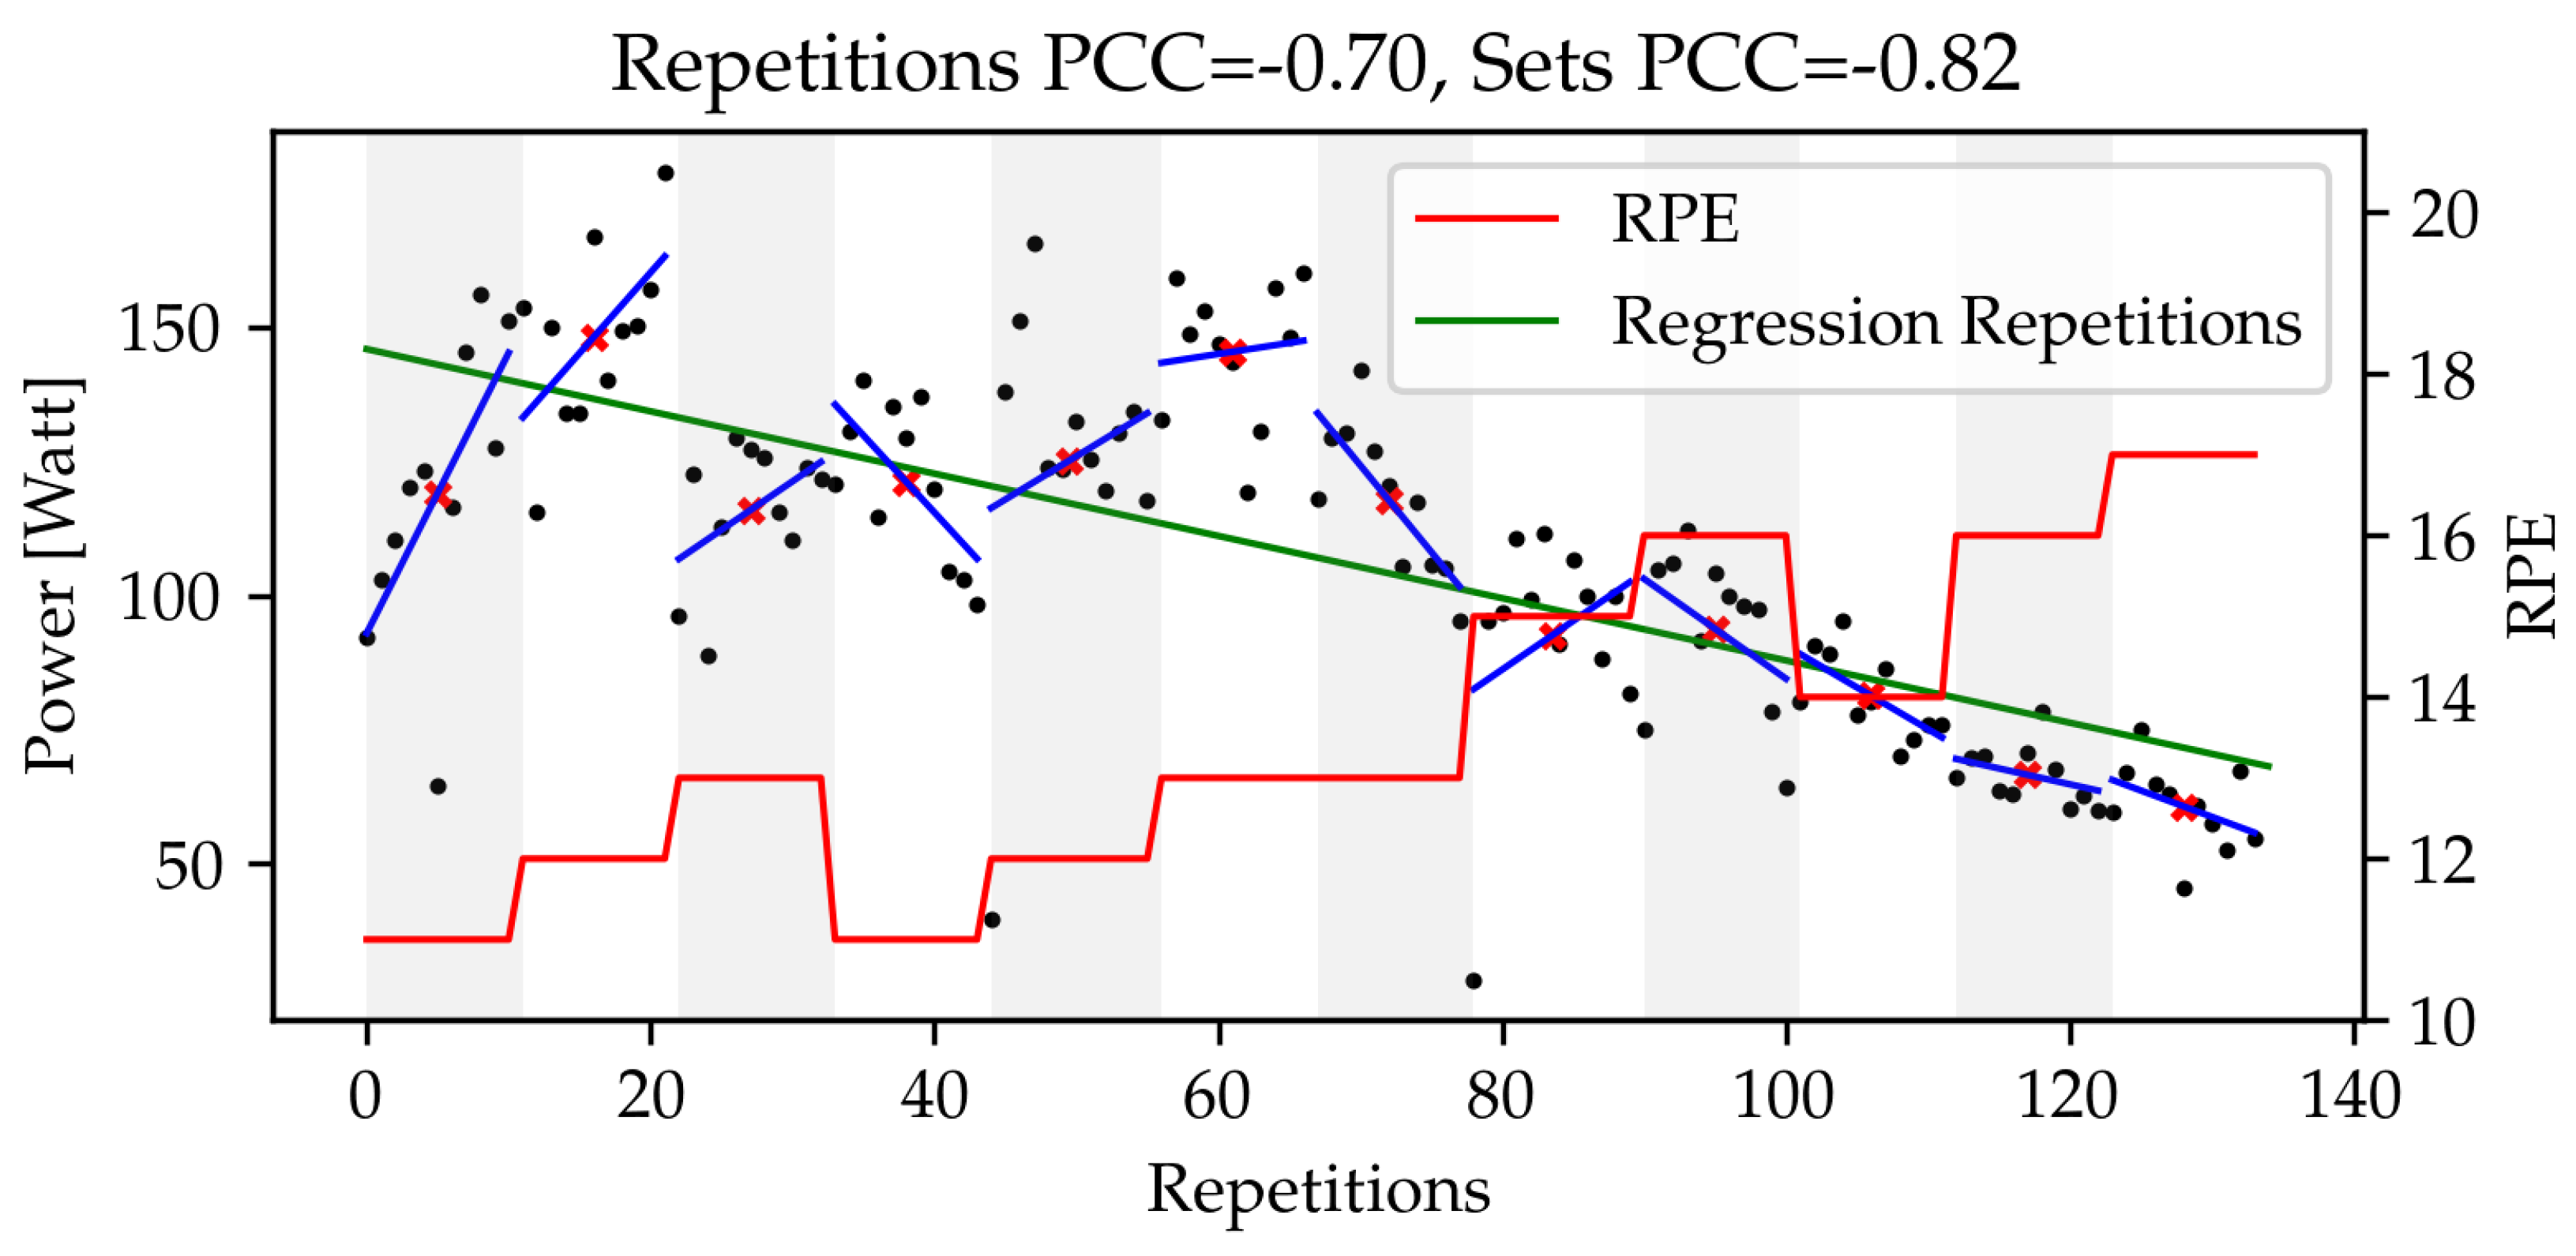
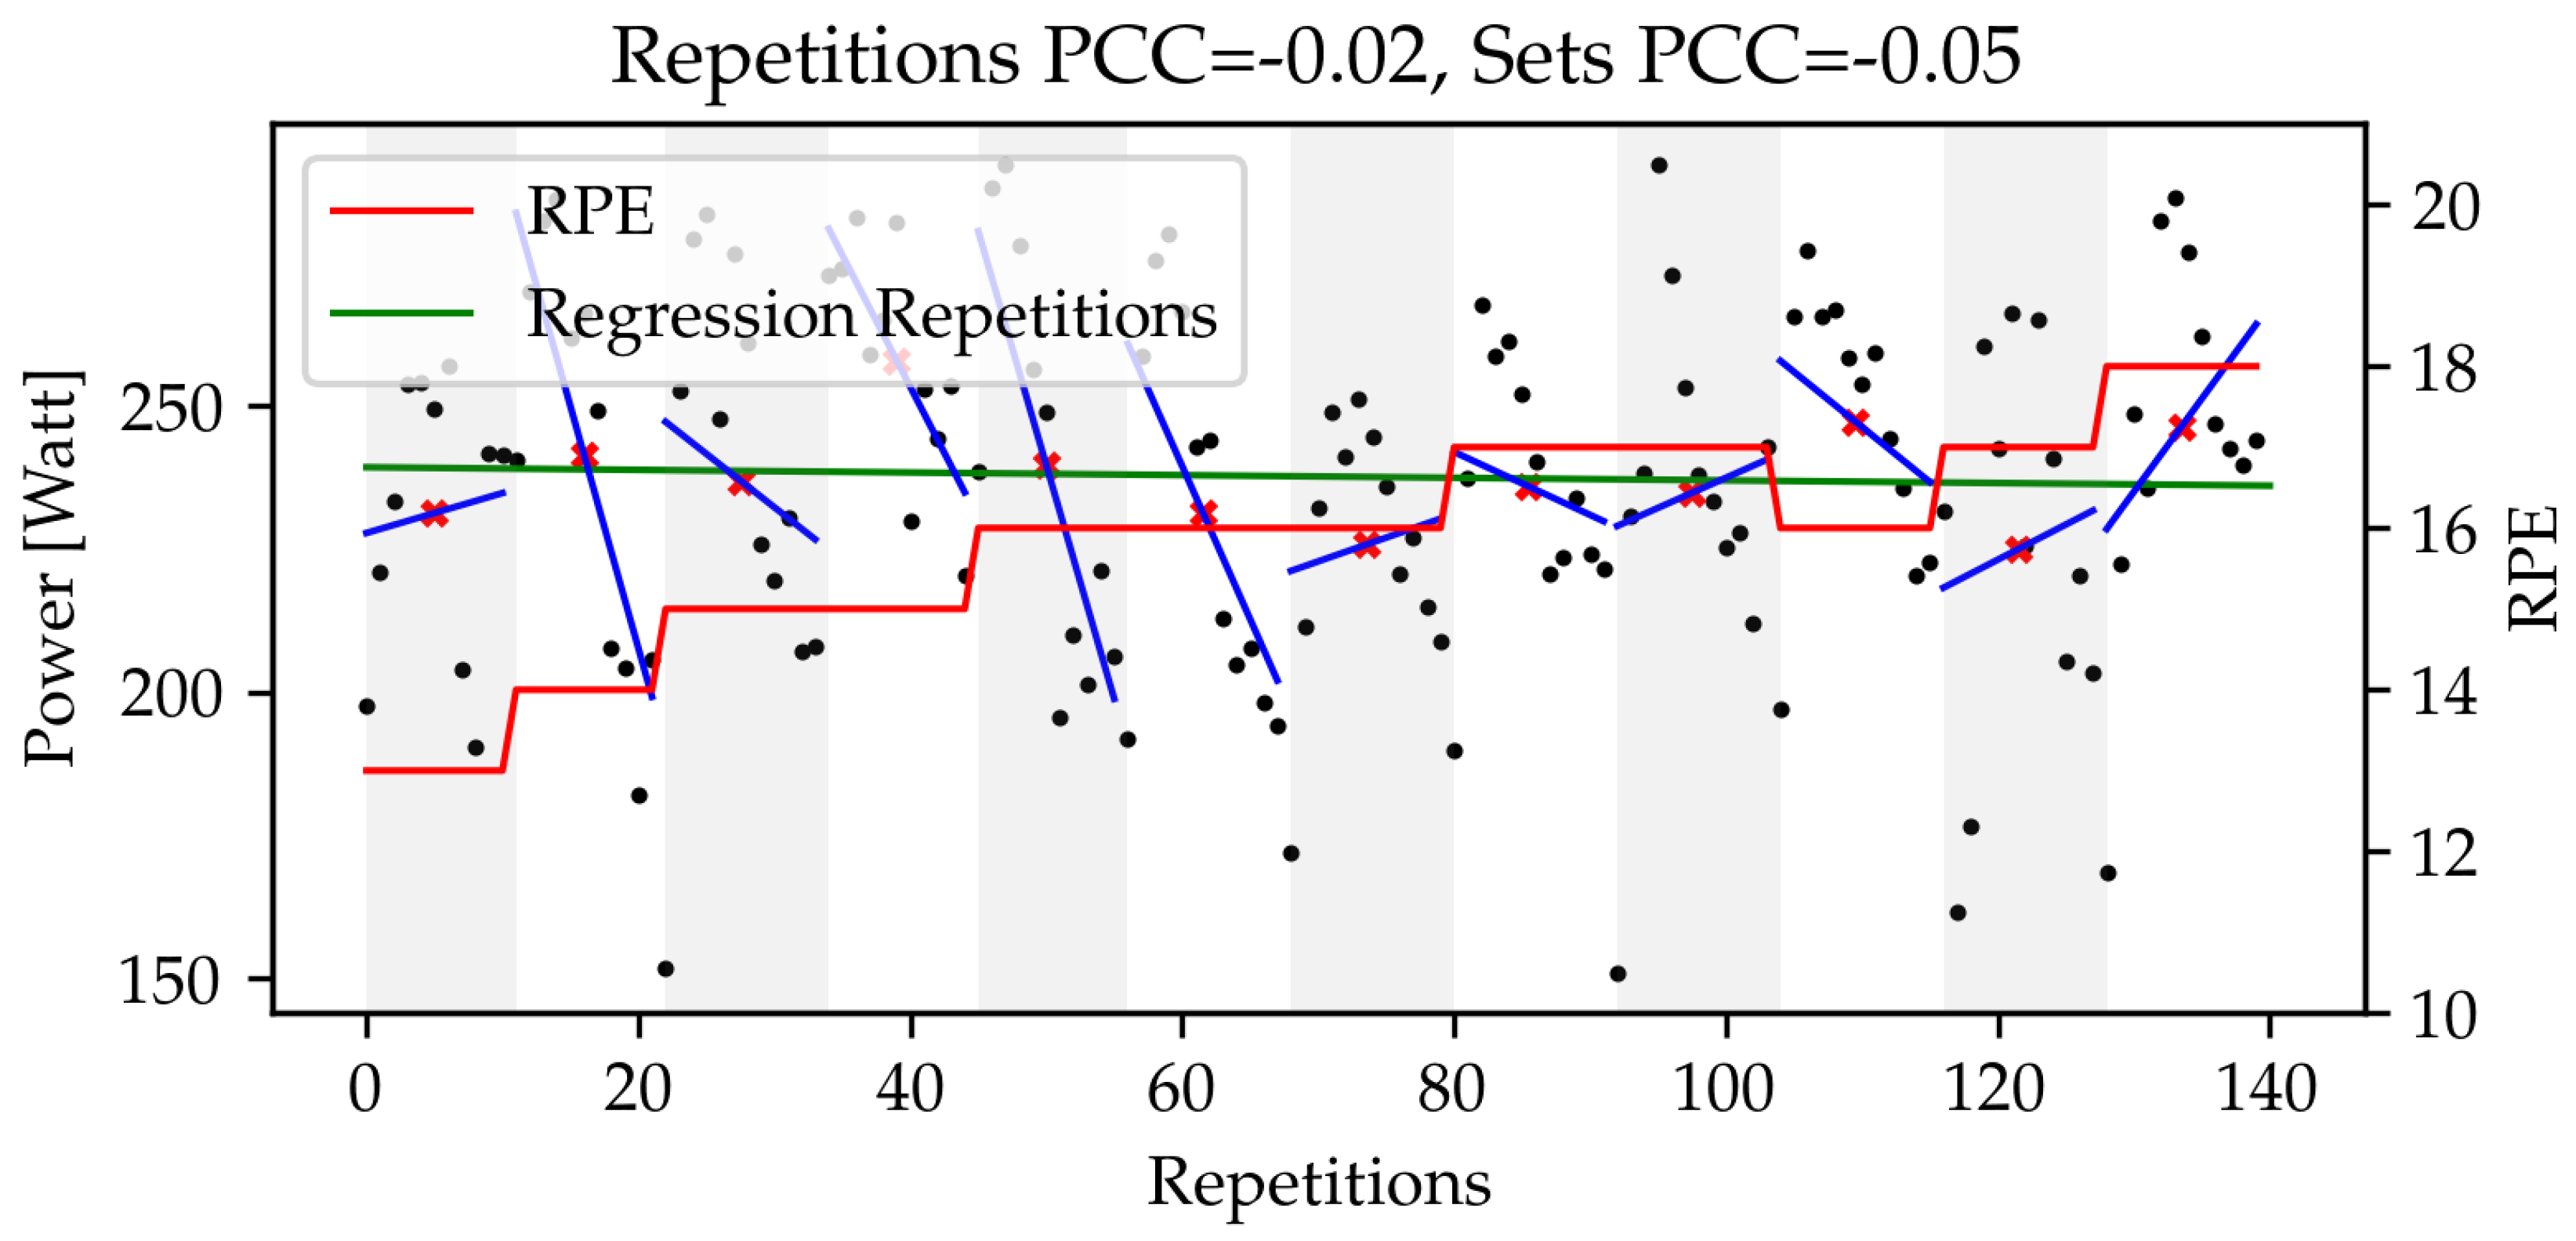
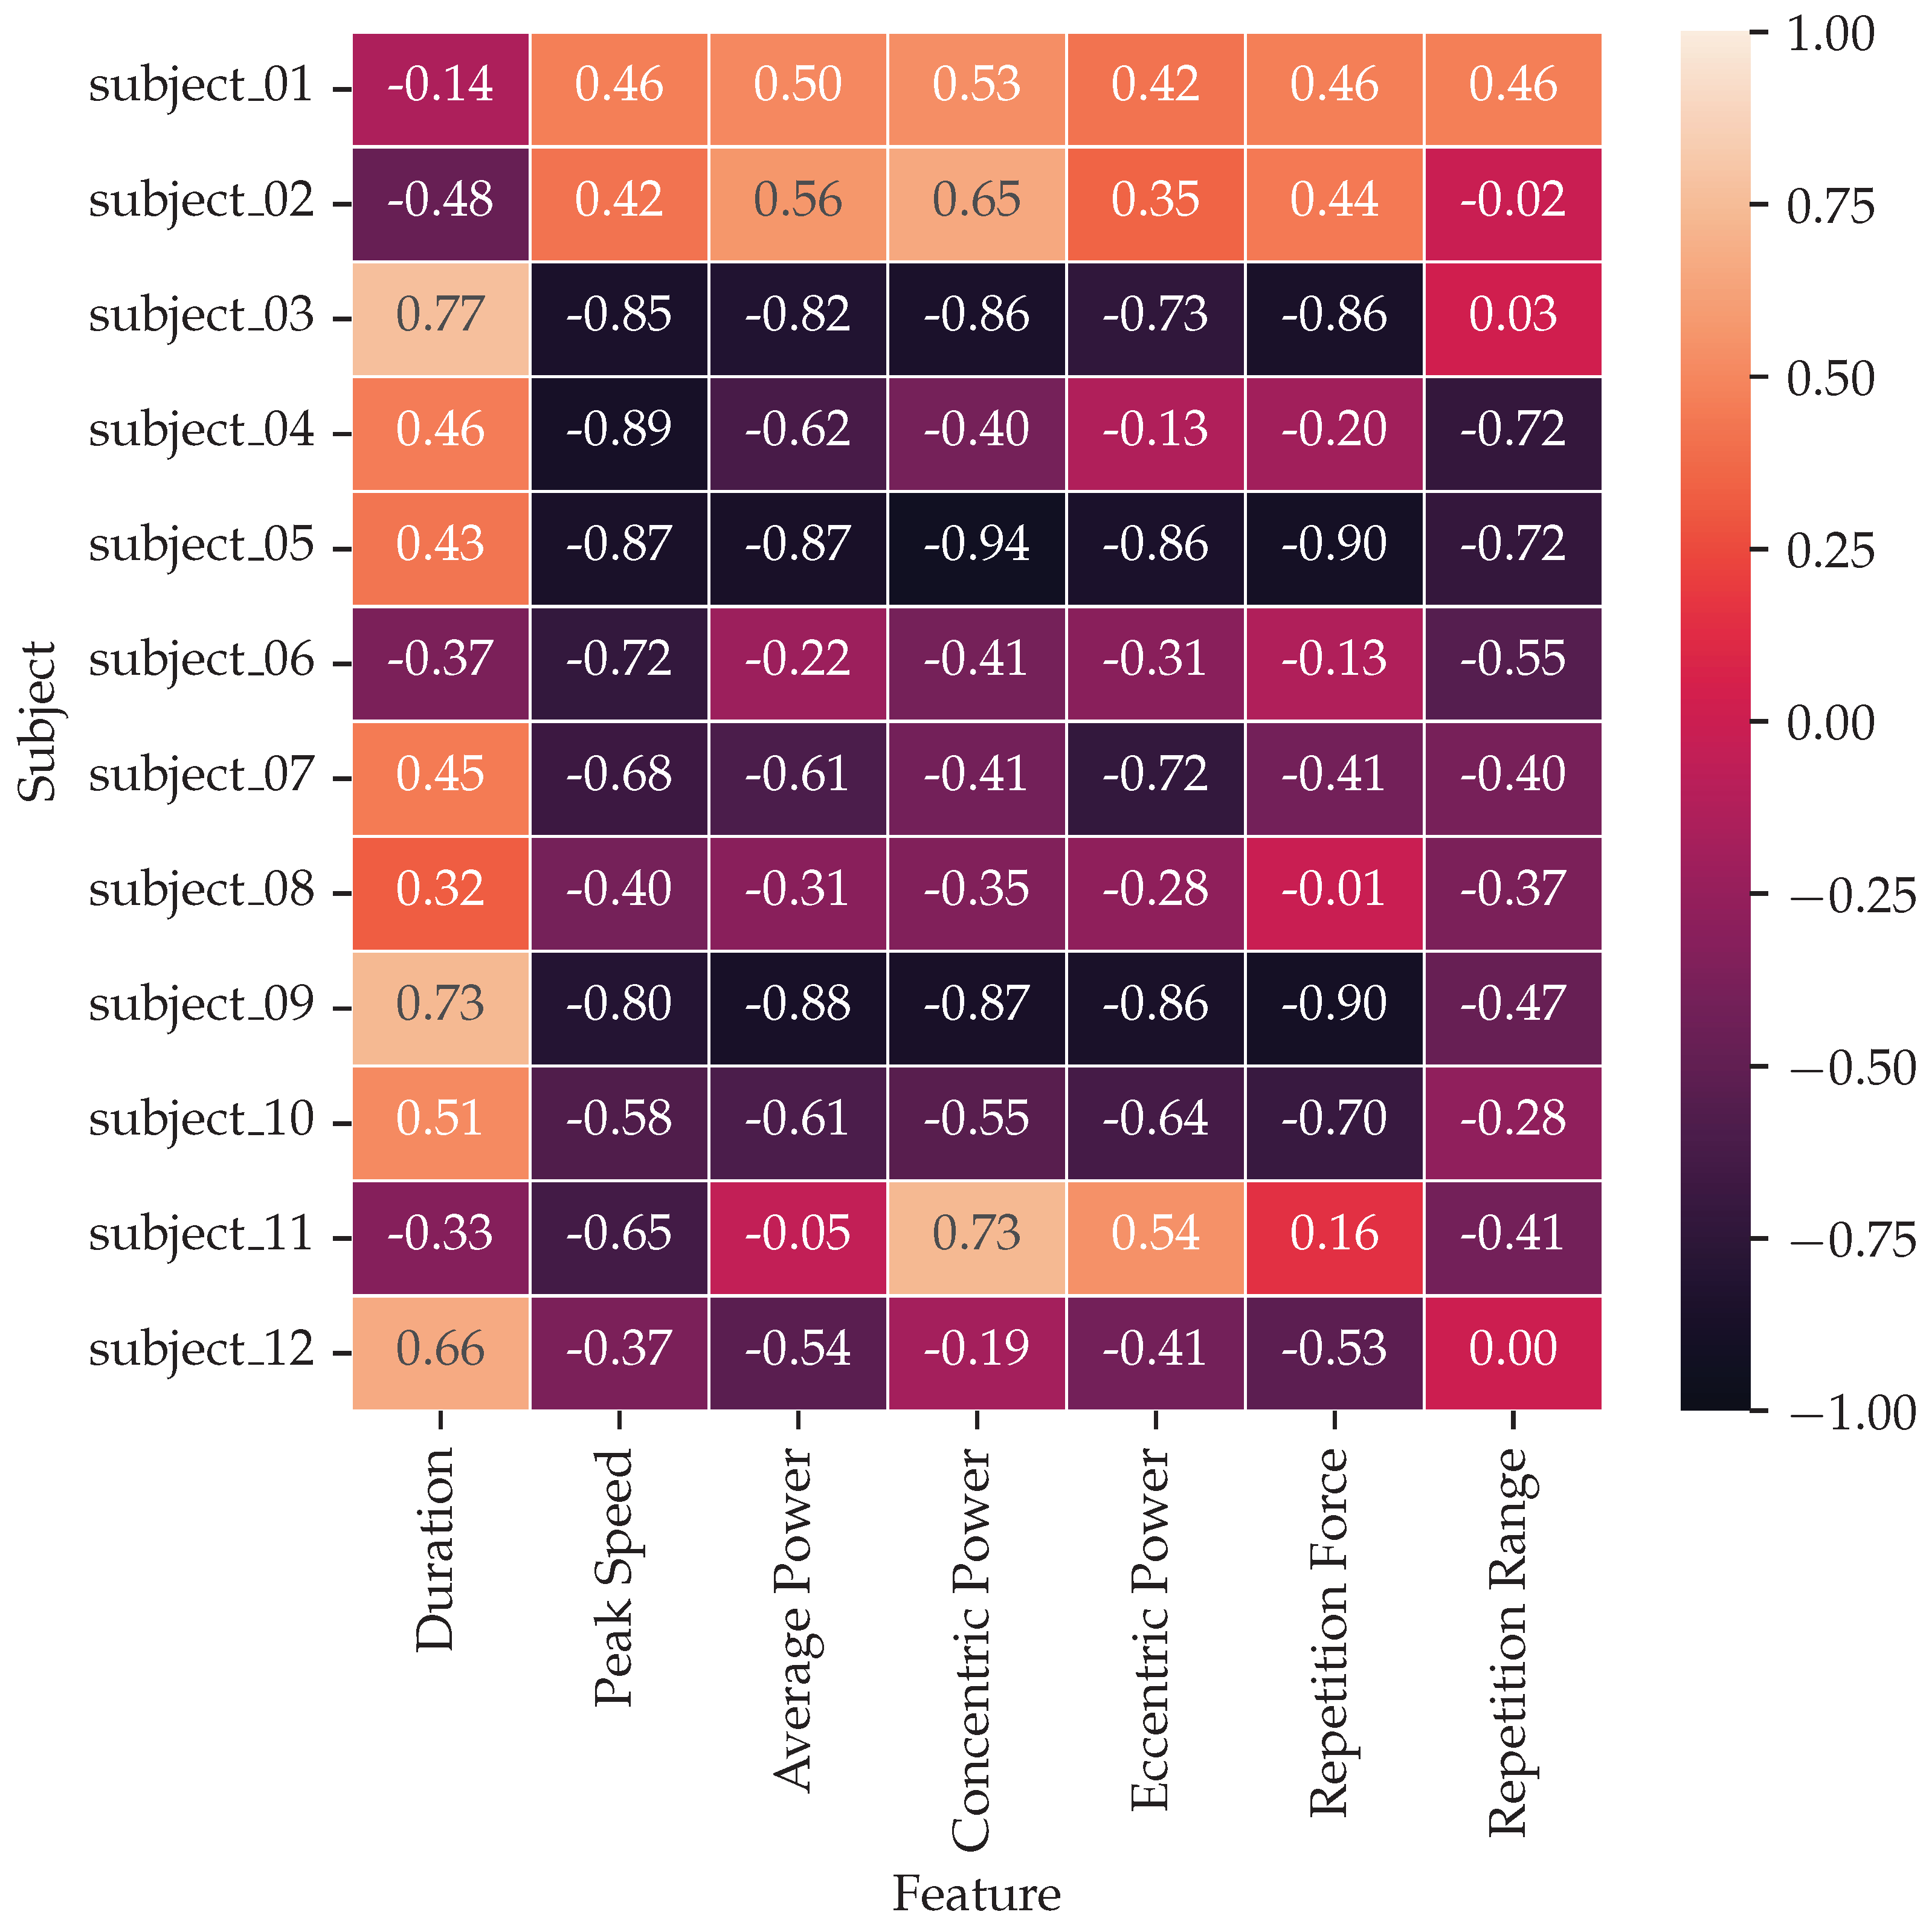
4.1. Exploratory Data Analysis

We begin our dataset exploration by looking at the distribution of the RPE values reported by the twelve subjects. Figure 9 presents the distributions of RPE values, in Figure 9a shown as a heatmap and in Figure 9b shown as a distribution histogram. One subject stopped the experiment due to extreme exhaustion.
As a next step, we analyze the Flywheel data by looking at the average power. We take the sensor readings from the kMeter device as explained in Section 2.2. Outliers in the kMeter data were filtered using a z-score outlier filtering with σ = 3 . We compare the collected data for each repetition to the reported RPE value of the according set. Figure 10 shows a subject’s average power (of concentric and eccentric phase) for the entire protocol and individual sets. We calculate the Pearson’s correlation coefficient (PCC) between the reported RPE values and all individual repetitions and the mean values of each set, respectively. Since we hypothesized that the performance within a set is decreasing, we also show a linear regression for all repetitions in one set. It is evident that the average power decreases over the entire protocol. At the same time, the RPE values increase, which leads to a high negative correlation between RPE and the average power of P C C = 0.82 .
In contrast, the subject shown in Figure 11 shows no correlation between the average power and RPE values. The power performance seems to maintain constant over the entire protocol while the RPE values are increasing. For individual sets, the average power sometimes increases, shown by a positive slope of the regression lines.
As shown in the last two Figures, the average power sometimes correlates with the reported RPE values. We investigate the correlations between the subject’s reported RPE values and the other kMeter features, each the average value per set. Figure 12 shows the correlations of all subjects and features. It shows that the average duration of repetitions is for most subjects correlated with RPE values, i.e., the more fatigued, the slower the speed at which the movement is executed. In contrast, the correlation of the average power is negative for nine out of twelve subjects, i.e., the average power decreases during the protocol. However, for the other subjects, the correlation of average power is low ( P C C = 0.05 ) or even high ( P C C > 0.5 ), making it difficult to use this feature alone for prediction.
In this initial exploratory data analysis, we only investigated the Flywheel modality, as the kMeter provides physical measurements aggregated as high-level information. Our data exploration revealed that most Flywheel parameters correlate with the reported RPE values, either positively or negatively. However, exceptions exist where individual subjects performed way differently from the others, e.g., the first two subjects mostly achieved different inverted correlations for most features. It is necessary to conduct further data analysis on the other modalities, as they can reveal more information and trends in the data.

4.2. Prediction of Subjective Exertion Using Heart Rate and IMU Data

In our previous study, published in [27], we investigated how to predict subjective exertion using machine learning on the collected heart rate and movement signals from the IMU sensor. We have used data from all 16 subjects. We further investigated the advantage of the HRV by training only on IMU but also on IMU and HRV data. Successively, we have investigated the impact of individual features. The objective of this study was only to use wearable sensors and not to include other modalities, such as the cameras and Flywheel data. The motivation was to develop a wearable sensor system that can be entirely worn and potentially work in the wild without laboratory restrictions in the future.
The collected IMU movement data was processed using a sliding window approach with different sizes and overlaps. Furthermore, we filtered the IMU data using a 4th order Butterworth filter with different cut-off frequencies. Successively, we calculated statistical features for each window of IMU data, i.e., the different sensor axes and sensors. Calculating eight statistical features, we obtain a feature vector with 6 · 6 · 8 = 288 entries per window. Our feature set includes minimum, maximum, mean, median, root mean square (RMS), kurtosis, skewness, and standard deviation. The HRV data were processed using the Kubious Premium software, as explained in Section 3.2. To obtain the maximum number of windows, we have used a 30-s sliding window configuration, the smallest reasonable configuration for calculating HRV parameters. After processing the entire dataset, we combined the HRV and IMU data windows by selecting the HRV window closest in time to every IMU data window.
After processing the IMU and HRV data, multiple machine learning models were trained, including Gradient-Boosting Regression Trees (GBRT), Support Vector Regression (SVR) with linear and radial basis function kernels, and random forest (RF). We trained the models for multiple epochs on the shuffled data. We evaluated the machine learning models using leave-one-subject-out (LOSO) cross-validation to obtain a fair evaluation and prevent the models from overfitting. Evaluation metrics were mean absolute percentage error (MAPE), coefficient of determination ( R 2 ), mean square error (MSE), and root mean square error (RMSE). Table 4 summarizes the results of the different models. The GBRT model achieved the best result.
We further investigated the feature importances by training a SVR model on both IMU and HRV data. Table 5 shows both data modalities’ ten most important features. We conclude that the most important feature is the TRIMP HRV feature. More details about these findings are available in the publication Albert et al. [27].
This initial study has shown that it is possible to predict perceived exertion using HRV and IMU data using conventional machine learning models. When investigating the feature importance, the TRIMP feature was ranked as the most important feature. As Table 4 reveals, in training the models only using IMU data alone, the results are much worse, indicated by the R 2 metric that lies between 0.05 R 2 0.08 . An R 2 of zero means that a model only predicts the mean, leading the model not to be useful. Therefore, the HRV data is necessary to improve the prediction results significantly.

5. Discussion

This paper presents a dataset to predict the subjective perceived exertion, represented as RPE values. It includes data from a homogeneous population performing squats, an exercise involving the hip and knee extensors. We selected the Flywheel to perform the squat exercise. Blood lactate measurements confirmed that muscle fatigue was induced by the protocol. We recorded data using multiple sensor modalities, including IMU, ECG, and MoCap data. This dataset contributes to the goal of RPE prediction as it provides multi-modal data recorded in a controlled lab environment.
Although this dataset offers potential for future studies to detect fatigue, we want to highlight possible limitations of the collected dataset. One limitation is the small sample size. Although we recorded 16 subjects in total, only 12 subjects consented to the publication of their data. Another limitation is differences in familiarity with the RPE scale. Not all subjects were familiar with the Borg scale, possibly introducing a bias in the collected RPE values. Another possible limitation is the accuracy of the MoCap data using the Kinect camera. We used Azure Kinect, the latest generation of the Kinect camera at the time of writing. However, the pose estimation lacks accuracy compared to marker-based motion capture systems [28].
In this paper, we presented a preliminary exploratory data analysis of the collected data and a conducted experiment of predicting RPE values only using IMU and HRV data. This experiment showed that predicting RPE values with IMU and HRV is possible, primarily due to the HRV data, especially the TRIMP feature. This implies that building an RPE prediction model with wearable sensors could assist athletes or coaches as a biofeedback system. However, further research is necessary to investigate additional research questions potentially leading to new practical implications. One example is fatigue prediction solely using the MoCap data by analyzing the posture change during the fatigue protocol. This approach could alleviate the need for wearable systems, thus increasing the athletes’ comfort during training. Moreover, marker placement is not necessary with the markerless skeleton tracking of the Azure Kinect camera, thus reducing the setup time and effort. Another research question was to investigate the combination of all sensor data, i.e., multi-modal prediction of subjective exertion. More advanced methods, such as CNN or time-series models, including Transformers or RNNs, could improve the prediction accuracy. So far, we have only used conventional machine learning methods using handcrafted statistical features on IMU and HRV data. Incorporating temporal context could further improve prediction accuracy.
Our dataset was collected in a laboratory environment as this study is still early research in RPE prediction. In this controlled setting, we aimed to control as many independent variables as possible by defining a narrow protocol and strictly setting the subject’s inclusion criteria. The knowledge gained in this study could help further research to bring this method into productive use. However, future research is necessary for this purpose, and the study design needs adjustments. One possibility is the inclusion of a more heterogeneous subject population, where the fitness levels have a larger variation. Another aspect is the inclusion of multiple exercises in the protocol. Moreover, including patients is necessary to make the system practical in rehabilitation or at home and benefit from automated RPE prediction. However, this requires additional and exhaustive data collection and an improvement of the method presented here.

Author Contributions

Conceptualization, J.A.A., A.H., C.M.B., U.G. and B.A.; methodology, J.A.A. and A.H.; software, J.A.A. and A.H.; validation, J.A.A. and A.H.; formal analysis, J.A.A. and A.H.; investigation, J.A.A. and A.H.; resources, U.G. and B.A.; data curation, J.A.A. and A.H.; writing—original draft preparation, J.A.A.; writing—review and editing, J.A.A., A.H., C.M.B., U.G. and B.A.; visualization, J.A.A.; supervision, B.A.; project administration, J.A.A.; funding acquisition, B.A. All authors have read and agreed to the published version of the manuscript.

Funding

This research was partially funded by the HPI Research School of Data Science and Engineering.

Institutional Review Board Statement

The study was approved by the ethics review board of the University of Potsdam (Application No. 21/2021).

Informed Consent Statement

All participants provided written informed consent for this study.

Data Availability Statement

The PERSIST dataset is available under https://zenodo.org/record/7437230. Due to ethics restrictions, we only share the dataset with other researchers. Therefore, researchers interested in accessing the dataset must send a request over Zenodo and provide their research institution and email address.

Acknowledgments

The authors would like to thank all participants who took part in this study.

Conflicts of Interest

The authors declare no conflict of interest.

References

  1. Borresen, J.; Lambert, M.I. The quantification of training load, the training response and the effect on performance. Sport. Med. 2009, 39, 779–795. [Google Scholar] [CrossRef] [PubMed]
  2. Scott, B.R.; Duthie, G.M.; Thornton, H.R.; Dascombe, B.J. Training monitoring for resistance exercise: Theory and applications. Sport. Med. 2016, 46, 687–698. [Google Scholar] [CrossRef] [PubMed]
  3. Borg, G. Perceived exertion as an indicator of somatic stress. Scand. J. Rehabil. Med. 1970, 2, 92–98. [Google Scholar]
  4. Davidson, P.; Düking, P.; Zinner, C.; Sperlich, B.; Hotho, A. Smartwatch-derived data and machine learning algorithms estimate classes of ratings of perceived exertion in runners: A pilot study. Sensors 2020, 20, 2637. [Google Scholar] [CrossRef] [PubMed]
  5. Jiang, Y.; Hernandez, V.; Venture, G.; Kulić, D.K.; Chen, B. A data-driven approach to predict fatigue in exercise based on motion data from wearable sensors or force plate. Sensors 2021, 21, 1499. [Google Scholar] [CrossRef] [PubMed]
  6. Pernek, I.; Kurillo, G.; Stiglic, G.; Bajcsy, R. Recognizing the intensity of strength training exercises with wearable sensors. J. Biomed. Inform. 2015, 58, 145–155. [Google Scholar] [CrossRef] [Green Version]
  7. Carey, D.L.; Ong, K.; Morris, M.E.; Crow, J.; Crossley, K.M. Predicting ratings of perceived exertion in Australian football players: Methods for live estimation. Int. J. Comput. Sci. Sport 2016, 15, 64–77. [Google Scholar] [CrossRef] [Green Version]
  8. Vandewiele, G.; Geurkink, Y.; Lievens, M.; Ongenae, F.; De Turck, F.; Boone, J. Enabling training personalization by predicting the session rate of perceived exertion (sRPE). In Proceedings of the Machine Learning and Data Mining for Sports Analytics ECML/PKDD 2017 Workshop, Skopje, Macedonia, 18 September 2017; pp. 1–12. [Google Scholar]
  9. Chowdhury, A.K.; Tjondronegoro, D.; Chandran, V.; Zhang, J.; Trost, S.G. Prediction of relative physical activity intensity using multimodal sensing of physiological data. Sensors 2019, 19, 4509. [Google Scholar] [CrossRef] [Green Version]
  10. Geurkink, Y.; Vandewiele, G.; Lievens, M.; De Turck, F.; Ongenae, F.; Matthys, S.P.; Boone, J.; Bourgois, J.G. Modeling the prediction of the session rating of perceived exertion in soccer: Unraveling the puzzle of predictive indicators. Int. J. Sport. Physiol. Perform. 2019, 14, 841–846. [Google Scholar] [CrossRef]
  11. Raeder, C.; Wiewelhove, T.; Westphal-Martinez, M.P.; Fernandez-Fernandez, J.; de Paula Simola, R.A.; Kellmann, M.; Meyer, T.; Pfeiffer, M.; Ferrauti, A. Neuromuscular fatigue and physiological responses after five dynamic squat exercise protocols. J. Strength Cond. Res. 2016, 30, 953–965. [Google Scholar] [CrossRef] [Green Version]
  12. Beato, M.; Maroto-Izquierdo, S.; Hernández-Davó, J.L.; Raya-González, J. Flywheel training periodization in team sports. Front. Physiol. 2021, 12, 732802. [Google Scholar] [CrossRef] [PubMed]
  13. Maroto-Izquierdo, S.; Raya-González, J.; Hernández-Davó, J.L.; Beato, M. Load Quantification and Testing Using Flywheel Devices in Sports. Front. Physiol. 2021, 12, 739399. [Google Scholar] [CrossRef] [PubMed]
  14. Cardinal, B.J.; Esters, J.; Cardinal, M.K. Evaluation of the revised physical activity readiness questionnaire in older adults. Med. Sci. Sport. Exerc. 1996, 28 4, 468–472. [Google Scholar] [CrossRef]
  15. Weakley, J.; Fernández-Valdés, B.; Thomas, L.; Ramirez-Lopez, C.; Jones, B. Criterion validity of force and power outputs for a commonly used flywheel resistance training device and bluetooth app. J. Strength Cond. Res. 2019, 33, 1180–1184. [Google Scholar] [CrossRef] [PubMed]
  16. O’Reilly, M.A.; Whelan, D.F.; Ward, T.E.; Delahunt, E.; Caulfield, B.M. Technology in strength and conditioning: Assessing bodyweight squat technique with wearable sensors. J. Strength Cond. Res. 2017, 31, 2303–2312. [Google Scholar] [CrossRef]
  17. Lee, J.; Joo, H.; Lee, J.; Chee, Y. Automatic classification of squat posture using inertial sensors: Deep learning approach. Sensors 2020, 20, 361. [Google Scholar] [CrossRef] [Green Version]
  18. Chromik, J.; Kirsten, K.; Herdick, A.; Kappattanavar, A.M.; Arnrich, B. SensorHub: Multimodal sensing in real-life enables home-based studies. Sensors 2022, 22, 408. [Google Scholar] [CrossRef]
  19. Camm, A.J.; Malik, M.; Bigger, J.T.; Breithardt, G.; Cerutti, S.; Cohen, R.J.; Coumel, P.; Fallen, E.L.; Kennedy, H.L.; Kleiger, R.E.; et al. Heart rate variability: Standards of measurement, physiological interpretation and clinical use. Task Force of the European Society of Cardiology and the North American Society of Pacing and Electrophysiology. Ann. Noninvasive Electrocardiol. 1996, 1, 151–181. [Google Scholar]
  20. Ryselis, K.; Petkus, T.; Blažauskas, T.; Maskeliūnas, R.; Damaševičius, R. Multiple Kinect based system to monitor and analyze key performance indicators of physical training. Hum.-Cent. Comput. Inf. Sci. 2020, 10, 51. [Google Scholar] [CrossRef]
  21. Kotsifaki, A.; Whiteley, R.; Hansen, C. Dual Kinect v2 system can capture lower limb kinematics reasonably well in a clinical setting: Concurrent validity of a dual camera markerless motion capture system in professional football players. BMJ Open Sport Exerc. Med. 2018, 4, e000441. [Google Scholar] [CrossRef] [Green Version]
  22. Albert, J.A.; Owolabi, V.; Gebel, A.; Brahms, C.M.; Granacher, U.; Arnrich, B. Evaluation of the pose tracking performance of the azure kinect and kinect v2 for gait analysis in comparison with a gold standard: A pilot study. Sensors 2020, 20, 5104. [Google Scholar] [CrossRef] [PubMed]
  23. Xing, Q.J.; Shen, Y.Y.; Cao, R.; Zong, S.X.; Zhao, S.X.; Shen, Y.F. Functional movement screen dataset collected with two azure kinect depth sensors. Sci. Data 2022, 9, 104. [Google Scholar] [CrossRef] [PubMed]
  24. Faude, O.; Kindermann, W.; Meyer, T. Lactate threshold concepts. Sport. Med. 2009, 39, 469–490. [Google Scholar] [CrossRef] [PubMed]
  25. Tarvainen, M.P.; Niskanen, J.P.; Lipponen, J.A.; Ranta-Aho, P.O.; Karjalainen, P.A. Kubios HRV–heart rate variability analysis software. Comput. Methods Programs Biomed. 2014, 113, 210–220. [Google Scholar] [CrossRef]
  26. Morton, R.H.; Fitz-Clarke, J.R.; Banister, E.W. Modeling human performance in running. J. Appl. Physiol. 1990, 69, 1171–1177. [Google Scholar] [CrossRef]
  27. Albert, J.A.; Herdick, A.; Brahms, C.M.; Granacher, U.; Arnrich, B. Using Machine Learning to Predict Perceived Exertion During Resistance Training With Wearable Heart Rate and Movement Sensors. In Proceedings of the 2021 IEEE International Conference on Bioinformatics and Biomedicine (BIBM), Houston, TX, USA, 9–12 December 2021; pp. 801–808. [Google Scholar]
  28. Antico, M.; Balletti, N.; Laudato, G.; Lazich, A.; Notarantonio, M.; Oliveto, R.; Ricciardi, S.; Scalabrino, S.; Simeone, J. Postural control assessment via Microsoft Azure Kinect DK: An evaluation study. Comput. Methods Programs Biomed. 2021, 209, 106324. [Google Scholar] [CrossRef]
Figure 1. The Flywheel training device consists of the platform, the rotating flywheel in the front, and the belt coming out of the center of the platform. For squats, a hip harness is connected to the belt of the platform.
Data 08 00009 g001
Figure 2. An athlete performing the squat exercise on the Flywheel training machine. The Flywheel is operated without external weights, using only the athlete’s invested energy.
Data 08 00009 g002
Figure 3. Overview of the study setup (a) and the placement of IMU and ECG sensors on the participants (b). The red boxes indicate the IMU sensors and the blue circles indicate the ECG electrodes. Figure (b) also shows an IMU with its three axes.
Data 08 00009 g003
Figure 4. Two simultaneously captured depth maps from the left and right Azure Kinect cameras showing a subject performing the squat exercise on the Flywheel.
Data 08 00009 g004
Figure 5. Protocol definition of the entire study, including the pre- and post-test and the fatigue protocol consisting of four series with three sets and twelve repetitions.
Data 08 00009 g005
Figure 6. Dataset structure. Each subject has its own folder with subfolders for different data modalities.
Data 08 00009 g006
Figure 7. Skeleton fusion from master and subordinate device. Figure (a) shows the mapping of the subordinate skeleton (red) to the master skeleton (green). In this frame, the knee joint of the master skeletons shows an outlier. Thus, the fused skeleton (blue) puts more weight on the subordinate skeleton. Figure (b) shows a fused trajectory with corrected outliers. The fused trajectory was filtered.
Data 08 00009 g007
Figure 8. Synchronization of the Phyislog IMU sensors and the Azure Kinect camera. The signals were synchronized using the second derivative of the Azure Kinect of the y-axis of the Pelvis joint.
Data 08 00009 g008
Figure 9. Analysis of the collected RPE values of the subjects. Figure (a) shows a heatmap of achieved RPE values per subject. Figure (b) presents a histogram of the mentioned RPE values.
Data 08 00009 g009
Figure 10. Analysis of the average power of the Flywheel kMeter data for a subject where the average power negatively correlates with the provided RPE values. The black dots represent the average power for each repetition. The red line shows the corresponding RPE values. The local trend within each set is shown using linear regression (background colors alternate for each set). The mean value of each set is indicated as a red cross.
Data 08 00009 g010
Figure 11. Analysis of the average power of the Flywheel kMeter data for a subject where the average power is not correlated with the reported RPE values. The black dots represent the average power for each repetition. The red line shows the corresponding RPE values. The local trend within each set is shown using linear regression (background colors alternate for each set). The mean value of each set is indicated as a red cross.
Data 08 00009 g011
Figure 12. Confusion matrix of PCC between individual subjects and all Flywheel kMeter features.
Data 08 00009 g012
Table 1. Related work sorted by year. Studies include the first author’s name, the study population size, the recorded sensor modalities, the target RPE scale, and whether the dataset is publicly available (PA). Some datasets might only be accessible by asking the authors.
Author et al.Study CohortSensorsStudy ProtocolRPE ScalePA
Pernek 2015 [6]11 subjects (3 female, 8 male)IMU6 upper body exercises, 10 repetitions of each exercise, repeated with 4 different weightsClassic Borg scale, ranging from 6–20, individually normalized into the interval n R P E [ 0 , 1 ] No
Carey 2016 [7]45 Australian football playersHR, GPS, IMUTraining session of American footballBorg CR-10 scale, ranging from 1–10No
Vandewiele 2017 [8]45 Belgian soccer playersHR, GPS, IMUMultiple soccer training sessionsBorg CR-10 scale, ranging from 1–10No
Chowdhury 2019 [9]22 subjects (17 male, 5 female)HR, EDA, skin temperaturePhysical activity protocol consisting of quiet sitting or standing, comfortable walking, brisk walking, jogging, fast runningClassic Borg scale, ranging from 6–20, intensity divided into three classes, i.e., low: 6 R P E 11 , moderate: 12 R P E 14 , and high: R P E > 15 On request
Geurkink 2019 [10]46 Belgian soccer playersHR, GPS61 soccer training sessionsCustom RPE scale, ranging from 1–10No
Davidson 2020 [4]12 male subjectsHR, GPS, V O 2  peakRunning until exhaustion (parkour of 5 km and 2 km for trained, untrained, respectivelyClassic Borg scale, ranging from 6–20, intensity divided into two classes, i.e., medium: R P E 15 , high: R P E > 15 No
Jiang 2021 [5]14 subjects (12 male, 2 female)IMU, MoCap, force platesPhysical exercise protocol, three exercises (squat, high knee jack, and corkscrew toe-touch), five repetitions per set until exhaustionCustom RPE scale, ranging from 1–10No
This study12 male subjectsIMU, HRV, MoCap, Flywheel energyFlywheel squat exercise protocol, 12 sets with 12 repetitions eachClassic Borg scale, ranging from 6–20Yes
Table 2. Participant characteristics and information about the weekly training time, before and since the second lockdown in Germany. SD stands for standard deviation.
MinimumMean ± SDMaximum
Age (y)19.923.3 ± 2.929.1
Body mass (kg)75.082.6 ± 4.890.0
Height (cm)174.0183.8 ± 5.3192.0
Training experience (y)1.03.7 ± 2.310.0
Workouts per week23.4 ± 1.36
Training duration (m)50.075.0 ± 19.8120.0
Workouts per week since COVID02.7 ± 1.56
Training duration since COVID (m)0.060.4 ± 33.3120.0
Table 3. List of Kubios HRV export parameters in the three different domains.
CategoryParameters
OverviewArtifacts [%]
Time DomainMean RR [ms], SD RR [ms], Mean HR [1/min], SD HR [1/min], Min HR [1/min], Max HR [1/min], RMSSD [ms], NN50, pNN50 [%], HRVti, TINN [ms], Intensity (TRIMP/min), Load (TRIMP)
Frequency DomainVLF Peak [Hz], LF peak [Hz], HF peak [Hz], VLF power [ms 2 ], LF power [ms 2 ], HF Power [ms 2 ], VLF power [log], LF power [log], HF Power [log], VLF power [%], LF power [%], HF Power [%], LF/HF ratio, EDR [Hz]
Nonlinear DomainSD1 [ms], SD2 [ms], SD2/SD1
Table 4. Training results of four machine learning models predicting perceived exertion using IMU features alone and a combination of IMU and HRV features.
MAPE (%) R 2 MSERMSE
ModelIMUIMU + HRVIMUIMU+HRVIMUIMU + HRVIMUIMU + HRV
GBRT 11.83 ± 2.33 7.71 ± 2.62 0.01 ± 0.12 0.48 ± 0.30 2.14 ± 0.49 1.45 ± 0.44 4.74 ± 1.96 2.23 ± 1.34
SVRL 11.17 ± 3.17 8.78 ± 3.51 0.03 ± 0.13 0.40 ± 0.18 2.19 ± 0.59 1.71 ± 0.67 5.04 ± 2.40 3.23 ± 2.11
SVRR 11.79 ± 4.63 10.09 ± 2.68 0.05 ± 0.26 0.22 ± 0.19 2.24 ± 0.81 1.89 ± 0.49 5.46 ± 3.61 3.72 ± 1.91
RF 11.30 ± 3.43 8.27 ± 2.60 0.08 ± 0.10 0.52 ± 0.06 2.09 ± 0.64 1.51 ± 0.45 4.63 ± 2.57 2.41 ± 1.33
Table 5. The ten most important features identified by training a SVR regression model on the IMU and HRV data.
FeatureModalityRank
Load (TRIMP)HRV1
Thigh, Left GX, Max.IMU2
Tibia, Right GX, Min.IMU3
Tibia, Right GZ, Min.IMU4
Tibia, Right AX, SkewnessIMU5
Thigh, Left GX, MeanIMU6
Thigh, Left GX, Med.IMU7
Tibia, Right GX, Max.IMU8
Tibia, Right GZ, Max.IMU9
Tibia, Right AZ, Min.IMU10
Intensity (TRIMP/min)HRV11
Thigh, Right AZ, Min.IMU12
Disclaimer/Publisher’s Note: The statements, opinions and data contained in all publications are solely those of the individual author(s) and contributor(s) and not of MDPI and/or the editor(s). MDPI and/or the editor(s) disclaim responsibility for any injury to people or property resulting from any ideas, methods, instructions or products referred to in the content.

