Article

Message in a Bottle: An Exploratory Study on the Role of Wine-Bottle Design in Capturing Consumer Attention

1
Department of Agricultural, Food and Environmental Sciences (D3A), Università Politecnica delle Marche, Via Brecce Bianche, 60131 Ancona, Italy
2
Department of Materials, Environmental Sciences and Urban Planning (SIMAU), Università Politecnica delle Marche, Via Brecce Bianche, 60131 Ancona, Italy
*
Author to whom correspondence should be addressed.
Beverages 2023, 9(2), 36; https://doi.org/10.3390/beverages9020036
Submission received: 31 January 2023 / Revised: 1 April 2023 / Accepted: 14 April 2023 / Published: 19 April 2023
(This article belongs to the Section Sensory Analysis of Beverages)

Abstract

:
This study aims to investigate the influence of wine-bottle design and the position of labels on consumers’ visual attention in digital contexts. Two within-subjects experiments combined with implicit eye-tracking measures were implemented in Italy. The visual attention of twenty-four participants was measured using areas of interest metrics while being asked to view two differently shaped bottles in three orientations. Subsequently, four examples of each bottle type were displayed, positioning an organic logo in different areas. Attention and interest measures were captured and analysed using a factorial repeated-measures ANOVA. The results show that the shoulder is the bottle’s first and most fixated part. Significant differences in participants’ attention and interest were found according to the interaction of bottle type and bottle part, as well as bottle part and orientation. Furthermore, exploring the inclusion of an organic logo on different bottle parts provided consistent results. Wine producers and marketers could benefit from bottle anatomy and morphology to identify the best place to display essential information to capture the consumer’s visual attention and interest.

1. Introduction

Online shopping in the European Union (EU) increased from 63% in 2016 to 74% in 2021 among internet users [1,2]. Online offers for wine have also grown [3]. The recent boost in e-commerce activity due to the COVID-19 outbreak pushed wine sales from a 12% increase in 2019 to 43% in 2020 across sixteen key markets, including Italy [4,5]. In general, the online retail wine market is becoming a popular e-commerce niche, which in Italy deserves specific attention, as the country is a leading worldwide producer and consumer of wine [6].
While wine e-commerce is becoming increasingly popular, wine producers can expand into new markets that might otherwise be unreachable [7,8]. Given the nature of e-commerce, consumers cannot experience a wine’s intrinsic attributes and sensory qualities [9] and must rely on information provided through the web [10,11]. Nevertheless, the mind needs some quality cues to quickly process the information received during the purchasing process [12]. Consumers rely on visual search cues, such as product and packaging (i.e., bottle and label) characteristics [13,14], as a risk mitigation strategy. In wine e-commerce, this strategy is especially evident among inexperienced or uninformed consumers [15].
Studies focusing on the effects of bottle design on consumers’ visual attention are scarce. Although label information, colour, and shape symbolism in the packaging of beverages have been addressed in the literature [16,17,18], no studies have focused on the effects of bottle morphology and the different physical parts of a bottle on the consumer. Earlier research has indicated the significance of bottle attributes such as shape, size and colour, as these often help the consumer to identify and categorise the product [19,20]. While previous studies have shown that the orientation of beer bottles can impact consumer attention [21], there is a dearth of research exploring how the bottle morphology and orientation influence consumers’ perceptions concerning virtual depictions of wine bottles. Understanding which part of a bottle and what orientation has the most significant effect on consumers’ visual attention might help marketers decide to place the most relevant information in that area. Consequently, bottle manufacturers might differentiate their products based on the shape of the bottle part that captures the most consumer attention.
In this context, the aims of the current study were twofold. The main objective was to investigate the role of wine bottles’ anatomical and morphological1 features on consumers’ visual attention in digital contexts. The secondary goal was to identify the most prominent bottle parts for labelling in different types of bottles and diverse orientations [21]. To achieve these objectives, the study employs an experimental research design with a repeated measure within-subsect design in combination with an eye-tracking device. Findings can aid in developing more effective marketing strategies for wine manufacturers.

Conceptual Framework

Product packaging plays a crucial role in helping consumers assess what kind of product they are about to purchase and its associated quality [22,23]. In the case of wine, bottling is essential for product quality purposes, such as containment, protection, and preservation [24,25,26], as well as for aesthetic reasons. Indeed, aesthetics increase consumer reaction times and preference over standardised packages in well-known brands, despite price differences [27]. As packaging influences consumer perception and product acceptance [13], wine bottles must be appropriate for use in multiple contexts and as part of specific social rituals [28].
External visual stimuli and package design elements are crucial in capturing consumer attention [22,28,29]. In the literature, packaging design elements are classified into two main categories: visual and informational [30]. While the visual elements include the shape, size and graphics of the packaging, the informational elements consist of the product information from the packaging, e.g., labels. Label information has received great attention in previous research on visual attention as an informational element [28,31,32,33]. A recent study by Chamorro et al. [34] shows that the label has the biggest influence on consumer choice, followed by bottle type among diverse design elements of a wine bottle. While the front label, where information such as country of origin or brand name is presented, is considered very important as a first communication tool with the consumer, the back label refers to other information such as wine description [35].
In the online retailing context, products are presented as small images of wine bottles showing only the front side, which usually requires the customer to zoom in (or to click to expand and read the text) to read the information on the label [36]. This means that when consumers interact with the different wine bottle offers, the bottle labels are not immediately visible to them. Instead, bottle shape, colour, and size are the most relevant factors affecting consumer choice and attention [19,29,37].
The above framework encompasses most packaging design elements that impact consumer attention within consumer research. Understanding these elements and their impact on consumers can lead to effective design strategies that capture consumer attention in market research. Although bottle design and type in beverage packaging, especially for wine, has previously been explored [34], the role of wine-bottle anatomy and morphology as a consumer’s visual attention driver has, until the present moment, mainly been ignored. Utilising the eye-tracking technique to explore consumers’ visual attention towards these elements and their interaction can yield valuable insights. This research gap presents an opportunity to investigate the influence of bottle type, bottle part and orientation on consumer attention.

2. Materials and Methods

2.1. Experimental Design

The study was conducted using a repeated-measures within-subjects experimental procedure in combination with an eye-tracking device. Within-subjects designs combined with eye-tracking devices are frequently used in consumer research on attention as a tool to determine whether visual stimuli are attended to or not [38,39]. In the present study, two within-subjects experiments were conducted. The first experiment, a 2 × 4 × 3 mixed factorial design, measured consumers’ attention across two bottle types, four bottle parts and three different bottle orientations. The second experiment, a 2 × 4 design, measured consumer attention on two bottle types and on a logo placed on four different parts of each bottle. In both cases, participants’ attention was the dependent variable, captured through an eye-tracking device.

2.2. Stimuli

‘Bare’ bottle images without labels were chosen for the first experiment to avoid any attention bias on the labels or other complex visually processed elements. Since the aim of the study was related to bottle anatomy and morphology, stylised images (silhouettes) of each bottle were used to avoid any reflection, contrast and colour differences coming from the actual photos, which may have impacted the visual attention of the participants. Specifically, two bottle models of the same volume (750 mL) commonly used in the wine-bottling industry but different in design and shape were chosen for this study. The bottles differed in the design (anatomy and morphology) and proportions of their individual parts. While one bottle had a more extended shoulder and shorter body and heel, the other had a shorter shoulder but a longer body and heel (Figure 1).
Each bottle was divided into four equal-sized areas of interest (AOI) (Figure 1). AOIs were defined considering bottle anatomy, and guidelines were suggested according to previous research [40,41]. The four AOIs were defined according to the silhouette of the bottle: (i) top (i.e., the upper part of the bottle); (ii) shoulder; (iii) body (i.e., the central part of the bottle); and (iv) heel (i.e., the lower part of the bottle—the bottom).
For the first experiment, stylised images of each bottle were prepared in three orientations: vertical, horizontal left and horizontal right (Figure 2) to provide more reliable results, as well as presenting the bottle images in different orientations to avoid a bias towards looking at the centre of the viewing area, as mentioned by Tatler [42].
For the second experiment, the European organic logo was placed on each bottle in four different positions, considering the bottles’ body parts (Figure 3). The organic logo was selected for two main reasons. On the one hand, the organic logo is a highly valued and trusted label across Europe [43,44], as well as a well-known label component in the wine market [45]. On the other hand, it is mainly composed of visual elements, which consumers tend to prefer over verbal descriptions [28,46,47]. The different bottles’ silhouettes, orientations and manipulations were designed using Adobe Photoshop.

2.3. Procedure

The experiment took place in a quiet room under standard illumination conditions. Each participant entered the laboratory individually, received the instructions and signed the informed consent form. Participants were seated in front of a monitor and asked to move as little as possible once they had found a comfortable position. The distance from the eye tracker and monitor was respected. In the instructions presented on screen, participants were informed that the survey aimed to identify the most suitable location of the organic production logo for each wine bottle—independently of whether it was situated at the front or back—according to their preferences and the test was started on the screen.
Each step is illustrated in Figure 4. Before data collection, each participant started the experimental session with an eye-tracker calibration task; a nine-point calibration pattern was shown on the screen to allow the eye-tracker to recognise where the person was looking. After calibration, participants were shown a stylised tree image for five seconds. This step aimed to familiarise all participants with a stylised image while also distracting them before being shown the bottle silhouettes. Finally, data collection began, with the participants focusing first on one bottle design and then on the second. The viewing order of the two bottle designs was randomised.
For each bottle design in the first experiment, the participants were presented with the silhouettes of the bottle in three different orientations (vertical, horizontal left and horizontal right). Each orientation was shown in a random order according to a Complete counterbalancing for three stimuli [40] to address the sequence effect issue, ensuring that every possible sequence appeared at least once [48]. An exposure time of seven seconds for each image was determined after a pilot test to avoid bias in the resulting time metrics. Each participant observed the bottle in all orientations. The participants were asked to carefully examine each silhouette while the eye-tracking device recorded their fixations. When moving from one silhouette to the next, a random grey inter-slide was presented for five seconds to allow the pupil size to adjust to the same starting value.
After having viewed the various images, each participant was presented with a slide that simultaneously presented four images of the same bottle with the organic logo in a vertical orientation, randomly presented with a focus on different positions (neck, shoulder, body and heel). Participants were asked to select the location they perceived most suitable for the organic logo, according to their preference. Although the choice task provided a consistent setting to study the relevance of the bottle parts in driving the participants’ attention, the chosen location was not relevant for this study since the aim was to study the consumer’s visual attention when focusing on the individual bottles before performing the actual choice task. In other words, the relevant data collected for this second experiment consisted, once again, of eye-tracking data.
Then, participants repeated the two experimental steps with the second bottle type.

2.4. Data Collection and Analysis

The experiment took place at the Food Consumer Research Laboratory of the Marche Polytechnic University (Italy). A convenient sample of students and workers from the Marche Polytechnic University were recruited. All participants were over 18 years of age. The laboratory was equipped with Tobii X2-60 eye tracker compact edition and an LCD monitor with a resolution of 1920 × 1080 (1080P). The eye-tracker was placed unobtrusively below the computer screen on which stimuli were displayed to the participants. The IMotions® version 7.1 software was used for the design of the experiment, data collection and empirical analysis of eye tracking data.

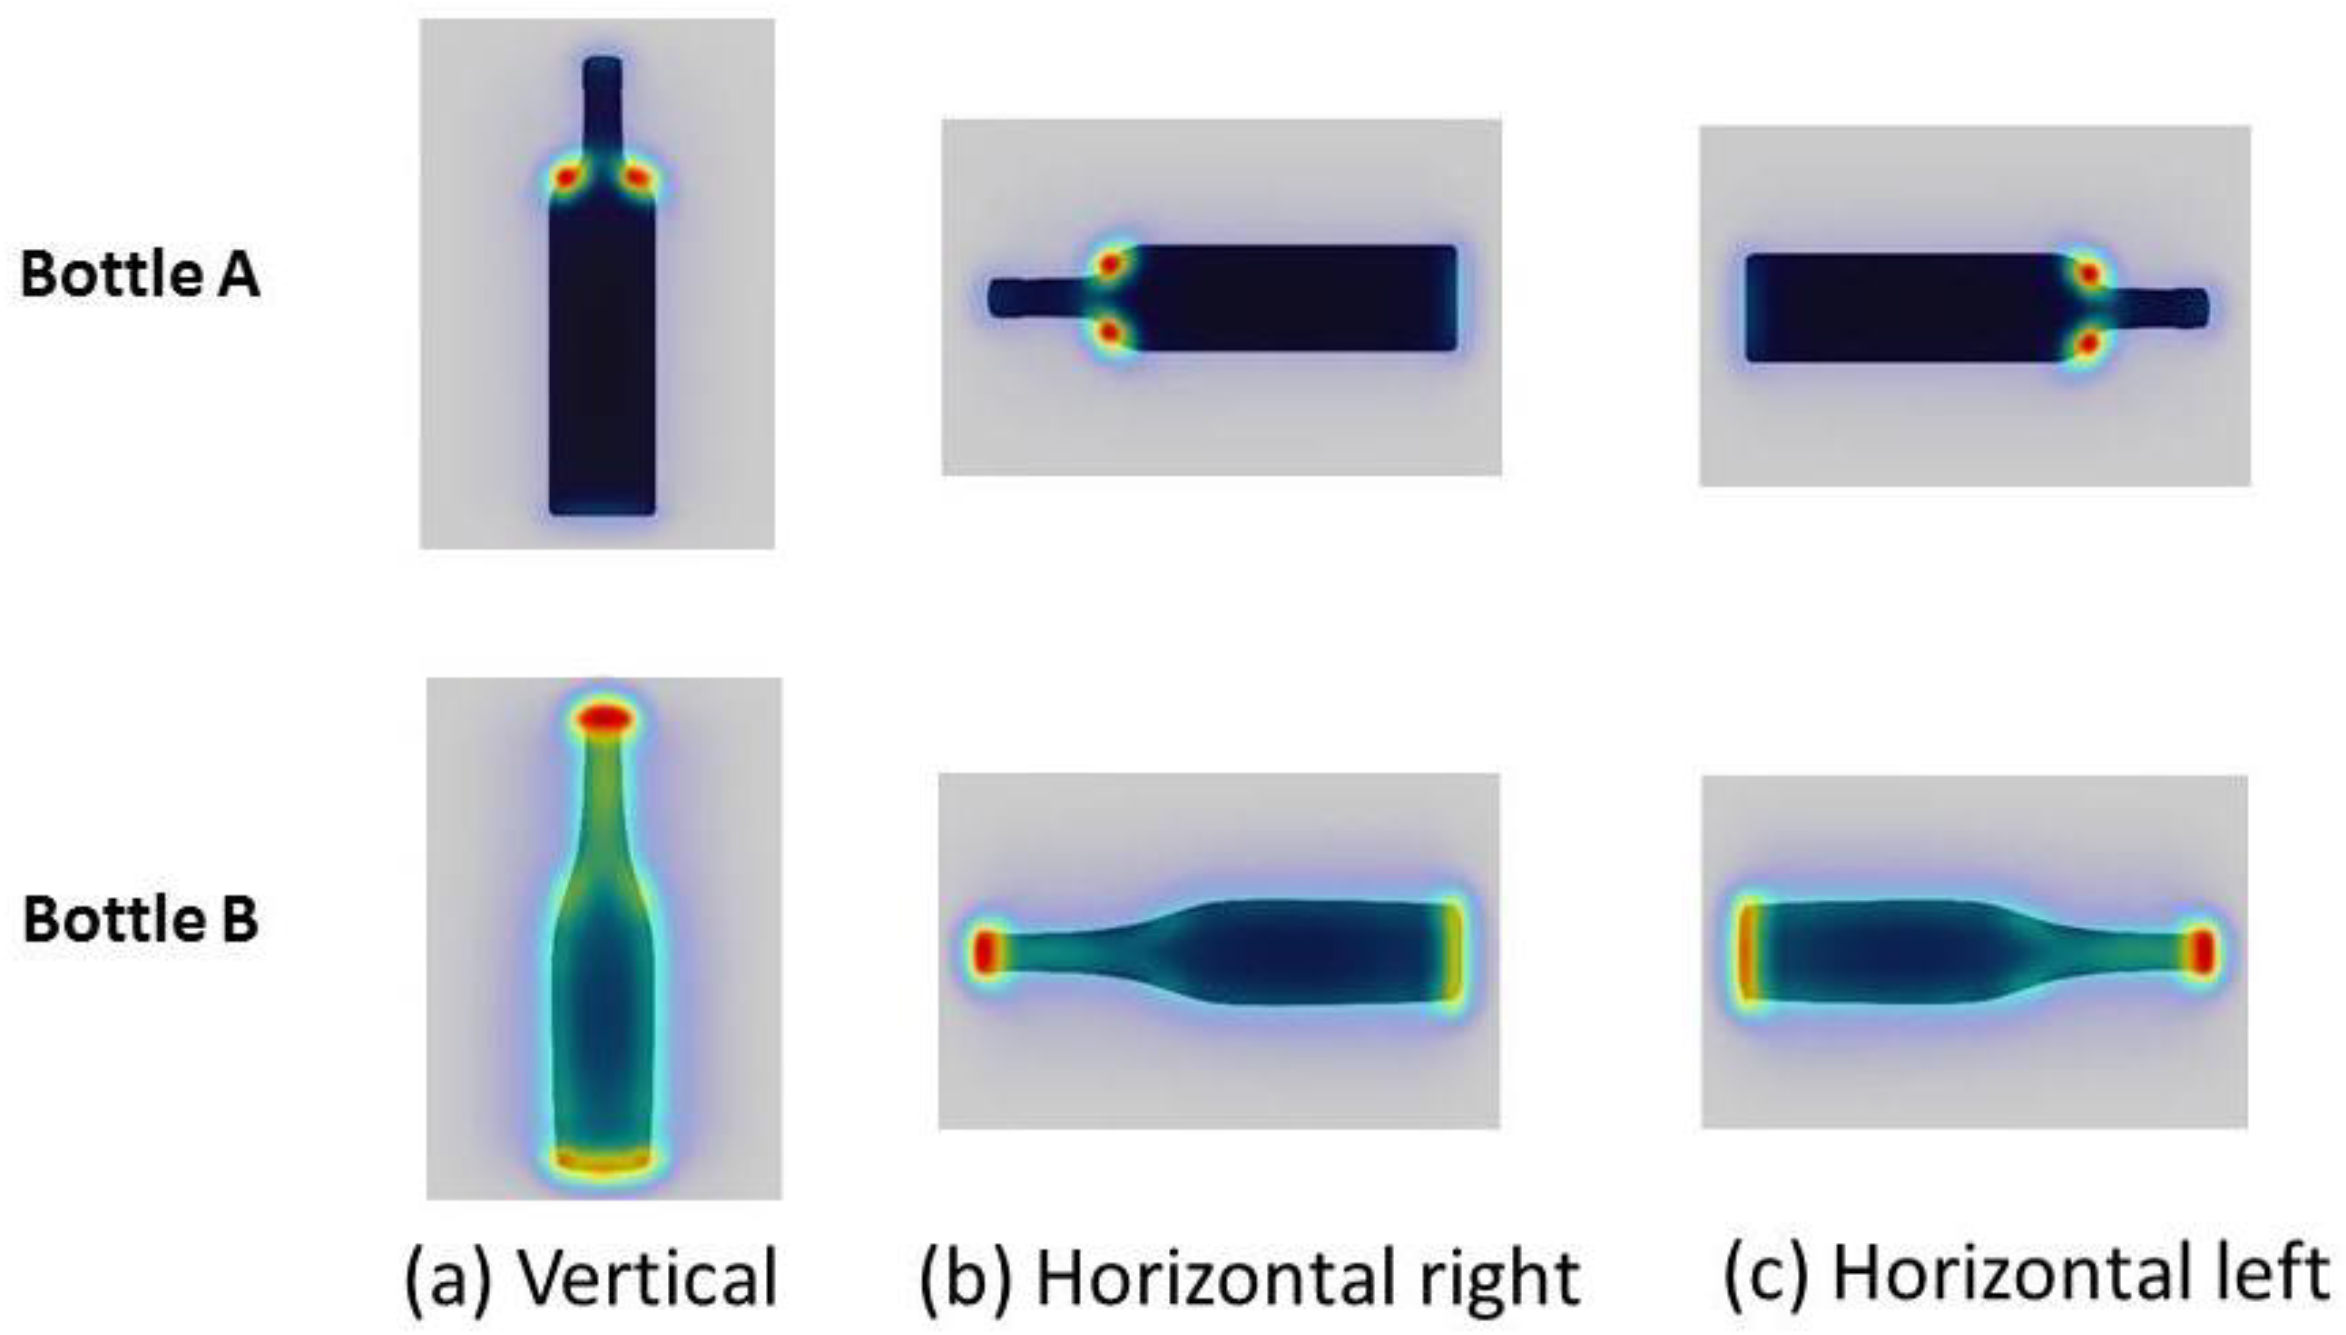
2.4.1. Saliency Controls

As a control analysis, the selected bottles’ salient parts were determined by creating their individual saliency maps. Saliency maps compute visually observable locations of a stimulus based on normal visual features that include brightness, colour, and motion. Matlab’s graph-based visual saliency model (GBVS) was used to create saliency maps of each bottle. The GBVS is a bottom-up saliency model; according to the literature, it is more accurate in predicting saliency maps than other models [49].

2.4.2. Eye Tracking Measures

Mueller and Lockshin [50] concluded that the importance of visual packaging could not be reliably measured using verbal methods. In this respect, eye-tracking technology has gained importance in exploring consumer choices by investigating which elements capture their visual attention. Consumers’ visual attention is distributed unconsciously, within seconds [51], tending to favour stimuli unconsciously perceived as being more attractive. The visual properties of stimuli (e.g., colour, darkness, brightness of food packaging) can impact consumers’ visual attention [52]. The effect of visual saliency as a precursor of attention in choice situations is well-established in literature: visually salient objects (e.g., labels) capture attention first, and are fixated on first and for a longer time [52,53,54,55]. However, greater attention does not automatically translate into choice [52,56,57]. Nevertheless, a visually salient spot is worth further exploitation from marketers by employing cognitively relevant or emotionally arousing stimuli [58].
The data collected with the eye-tracker were first mapped onto each stimulus of bottle silhouettes using heat maps. Heat maps are a colourful representation of how the participants look at the different parts of the stimulus. In the heat maps, the areas that attracted the highest attention are indicated in “red”, while those that attracted medium levels of attention are in “yellow”. “Green” indicates the areas that attracted the lowest attention.
Visual attention is associated with eye fixation and eye movements, and their combination is specific to each individual, indicating the individual’s visual attention level [59]. Visual fixation is the most commonly used parameter to determine where consumer attention might be focused [60]. Eye-tracking devices capture eye movements with a frequency of 60 Hz and −0.4° accuracy. Several different measures of eye movements can be obtained with eye tracking, such as the number and duration of fixations, the time spent on a fixation area, and the number of times the gaze returns to this area [61].
The present study focuses on two critical eye-tracking metrics: time to first fixation (TTFF) and time spent (TS). Both measures have been previously used in literature to measure consumers’ attention and interest [31,51]. The TTFF measures attention and noticeability [41]. It measures which AOI first attracted the participant’s attention. More precisely, it corresponds to the time a participant takes to fixate on a bottle or a bottle part for the first time. Therefore, a shorter TTFF time indicates that the participant fixation started sooner after the image appeared on the screen. A longer TTFF time indicates that the fixation occurred later or did not occur. In the latter case, the TTFF was equal to the maximum time spent on the screen.
On the other hand, TS quantifies the time participants have spent looking at a specific AOI. It represents the participant’s interest in the fixated object [40,51]. Higher TS indicates a higher interest from the participant in the fixated object.
Factorial repeated-measures ANOVA procedures were run to determine whether the bottle type (Bottle A vs. Bottle B), bottle parts (top vs. shoulder vs. centre vs. bottom), orientation (vertical vs. horizontal left vs. horizontal right), and interactions affected TTFF or TS. The Greenhouse–Geisser correction was implemented in cases where the sphericity criterion was not met [62,63,64]. Moreover, a two-way repeated-measures ANOVA procedure was also estimated to identify the effect of the bottle type and position of the logo within the bottle on consumers’ attention (TTFF) and interest (TS). STATA MP version 17 and R Version 4.2.2 [65,66] were used for the statistical analysis. Contrasts and margin estimations were also implemented for a more detailed analysis.

3. Results

Twenty-four participants were recruited for the study among university students and non-research staff, with an equal gender distribution. All participants were adults aged between 20 and 59 (the mean age was 30.25 years). The sample size was sufficient to detect at least a 20% difference between the different bottles and AOI within subjects [40]. The results from the study are presented in three sections. First, the saliency maps of the bottle stimuli obtained from the GBVS modelling are introduced. Then, heat maps obtained from eye tracking present a descriptive analysis of the participants’ preferences. Finally, the analysis of the AOI metrics obtained from eye-tracking measures is presented.

3.1. Saliency Maps Controls
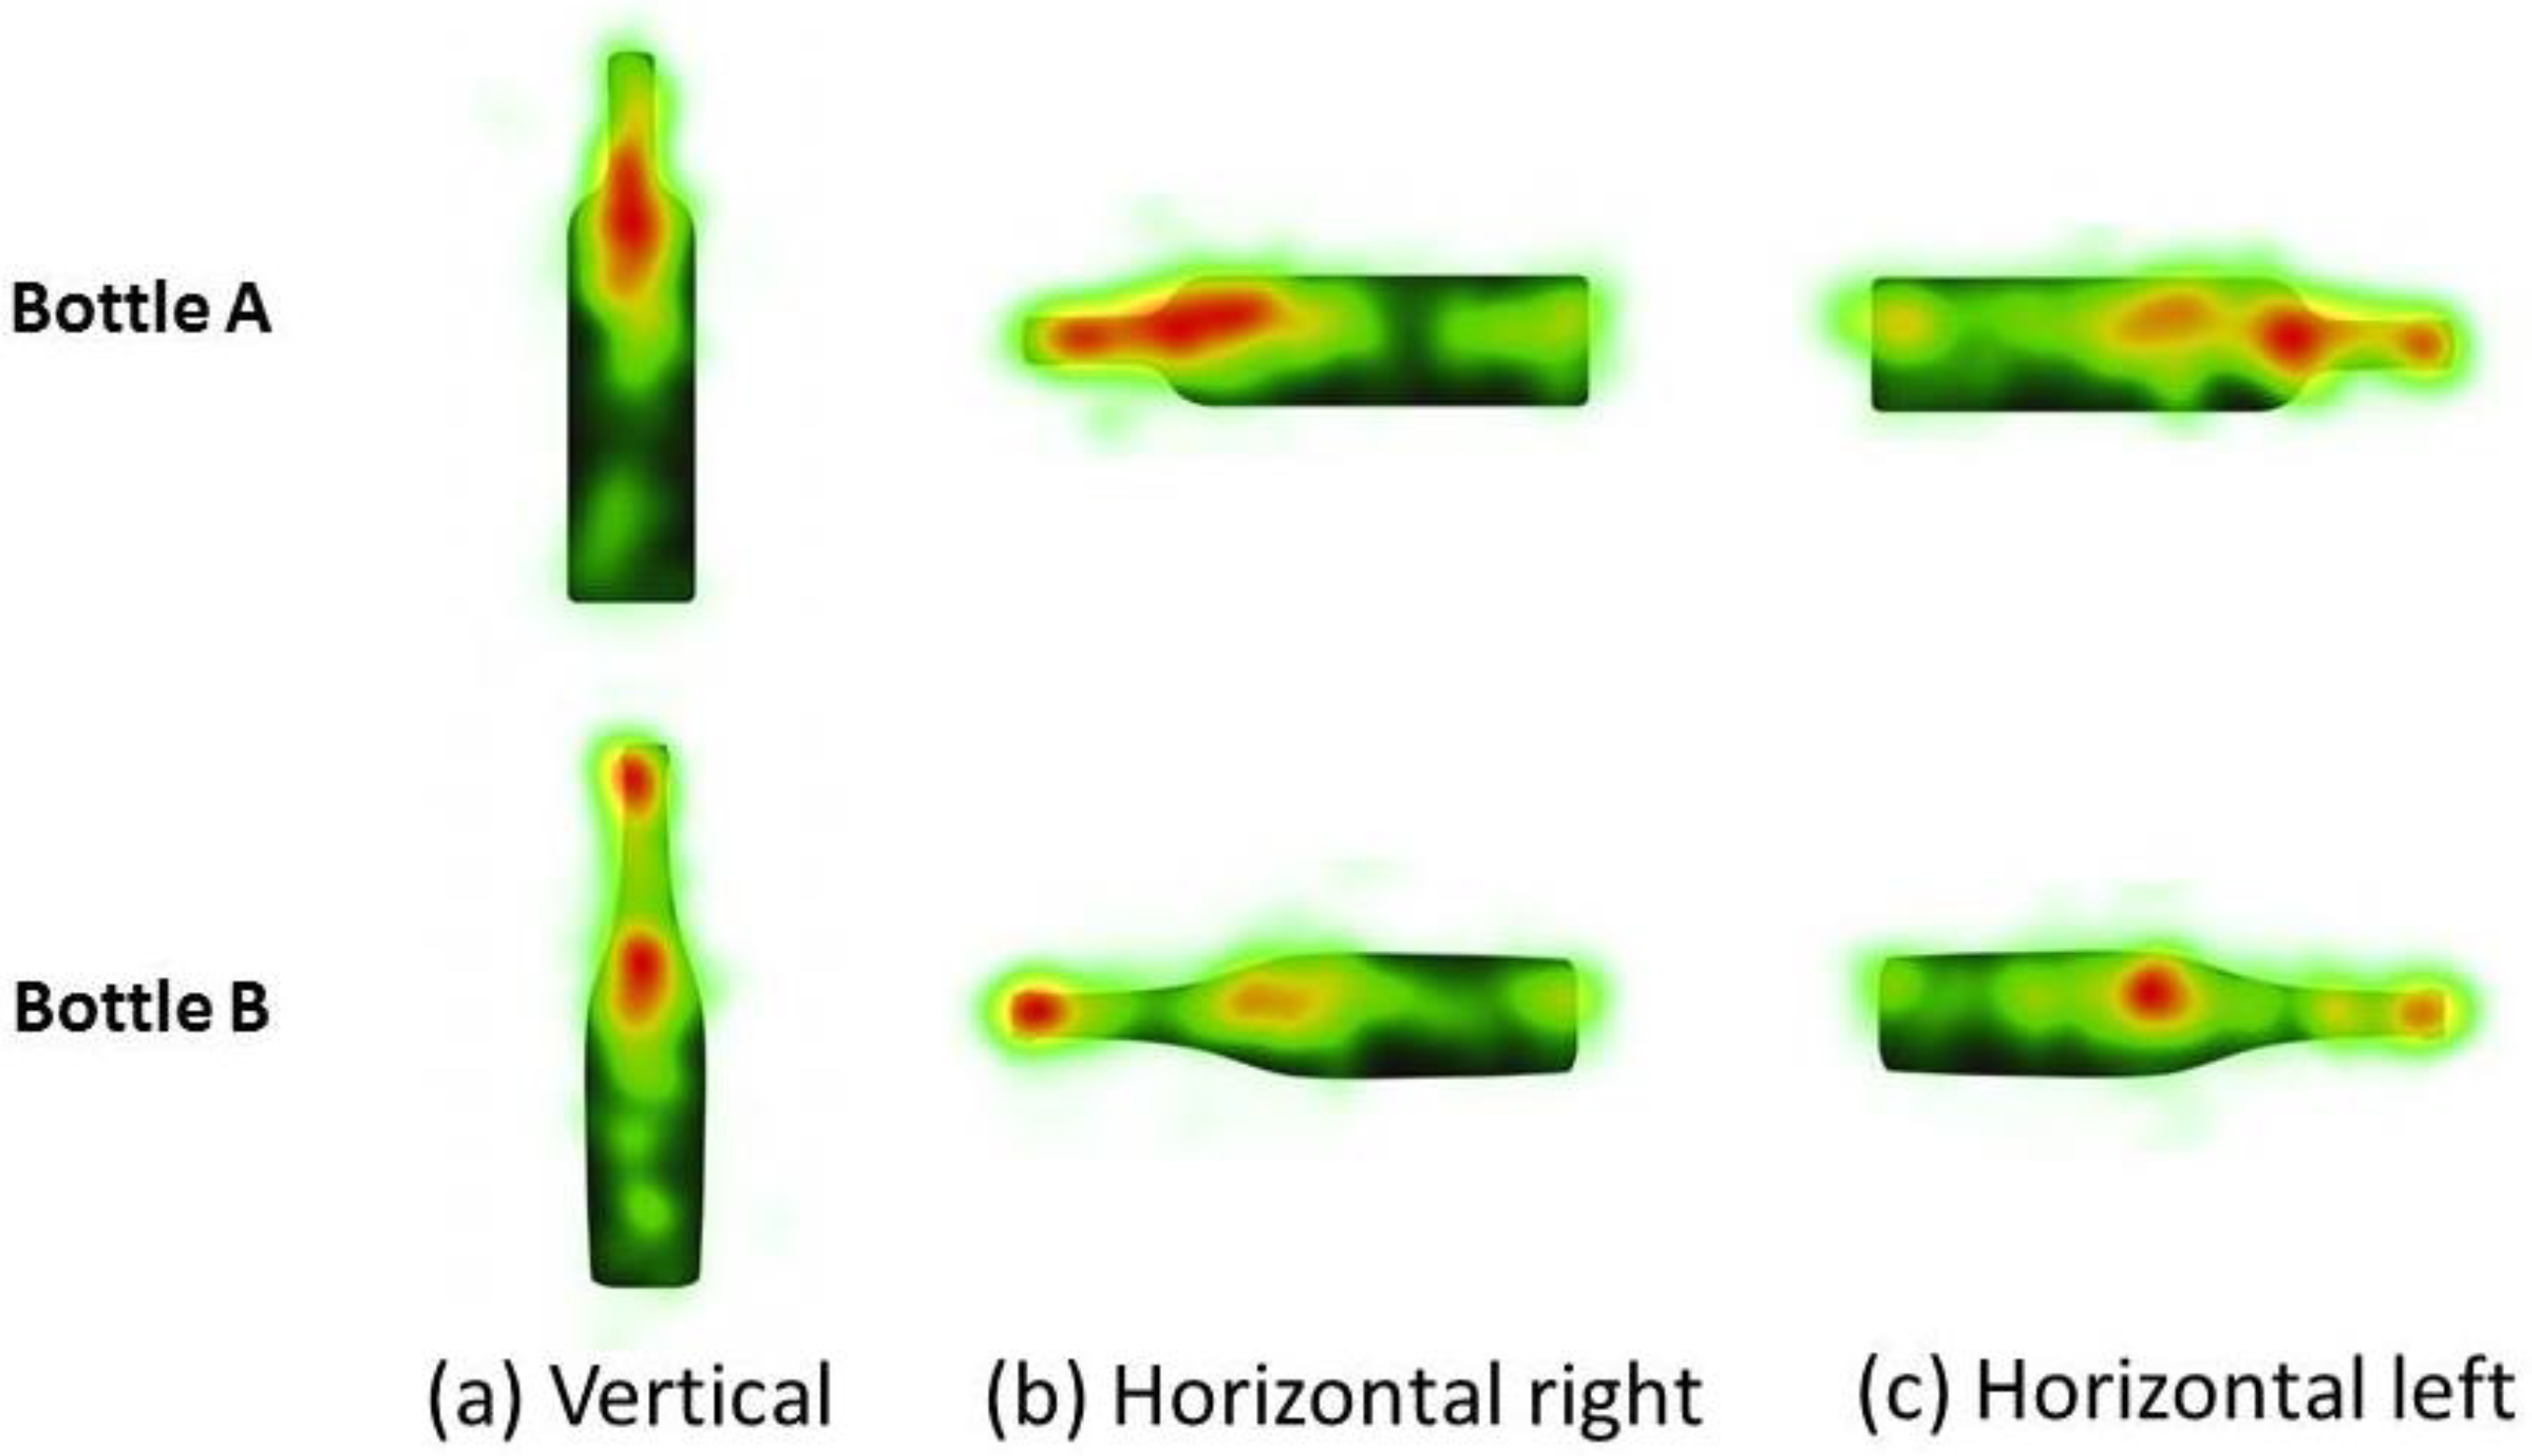
The (predicted) GBVS saliency maps of each stimulus are presented in Figure 5. The maps show how the most salient area for Bottle A refers to the shoulder, where the centre of the shoulder curve is shown in red. In the case of Bottle B, the saliency maps demonstrated that the most salient parts were mainly the top and the heel. However, in the vertical orientation, the neck and the shoulder curve also represented additional slightly salient parts in yellow.

3.2. Heat Maps

The heat maps show that the shoulders of the bottles were the most fixated upon areas regardless of the bottles’ orientation and type (Figure 6). However, Bottle A’s most fixated areas (red patches) are larger than Bottle B’s. Moreover, the second most fixated upon area in Bottle B was the top, regardless of the orientation. These results are consistent with the GBVS saliency maps.
When the silhouettes were presented in a horizontal orientation (both left and right), the heat maps showed that the top was also the second most fixated upon area for Bottle A. Moreover, the bottom of the bottles in a horizontal orientation also obtained the participants’ attention. The area that received the least attention in all orientations was the centre of the bottle.

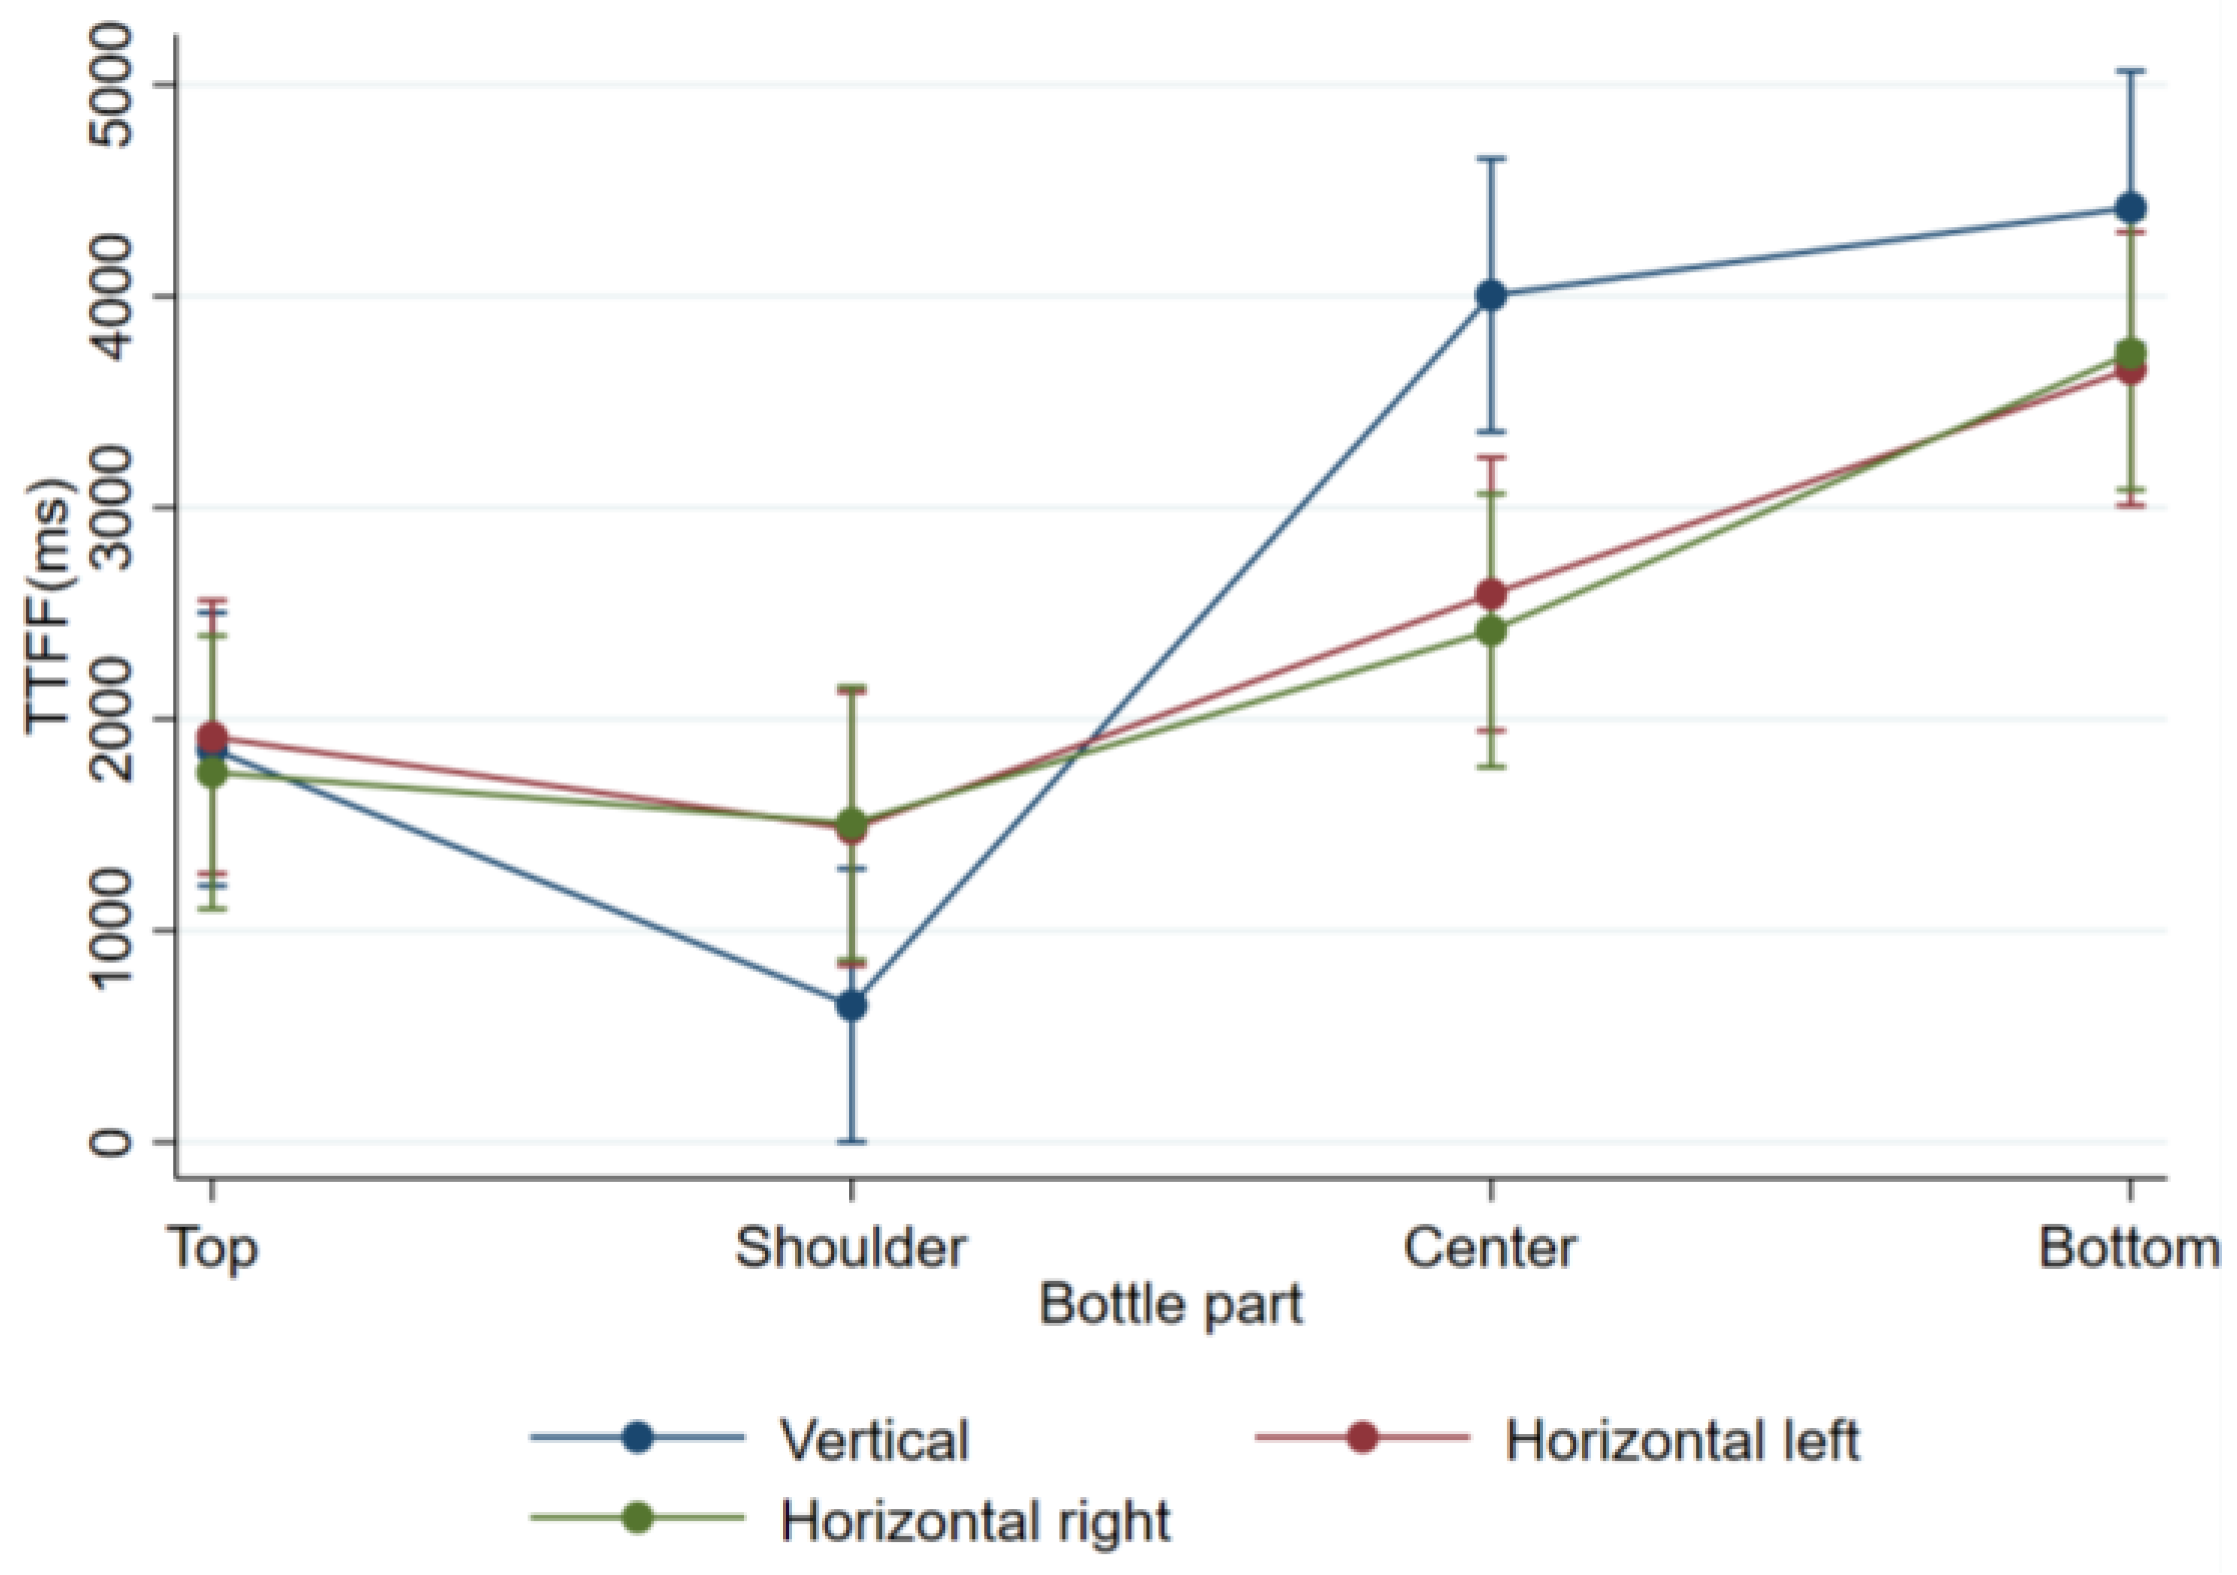
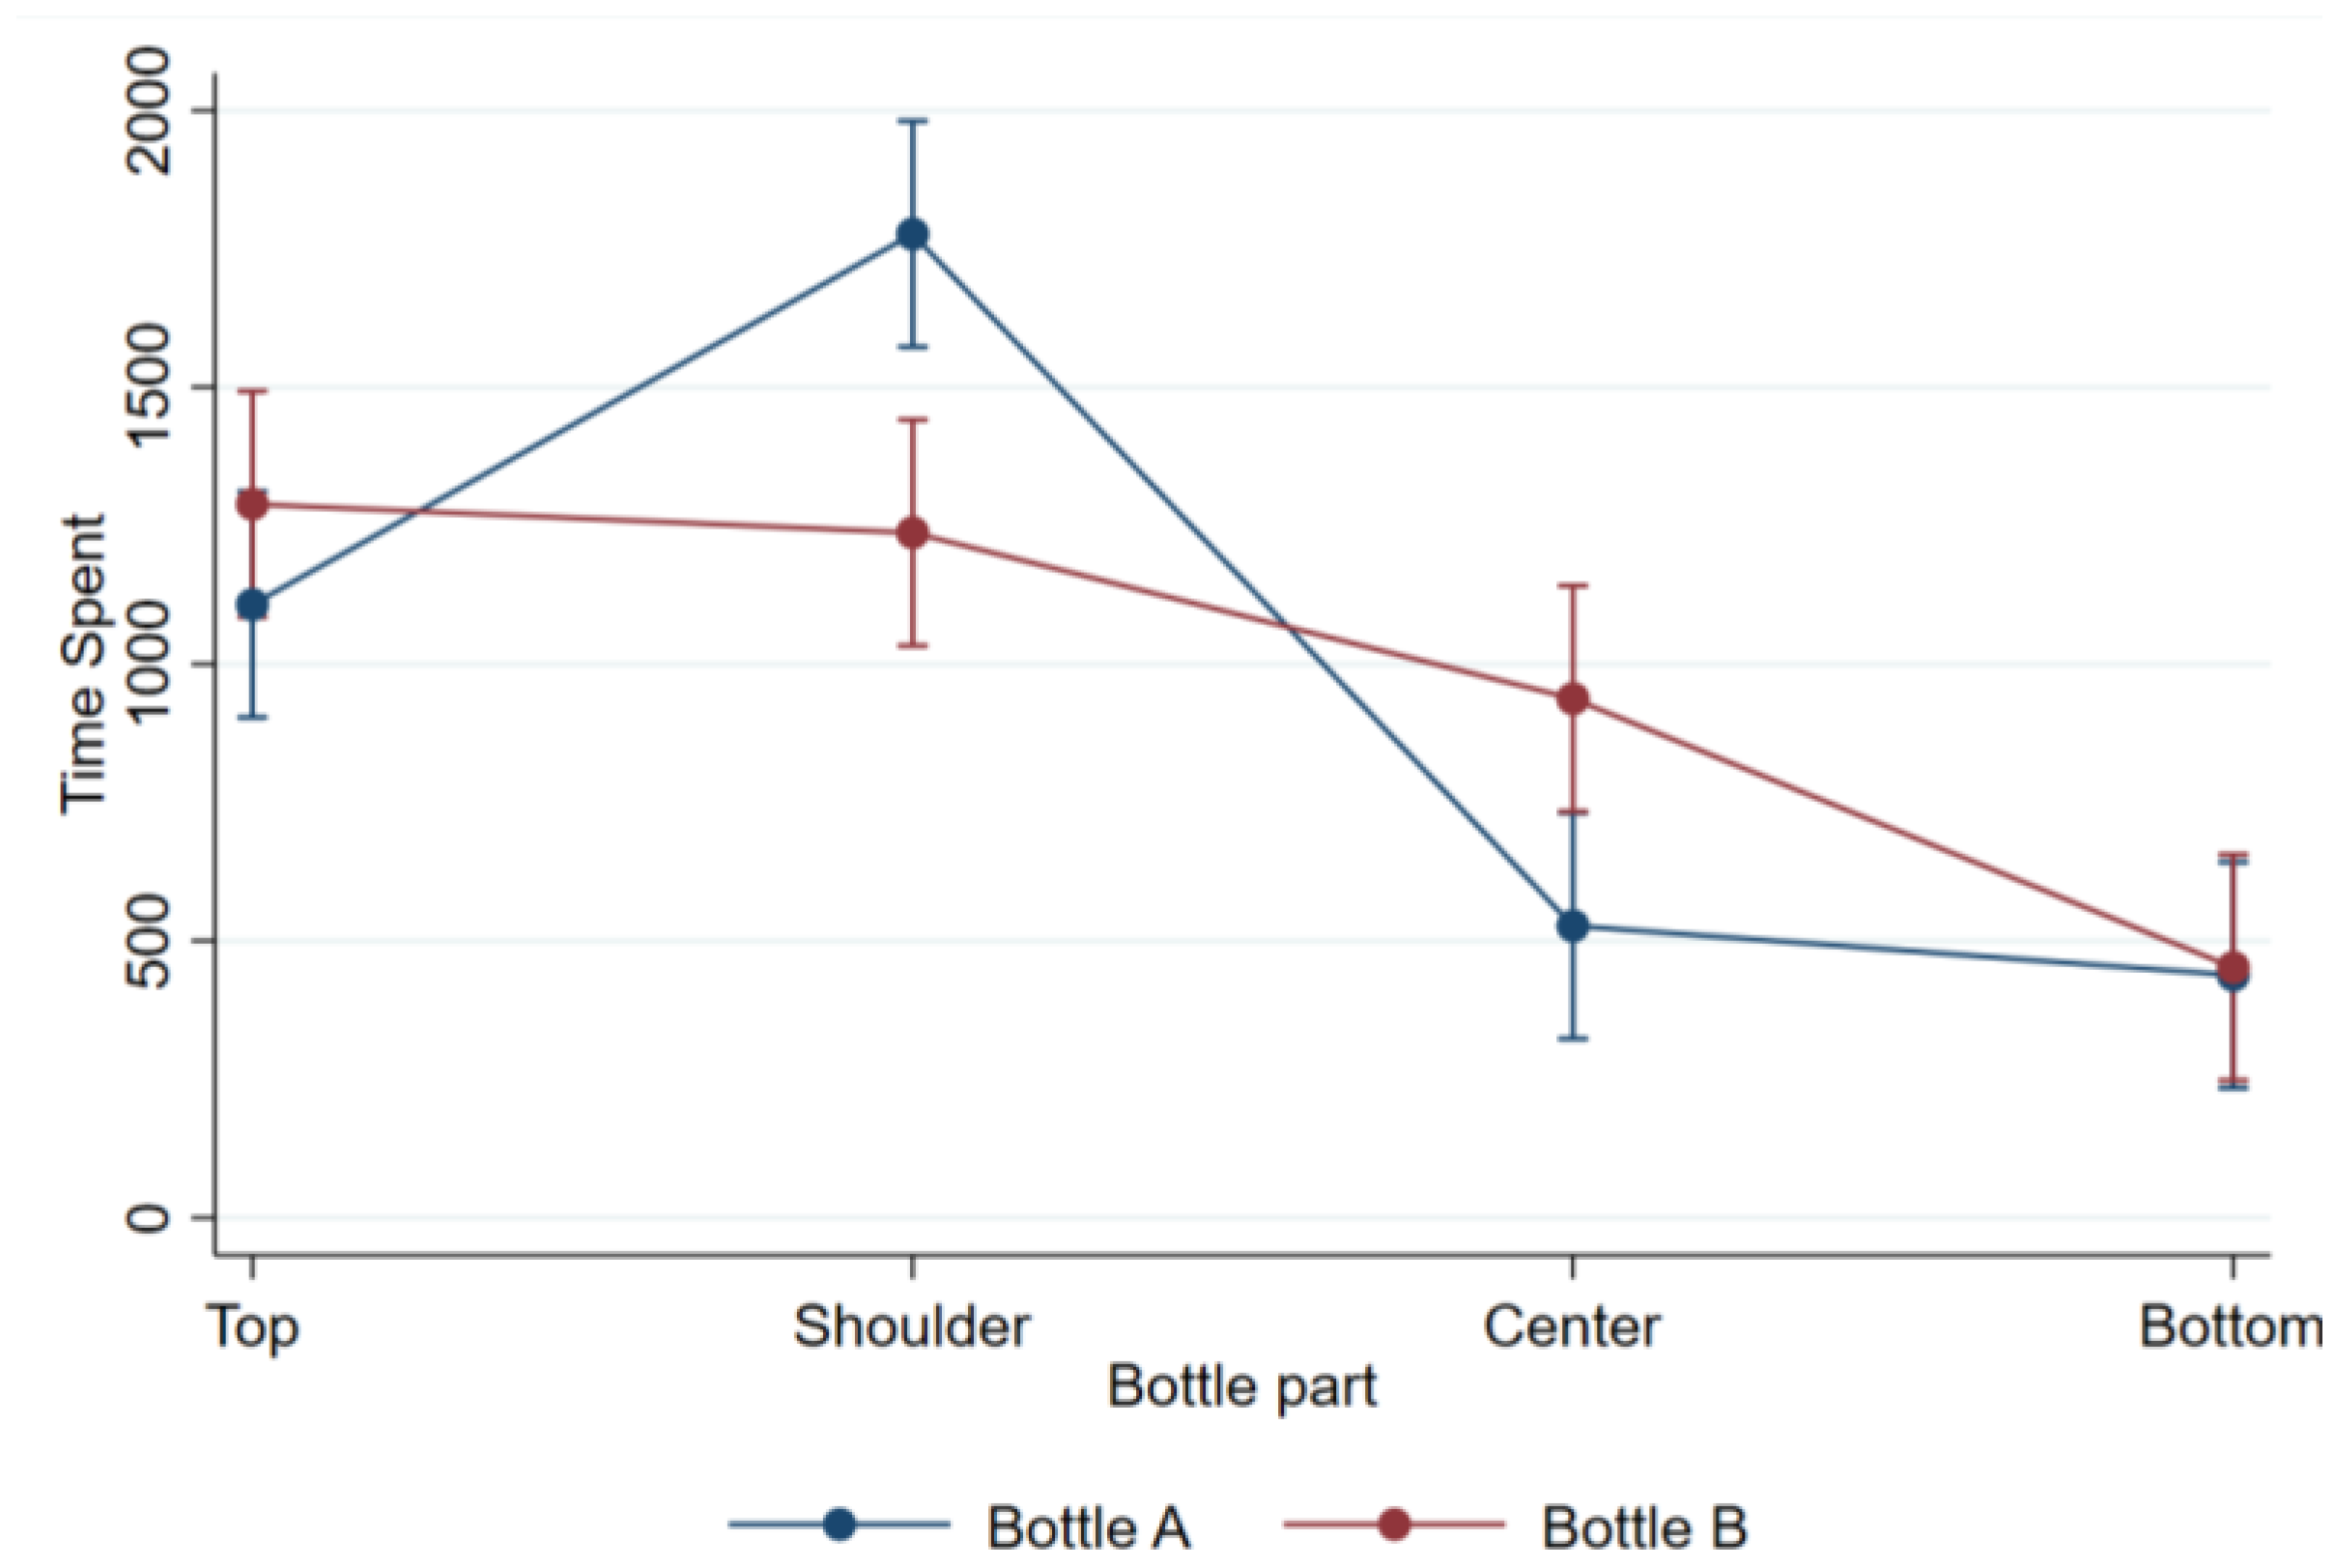
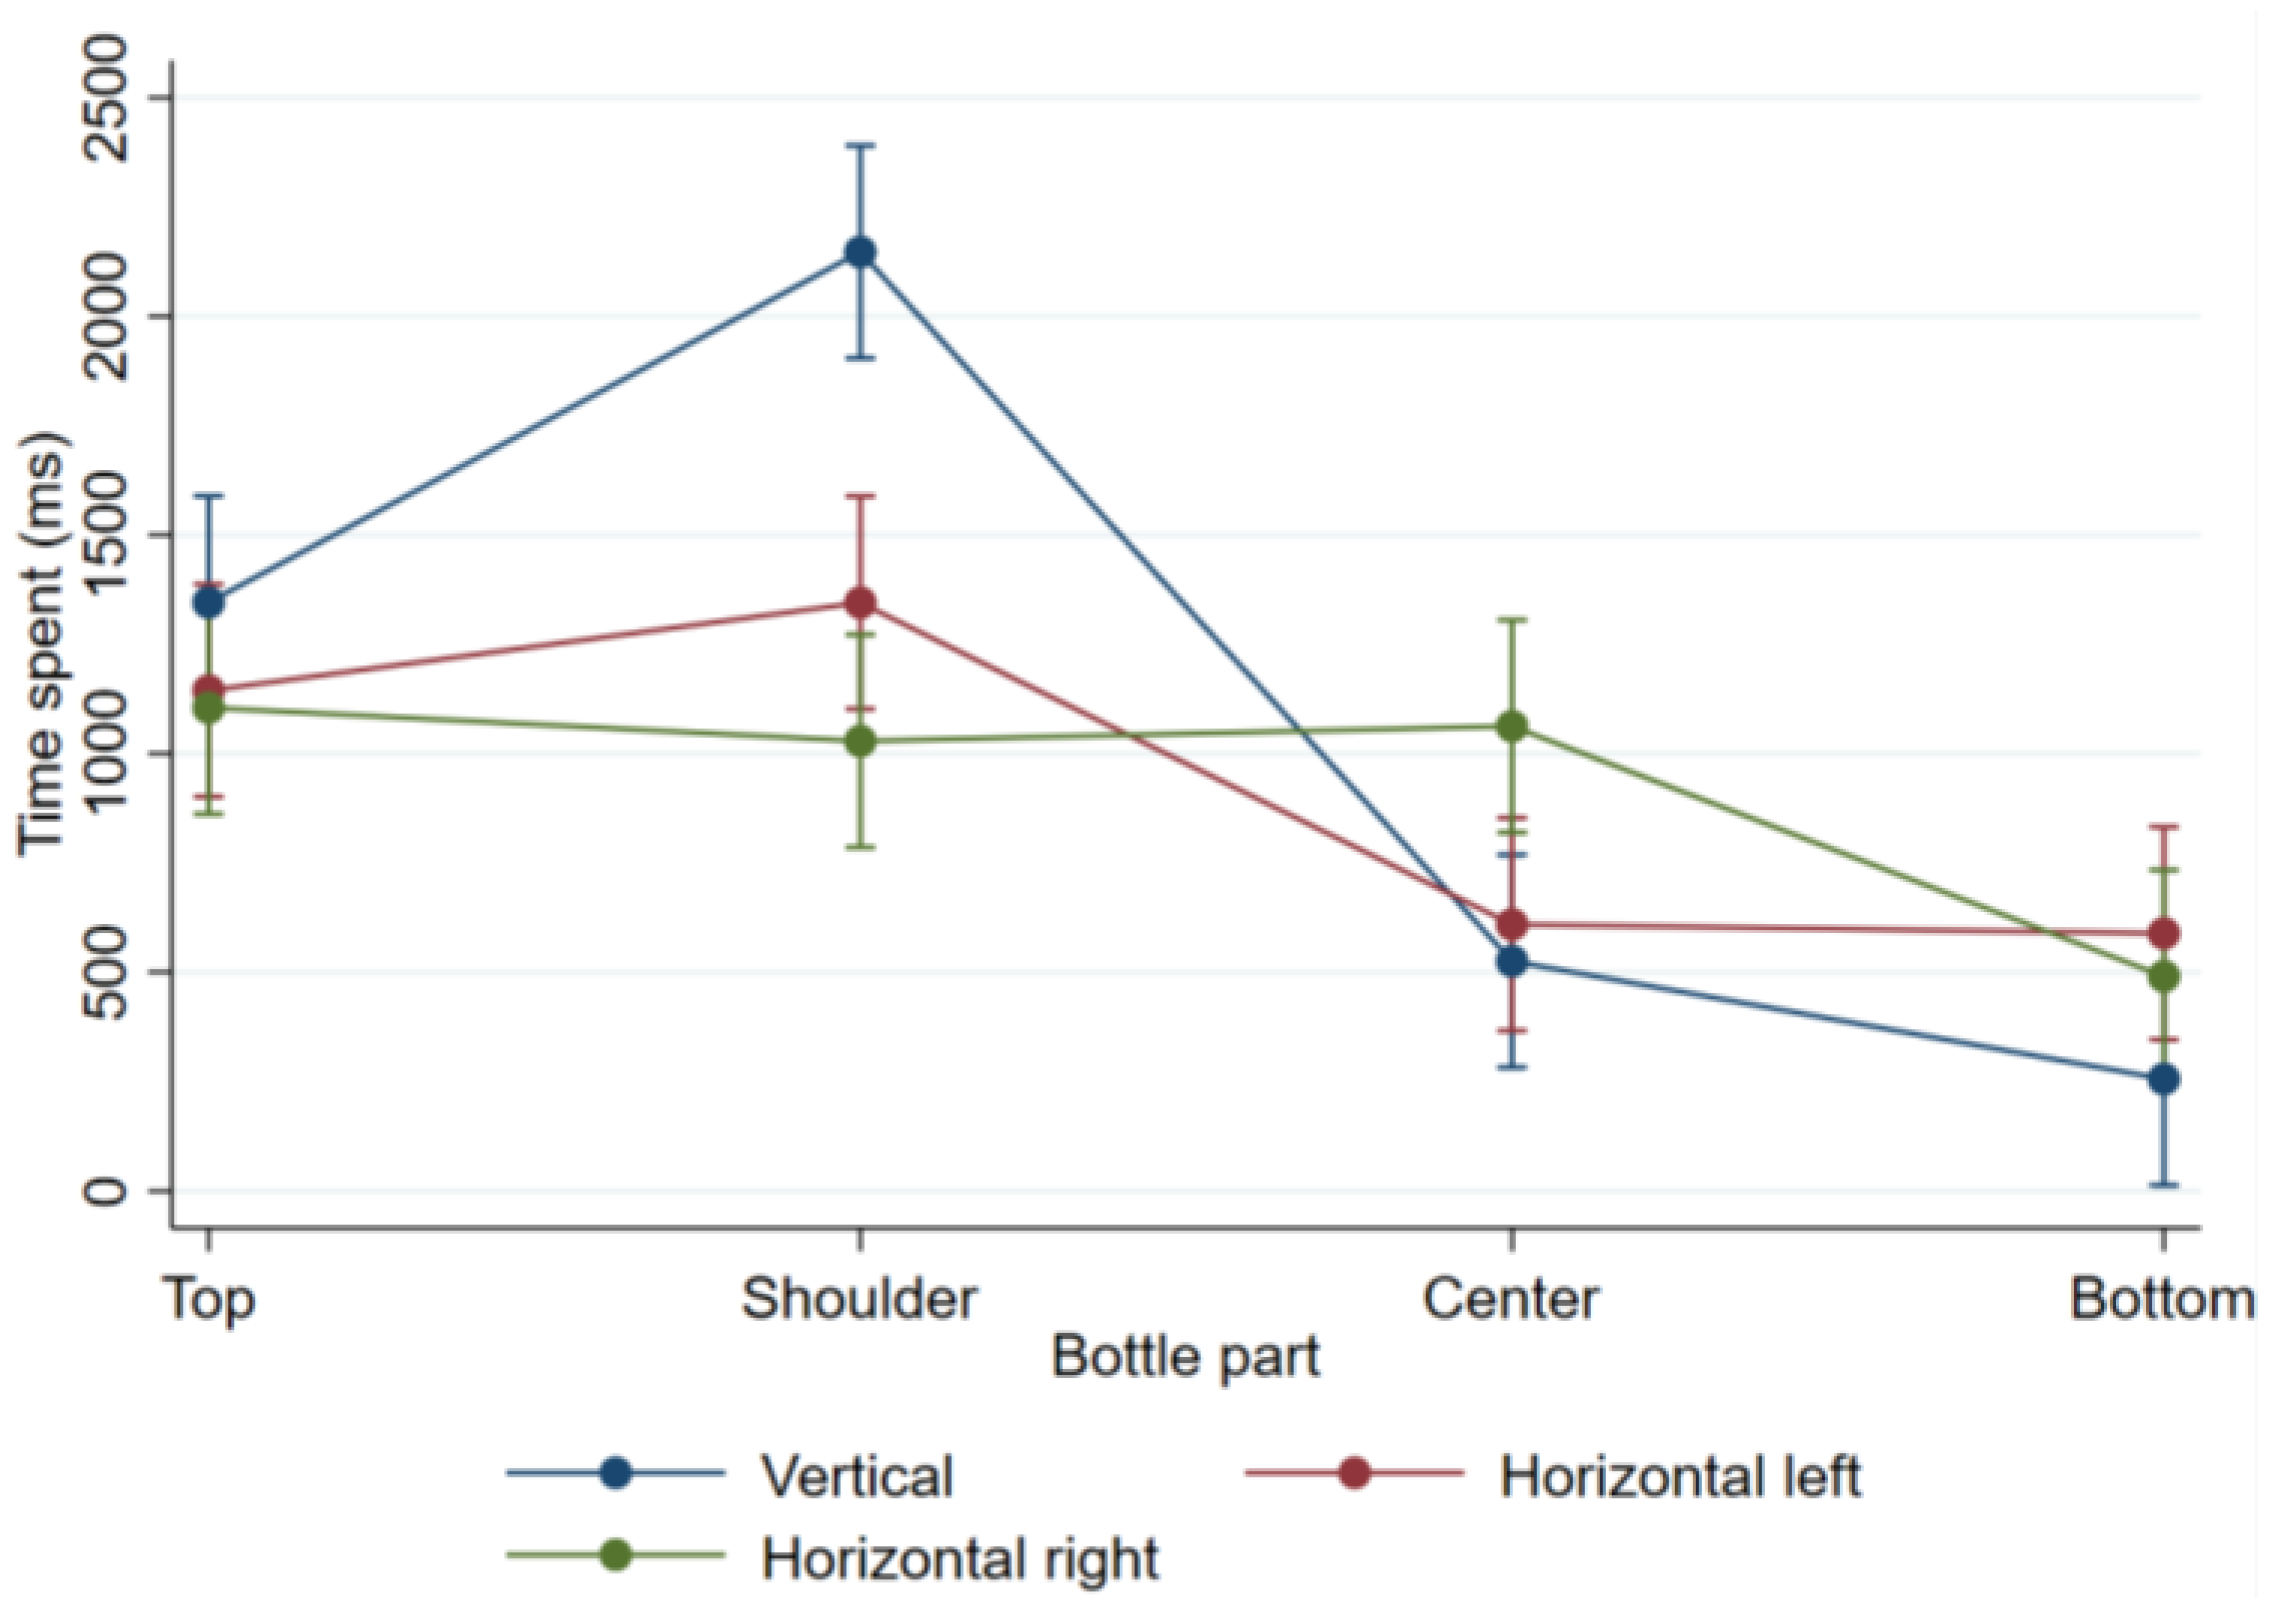
3.3. The Role of Bottle Type, Orientation and Bottle Parts

In terms of TTFF, in Bottle A, the shoulder area was the first point towards which respondents directed their attention, followed by the top. This was regardless of the orientation of the bottle. Participants also showed a higher interest (TS) in the same areas (shoulder and top). In the case of bottle B, only the bottles in vertical and horizontal left orientations generated the same visual attention in participants as bottle A (shoulders first, followed by top). However, the participants’ interest (TS) differed between the two orientations. Bottle B in the vertical orientation obtained the most interest in the shoulder area with longer TS, while the horizontal left orientation registered it on the top area.
On average, Bottle B in the horizontal right orientation obtained consumers’ visual attention in the top and the central areas. The time spent on each part was also among the highest, on average, compared to other bottle parts. Participants looked at the bottom area last. On average, more time was spent fixating on the shoulder area of the bottles than their top, centre and bottom. Detailed results are presented in Table 1.
The factorial repeated-measures ANOVA results showed no significant three-way interaction for TTFF [F(6, 529) = 1.24, p = 0.285]. However, the bottle type and bottle part interaction had a significant effect on TTFF [F(2.25, 0.75) = 5.06, p = 0.005 (with Greenhouse–Geisser adjustment)]. In specific, the centre area of the bottles presented a significantly different TTFF [F(1, 568) = 12.01, p = 0.001] between the bottle types. Although, on average, the participants followed the same fixation pattern for both bottles (first fixated on the shoulder area, followed by top, centre and bottom), the respondents turned their attention to the central area of the bottle faster for Bottle B than for Bottle A. Details can be observed in Figure 7.
The interaction of bottle parts and bottle orientation also significantly affected TTFF [F(6, 529) = 3.83, p = 0.001]. Although, on average, participants followed the same fixation pattern in all three orientations, significant differences were found for the shoulders and central areas between the different orientations. Specifically, the TTFF for the bottles’ shoulder area in the vertical orientation is about 834.88 ms lower than that in the horizontal left orientation (p = 0.047) and 860.85 ms lower than that in the horizontal right orientation (p = 0.041). This means that participants, on average, fixated sooner on the shoulder area when the bottle was placed in a vertical rather than a horizontal orientation.
Moreover, the TTFF for the bottles’ central area in the vertical orientation is approximately 1413.06 ms higher than for the horizontal left orientation (p = 0.001) and 1585 ms higher than for the horizontal right orientation (p < 0.000). In this case, participants fixated on the central part of the bottles oriented horizontally sooner than on the centre of the bottles oriented vertically. Graphical details are presented in Figure 8.
The bottle parts also had a significant main effect on TTFF [F(2.15, 0.7174) = 49.99, p < 0.0001 (with Greenhouse–Geisser adjustment)]. Significant effects on the TTFF were found between the different bottle parts [F(3, 572) = 39.80, p < 0.0001]. On average, participants fixated on the shoulder of the bottle 628.5 ms before fixating on the top (p = 0.021). Moreover, participants fixated their gaze on the centre of the bottle 1164.39 ms later than on the top (p < 0.0001) and 2094.56 ms later than on the bottom (p < 0.0001).
In the case of time spent, there was no three-way interaction [F(2.60, 0.4334) = 0.24, p = 0.8393 (with Greenhouse–Geisser adjustment)]. However, the interaction between bottle type and bottle part had a significant effect on the time participants spent fixating on the selected area [F(2.04, 0.6785) = 9.83, p = 0.0001 (with Greenhouse–Geisser adjustment)]. Specifically, there were significant differences between the time spent on the shoulder [F(1, 529) = 17.47, p < 0.0001] and central [F(1, 529) = 10.10, p = 0.002] areas. On average, participants spent 539.57 ms longer fixating their gaze on the shoulder of Bottle A than on that of Bottle B. Moreover, participants spent 410.25 ms less fixating on the centre of Bottle A than on the centre of Bottle B. A graphical representation is shown in Figure 9.
The interaction of bottle parts and bottle orientation was also significant for TS [F(4.46, 0.7436) = 11.55, p < 0.0001 (with Greenhouse–Geisser adjustment)]. Significant differences were found between the time spent on the shoulder [F(2, 529) = 26.59, p < 0.0001] and that spent on the centre [F(2, 529) = 6.68, p = 0.001]. Specifically, on average, the time spent on the shoulder of the bottle displayed in the vertical orientation was 801.96 ms higher than the time spent in the same bottle part of the bottle displayed in the horizontal left orientation (p < 0.0001) and 1118.31 ms higher than the time spent in the same bottle part of the bottle displayed in the horizontal right orientation (p < 0.0001).
In the case of the centre of the bottles, there was a significant difference only between the bottles displayed in a vertical orientation and those displayed in a horizontal right orientation (p = 0.001). However, on average, participants spent significantly more time fixating on the shoulder area of bottles in vertical orientations than on that of those in horizontal positions [F(2, 115) = 12.89, p < 0.0001]. Graphic details are presented in Figure 10.
The different parts of the bottles also had a significant effect on the time participants spent fixating on them [F(2.20, 0.7343) = 53.79, p < 0.0001 (with Greenhouse–Geisser adjustment)]. Significant differences were found between the bottle parts [F(3, 572) = 40.20, p < 0.0001]. On average, participants fixated 308.81 ms longer on the shoulder of the bottle than on the top (p = 0.004). Moreover, participants fixated on the centre and the bottom of the bottle, 465.79 ms (p < 0.0001) and 753.01 ms (p < 0.0001), respectively, less than on the top of the bottle.

3.4. The Labelling Effect

When incorporating the label with the organic logo into the vertical bottle silhouettes, there were significant differences in the TTFF for bottle parts with the logo [F(3, 161) = 2.91, p = 0.036]. Specifically, there are significant differences in the TTFF between the shoulder area and the central [F(1, 161) = 4.15, p = 0.043] and bottom parts [F(1, 161) = 8.12, p = 0.005]. On average, participants fixated on the centre and bottom of the bottle 1952.29 ms and 2731.40 ms later, respectively. Regarding the time spent, there were no significant differences according to bottle type [F(1, 161) = 0.90, p = 0.345], part [F(3, 161) = 2.45, p = 0.065] or their interaction [F(3, 161) = 1.53, p = 0.208].
The participants’ choice as regards the best bottle part to position the logo was different from the bottle parts they fixated on first or spent more time on. For Bottle A, the preferred location for the logo was the bottom (41.7% of participants), while for Bottle B, it was the central part (33.3%) and the shoulder (29.2%). These choices were also different from the bottles’ most salient areas.

4. Discussion

The present study investigates the role of the morphology and anatomy of wine bottles on consumers’ visual attention in a digital context to identify the most prominent bottle parts for labelling in different types of bottles in diverse orientations. Two within-subjects experimental designs, in combination with an eye-tracking device, were implemented to address the main aim. This experimental design helped avoid automatic biases mentioned in previous studies [42].
The combined fixation data of the participants showed that the participants’ attention was initially attracted by the shoulders of the bottles, followed by the tops, the centres and then the bottoms. This pattern was consistent for the bottles and the different orientations in which they were displayed. The different visual saliency of the bottle parts can be the main reason behind these findings. Indeed, the shoulder represents the most relevant shape and salient part in characterising the anatomies of Bottle A and Bottle B (to a lesser degree), as confirmed by the bottle GBVS saliency maps. This is in line with previous research that has concluded that objects with higher saliency are more likely to be fixated on than less salient ones [67,68,69,70,71].
Although there was no significant effect of the type of bottle on the participants’ attention and interest, there was a significant effect of the interaction of the type of bottle and the bottle part. In the case of Bottle A, which had a shorter shoulder with sharply cut lines, participants fixated on this area first and spent more time looking at it. In bottle B, which had a softer, smoother shoulder, participants also focused on this area but spent less time on it and instead spent more time fixating on the centre of Bottle B than on that of Bottle A. This finding may be ascribed to the fact that Bottle A has a more pronounced curve in the anatomy of the shoulder, which would be consistent with previous work showing a preference for curved objects with more sides [29,72]. These results suggest that the shoulder area is the best part to focus consumers’ visual attention and interest in digital contexts, regardless of the bottle type. However, this is particularly true for bottles with a similar morphology to that of Bottle A.
There was no significant effect on participants’ attention or interest according to the bottles’ orientation, which is consistent with the results of previous literature [28]. However, there was a significant interaction between the bottles’ orientation and part. Participants fixated first and spent more time on the shoulder area of the bottles in a vertical orientation than on those in a horizontal one, highlighting a possible upper attention bias [73]. However, participants moved their visual attention to the central area more quickly when the bottles were displayed in a horizontal orientation as opposed to when displayed vertically. Such behaviour is consistent with the Western reading habit from left to right, resulting in a higher sensitivity to visual elements on the right field [74]. Therefore, when displayed horizontally, participants would move from one part of the bottle to another more quickly. Wine producers and marketers, when selling online, should consider displaying the bottles in an orientation that motivates consumers’ interest and attention to the area in which key information is displayed. For example, if the most determinant labels are displayed at the shoulder of the bottle, the bottle should be presented in a vertical orientation in the online shop.
Adding the organic logos to the bottles’ silhouettes provided results for visual attention that were consistent with those obtained from the analysis without the logos. Participants still focused their visual attention first on the logos on the shoulder area and top, followed by those on the centre and bottom. This confirms the importance of the bottles’ anatomy and morphology, as visual attention behaviour was similar in both cases, with and without a logo. Moreover, it stresses the fact that the shoulder of the bottle is critical in obtaining consumers’ visual attention. There were no significant differences in the time spent on the logos placed on different parts of the bottles. Since the logo was the same, the participants did not require additional processing efforts to understand the logo, regardless of its location.
Concerning the choice of the best location for the organic logo, the results differed between the two types of bottles. While the bottom area was preferred for Bottle A, the centre and shoulder areas were preferred for Bottle B. The selection of these areas was incompatible with the saliency maps or the areas that obtained consumers’ visual attention or interest. Although the result might seem surprising initially, previous research has already concluded that greater attention only sometimes translates automatically into choice [52,56,57]. Moreover, top–down factors such as consumer involvement, personal goals, previous knowledge, and familiarity might affect participants’ choices [54,75,76]. As these aspects were not included in the study, future research should explore the effect of top–down factors on consumers’ choices and weight compared to the characteristics of the stimuli.
These visual attention results can assist in designing wine bottles sold in digital contexts. The present work contributes to the scarce literature on bottle design [19,21] as well as, from a general perspective, on online wine markets [3,10,36,77]. Based on the results of the study, the shoulder area of the bottle receives greater attention from the viewer and is, therefore, potentially relevant as an influence on consumer choice. If these findings can be confirmed in a larger sample, the shoulder areas of bottles can be used to convey important messages about the product the bottles contain. Producers of wine could benefit from placing important certification logos or information in this area to obtain consumers’ attention in online contexts.

5. Conclusions

The results of this eye-tracking study provide marketers and beverage companies with food for thought as regards optimising their bottles’ design. Understanding the role of bottle morphology and anatomy in capturing consumer attention and interest when the wine is sold online might allow them to capture consumer attention and interest better, as the bottle is an intrinsic part of the consumer’s first impression of the wine. The results of this study suggest that the different parts that make up the anatomy of a bottle are not equally relevant and that in the labelling and packaging of wine, much more attention should be devoted to the shoulder. Given the small sample size in laboratory conditions, the results of this study need to be confirmed through further research with bigger samples in real-life settings, as well as in other national contexts. Additionally, other studies can further explore the role of other elements (e.g., label colour and content, bottle colours, etc.) in capturing attention and interest and not just in expectations or associations [78,79]. A final caveat is that this study refers to visual stimuli adapted to wine e-commerce and further eye-tracking studies are suggested in a brick-and-mortar supermarket-shelf environment.

Author Contributions

This study was based on the collective effort of the authors. Conceptualisation, E.O. and R.Z.; Data curation, E.O., B.K. and E.C.D.; Investigation, E.O.; Methodology, E.O. and R.Z.; Supervision, R.Z.; Validation, B.K., E.C.D. and S.N.; Writing—original draft, E.O.; Writing—review and editing, B.K., E.C.D., S.N., F.S. and R.Z. All authors have read and agreed to the published version of the manuscript.

Funding

This research received no external funding.

Data Availability Statement

The dataset is published and accessible at: Ozturk, Emel; Cubero Dudinskaya, Emilia; Kilic, Busra; Mandolesi, Serena; Solfanelli, Francesco; naspetti, simona; Zanoli, Raffaele (2023), “Data for: Ozturk et al. Does the shape and structure of wine bottles influence consumer attention online? An eye-tracking study”, Mendeley Data, V2, doi: 10.17632/mhm6zgcsc9.2.

Conflicts of Interest
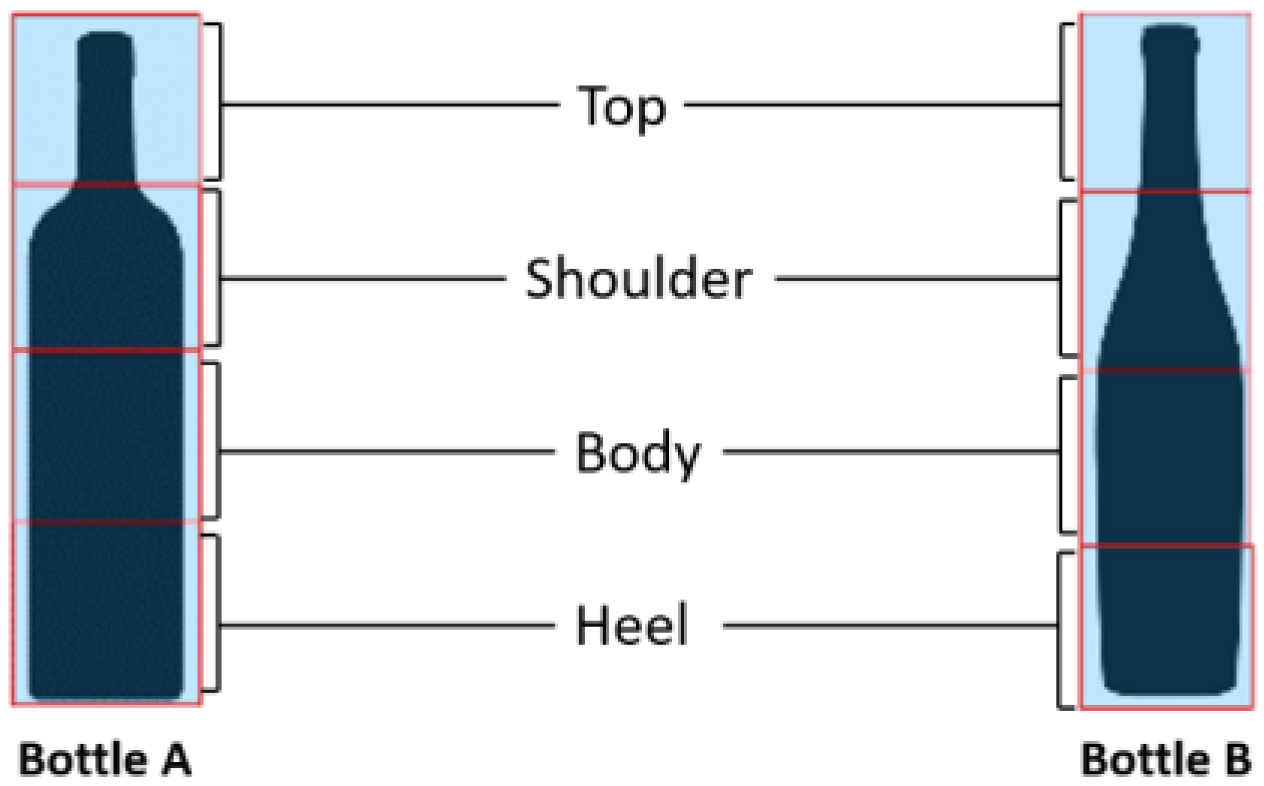
The authors declare no conflict of interest.

Note

1
For the purpose of this study we refer to ‘morphology’ in relation to the overall bottle shape, while by ‘anatomy’ we refer to the shape of the various bottle’s parts. Both morphology and anatomy are elements of the bottle’s design.

References

  1. Eurostat Online Shopping Ever More Popular. Available online: https://ec.europa.eu/eurostat/web/products-eurostat-news/-/ddn-20220202-1 (accessed on 2 December 2022).
  2. Eurostat E-Commerce Statistics for Individuals. Available online: https://ec.europa.eu/eurostat/statistics-explained/index.php?title=E-commerce_statistics_for_individuals (accessed on 2 December 2022).
  3. Jorge, O.; Pons, A.; Rius, J.; Vintr, C. Increasing Online Shop Revenues with Web Scraping: A Case Study for the Wine Sector. Br. Food J. 2020, 122, 3383–3401. [Google Scholar] [CrossRef]
  4. Mastroberardino, P.; Calabrese, G.; Cortese, F.; Petracca, M. Social Commerce in the Wine Sector: An Exploratory Research Study of the Italian Market. Sustainability 2022, 14, 2024. [Google Scholar] [CrossRef]
  5. IWSR Key Trends Driving the Global Beverage Alcohol Industry in 2022. Available online: https://www.theiwsr.com/key-trends-driving-the-global-beverage-alcohol-industry-in-2022/ (accessed on 2 December 2022).
  6. Coppola, D. Wine E-Commerce in Italy—Statistics & Facts. Available online: https://www.statista.com/topics/9934/wine-e-commerce-in-italy/#topicOverview (accessed on 2 December 2022).
  7. Higgins, L.M.; Wolf, M.M.; Bitter, R.; Amspacher, W. Winery Distribution Choices and the Online Wine Buyer. J. Food Distrib. Res. 2015, 46, 1–18. [Google Scholar] [CrossRef]
  8. Limayem, M.; Khalifa, M.; Frini, A. What Makes Consumers Buy from Internet? A Longitudinal Study of Online Shopping. IEEE Trans. Syst. Man Cybern. Part A Syst. Hum. 2000, 30, 421–432. [Google Scholar] [CrossRef]
  9. Gómez-Carmona, D.; Cruces-Montes, S.; Marín-Dueñas, P.P.; Serrano-Domínguez, C.; Paramio, A.; García, A.Z. Do You See It Clearly? The Effect of Packaging and Label Format on Google Ads. J. Theor. Appl. Electron. Commer. Res. 2021, 16, 1648–1666. [Google Scholar] [CrossRef]
  10. Cobelli, N.; Wilkinson, G.; Program, V.; Supagro, M. Online Wine Purchasing: A Comparison between South Africa and Italy. TQM J. 2020, 32, 837–847. [Google Scholar] [CrossRef]
  11. Barber, N.; Almanza, B.A.; Donovan, J.R. Motivational Factors of Gender, Income and Age on Selecting a Bottle of Wine. Int. J. Wine Mark. 2006, 18, 218–232. [Google Scholar] [CrossRef]
  12. Ares, G.; Mawad, F.; Giménez, A.; Maiche, A. Influence of Rational and Intuitive Thinking Styles on Food Choice: Preliminary Evidence from an Eye-Tracking Study with Yogurt Labels. Food Qual. Prefer. 2014, 31, 28–37. [Google Scholar] [CrossRef]
  13. Thompson-Witrick, K.A.; Pitts, E.R.; Nemenyi, J.L.; Budner, D. The Impact Packaging Type Has on the Flavor of Wine. Beverages 2021, 7, 36. [Google Scholar] [CrossRef]
  14. Mueller, S.; Lockshin, L.; Saltman, Y.; Blanford, J. Message on a Bottle: The Relative Influence of Wine Back Label Information on Wine Choice. Food Qual. Prefer. 2010, 21, 22–32. [Google Scholar] [CrossRef]
  15. Chaney, I.M. External Search Effort for Wine. Int. J. Wine Mark. 2000, 12, 5–21. [Google Scholar] [CrossRef]
  16. Chambers, L.; Ells, H.; Yeomans, M.R. Can the Satiating Power of a High Energy Beverage Be Improved by Manipulating Sensory Characteristics and Label Information? Food Qual. Prefer. 2013, 28, 271–278. [Google Scholar] [CrossRef]
  17. Kozup, J.; Burton, S.; Greyer, E. A Comparison of Drinkers’ and Nondrinkers’ Responses to Health-Related Information Presented on Wine Beverage Labels. J. Consum. Policy 2001, 24, 209–230. [Google Scholar] [CrossRef]
  18. Ngo, M.K.; Velasco, C.; Salgado, A.; Boehm, E.; O’Neill, D.; Spence, C. Assessing Crossmodal Correspondences in Exotic Fruit Juices: The Case of Shape and Sound Symbolism. Food Qual. Prefer. 2013, 28, 361–369. [Google Scholar] [CrossRef]
  19. Arboleda, A.M.; Arce-Lopera, C. The Perceived Sweetness and Price of Bottled Drinks’ Silhouettes. Food Qual. Prefer. 2020, 82, 103867. [Google Scholar] [CrossRef]
  20. Arboleda, A.M.; Arce-Lopera, C. Quantitative Analysis of Product Categorization in Soft Drinks Using Bottle Silhouettes. Food Qual. Prefer. 2015, 45, 1–10. [Google Scholar] [CrossRef]
  21. Rojas, J.-C.; Contero, M.; Naoemi, B.; Jaime, G. Using Combined Bipolar Semantic Scales and Eye-Tracking Metrics to Compare Consumer Perception of Real and Virtual Bottles By. Packag. Technol. Sci. 2015, 29, 1047–1056. [Google Scholar] [CrossRef]
  22. Wang, R.W.Y.; Chou, M.C. Differentiation in the Arched Surface of Packaging: Its Influence on the Findability of Logo Typography Displays. Displays 2011, 32, 24–34. [Google Scholar] [CrossRef]
  23. Rundh, B. Packaging Design: Creating Competitive Advantage with Product Packaging. Br. Food J. 2009, 111, 988–1002. [Google Scholar] [CrossRef]
  24. Coles, R. Food and Beverage Packaging Technology, 2nd ed.; Coles, R., Kirwan, M., Eds.; Blackwell Publishing Ltd.: Hoboken, NJ, USA, 2011; ISBN 9781405189101. [Google Scholar]
  25. Han, J.W.; Ruiz-Garcia, L.; Qian, J.P.; Yang, X.T. Food Packaging: A Comprehensive Review and Future Trends. Compr. Rev. Food Sci. Food Saf. 2018, 17, 860–877. [Google Scholar] [CrossRef]
  26. Wyrwa, J.; Barska, A. Packaging as a Source of Information about Food Products. Procedia Eng. 2017, 182, 770–779. [Google Scholar] [CrossRef]
  27. Reimann, M.; Zaichkowsky, J.; Neuhaus, C.; Bender, T.; Weber, B. Aesthetic Package Design: A Behavioral, Neural, and Psychological Investigation. J. Consum. Psychol. 2010, 20, 431–441. [Google Scholar] [CrossRef]
  28. Laeng, B.; Suegami, T.; Aminihajibashi, S. Wine Labels: An Eye-Tracking and Pupillometry Study. Int. J. Wine Bus. Res. 2016, 28, 327–348. [Google Scholar] [CrossRef]
  29. Gislason, S.; Bruhn, S.; Christensen, A.M.; Christensen, M.T.; Hansen, M.G.; Kha, T.T.; Giacalone, D. The Influence of Bottle Design on Perceived Quality of Beer: A Conjoint Analytic Study. Beverages 2020, 6, 64. [Google Scholar] [CrossRef]
  30. Silayoi, P.; Speece, M. Packaging and Purchase Decisions: An Exploratory Study on the Impact of Involvement Level and Time Pressure. Br. Food J. 2004, 106, 607–628. [Google Scholar] [CrossRef]
  31. Pickering, G.J.; Duben, M.; Kemp, B. The Importance of Informational Components of Sparkling Wine Labels Varies with Key Consumer Characteristics. Beverages 2022, 8, 27. [Google Scholar] [CrossRef]
  32. Lefebvre, S.; Orlowski, M. Can, Cup, or Bottle? The Influence of Beverage Vessel on Taste and Willingness to Pay. Int. J. Hosp. Manag. 2019, 76, 194–205. [Google Scholar] [CrossRef]
  33. Monteiro, P.; Guerreiro, J.; Loureiro, S.M.C. Understanding the Role of Visual Attention on Wines’ Purchase Intention: An Eye-Tracking Study. Int. J. Wine Bus. Res. 2020, 32, 161–179. [Google Scholar] [CrossRef]
  34. Chamorro, A.; García-Gallego, J.M.; Trindade-Carlos, H.d.C. Study on the Importance of Wine Bottle Design on Consumer Choices. Br. Food J. 2021, 123, 577–593. [Google Scholar] [CrossRef]
  35. Procidano, I.; Mauracher, C.; Valentini, M. Consumers’ Perception of Prosecco Wine Packaging: A Pilot Study in Padua and Milan. Econ. Agro-Aliment. 2021, 23, 1–23. [Google Scholar] [CrossRef]
  36. Pelet, J.É.; Durrieu, F.; Lick, E. Label Design of Wines Sold Online: Effects of Perceived Authenticity on Purchase Intentions. J. Retail. Consum. Serv. 2020, 55, 102087. [Google Scholar] [CrossRef]
  37. Suzianti, A.; Rengkung, S.; Nurtjahyo, B.; Al Rasyid, H. An Analysis of Cognitive-Based Design of Yogurt Product Packaging. Int. J. Technol. 2015, 6, 659–669. [Google Scholar] [CrossRef]
  38. Daugherty, T.; Hoffman, E. EWOM and the Importance of Capturing Consumer Attention within Social Media. J. Mark. Commun. 2013, 20, 82–102. [Google Scholar] [CrossRef]
  39. Pieters, R.; Wedel, M. Attention Capture and Transfer in Advertising: Brand, Pictorial, and Text-Size Effects. J. Mark. 2004, 68, 36–50. [Google Scholar] [CrossRef]
  40. Bojko, A. Eye Tracking the User Experience; Rosenfeld Media: Brooklyn, NY, USA, 2013; ISBN 9781933820101. [Google Scholar]
  41. Holmqvist, K.; Nyström, M.; Mulvey, F. Eye Tracker Data Quality: What It Is and How to Measure It. Eye Track. Res. Appl. Symp. 2012, 1, 45–52. [Google Scholar] [CrossRef]
  42. Tatler, B.W. The Central Fixation Bias in Scene Viewing: Selecting an Optimal Viewing Position Independently of Motor Biases and Image Feature Distributions. J. Vis. 2007, 7, 1–17. [Google Scholar] [CrossRef]
  43. Cubero Dudinskaya, E.; Naspetti, S.; Arsenos, G.; Caramelle-Holtz, E.; Latvala, T.; Martin-Collado, D.; Orsini, S.; Ozturk, E.; Zanoli, R. European Consumers’ Willingness to Pay for Red Meat Labelling Attributes. Animals 2021, 11, 556. [Google Scholar] [CrossRef]
  44. Murphy, B.; Martini, M.; Fedi, A.; Loera, B.L.; Elliott, C.T.; Dean, M. Consumer Trust in Organic Food and Organic Certifications in Four European Countries. Food Control 2022, 133, 108484. [Google Scholar] [CrossRef]
  45. Baiano, A. An Overview on Sustainability in the Wine Production Chain. Beverages 2021, 7, 15. [Google Scholar] [CrossRef]
  46. Townsend, C.; Kahn, B.E. The “Visual Preference Heuristic”: The Influence of Visual versus Verbal Depiction on Assortment Processing, Perceived Variety, and Choice Overload. J. Consum. Res. 2014, 40, 993–1015. [Google Scholar] [CrossRef]
  47. Jarvis, W.; Mueller, S.; Chiong, K. A Latent Analysis of Images and Words in Wine Choice. Australas. Mark. J. 2010, 18, 138–144. [Google Scholar] [CrossRef]
  48. Goodwin, K.A.; Goodwin, C.J. Research in Psychology: Methods and Design; John Wiley & Sons: Hoboken, NJ, USA, 2016. [Google Scholar]
  49. Harel, J.; Koch, C.; Perona, P. Graph-Based Visual Saliency. In the Advances in Neural Information Processing Systems 19: Proceedings of the Twentieth Annual Conference on Neural Information Processing Systems, Vancouver, BC, Canada, 4–7 December 2006; pp. 545–552.
  50. Mueller, S.; Lockshin, L. How Important Is Wine Packaging for Consumers? In Proceedings of the 4th International Conference of the Academy of Wine Business Research, Siena, Italy, 17–19 July 2008; p. 19. [Google Scholar]
  51. Merdian, P.; Piroth, P.; Rueger-Muck, E.; Raab, G. Looking behind Eye-Catching Design: An Eye-Tracking Study on Wine Bottle Design Preference. Int. J. Wine Bus. Res. 2021, 33, 134–151. [Google Scholar] [CrossRef]
  52. Milosavljevic, M.; Navalpakkam, V.; Koch, C.; Rangel, A. Relative Visual Saliency Differences Induce Sizable Bias in Consumer Choice. J. Consum. Psychol. 2012, 22, 67–74. [Google Scholar] [CrossRef]
  53. Bialkova, S.; Sasse, L.; Fenko, A. The Role of Nutrition Labels and Advertising Claims in Altering Consumers’ Evaluation and Choice. Appetite 2016, 96, 38–46. [Google Scholar] [CrossRef]
  54. Bialkova, S.; van Trijp, H. What Determines Consumer Attention to Nutrition Labels? Food Qual. Prefer. 2010, 21, 1042–1051. [Google Scholar] [CrossRef]
  55. Lohse, G.L. Consumer Eye Movement Patterns on Yellow Pages Advertising. J. Advert. 1997, 26, 61–73. [Google Scholar] [CrossRef]
  56. van der Laan, L.N.; Hooge, I.T.C.; De Ridder, D.T.D.; Viergever, M.A.; Smeets, P.A.M. Do You like What You See? The Role of First Fixation and Total Fixation Duration in Consumer Choice. Food Qual. Prefer. 2015, 39, 46–55. [Google Scholar] [CrossRef]
  57. Reutskaja, E.; Nagel, R.; Camerer, C.F.; Rangel, A. Search Dynamics in Consumer Choice under Time Pressure: An Eye-Tracking Study. Am. Econ. Rev. 2011, 101, 900–926. [Google Scholar] [CrossRef]
  58. Orquin, J.L.; Bagger, M.P.; Lahm, E.S.; Grunert, K.G.; Scholderer, J. The Visual Ecology of Product Packaging and Its Effects on Consumer Attention. J. Bus. Res. 2020, 111, 187–195. [Google Scholar] [CrossRef]
  59. Clement, J. Visual Influence on In-Store Buying Decisions: An Eye-Track Experiment on the Visual Influence of Packaging Design. J. Mark. Manag. 2007, 23, 917–928. [Google Scholar] [CrossRef]
  60. Piqueras-Fiszman, B.; Velasco, C.; Salgado-Montejo, A.; Spence, C. Using Combined Eye Tracking and Word Association in Order to Assess Novel Packaging Solutions: A Case Study Involving Jam Jars. Food Qual. Prefer. 2013, 28, 328–338. [Google Scholar] [CrossRef]
  61. Li, Q.; Huang, Z.J.; Christianson, K. Visual Attention toward Tourism Photographs with Text: An Eye-Tracking Study. Tour. Manag. 2016, 54, 243–258. [Google Scholar] [CrossRef]
  62. Calbi, M.; Langiulli, N.; Siri, F.; Umiltà, M.A.; Gallese, V. Visual Exploration of Emotional Body Language: A Behavioural and Eye-Tracking Study. Psychol. Res. 2021, 85, 2326–2339. [Google Scholar] [CrossRef]
  63. Hervet, G.; Guérard, K.; Tremblay, S.; Chtourou, M.S. Is Banner Blindness Genuine? Eye Tracking Internet Text Advertising. Appl. Cogn. Psychol. 2011, 25, 708–716. [Google Scholar] [CrossRef]
  64. Geisser, S.; Greenhouse, S.W. An Extension of Box’s Results on the Use of the F Distribution in Multivariate Analysis. Ann. Math. Stat. 1958, 29, 885–891. [Google Scholar] [CrossRef]
  65. R Core Team. R: A Language and Environment for Statistical Computing; R Foundation for Statistical Computing: Vienna, Austria, 2022. [Google Scholar]
  66. Revelle, W. Psych: Procedures for Psychological, Psychometric, and Personality Research 2022, Version 2.2.9; Northwestern University: Evanston, IL, USA, 2022. [Google Scholar]
  67. Peschel, A.O.; Orquin, J.L.; Mueller Loose, S. Increasing Consumers’ Attention Capture and Food Choice through Bottom-up Effects. Appetite 2019, 132, 1–7. [Google Scholar] [CrossRef]
  68. Orquin, J.L.; Mueller Loose, S. Attention and Choice: A Review on Eye Movements in Decision Making. Acta Psychol. 2013, 144, 190–206. [Google Scholar] [CrossRef] [PubMed]
  69. Proi, M.; Dudinskaya, E.C.; Naspetti, S.; Ozturk, E.; Zanoli, R. The Role of Eco-Labels in Making Environmentally Friendly Choices: An Eye-Tracking Study on Aquaculture Products with Italian Consumers. Sustainability 2023, 15, 4659. [Google Scholar] [CrossRef]
  70. Kovačević, D.; Brozović, M.; Možina, K. Do Prominent Warnings Make Packaging Less Attractive? Saf. Sci. 2018, 110, 336–343. [Google Scholar] [CrossRef]
  71. Rramani, Q.; Krajbich, I.; Enax, L.; Brustkern, L.; Weber, B. Salient Nutrition Labels Shift Peoples’ Attention to Healthy Foods and Exert More Influence on Their Choices. Nutr. Res. 2020, 80, 106–116. [Google Scholar] [CrossRef]
  72. Cotter, K.N.; Silvia, P.J.; Bertamini, M.; Palumbo, L.; Vartanian, O. Curve Appeal: Exploring Individual Differences in Preference for Curved versus Angular Objects. I-perception 2017, 8, 2041669517693023. [Google Scholar] [CrossRef] [PubMed]
  73. Nicholls, M.E.R.; Smith, A.; Mattingley, J.B.; Bradshaw, J.L. The Effect of Body and Environment-Centred Coordinates on Free-Viewing Perceptual Asymmetries for Vertical and Horizontal Stimuli. Cortex 2006, 42, 336–346. [Google Scholar] [CrossRef] [PubMed]
  74. Rima, S.; Kerbyson, G.; Jones, E.; Schmid, M.C. Advantage of Detecting Visual Events in the Right Hemifield Is Affected by Reading Skill. Vis. Res. 2020, 169, 41–48. [Google Scholar] [CrossRef]
  75. Duerrschmid, K.; Danner, L. Eye Tracking in Consumer Research. In Methods in Consumer Research, Volume 2: Alternative Approaches and Special Applications; Woodhead Publishing: Sawston, UK, 2018; Volume 2, ISBN 9780081017432. [Google Scholar]
  76. Ares, G.; Giménez, A.; Bruzzone, F.; Vidal, L.; Antúnez, L.; Maiche, A. Consumer Visual Processing of Food Labels: Results from an Eye-Tracking Study. J. Sens. Stud. 2013, 28, 138–153. [Google Scholar] [CrossRef]
  77. Bodini, A.; Zanoli, R. Competitive Factors of the Agro-Food E-Commerce. J. Food Prod. Mark. 2011, 17, 241–260. [Google Scholar] [CrossRef]
  78. Spence, C.; Wan, X. Beverage Perception and Consumption: The Influence of the Container on the Perception of the Contents. Food Qual. Prefer. 2015, 39, 131–140. [Google Scholar] [CrossRef]
  79. Spence, C.; Ngo, M.K. Assessing the Shape Symbolism of the Taste, Flavour, and Texture of Foods and Beverages. Flavour. 2012, 1, 12. [Google Scholar] [CrossRef]
Figure 1. Example of the area of interest in the two bottles’ silhouettes used in the study.
Beverages 09 00036 g001
Figure 2. Silhouettes of the two different bottles in three orientations.
Beverages 09 00036 g002
Figure 3. Locations of the organic logo on each bottle type.
Beverages 09 00036 g003
Figure 4. Sequence of the task followed by each participant.
Beverages 09 00036 g004
Figure 5. Saliency maps of each of the bottles in three orientations.
Beverages 09 00036 g005
Figure 6. Heat maps of each of the bottles in three orientations showing the areas of fixation combined for all of the participants (red: high; yellow: medium; green: low).
Beverages 09 00036 g006
Figure 7. Predictive margins for TTFF according to type of bottle and bottle part, with a 95% confidence interval.
Beverages 09 00036 g007
Figure 8. Predictive margins for TTFF according to bottle orientation and part, with a 95% confidence interval.
Beverages 09 00036 g008
Figure 9. Predictive margins for time spent according to type of bottle and bottle part, with a 95% confidence interval.
Beverages 09 00036 g009
Figure 10. Predictive margins for time spent according to bottle orientation and part, with a 95% confidence interval.
Beverages 09 00036 g010
Table 1. Average means and standard deviations (in parenthesis) of AOIs of each bottle in three positions.
Beverages 09 00036 i001Beverages 09 00036 i002Beverages 09 00036 i003Beverages 09 00036 i004Beverages 09 00036 i005Beverages 09 00036 i006
AOIAOI Metrics (ms) *Bottle ABottle B
TopTTFF ** 2167.46
(2162.33)
1992.88
(2262.38)
1913.71
(2188.9)
1548.08
(1812.17)
1837.67
(2003.72)
1582.38
(1662.73)
TS ***1228.42
(1132.89)
1093.46
(905.46)
1001.17
(834.91)
1463.04
(1072.06)
1194.88
(645.78)
1208.92
(1029.76)
ShoulderTTFF548
(1154.67)
1517.12
(2239.12)
978.79
(2188.9)
745.17
(1472.22)
1445.79
(1722.23)
2036.08
(2542.84)
TS2433.21
(1371.54)
1655.08
(1194.08)
1242.42
(781.51)
1861.21
(1301.35)
1035.42
(715.84)
815.38
(716.12)
CentreTTFF4085.62
(2953.34)
3719.46
(2858.58)
3189.17
(3009.04)
3922.58
(2524.03)
1462.62
(1556.62)
1649.04
(2165.52)
TS434
(532.8)
349.42
(470.77)
798.79
(930.83)
616.88
(758.28)
869.71
(510.77)
1326.38
(1110.62)
BottomTTFF4166.71
(2566.34)
3553.79
(2306.3)
3769.701
(2498.87)
4671.21
(2695.6)
3757.96
(2126.59)
3690.12
(2697.74)
TS288.42
(336.2)
569.5
(577.38)
457.08
(497.53)
223.67
(381.9)
608.67
(755)
524.46
(537.77)
Note: Values in parentheses correspond to the standard deviations. * (ms), millisecond; ** TTFF: time to first fixation; *** TS: time spent.
Disclaimer/Publisher’s Note: The statements, opinions and data contained in all publications are solely those of the individual author(s) and contributor(s) and not of MDPI and/or the editor(s). MDPI and/or the editor(s) disclaim responsibility for any injury to people or property resulting from any ideas, methods, instructions or products referred to in the content.

