Article

From Fermented Wash to New Make Spirit: Assessing the Evolution of Flavour Characteristics of Scotch Whisky Using Lab-Scale Process Simulations

1
Division of Engineering and Food Sciences, Abertay University, Dundee DD1 1HG, UK
2
The Scotch Whisky Research Institute, Edinburgh EH14 4AH, UK
*
Author to whom correspondence should be addressed.
Beverages 2023, 9(2), 37; https://doi.org/10.3390/beverages9020037
Submission received: 9 February 2023 / Revised: 21 March 2023 / Accepted: 24 March 2023 / Published: 24 April 2023
(This article belongs to the Special Issue Advances in Flavour Chemistry of Fermented Beverages)

Abstract

:
New product development for distilled spirits frequently involves experimental trials at the laboratory scale that attempt to replicate industrial-scale production processes. This process is time-consuming and limits the number of samples that can be analysed. The aim of the present study was to conduct laboratory-scale Scotch malt whisky production experiments to determine if samples taken from earlier in the production process, that is, directly after fermentation (wash stage) or after a single distillation (low wines stage), showed similar analytical differentiation compared to samples of fresh distillates (new make spirits). Napping, a rapid sensory method, was used to assess the impact on flavour characteristics while solid-phase microextraction (SPME) gas chromatography–mass spectrometry (GC–MS) was used to analyse volatile flavour congeners. Hierarchical Multiple Factor Analysis was used to compare the product maps from samples taken at each whisky production stage and revealed a pattern of differences across the samples that could be tracked through the process. Although the flavour descriptors and volatile congeners composition changed at each stage, there were only marginal changes in the differentiation between samples, resulting in the same sample groups being found in all analyses. RV coefficients >0.90 for all analytical comparisons and >0.74 overall showed that all product maps were highly similar to each other and showed the same overall differentiation between samples. These results indicate that the analysis of fermented malt whisky wash may provide sufficient information to proceed to larger-scale industry trials, saving time and allowing a greater number of parameters to be explored.

Graphical Abstract

1. Introduction

Scotch whisky is an important product for Scotland and its economy. Over 2.2 million visitors are attracted to Scottish distilleries per year [1]. To protect this product category, strict regulations are enforced to maintain high quality and prevent adulteration, misinterpretation, and fraud. Scotch malt whisky is produced using only three ingredients: water, malted barley, and yeast [2].
Barley is malted to break down the starch into fermentable sugars and proteins into amino acids [3,4]. During malting, some flavour compounds, called congeners, are produced. This is especially the case during the malt drying process, where astringent, buttery, nutty, butterscotch, burnt, roasty, creamy, and canned corn flavours can be formed [4,5]. The malt is milled before being transferred to the mashing stage. Here, hot water is added to further break down the sugars and extract them together with other nutrients [6]. The liquid, called wort, is transferred into wooden or stainless-steel fermenters called washbacks, where yeast is added to start the fermentation. Most distilleries choose yeast from the commercially available pool of distilling yeast strains, which includes M, MX (Kerry Bio-Science), Pinnacle (AB Mauri/AB Biotek) and DistillaMax (Lallemand Inc.). These all belong to the yeast species Saccharomyces cerevisiae [7,8,9]. Yeast converts the wort sugars (mainly maltose) into ethanol, carbon dioxide, and a variety of volatile congeners including higher alcohols, esters, organic acids, aldehydes, and sulphur compounds [10]. After a fermentation time of 48 h to 122 h and once an alcohol by volume (ABV) of 8–10% v/v has been reached [9,11], the fermented wash is distilled in a copper pot still, to produce low wines. This is followed by a second distillation step to produce new make spirit. During distillation, the ABV is raised to 60–72% v/v and sulphur compounds such as dimethyl disulphide or dimethyl trisulphide are reduced due to the interaction with the copper stills [12,13,14].
The resulting spirit varies in composition depending on the distillation time and configuration of the stills. The first 15–30 min of the second distillation generates a liquid called the foreshots cut. The foreshots contain highly volatile compounds such as short-chain esters, with carbon chain lengths smaller than 6, and long-chain fatty acids and esters, with carbon chain lengths longer than 14, from the previous distillation. The next cut, the new make spirit, contains a large variety of congeners, with high levels of medium-chain esters with carbon chain lengths between 6 and 12. The last cut, the feints, consists of congeners with high boiling points such as carboxylic acids and long-chain esters with carbon chain lengths longer than 12 [14,15,16,17,18]. The foreshots and feints are recycled back into subsequent distillations. The new make spirit, which typically has an ABV of 57–70% v/v, must be matured for at least three years in oak casks before it can be called Scotch whisky [2]. During maturation, the spirit extracts colour and other congeners from the cask, and a variety of chemical reactions take place, which gives Scotch whisky its complex flavour [19,20].
Previous research has investigated the influence of varying fermentation conditions on spirit yield, composition, and flavour [9,21,22,23,24,25,26,27]. In the wine and beer industry, the use of non-conventional or non-Saccharomyces yeast has been adopted [28,29,30]. This topic has recently been studied in relation to whisky production [31].
Measurements of whisky flavour differences are more important than ever. There is a need to have a better understanding of how flavour congeners detected in the fermented wash transpire into the subsequent new make spirit destined to become Scotch whisky following maturation. Laboratory-scale studies are mostly performed by research groups in academia or industry, to understand the impact of changing process parameters. For example, small-scale fermentations have been used to determine the influence of new yeast strains on alcohol yield and flavour [27]. Another example has been to investigate the influence of different malts [32]. In these experimental studies, the wash is double-distilled to assess the flavour characteristics of the new make spirit as a standard practice in the industry [33].
The aim of the study presented in this paper is to determine whether an evaluation of the wash or low wines would give comparable results, while reducing the workload, volume, and processing time of whisky process samples. To do this, we compared the flavour character and congener levels of wash, low wines, and new make spirit samples produced using nine different yeast strains.

2. Materials and Methods

2.1. Yeast

Nine yeast strains (coded A–I; Table 1) were used to produce the sample set, with four replicate fermentations carried out for each strain. Since the aim of this study was to observe changes from wash to new make spirit, the influence of these yeast strains is not discussed further. However, additional information regarding these yeast strains have been published elsewhere [34].

2.2. Wash Production

Wort was collected from a local distillery and frozen at −18 °C. Original gravity (OG) and pH were determined with an Anton Paar Density Meter DMA 35 (Anton Paar, Graz, Austria) and pH-meter (HI 208, Hanna Instruments, Leighton, UK). The OG was 1070.0° and the pH was 5.6.
Fermentations were carried out in 2 L Duran bottles containing 1.9 L of defrosted wort, sealed with an airlock. The yeast was propagated in the laboratory in advance. 100 mL of YEPD (Yeast Extract Peptone Dextrose media; 10 g Yeast extract, 20 g Peptone, 20 g Glucose) in a 250 mL Erlenmeyer flask was inoculated from a cryo-culture of yeast and incubated at 30 °C and 150 rpm for 48 h (Ecotron, InforsHT, Bottmingen, Germany). The culture was transferred into 3 L Erlenmeyer flasks with 2 L YEPD and incubated under the same conditions. After a further 48 h, a volume of 107 cells/mL for the 1.9 L fermentations was centrifuged for 5 min at 3000× g (Centrifuge 5702, Eppendorf, Hamburg, Germany). The yeast pellet was transferred with 100 mL of wort into the Duran bottles. The remaining 1.8 L of wort was added to the bottles which were held at 30 °C for a 65 h fermentation. The resulting wash was stored in a freezer prior to analysis.

2.3. Low Wines and New Make Spirit Production

Distillations were conducted using copper lab-scale wash and spirit stills at the Scotch Whisky Research Institute (SWRI). The stills were conditioned before use by distilling with a 50% water and 50% ethanol mixture on a maximum heat setting.
Wash was produced using the protocol described in Section 2.2. The frozen wash was defrosted in warm water before distilling. Then, 1.7 L of wash was filled into the wash still with 10 PTFE (Polytetrafluorethylene) boiling stones (Sigma-Aldrich, Irvine, UK) and 30 drops of Component A Antifoam (EcoLab, Middlesbrough, UK). The Fisherbrand FB68925 heating mantle (Fisher Scientific, Waltham, MA, USA) was switched on (set to 8 out of 10). The distillate was cooled during distillation with a WK 4600 Circulated thermostat (Lauda, Lauda-Königshofen, Germany) filled with Hexid A4 Heat Transfer Fluid (Applied Thermal Control Limited, Soar, UK) to 5 °C. The wash was distilled until 550 mL of low wines had been collected; 50 mL of this was retained for analysis. The remaining 500 mL was filled into the spirit still with 10 PTFE boiling stones and distilled to collect the first 100 mL of new make spirit. The low wines and new make spirit samples were stored at 4 °C prior to analysis.

2.4. Sensory Analysis: Napping

2.4.1. Sensory Panel

Sensory analysis of the samples was carried out by the SWRI expert panel consisting of 20 panellists who were trained and experienced in the evaluation of Scotch whisky and associated samples, including low wines. Potential panellists must pass an Odour Recognition Screening which tests their ability to describe aromas. Panellists are then trained in different types of sensory tests, vocabulary development and in the recognition of flavours in whiskies and their origins, centred around the flavour characteristics of the SWRI flavour wheel (20+ h). Only when a panellist’s performance is in line with the panel mean in consecutive sessions are their results used. Panel performance is also regularly checked by participating in the FlavorActiV Whisky Sensory Proficiency Scheme (https://www.flavoractiv.com/; accessed on 22 May 2022). Sensory panellists did not take part in the evaluation if they had any health condition that might impair their testing ability. They were also instructed not to consume any strongly flavoured products or smoke 30 min before the sensory session, not to wear strongly perfumed cosmetics and to ensure they had clean hands, washing them before testing with unperfumed soap.

2.4.2. Sample Preparation and Presentation

In line with standard industry practice, the low wines and spirit samples were diluted with bottled water to an ABV of 20% v/v. The wash samples were assessed undiluted. Then, 20 mL samples were presented in 100 mL blue nosing glasses covered with a watch glass at room temperature. To hide the identity of the samples, they were assigned three-digit random codes. This study focused on the volatile flavour of the samples, with only aroma assessments (nosing) carried out.

2.4.3. Napping

Napping, a rapid sensory technique, was used to compare the flavour characteristics of each set of samples (wash, low wines, new make spirit). Tests were carried out in accordance with the method described by Perrin et al. [35]. Panellists were given an A0 piece of paper and a pencil, and all nine samples in the set were presented at the same time. They were asked to evaluate the samples and arrange them on the piece of paper. They were instructed that samples that were similar should be arranged close together, whereas samples that were different should be placed away from each other. The distance between samples represents the degree of difference. Panellists could place the samples freely on the piece of paper, rearrange them as often as they liked and could reassess them. Panellists were also asked to note the predominant flavour characteristics next to each glass. Once the panellist had completed the task, the position of the glasses on the paper was recorded by drawing circles around them and noting their sample codes. To analyse the data, the X- and Y-coordinates relative to the middle point of the circle were recorded for each sample and the associated flavour characteristics noted.

2.4.4. Data Analysis

JMP 14.3.0 (32-bit, SAS Institute Inc., Cary, NC, USA) was used to perform a Multiple Factor Analysis (MFA) of the data sets from all panellists. The RV coefficient was used to calculate the consensus across panellists. In cases where the RV coefficient was <0.5 [36], the panellist was excluded in a rerun of the MFA. If the product map significantly changed, the panellist’s data was permanently excluded.
The flavour characteristics noted by the panellists were grouped. The number of times a descriptor was mentioned for every component was summarised and the results used as supplementary data for the MFA.

2.5. Congener Analysis: GC–MS SPME Arrow

2.5.1. Instrumental Conditions

Gas chromatography–mass spectrometry (GC–MS) equipped with a solid-phase microextraction (SPME) arrow fibre was used for congener analysis. A GC System 7890A (Agilent Technologies, Santa Clara, CA, USA) with a PAL RTC autosampler (PAL System, Zwingen, Switzerland) and a MS 5975C inert XL MSL with Triple-Axis detector (Agilent Technologies, Santa Clara, CA, USA), with a DB WAX-UI column, 60 m, 0.32 mm, 0.50 µm, (Agilent, Santa Clara, CA, USA) was used to analyse the samples. For wash and low wines samples, 2 mL aliquots were filled into 10 mL headspace crimp top vials with magnetic composite caps (Thermo Scientific, Waltham, MA, USA). An additional 0.5 mL of ethanol/water was used to adjust the ABV to 20%. For new make spirit samples, 1 mL of new make spirit was used, and 1.5 mL of water was used to adjust the ABV to 20% v/v. Methyl-heptanoate (50 µL, 20.5 ppm) (Sigma-Aldrich, Irvine, UK) was used as an internal standard. Spirits were prepared at least 24 h prior to analysis. Each sample was assessed in duplicate, resulting in six measurements per condition.
Samples were incubated for 5 min at 50 °C and a DVB/Carbon WR/PDMS SMPE arrow fibre (Agilent, Santa Clara, CA, USA) was used to extract the volatiles for 10 min at 250 rpm and 50 °C. It was injected in a pulsed splitless mode with a pressure of 21 psi for 3 min followed by a purge flow of 50 mL/min. The injector temperature was set to 250 °C and an extraction desorption time to 15 min. The temperature of the column was set for 3 min at 35 °C with a temperature increase rate of 10 °C/min to 240 °C, then holding this temperature for an additional 6 min, resulting in a total run time of 29.5 min. The flow rate was held at 1.4 mL/min throughout. The detector was set to 250 °C. A full scan was conducted with a solvent delay of 1 min and a m/z between 35 and 350.

2.5.2. Data Analysis

In total, 244 components were identified with the MassHunter Workstation Software Quantitative Analysis Version B.07.01/Build 7.1.524.0 Unknown Analysis, 2008 (Agilent Technologies, Santa Clara, CA, USA) and NIST/EPA/NIH Mass Spectral Library Version 2.2, build Jun 10 2013 7 (National Institute of Standards and Technology, Gaithersburg, MD, USA). The peak areas were semi-quantitatively analysed by comparing peak areas, but no standard or calibration lines were created. The flavour descriptors given on the Good Scents Company website http://www.thegoodscentscompany.com/ (accessed on 22 May 2022) for each compound were recorded and grouped according to the key categories on the SWRI flavour wheel. Compounds without listed descriptors were assigned as “not described”. JMP 14.3.0 (32-bit, SAS Institute Inc., Cary, NC, USA) was used to perform a Principal Component Analysis on the compounds.

2.6. Statistical Analysis

To compare the sensory and congener data, Hierarchical Multiple Factor Analysis (HMFA) in RStudio Version 1.3.103 (RStudio PBC, Boston, MA, USA) and the packages FactoMineR and ggplot2 were used. The data were entered in the following format: for Napping, the coordinates of all panellists were used and for GC–MS, the mean peak area for each spirit based on four replicates was used. The data were normalised by performing a PCA dividing the elements by the square of the first eigenvalue obtained for each sample set [37]. RV scores were used to compare the techniques, with the assumption that an RV coefficient >0.8 showed a good correlation [38,39].

3. Results & Discussion

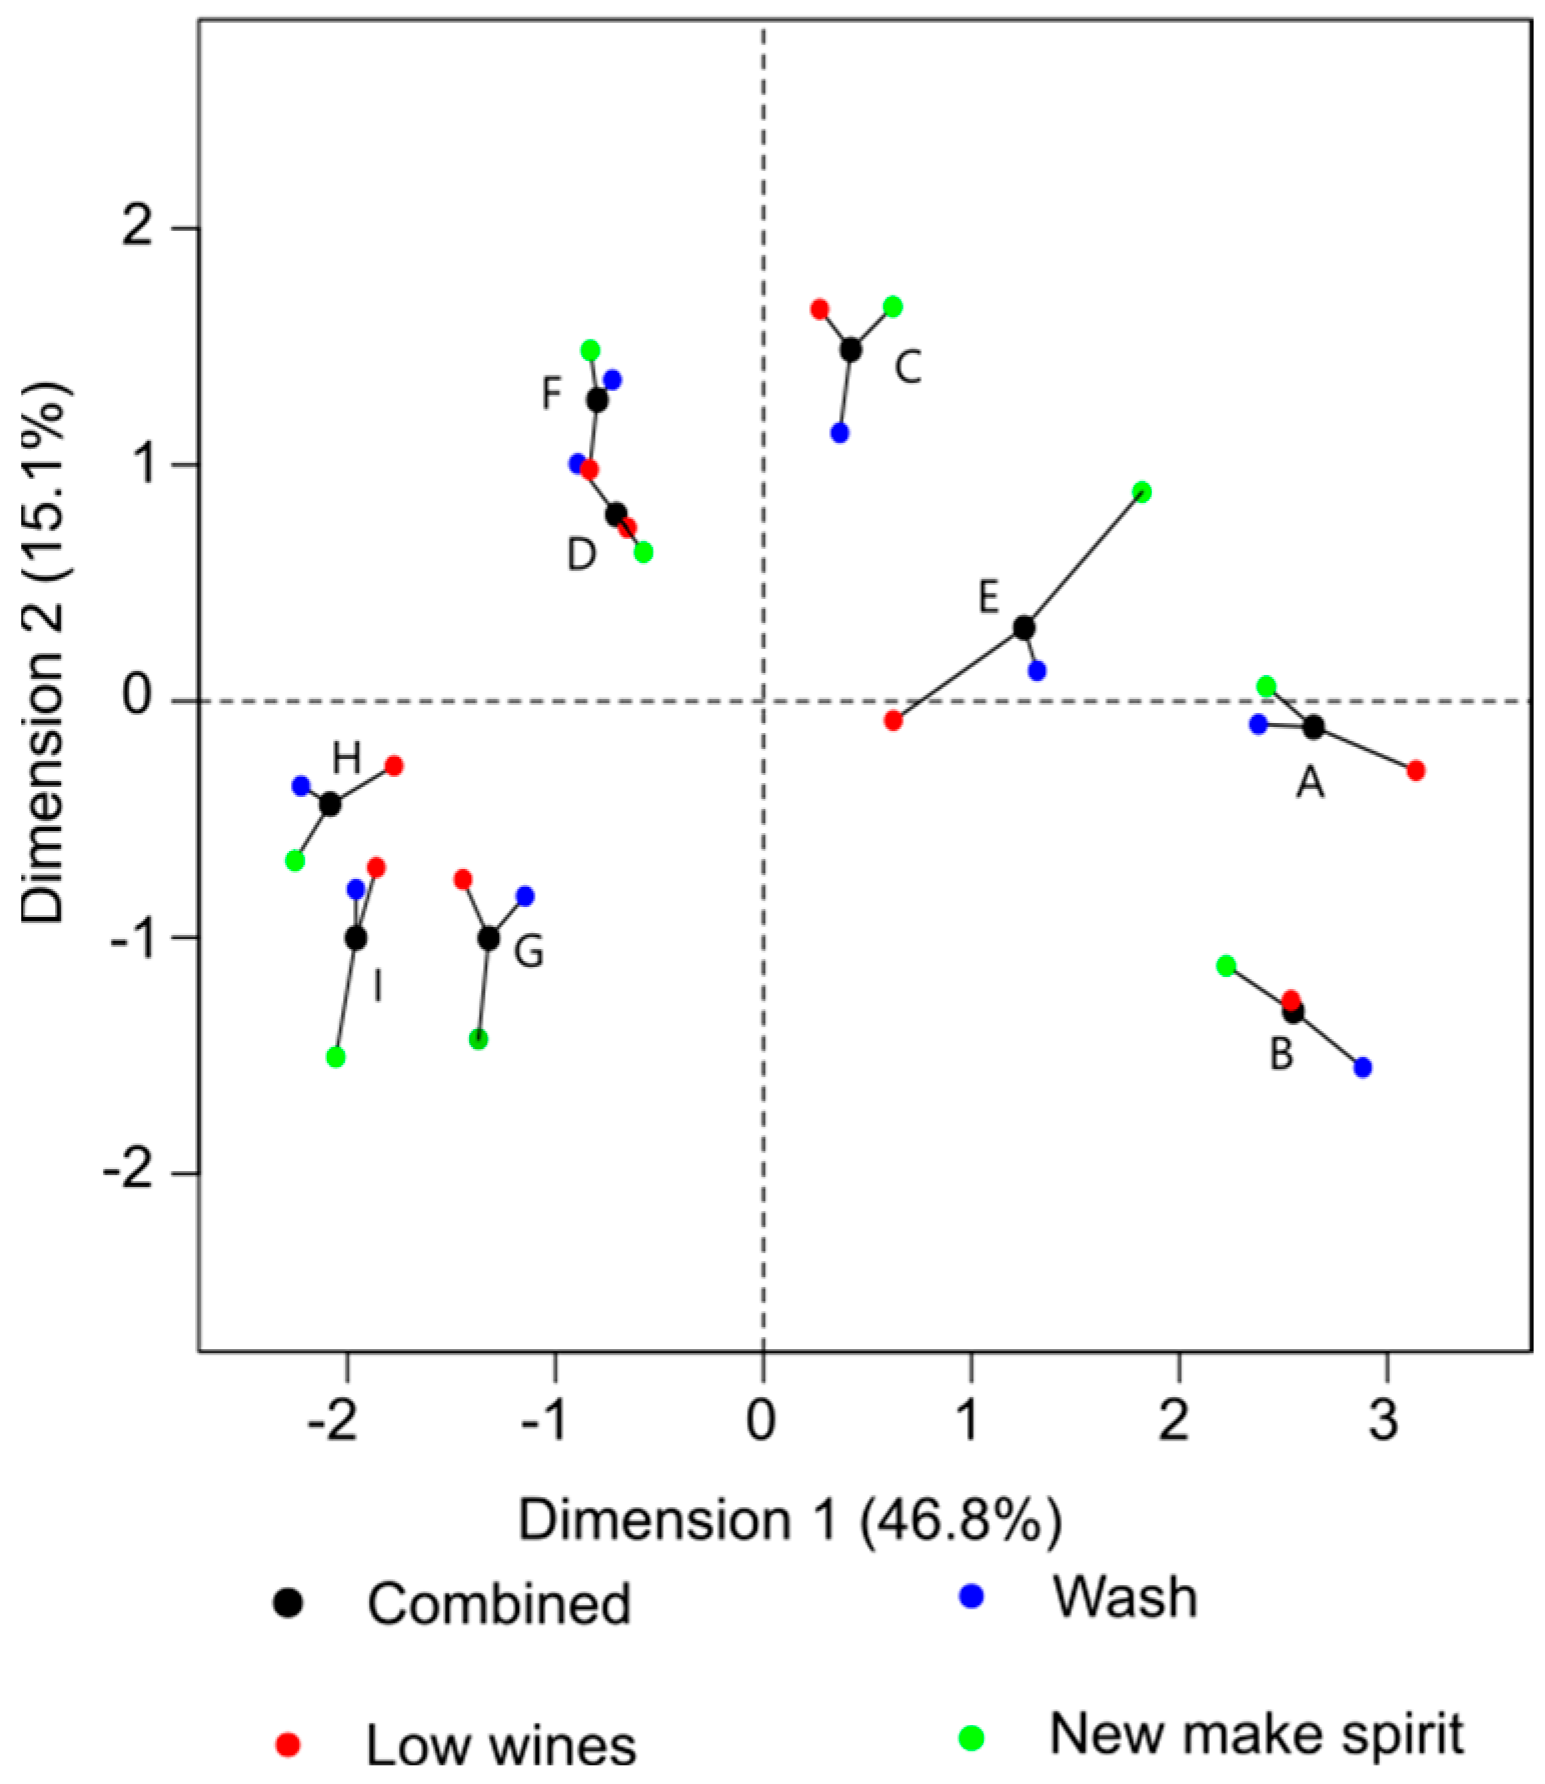
3.1. Analysis of Flavour Changes Observed by Napping

Results of the HMFA comparing the Napping data from the wash, low wines, and new make spirit sample sets are shown in Figure 1. The product maps were similar for all data sets, with yeast strain samples falling into three groups (GHI, ABE and CDF).
Wash, low wines, and new make spirit samples of nine yeast strains were assessed by Napping. To compare the product maps, the coordinates of each nappe were used. While on the first level, the three production stages were compared, the second level presented the combined centre point of all three product maps.
The three data sets were also analysed separately using MFA (Figure 2), to assess the differences in flavour maps between the yeast strains when sampling at the wash, low wines and new make spirit stages. The first two dimensions of the MFA are shown. These accounted for at least 49.8% of the variance across the samples, with the new make spirit MFA having the highest value of 57.4%. This increased resolution may be due to the sensory panel being more familiar with the evaluation of new make spirit. Alternatively, the reduction of congeners due to distillation from wash through to new make spirit may have resulted in a reduction of dimensions.
The three product maps from the samples analysed as wash, low wines, and new make spirit were similar. In all three cases, samples H, I, and G were located on the negative end of Dimension 1, samples A, B, C, and E on the positive end and samples D and F in between. More differences were visible across Dimension 2. For the low wines, samples H, I, and G were located in the middle of Dimension 2, while for low wines and new make spirits, these samples were separated on the positive end. Only sample G was located on the negative end at new make spirit level. The description of the flavour characteristics of these samples changed from wash to low wines to new make spirit. At the wash stage, samples G, H, and I were described as nutty, feinty, green, and cereal. While at the low wine sampling point, they were still described as green, and cereal, they also had sulphury, oily, and spicy notes. Once distilled to new make spirit, a separation was observed, with spirits I and H described as oily, sulphury, stale, spicy, nutty, cereal, and feinty, while spirit G was feinty and cereal.
The other six samples also showed further separation along Dimension 2. For wash, samples B and E were located on the positive end of this dimension, being described as sweet and fruity. A, C, and D were located on the negative end with sour and solventy aromas. At the low wines sampling stage, A grouped closer to B and E. The flavour descriptors for these samples were stale, nutty, solventy, and soapy. At the new make spirit stage, ABE grouped closely together, being described as sweet, fruity, and solventy.
The location of samples D, C, and F over the three product maps was variable. In the wash samples D and C were close to sample A, while sample F was on the positive side of this dimension, described as more feinty and stale. For the low wines, C, D, and F were on the negative side of Dimensions 1 and 2, being described as feinty, sour, and sweet. For the new make spirit, these three samples were all on the negative end of Dimension 1, being separated on Dimension 2. At this stage in the process the spirit produced using yeast strain C was described as soapy and floral on the positive end and spirits D and F, on the negative end, described as sour and green. In summary, flavour descriptors and the grouping of these samples changed between each of the three production steps.
Overall, the three product maps showed the same main differences across a sample set and could be used to find main groups in a sample set. Samples G, H, and I were labelled with heavier flavour descriptors linked to congeners with higher boiling points. Some of these congeners could be lost during the distillation process resulting in a more stable sample placement. Samples A, B, C, D, E, and F were best separated from G, H, and I. Some of these samples changed their position on the product maps compared to all other samples. This could be related to the nature of the distilling process: in the first distillation, congeners are concentrated by distilling over all the alcohol. In the second distillation, only a certain part of the distillate is taken, the middle cut, excluding highly volatile and low volatile congeners [14,15,17,18].

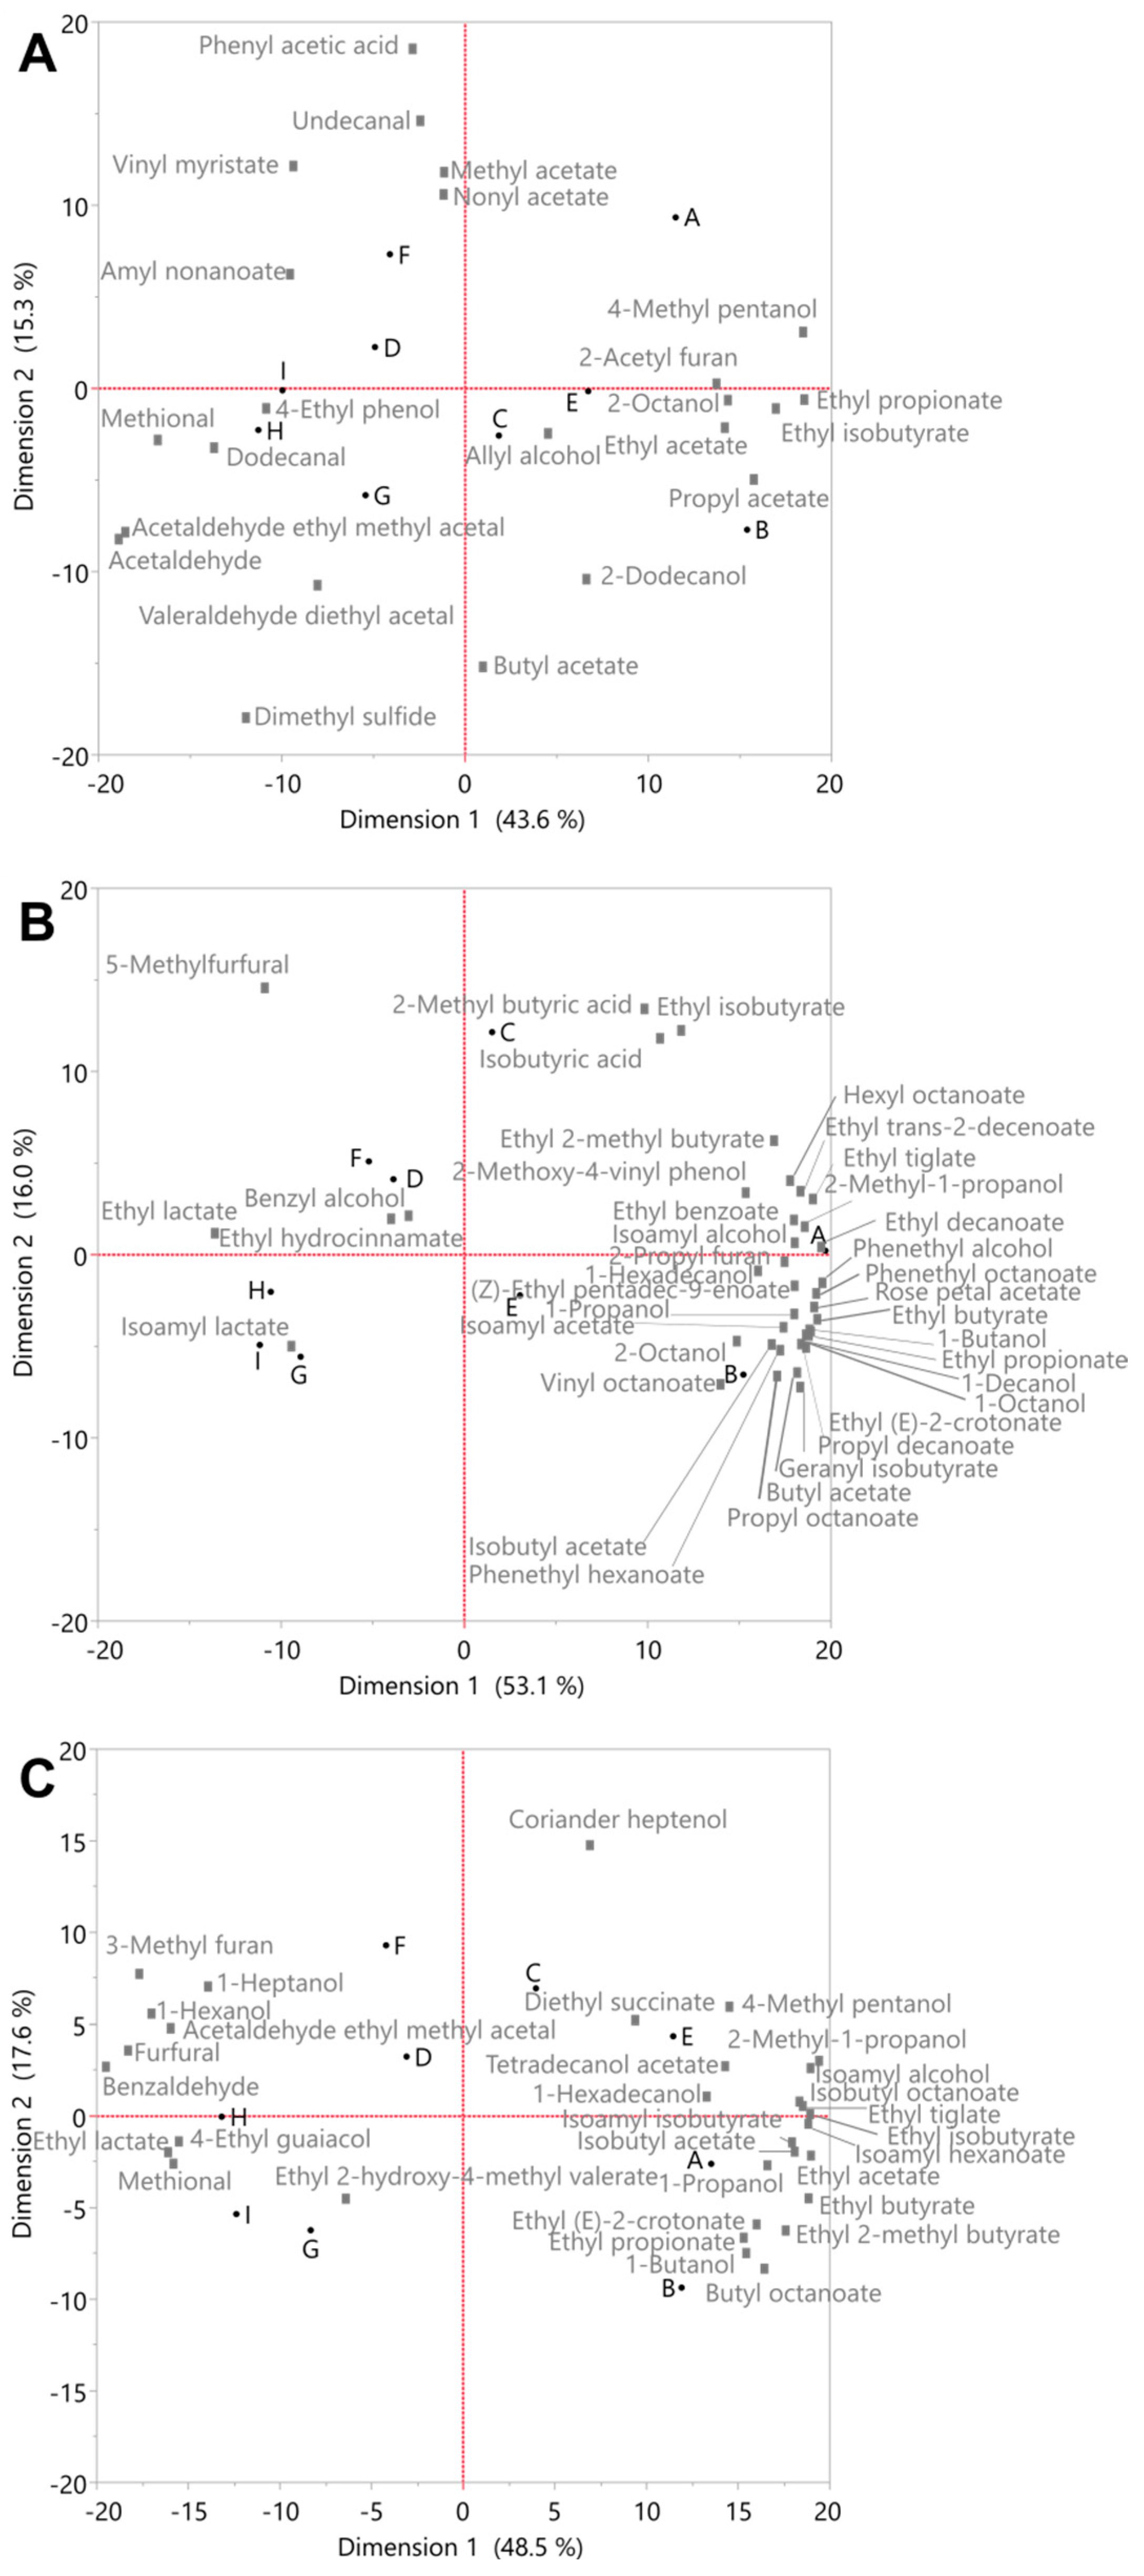
3.2. Analysis of Congeners by Gas Chromatography–Mass Spectrometry

While the sensory data in Section 3.1 provided an understanding of the perceived flavour differences, the GC–MS analysis can help to explain the underlying changes in the congener profile. For this sample set, 244 congeners were identified in the wash, low wines, and new make spirit samples. JMP’s predictor screening was used to identify the congeners with the largest impact on the separation at each stage in the production process (Appendix A, Table A1). It uses the bootstrap forest method and 100 decision trees per run. For this analysis, congeners that impacted the separation >1% over 5 runs were selected, resulting in 38 identified congeners. Two congeners, namely ethyl propionate and ethyl isobutyrate, were identified by JMP’s Predictor Screening as being important discriminators between yeast strains for all three samples sets. There were three important congeners, namely ethyl acetate, ethyl isobutyrate, and ethyl propionate, that were the same in the wash and new make spirit, but only 1-octanol and butyl acetate were the same for the wash and low wines. The highest similarity in significant congeners was observed between the new make spirit and low wines, with 11 compounds that were the same for both.
HMFA was used to compare the differences in congeners between the wash, low wines, and new make spirit sample sets (Figure 3). The sample sets were highly similar, with only slight differences in resolution at the different stages of the production process. At the new make spirit stage, samples G, H, and I separated more than at the other process levels, showing that the resolution of separating these samples was more efficient based on the increased distance between the data points. The separation of the other samples was greatest at the low wines stage. The overall resolution of the samples was lowest at the wash stage and the samples were clustered closer together. This can be linked to the principle of whisky distillation. Congeners are concentrated during the first distillation, giving high concentrations of a range of compounds, while the second distillation is a selective process that reduces the number that can be detected. This aligns with the hypothesis from the sensory data in Section 3.1, that flavour changes slightly between the production steps due to congeners either reaching their odour threshold or dropping below this threshold. The original congener composition of a sample, namely the compounds present in the wash, had a larger impact on the separation of the samples than the distillation.
Wash, low wines, and new make spirit samples of four fermentations from nine different yeasts were assessed in duplicate by gas chromatography–mass spectrometry solid-phase microextraction arrow. To compare the product maps, the mean scores of the replicates were used. While on the first level, the three production stages were compared, the second level presents the combined centre point of all three product maps.
For the Principal Component Analysis, mean scores of four fermentations analysed in duplicate were used. Twenty-three congeners were identified by JMP’s Predictor Screening as having the largest impact on separating the sample set at the wash stage, forty in the low wines, and thirty in new make spirit.
To further investigate differences at the three stages of production, a PCA was performed for each sample set (wash, low wines, new make spirit) (Figure 4). As with the Napping results, the variance and eigenvalues were assessed to identify the significant dimensions. With the first two dimensions explaining in all instances at least fifty-nine percent of the variance within the data, only the first two dimensions were identified as significant and are shown for the following product maps. Dimension 1 for all three sample sets showed the same separation based on levels of ester compounds. Samples with high levels of esters (A, B, C, and E) were located on the positive end of this dimension. Additionally, higher levels of higher alcohols were detected in the low wines and new make spirits for these samples. At the wash stage, samples with high levels of aldehydes were on the negative end of Dimension 1. Aldehydes were not important separation criteria in the low wines and new make spirits.
The separation across Dimension 2 for the wash samples was based on single congeners which could not be grouped by specific chemical groups. These differences are likely to be related to the diverse metabolism of the different yeast strains used. Higher ethanol levels correlate with more efficient fermentation, production of esters, and reduction of aldehydes [40,41,42]. Dimension 2 separated A, F, and D on the positive end from the samples E and I at 0 and B, C, G, and H on the negative end. On the positive end of Dimension 1, samples A, B, C, and E are placed, with only sample A being on the positive end of both dimensions. On the low wines map, Sample C was in a different position than in the wash samples, having higher levels of butyrate esters and acids. Dimension 2 of the new make spirit set showed a further separation based on the levels of esters and higher alcohols, with the higher alcohols playing a more important role than in the previous product maps. Samples on the negative end were separated based on their levels of cyclic compounds and higher alcohols. In comparison to the low wines, E and C moved closer together, as seen in the wash samples.
Examination of the overall congener levels showed that 178 of the 244 congeners were at the highest level in the new make spirits, demonstrating that most congeners are concentrated during distillation with only around one third being reduced.

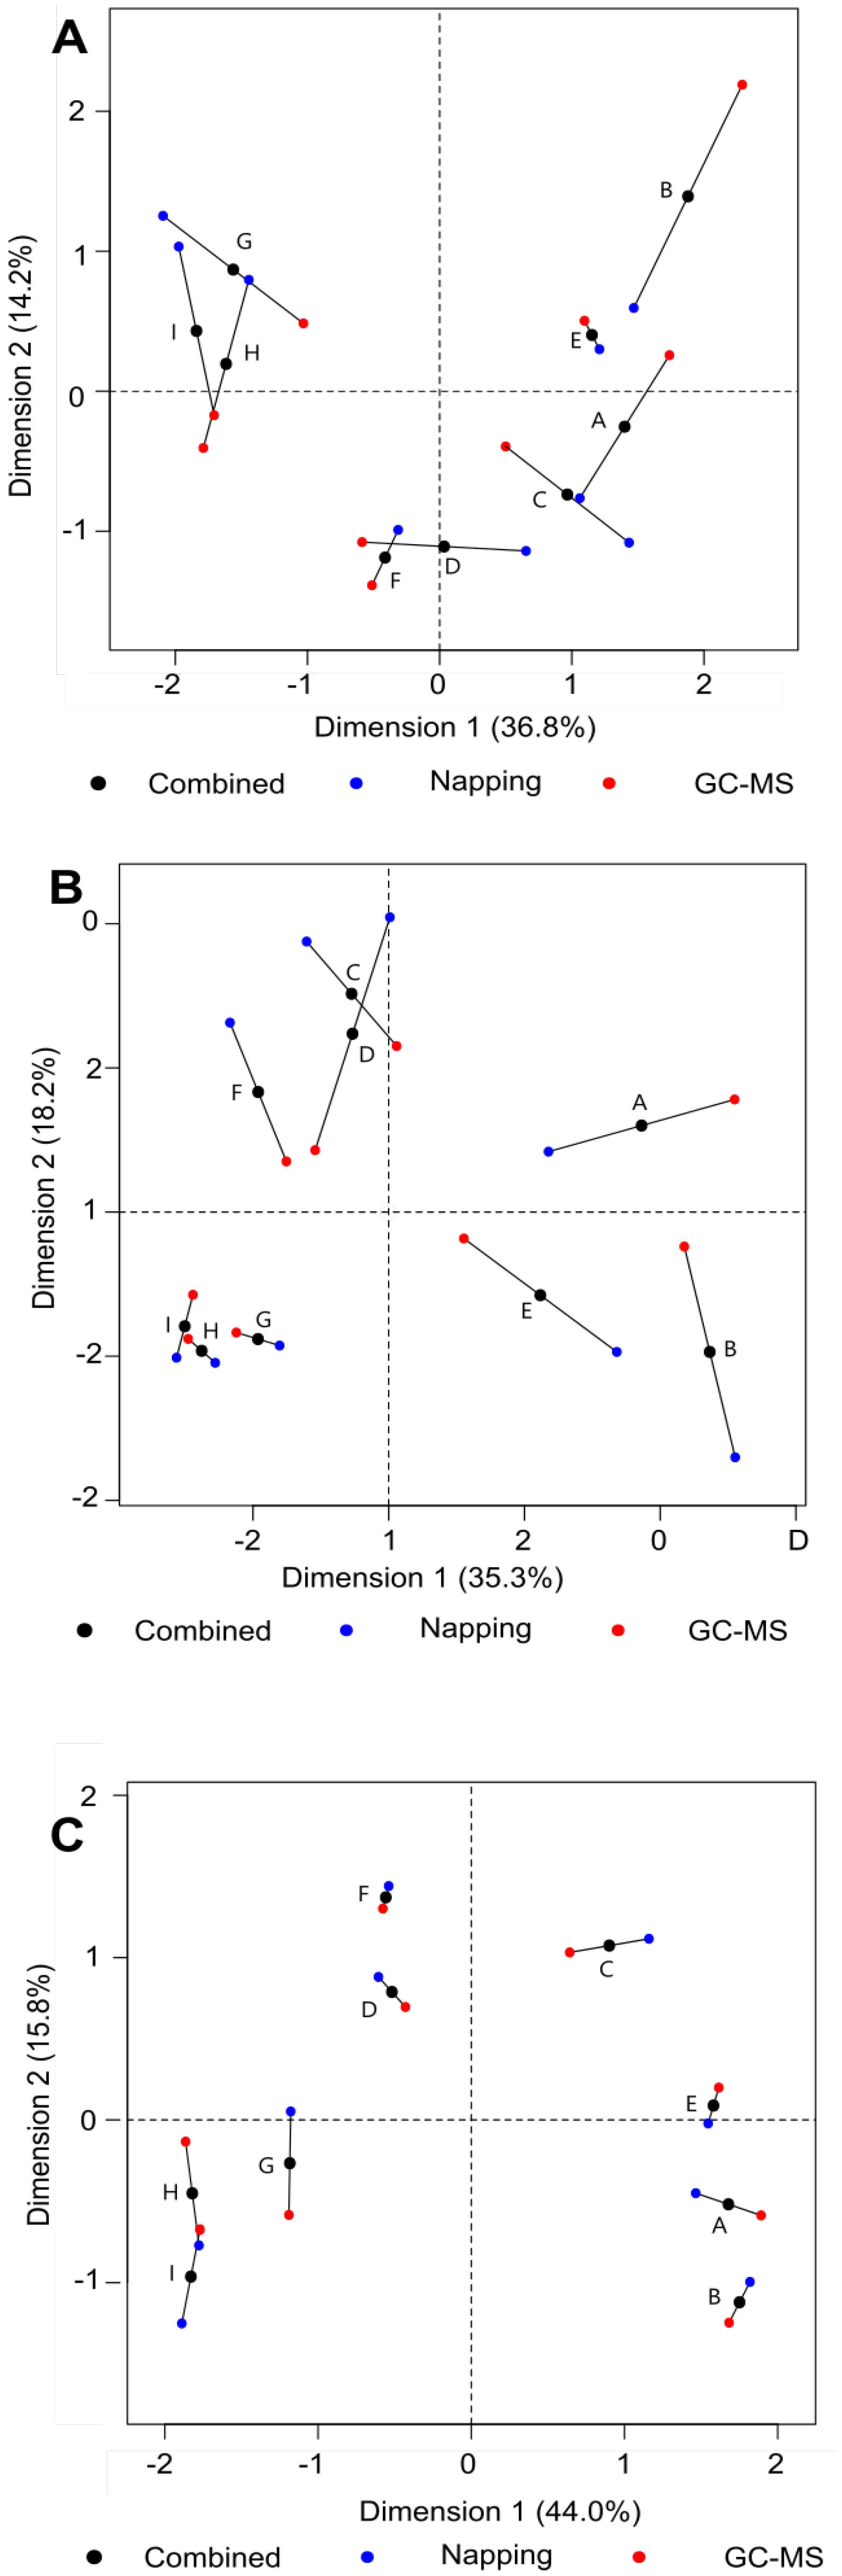
3.3. Connecting Flavour and Congener Changes through the Whisky Production Process

A further HMFA was carried out to compare the Napping and GC–MS data at each process step (Figure 5). Both methods grouped the samples in a similar way. Samples A, B, C, and E were described over all stages as more fruity, floral, and solventy, while the GC–MS detected increased levels of esters that are linked to these flavour attributes. Samples G, H, and I were described as cereal, feinty, sour, and green, which can be linked to the lower concentration of esters and the presence of more aldehydes [16].
Samples of four fermentations of nine different samples were blended for the assessment by Napping and analysed in duplicate by gas chromatography–mass spectrometry solid-phase microextraction arrow. To compare the product maps, the coordinates of each nappe were used for the Napping data while the mean of all replicates was used for gas chromatography–mass spectrometry solid-phase microextraction arrow.
The GC–MS was better for detecting small differences between samples, while Napping was more efficient in highlighting the main differences across the sample sets. The GC–MS data showed that concentrations and ratios of esters differed from sample to sample. However, the overall level was most important in flavour terms, with samples with higher levels described as more fruity and solventy by the panel.
To validate the visual analysis of the HMFA plots, the RV coefficients were calculated to compare the different methods (Table 2). All RV coefficients were 0.74 and higher. This shows that the product maps were highly similar. Napping and GC–MS analysis of the new make spirit samples had the highest RV score (0.94). This suggests that either of the methods would be sufficient to determine the main differences across the sample set and narrow down samples for a more detailed analysis. The RV coefficients of the Napping analysis, comparing low wines, wash and new make spirit, were all 0.80 and above. This indicates that the sensory data obtained for the different production stages was similar. Sensory analyses of wash would save time required for distillation while giving an overview of sample differences which are relatable to the results that would be obtained for low wines or new make spirit.
The GC–MS product maps from the three stages in production were also highly similar, with RV coefficients >0.90. Again, this suggests that an analysis of the wash samples is sufficient to detect sample differences at later stages of production.
Finally, the Napping analysis of the new make spirits had the highest RV coefficients, with other data sets suggesting that it may be the best single approach to represent overall differences between whisky process samples. However, the degree of detail required must be balanced against the extra time needed for the two-stage distillation of the samples.

4. Conclusions

This study showed that large whisky process sample sets produced in the laboratory to investigate the impact of modifying mashing or fermentation conditions can be pre-screened at the wash or low wine stages without the need to double distil. This reduces the workload and time needed for the development of new whisky processes. The results show that Napping and GC–MS analysis of samples taken from different steps in the process result in highly similar product maps and similar separation of samples. GC–MS analysis of fermented wash samples combined with knowledge of the contribution of congeners to flavour can be used to predict differences early in the process, reducing the workload of the sensory panel. While the analysis of wash is the quickest regarding sample preparation, there is the downside of reduced sample stability. The higher ABV of the low wines and new make spirit samples makes them more stable. Depending on the type of information, level of detail and the timeframe, sampling from any of the three stages in the whisky production process is suitable for predicting the main differences across a sample set.

Author Contributions

Conceptualization, M.D. and F.J.; methodology, M.D. and I.B.; formal analysis, M.D. and B.H.; investigation, M.D.; writing—original draft preparation, M.D.; writing—review and editing, F.J., B.H., I.B. and G.W.; supervision, F.J. and G.W.; funding acquisition, F.J. and G.W. All authors have read and agreed to the published version of the manuscript.

Funding

This research was funded by a Collaborative Training partnership Programme grant awarded to Martina Daute (BB/R505201/1) under the auspices of the Industrial Biotechnology Innovation Centre (IBioIC), and the Biotechnology and Biological Sciences Research Council (BBSRC), with additional support from The Scotch Whisky Research Institute.

Institutional Review Board Statement

The study was approved by the Ethics Committee of Abertay University (EMS3105; 16 October 2020) and by SWRI’s Director of Research.

Informed Consent Statement

Informed consent was obtained from all subjects involved in the study.

Data Availability Statement

The authors confirm that the data supporting the findings of this study are available within the article. Raw data can be obtained from PURE ID: 34671556.

Acknowledgments

We thank our colleagues at The Scotch Whisky Research Institute sensory panel, not only for evaluating the spirits, but also for their positive feedback throughout the study.

Conflicts of Interest

The authors declare no conflict of interest.

Appendix A

Table A1. Summary of congeners and their chemical groups influencing the separation at new make spirit, low wines, and wash level; identified by JMP’s Predictor Screening. The listed congeners impacted the separation >1 % over five runs.
EstersHigher AlcoholsCarbonyl CompoundsCyclic CompoundsOther
CongenerNMSLWWashCongenerNMSLWWashCongenerNMSLWWashCongenerNMSLWWashCongenerNMSLWWash
(Z)-Ethyl pentadec-9-enoatexx 1-Butanolxx 5-Methylfurfural x 2-Acetyl furan x2-Methyl butyric acid x
Amyl nonanoate x1-Decanol x Acetaldehyde x2-Methoxy-4-vinyl phenol x Dimethyl sulfide x
Butyl acetate xx1-Heptanolx Acetaldehyde ethyl methyl acetal xx2-Propyl furan x Isobutyric acid x
Butyl octanoatex 1-Hexadecanolxx Benzaldehydex 3-Methyl furanx Phenyl acetic acid x
Diethyl succinatex 1-Hexanolx Dodecanal x4-Ethyl guaiacolx
Ethyl (E)-2-crotonatexx 1-Octanol xxFurfuralx 4-Ethyl phenol x
Ethyl 2-hydroxy-4-methyl valeratex 1-Propanolxx Methionalx x
Ethyl 2-methyl butyratexx 2-Dodecanol xUndecanal x
Ethyl acetatex x2-Methyl-1-propanolxx Valeraldehyde diethyl acetal x
Ethyl benzoate x 2-Octanol x
Ethyl butyratexx 4-Methyl pentanolx x
Ethyl decanoate x Allyl alcohol x
Ethyl hydrocinnamate x Benzyl alcohol x
Ethyl isobutyratexxxCoriander heptenolx
Ethyl isopentyl succinate x Isoamyl alcoholxx
Ethyl lactatexx Phenethyl alcohol x
Ethyl propionatexxx
Ethyl tiglatexx
Ethyl trans-2-decenoate x
Geranyl isobutyrate x
Hexyl octanoate x
Isoamyl acetate x
Isoamyl hexanoatex
Isoamyl isobutyratex
Isoamyl lactate x
Isobutyl acetate x
Isobutyl octanoatex
Methyl acetate x
Nonyl acetate x
Phenethyl hexanoate x
Phenethyl octanoate x
Propyl acetate x
Propyl decanoate x
Propyl octanoate x
Rose petal acetate x
Tetradecanol acetatex
Vinyl myristate x
Vinyl octanoate x
Total16259 994 326 222 022

References

  1. The Scotch Whisky Association. Facts & Figures. 2022. Available online: https://www.scotch-whisky.org.uk/insights/facts-figures// (accessed on 4 September 2022).
  2. Scottish Government. The Scotch Whisky Regulations 2009. Available online: http://www.legislation.gov.uk/uksi/2009/2890/pdfs/uksi_20092890_en.pdf (accessed on 4 September 2022).
  3. Bathgate, G.N. A review of malting and malt processing for whisky distillation. J. Inst. Brew. 2016, 122, 197–211. [Google Scholar] [CrossRef]
  4. Mosher, M.; Trantham, K. The ‘Food’ for the Brew, Brewing Science: A Multidisciplinary Approach, 1st ed.; Springer International Publishing: Cham, Switzerland, 2017; pp. 125–156. [Google Scholar] [CrossRef]
  5. Justé, A.; Malfliet, S.; Lenaerts, M.; De Cooman, L.; Aerts, G.; Willems, K.A.; Lievens, B. Microflora during malting of barley: Overview and impact on malt quality. BrewingScience 2011, 64, 22–31. [Google Scholar]
  6. Bringhurst, T.A.; Brosnan, J. Scotch whisky: Raw material selection and processing. In Whisky Technology, Production and Marketing, 2nd ed.; Elsevier Ltd.: Oxford, UK, 2014; pp. 49–122. [Google Scholar]
  7. Walker, G.; Bringhurst, T.; Brosnan, J. The ideal distiller’s yeast? Brew. Distill. Int. 2011, 30–32. [Google Scholar]
  8. Walker, G.; Brosnan, J.; Bringhurst, T.; Jack, F. Selecting new distilling yeasts for improved fermentation and for sustainability. In Distilled Spirits—Future Challenges, New Solutions; Context Products Ltd.: Packington, UK, 2011; pp. 127–136. [Google Scholar]
  9. Walker, G.; Hill, A. Saccharomyces cerevisiae in the Production of Whisk(e)y. Beverages 2016, 2, 38. [Google Scholar] [CrossRef]
  10. Walker, G.; Stewart, G. Saccharomyces cerevisiae in the Production of Fermented Beverages. Beverages 2016, 2, 30. [Google Scholar] [CrossRef]
  11. Russell, I.; Stewart, G. Distilling yeast and fermentation. In Whisky Technology Production and Marketing, 2nd ed.; Elsevier: Amsterdam, The Netherlands, 2014; pp. 123–146. [Google Scholar] [CrossRef]
  12. Masuda, M.; Nishimura, K.-I.-C. Occurance and Formation of Damascenone, Trans-2,6,6-trimethyl-l-crotonyl-cyclohexa-1,3-diene, in Alcoholic beverages. J. Food Sci. 1980, 45, 396–397. [Google Scholar] [CrossRef]
  13. Harrison, B.; Fagnen, O.; Jack, F.; Brosnan, J. The Impact of Copper in Different Parts of Malt Whisky Pot Stills on New Make Spirit Composition and Aroma. J. Inst. Brew. 2011, 117, 106–112. [Google Scholar] [CrossRef]
  14. Nicol, D.A. Batch Distillation, Whisky, 2nd ed.; Elsevier Ltd.: Oxford, UK, 2014; pp. 155–178. [Google Scholar] [CrossRef]
  15. Christoph, N.; Bauer-Christoph, C. Flavour of Spirit Drinks: Raw Materials, Fermentation, Distillation, and Ageing, Flavours and Fragrances; Springer: Berlin/Heidelberg, Germany, 2007; pp. 219–239. [Google Scholar] [CrossRef]
  16. Lee, K.-Y.M.; Paterson, A.; Piggott, J.R.; Richardson, G.D. Origins of Flavour in Whiskies and a Revised Flavour Wheel: A Review. J. Inst. Brew. 2001, 107, 287–313. [Google Scholar] [CrossRef]
  17. Franitza, L.; Granvogl, M.; Schieberle, P. Influence of the Production Process on the Key Aroma Compounds of Rum: From Molasses to the Spirit. J. Agric. Food Chem. 2016, 64, 9041–9053. [Google Scholar] [CrossRef]
  18. Piggott, J.R. Whisky. In Current Developments in Biotechnology and Bioengineering: Food and Beverages Industry; Elsevier Inc.: Amsterdam, The Netherlands, 2017; pp. 435–450. [Google Scholar] [CrossRef]
  19. Conner, J. Maturation. In Whisky Technology, Production and Marketing, 2nd ed.; Elsevier Ltd.: Oxford, UK, 2014; pp. 199–220. [Google Scholar]
  20. Reazin, G.H. Chemical Mechanisms of Whiskey Maturation. Am. J. Enol. Vitic. 1981, 32, 283–289. [Google Scholar] [CrossRef]
  21. Berbert de Amorim Neto, H.; Pearson, S.Y.; Walker, J.W.; Walker, G.M.; Brosnan, J. Application of novel yeast strains to the Scotch whisky fermentation process. In Distilled Spirits, Production, Technology and Innovation; Nottingham University Press: Nottingham, UK, 2008; pp. 139–143. [Google Scholar]
  22. Berbert de Amorim Neto, H.; Yohannan, B.K.; Bringhurst, T.A.; Brosnan, J.M.; Pearson, S.Y.; Walker, J.W.; Walker, G.M. Evaluation of a Brazilian fuel alcohol yeast strain for Scotch whisky fermentations. J. Inst. Brew. 2009, 115, 198–207. [Google Scholar] [CrossRef]
  23. Burke, C.; Speers, R.A.; Hill, A. Investigating the Birthplace of Scotch Whisky: Microbiological Survey of Lindores Abbey. In Distilled Spirits. Future Challenges, New Solutions; Context Products Ltd.: Packington, UK, 2015; pp. 249–256. [Google Scholar]
  24. Burke, J.C.; Speers, R.A.; Hill, A.E. The types and properties of yeasts and bacteria isolated during a microbiological survey of Lindores Abbey. In Proceedings of the 2014 Brewing Summit, Edinburgh, UK, 4–7 June 2014. [Google Scholar]
  25. Miles, J. Different yeast strains achieve different new-make spirit flavours. In Distilled Spirits—Future Challenges, New Solutions; Context Products Ltd.: Packington, UK, 2015; pp. 203–208. [Google Scholar]
  26. Ekins, A.; Chabot, F.; Doucette, M.; D’Aoust, F. Congener profiles of selected Lallemand yeast strains. In Distilled Spirits—Local Roots; Global Reach; Context Products Ltd.: Packington, UK, 2018; pp. 85–88. [Google Scholar]
  27. Waymark, C.; Hill, A.E. The influence of yeast strain on whisky new make spirit aroma. Fermentation 2021, 7, 311. [Google Scholar] [CrossRef]
  28. Bruner, J.; Fox, G. Novel Non-Cerevisiae Saccharomyces Yeast Species Used in Beer and Alcoholic Beverage Fermentations. Fermentation 2020, 6, 116. [Google Scholar] [CrossRef]
  29. Michel, M.; Meier-Dörnberg, T.; Jacob, F.; Methner, F.J.; Wagner, R.S.; Hutzler, M. Review: Pure non-Saccharomyces starter cultures for beer fermentation with a focus on secondary metabolites and practical applications. J. Inst. Brew. 2016, 122, 569–587. [Google Scholar] [CrossRef]
  30. Toh, D.W.K.; Chua, J.Y.; Lu, Y.; Liu, S.Q. Evaluation of the potential of commercial non-Saccharomyces yeast strains of Torulaspora delbrueckii and Lachancea thermotolerans in beer fermentation. Int. J. Food Sci. Technol. 2020, 55, 2049–2059. [Google Scholar] [CrossRef]
  31. Daute, M. Exploiting Yeast Diversity in Whisky Fermentations for Biocatalysis of Desirable Flavour Compounds. Ph.D. Thesis, Abertay University, Dundee, Scotland, 2022. [Google Scholar]
  32. Marčiulionytė, R.; Johnston, C.; Maskell, D.L.; Mayo, J.; Robertson, D.; Griggs, D.; Holmes, C.P. Roasted Malt for Distilling: Impact on Malt Whisky New Make Spirit Production and Aroma Volatile Development. J. Am. Soc. Brew. Chem. 2022, 80, 329–340. [Google Scholar] [CrossRef]
  33. Jack, F. Sensory analysis. In Whisky Technology, Production, and Marketing, 2nd ed.; Elsevier Ltd.: Oxford, UK, 2014; pp. 229–242. [Google Scholar] [CrossRef]
  34. Daute, M.; Jack, F.; Baxter, I.; Harrison, B.; Grigor, J.; Walker, G. Comparison of Three Approaches to Assess the Flavour Characteristics of Scotch Whisky Spirit. Appl. Sci. 2021, 11, 1410. [Google Scholar] [CrossRef]
  35. Perrin, L.; Symoneaux, R.; Maître, I.; Asselin, C.; Jourjon, F.; Pagès, J. Comparison of three sensory methods for use with the Napping® procedure: Case of ten wines from Loire valley. Food Qual. Prefer. 2008, 19, 1–11. [Google Scholar] [CrossRef]
  36. Louw, L.; Malherbe, S.; Naes, T.; Lambrechts, M.; van Rensburg, P.; Nieuwoudt, H. Validation of two Napping® techniques as rapid sensory screening tools for high alcohol products. Food Qual. Prefer. 2013, 30, 192–201. [Google Scholar] [CrossRef]
  37. Abdi, H.; Williams, L.J.; Valentin, D. Multiple factor analysis: Principal component analysis for multitable and multiblock data sets. Wiley Interdiscip. Rev. Comput. Stat. 2013, 5, 149–179. [Google Scholar] [CrossRef]
  38. Josse, J.; Pagès, J.; Husson, F. Testing the significance of the RV coefficient. Comput. Stat. Data Anal. 2008, 53, 82–91. [Google Scholar] [CrossRef]
  39. Dehlholm, C.; Brockhoff, P.B.; Meinert, L.; Aaslyng, M.D.; Bredie, W.L.P. Rapid descriptive sensory methods—Comparison of Free Multiple Sorting, Partial Napping, Napping, Flash Profiling and conventional profiling. Food Qual. Prefer. 2012, 26, 267–277. [Google Scholar] [CrossRef]
  40. Baert, J.J.; De Clippeleer, J.; Hughes, P.S.; De Cooman, L.; Aerts, G. On the origin of free and bound staling aldehydes in beer. J. Agric. Food Chem. 2012, 60, 11449–11472. [Google Scholar] [CrossRef] [PubMed]
  41. van Iersel, M.F.M.; Brouwer-Post, E.; Rombouts, F.M.; Abee, T. Influence of yeast immobilization on fermentation and aldehyde reduction during the production of alcohol-free beer. Enzym. Microb. Technol. 2000, 26, 602–607. [Google Scholar] [CrossRef]
  42. Verstrepen, K.J.; Derdelinckx, G.; Dufour, J.; Winderickx, J.; Thevelein, J.M.; Pretorius, I.S.; Delvaux, F.R.; Box, P.O.; Osmond, G.; Sa, A. Flavor-active esters adding fruitiness to beer. J. Biosci. Bioeng. 2003, 96, 110–118. [Google Scholar] [CrossRef]
Figure 1. Hierarchical Multiple Factor Analysis of wash, low wines, and new make spirit samples analysed by Napping (combined centre point shown for the three production steps).
Beverages 09 00037 g001
Figure 2. Multiple Factor Analysis biplots of Napping data for nine samples from experimental whisky production as wash (A), low wines (B), and new make spirit (C). Coordinates of 20 separate nappes, created by trained panellists were used for the analysis. Flavour descriptors were added as word frequencies and are presented in grey.
Beverages 09 00037 g002
Figure 3. Hierarchical Multiple Factor analysis of wash, low wines, and new make spirit samples analysed by gas chromatography–mass spectrometry solid-phase microextraction arrow.
Beverages 09 00037 g003
Figure 4. Principal Component Analysis biplot of the congener profile of nine samples from experimental whisky fermentations as wash (A), low wines (B), and new make spirit (C) detected by gas chromatography–mass spectrometry solid-phase microextraction arrow.
Beverages 09 00037 g004
Figure 5. Hierarchical Multiple Factor analysis of Napping and gas chromatography–mass spectrometry solid-phase microextraction arrow of nine samples from experimental whisky fermentations as wash (A), low wines (B), and new make spirit (C).
Beverages 09 00037 g005
Table 1. List of yeast strains that were used to produce different wash, low wines, and new make spirit samples.
CodeYeast StrainOrigin
ASaccharomyces cerevisiae—M-typeLallemand Inc. (Montreal, QC, Canada)
BDekkera bruxellensis—CBS11269Abertay University (Dundee, Scotland)
CSaccharomyces cerevisiae—Belle SaisonLallemand Inc. (Montreal, QC, Canada)
DMetschnikowia fructicola—GaiaLallemand Inc. (Montreal, QC, Canada)
EDebaryomyces hansenii—NCYC 7037Abertay University (Dundee, Scotland)
FTorulaspora delbrueckii—TD291Lallemand Inc. (Montreal, QC, Canada)
GCandida oleophila—TMW 3.0609Prof. Luwig Niessen; Technical University Munich (Munich, Germany)
HZygotorulaspora florentina—LYCC8121Abertay University (Dundee, Scotland)
IWickerhamomyces anomalus—LYCC7025Abertay University (Dundee, Scotland)
Table 2. Calculated RV coefficient of the Hierarchical Multiple Factor Analysis comparison of Napping and gas chromatography–mass spectrometry solid-phase microextraction product maps on new make spirit, low wines, and wash.
MethodRV Score
Napping wash—Napping low wines0.80
Napping wash—Napping new make spirit0.85
Napping wash—GC–MS wash0.77
Napping wash—GC–MS low wines0.74
Napping wash—GC–MS new make spirit0.82
Napping low wines—Napping new make spirit0.84
Napping low wines—GC–MS wash0.85
Napping low wines—GC–MS low wines0.77
Napping low wines—GC–MS new make spirit0.81
Napping new make spirit—GC–MS wash0.92
Napping new make spirit—GC–MS low wines0.85
Napping new make spirit—GC–MS new make spirit0.94
GC–MS wash—GC–MS low wines0.93
GC–MS wash—GC–MS new make spirit0.93
GC–MS low wines—GC–MS new make spirit0.90
Disclaimer/Publisher’s Note: The statements, opinions and data contained in all publications are solely those of the individual author(s) and contributor(s) and not of MDPI and/or the editor(s). MDPI and/or the editor(s) disclaim responsibility for any injury to people or property resulting from any ideas, methods, instructions or products referred to in the content.

