Article

Craft Brewery Wastewater Treatment in a Scalable Microbial Fuel Cell Stack

by
Olivia Zapata-Martínez
1,
Denys Villa-Gomez
2,
Raul Tapia-Tussell
1,
Jorge Dominguez-Maldonado
1,
Galdy Hernández-Zárate
3,
Elda España-Gamboa
1,
Rubí Valdez-Ojeda
1 and
Liliana Alzate-Gaviria
1,*
1
Renewable Energy Unit, Yucatan Center for Scientist Research, Mérida 97302, Mexico
2
School of Civil Engineering, Faculty of Engineering, Architecture and Information Technology, University of Queensland, Brisbane, QLD 4072, Australia
3
Postgraduate Program in Tropical Agroecosystems, Postgraduate College—Veracruz Campus, Veracruz 91690, Mexico
*
Author to whom correspondence should be addressed.
Beverages 2024, 10(1), 20; https://doi.org/10.3390/beverages10010020
Submission received: 10 November 2023 / Revised: 15 February 2024 / Accepted: 16 February 2024 / Published: 21 February 2024

Abstract

:
Craft breweries release wastewater into the environment, posing serious environmental concerns. Microbial fuel cells (MFCs) are an attractive technology that has been used in industrial wastewater treatment. This study used a scalable system of nine MFCs (stacked) to treat 150 L of craft brewery wastewater (CBW). The CBW had 1831 ± 85 mg COD (chemical oxygen demand) L−1. The hydraulic retention time was 5 days, with a COD removal percentage of 93 ± 1.8%. The total internal resistance of the stack was 204.8 ± 5.2 Ω at 26 ± 2 °C without the use of a metal catalyst; the reduction of oxygen was the limiting process. Finally, the sequence of treatments applied with this proposed system demonstrated its self-sustainability, which could be a viable option for the real-life conditions of this kind of wastewater. Further research is needed.

1. Introduction

Industrial activities contribute to the contamination of the environment because they release polluting chemicals, and traditional chemical or physical remediation is not enough to overcome the problems of pollution [1]. Currently, 6.7 billion cubic meters of wastewater are generated annually in Mexico [1,2,3]. An example of this is brewery wastewater, of which volumes between 18 and 3000 m3 per day are generated, with craft breweries discharging directly to municipal drainage systems and/or water bodies without treatment, as they are not regulated like large-scale breweries [4]; additionally, they have an organic load up to 10 times greater than conventional domestic wastewater [5].
Mexico is the fourth-largest beer producer in the world [6], and Yucatan is among the top 10 producers of craft beer in the country [7,8].
The main treatment given to brewery wastewater is through anaerobic processes [6,8], which present long retention times, produce effluent parameters outside the NOM-SEMARNAT-001-2021, and require control of several operational parameters [3]. Fossil fuels, which produce carbon dioxide and have an adverse effect on the environment, are currently used to produce most of the world’s energy. Investigating eco-friendly alternative energy sources is becoming essential as a result. MFCs are a technology that transforms chemical energy into biofuels (ethanol, hydrogen, etc.) and electricity from wastewater, thereby reducing environmental pollution and the energy and climate crises [9]. Therefore, an option of interest that overcomes fermentation barriers are bioelectrochemical technologies such as microbial fuel cells. Several authors [3,10,11,12,13,14] have successfully treated brewery wastewater in microbial fuel cells because organic matter content (sugars, starch, ethanol, and low-molecular-weight fatty acids) is biodegradable [15] and presents low concentrations of inhibitory compounds such as phenolic compounds [16]. However, MFCs can achieve the removal of persistent organic compounds, heavy metals, and nutrients from different waste effluents while recovering energy and valuable substances [16,17]. The strategy that has been applied in the last decade to favor decreasing the organic load in MFCs has been focused on the type of material, system configuration, and circuits, as well as performance prediction modeling [17,18], allowing several studies to transition to system scaling [11,19,20,21].
MFCs produce low voltage and current as output, but cannot be directly used for many applications. Therefore, energy harvesting (EH) systems from sources of ultra-low power (biological, mechanical vibration, electromagnetic radio frequency, pressure gradients, temperature gradients, and solar, among others, in terms of renewable energies) are circuits that make up for the potential difference between the source and the load, avoiding reverse voltage since the same electrolyte is shared [22,23], modifying internal impedance to optimize the collection of electrons transferred by the cell, and enabling the energy provided by these sources to be stored, reused by the circuit, or used for other purposes [22,23,24]. Similarly, other EH systems are used to obtain measurements of temperature, humidity, CO2 (measuring off-grid greenhouse gases), and in health diagnostics and food quality management [24].
The present study revealed that the performance of a pilot-scale system of microbial fuel cells for the treatment of craft brewery wastewater is self-sustainable.

2. Materials and Methods

2.1. Inoculum and Carbon Source

2.1.1. Inoculum

A mixed inoculum was prepared [25], composed of cattle manure (300 g L−1), swine manure (150 g L−1), and soil (30 g L−1). The manure was collected on the campus of Biological and Agricultural Sciences at the Autonomous University of Yucatan. Inoculation was carried out with 10% (v v−1) of the total volume (150 L).

2.1.2. Synthetic Brewery Wastewater (SBW) Composition

The synthetic brewery wastewater medium was prepared by dissolving the following materials in tap water:  1 g L−1 malt extract, 0.5 g L−1 yeast extract, 0.15 g L−1 peptone, 0.86 g L−1 maltodextrin, 2.2 g L−1 (NH4)2SO4, 2.8 mL L−1 ethanol, 0.08 g L−1 NaH2PO4, and 0.14 g L−1 Na2HPO4 (70167, 70161, P6838, 419672, A4418, E7023, S3139, S9763, Merck Mexico, Company, San Andres Atoto, Naucalpan de Juárez, Mexico) [26]. This SBW had an initial COD of 1980 ± 17 mg L−1 and was based on wastewater samples obtained from a craft brewery in Mérida, Yucatan, Mexico.

2.1.3. Craft Brewery Wastewater (CBW)

Wastewater was collected from a craft brewery in Yucatan; it came from the daily washing of the equipment after the beer production process was completed. The organic matter content varied depending on the type of beer produced at the time, with dry stout beer being the most popular. CBW was composed of 1.831 ± 85 mg L−1 COD, 63 ± 5 mg L−1 total nitrogen, 50 ± 3 mg L−1 total phosphorus, 7.30 ± 0.09 pH, and 950 ± 90 mg L−1 of Volatile Fatty Acids (VFAs).

2.2. Analytical Methods

2.2.1. Chemical Oxygen Demand (COD) and pH

For COD determination, a standard high-range COD kit (20–1500 mg L−1) (Hach Company, Loveland, CO, USA) was used, and measurements were performed in a Hach DRB 200 digester (Hach Company, Loveland, CO, USA) and Hach DR3900 colorimeter (Hach Company, Loveland, CO, USA). pH was measured with a Hach sensION 156 potentiometer (Hach Company, Loveland, CO, USA) [27].

2.2.2. Volatile Fatty Acids (VFA)
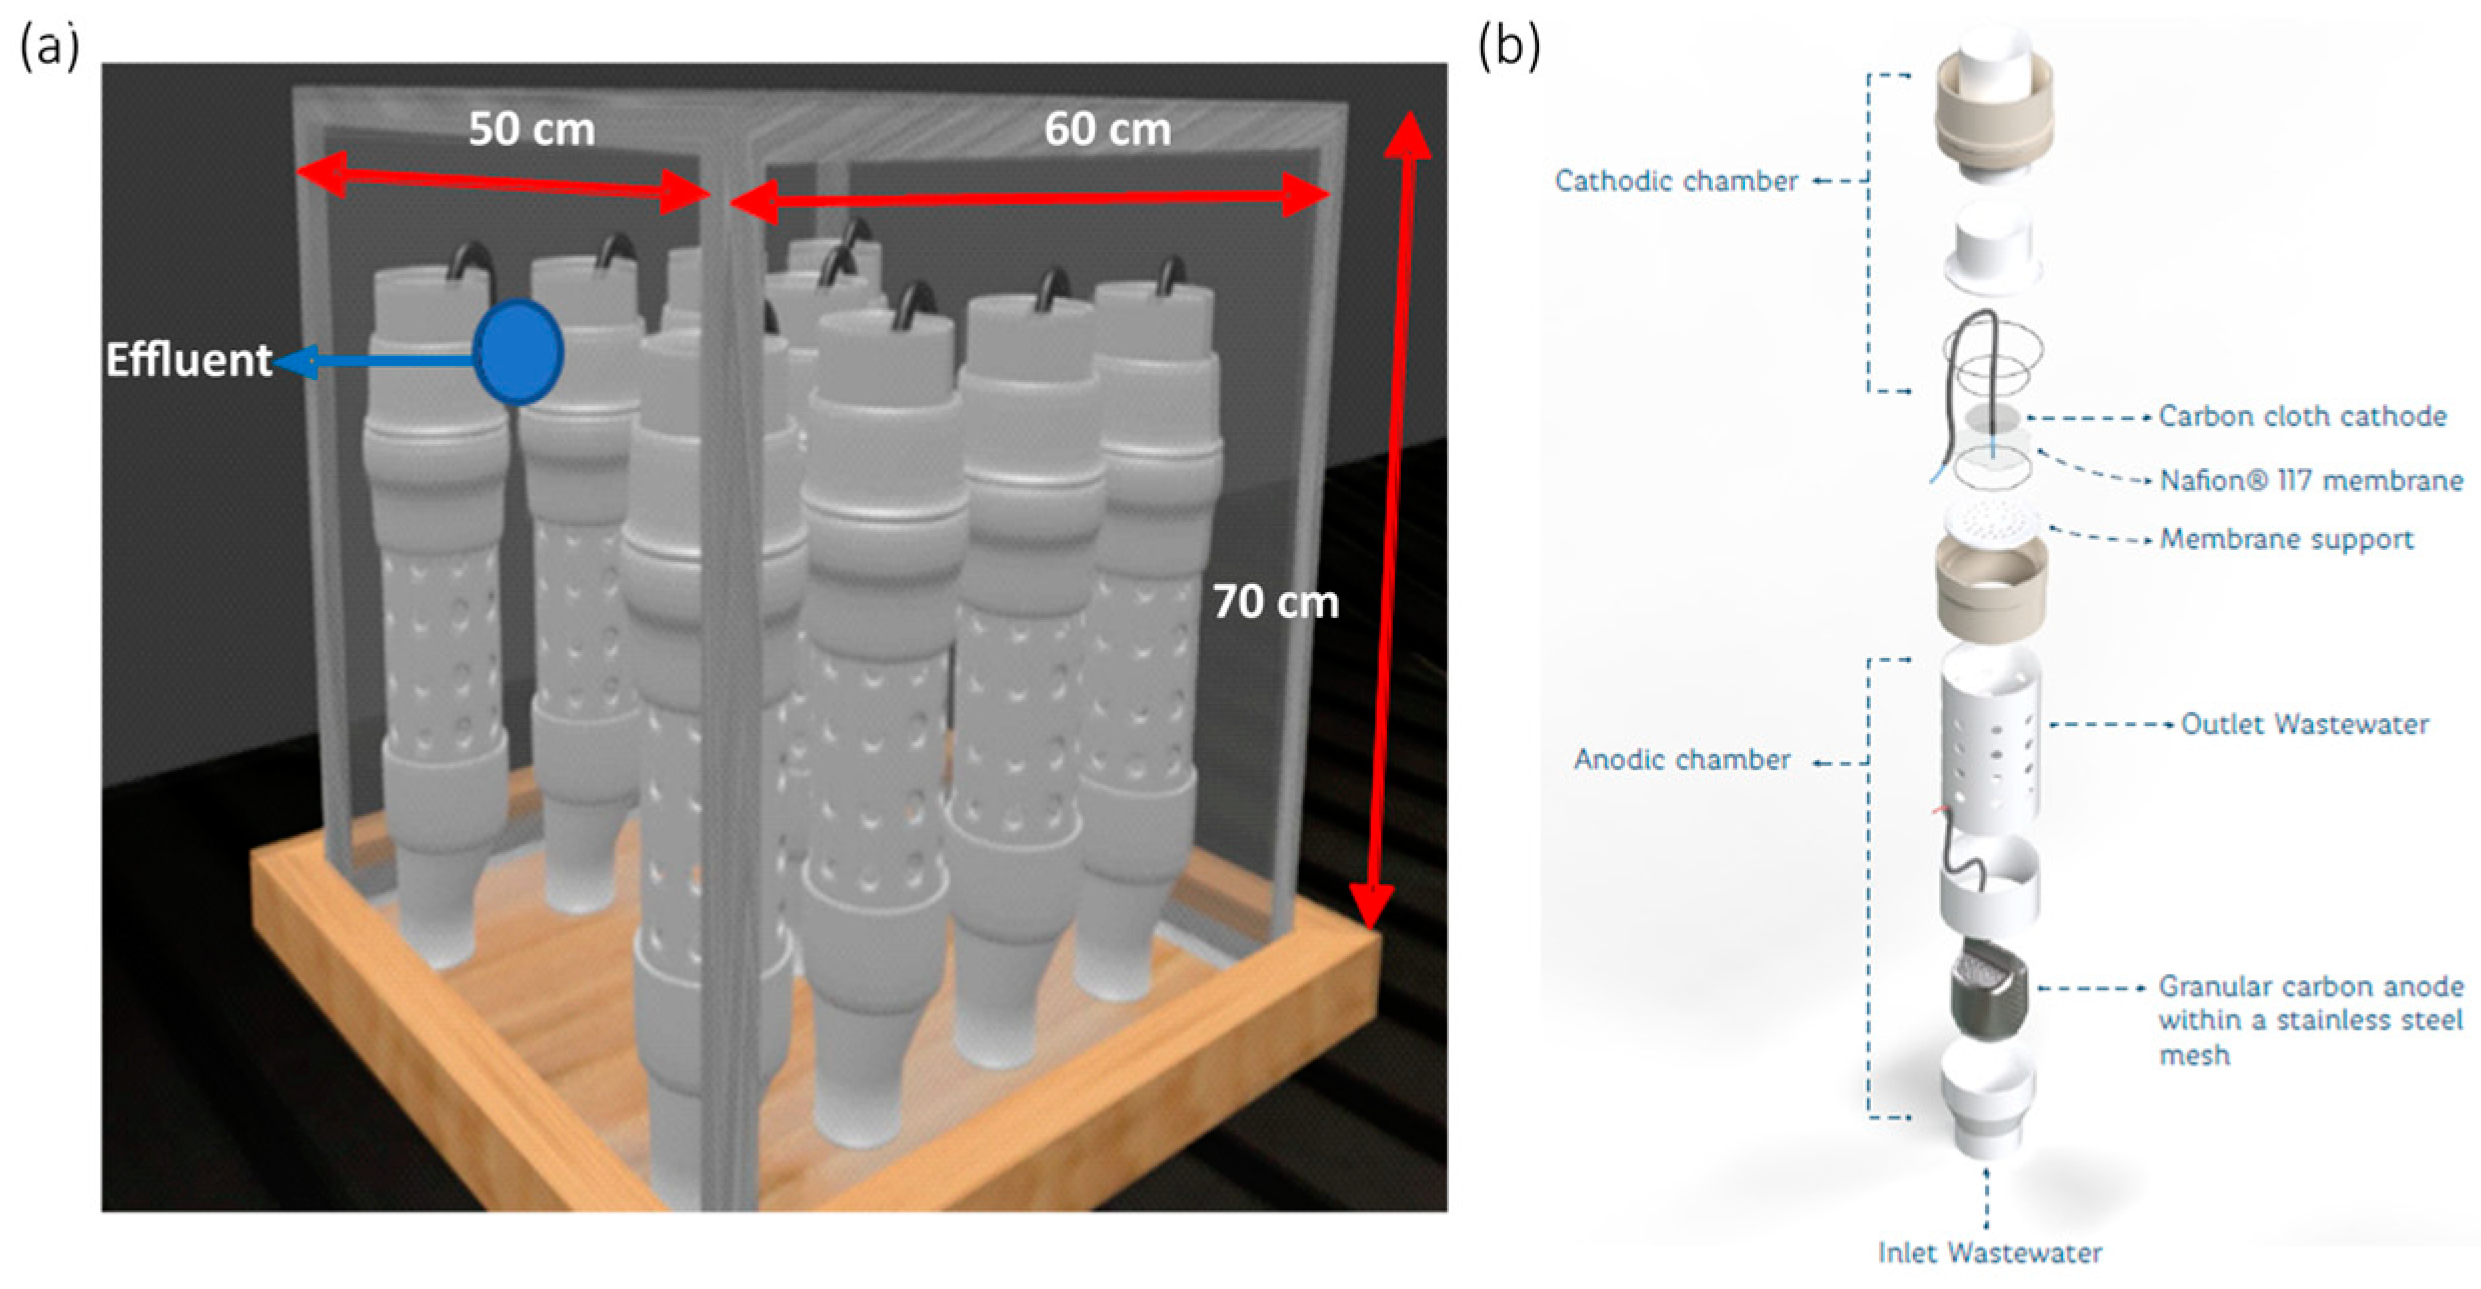
VFAs were determined on a Perkin Elmer Clarus® 500 gas chromatograph (Perkin Elmer, Waltham, MA, USA). A total of 0.5 mL of sample was prepared, and 100 µL of phosphoric acid and 0.5 mL of ether (49685, 300314 Merck Mexico, Company, San Andres Atoto, Naucalpan de Juárez, Mexico) were added and vortexed for one minute. A Perkin Elmer Clarus® 500 gas chromatograph equipped with a flame ionization detector (FID) and an Agilent HP-FFAP column (30 m length, 0.32 mm diameter, and 0. 25 µm film) were used. Nitrogen was used as carrier gas with a flow rate of 1 mL min−1; for FID, hydrogen gas, 45 mL min−1, and extra dry air, 450 mL min−1, were used. The operating temperatures were 230 °C for the injector, 150, 180, and 230 °C for the oven, and 230 °C in the detector, splitless mode [26,27]. Acetic, propionicand butyric acid were used as standards (45754, P1386, B103500 Merck Mexico, Company, San Andres Atoto, Naucalpan de Juárez, Mexico).

2.3. Building MFCs

2.3.1. Anodic Chamber

An anode chamber was built from a PVC reducer (10.16 to 5.08 cm) (Boxito, Merida Yucatan, Mexico), which was used as a support; then a tubular piece of 10.16 cm in diameter and 23 cm in height was placed, in which 1.27 cm holes were made to allow for access of the wastewater to the anode; each perforation had a distance of 4 cm [27].
To build the anode, 416 stainless-steel mesh and activated carbon (Fuel Cell Store, College Station, TX, USA) were used, according to Alzate-Gaviria et al. [28].

2.3.2. Membrane-Aerobic Cathode Electrode Assembly

A 10 × 10 cm Nafion® 117 membrane (Fuel Cell Store, College Station, TX, USA) was used, which, before its implementation, was activated as reported by Alzate-Gaviria et al. [27] and Atkinson et al. [29]. The Nafion 117® was attached on the cathode electrode and used as a diffuser; it was initially activated receiving a bath with a 3% hydrogen peroxide (216763 Merck Mexico, Company, San Andres Atoto, Naucalpan de Juárez, Mexico) solution at 100 °C for 1 h, after which it was washed with deionized water at 100 °C for 15 min; after that, it was immersed in a 1 M H2SO4 (258105 Merck Mexico, Company, San Andres Atoto, Naucalpan de Juárez, Mexico) solution at 100 °C for 1 h, and finally a wash was carried out with deionized water at 100 °C for 1 h. Once the process was completed, the membrane was kept in deionized water at room temperature until use.
A carbon cloth (Fuel Cell Store, College Station, TX, USA) with a diameter of 6.5 cm was used, and subsequently, an ink with a deposit density of 10 mg cm−2 composed of 5% Nafion® solution (1 mL), isopropyl alcohol (1.2 mL) (31175-20-9, W292907, Merck Mexico, Company, San Andres Atoto, Naucalpan de Juárez, Mexico), and XC-72 vulcanized carbon (120 mg) (Beyond Battery, Vision Exchange, Singapore 608526) was placed [30,31].
Once the membranes and cathodes with the ink were obtained, the membrane–electrode assembly process was performed using a CARVER® Press (Carver, Wabash, IN, USA) at a pressure of 300 lb in−2 at 110 °C for 5 min [29]. Furthermore, two membrane supports, a stainless-steel mesh terminal, and two threadable PVC pieces were used. In one of the threadable pieces, the lower support was placed, where the membrane–cathode electrode rested; finally, the other threadable piece was placed to join all the pieces.

2.3.3. Stack Assembly

A stack was built with nine MFCs, and they were placed in an acrylic cube with dimensions of 60 cm in length, 50 cm in width, and 70 cm in height (Figure 1). The cells were kept in an open circuit during the stabilization stage, and then the circuit was placed in energy recovery, which consisted of capacitors that allowed for energy storage [27,32].

2.4. Ultra-Low Power Circuit

The circuit used in this experiment was previously designed at the Yucatan Scientific Research Center (CICY). The electronic circuit to harvest energy from ultra-low-power sources comprised an integrated capacitor module with a set of capacitors, a microcontroller, two analog switch modules, each comprising a set of analog switches, an auxiliary battery module arrangement, a terminal, and an operation mode module with a solid-state battery (STEREN, Merida Yucatan, Mexico). The electronic circuit was to harvest energy from ultra-low-power sources within a voltage range of 0.1 V to 12 V [32].

2.5. Electrochemical Measurements

2.5.1. Voltage and Current

Voltage and current were measured with a Fluke® 1587 multimeter (Fluke Mexico Corporation, Col. del Valle, Ciudad de México, Mexico). Voltage was measured daily, and once the open voltage circuit presented stability, current was measured [33].

2.5.2. Polarization Curve and Power Density

The polarization curve was performed with a Biologic® PCV potentiostat (Bio-Logic Science Instruments, Seyssinet-Pariset, Grenoble, France), and the measurement was full-cell using a two-electrode configuration. As with voltage and current, the measurement was performed after the circuit was disconnected, and the cells presented a stable voltage [34].

2.5.3. Electrochemical Impedance Spectroscopy

Once the polarization curve measurement was concluded, electrochemical impedance spectroscopy measurements were performed with a two-electrode configuration (full cell), and a swept spectrum from 1 MHz to 100 mHz with 10 points per decade was used [35].

2.5.4. Coulombic Efficiency

Coulombic efficiency is calculated as the ratio of the total coulombs that are actually transported from the substrate to the anode to the maximum coulombs that could have been generated if all substrate removal resulted in current [36].
CE was calculated using the following equation:
CE   =   M   0 t I t d t   ( n   V   F   Δ C O D ) 1
where CE is coulombic efficiency, M is acetate molecular weight, ∫Itdt is the integral of the current over time, n is the number of moles exchanged, F is the Faraday constant, V is the anode volume, and ΔCOD is the substrate concentration change over the batch cycle.

2.6. Statistical Analysis

For comparisons between some data, an analysis of variance was performed between data sets with an α = 0.05 (Minitab Incorporated, 2017, State College, PA, USA).

3. Results and Discussion

3.1. Analytical Methods and Performance of MFCs (Stacked)

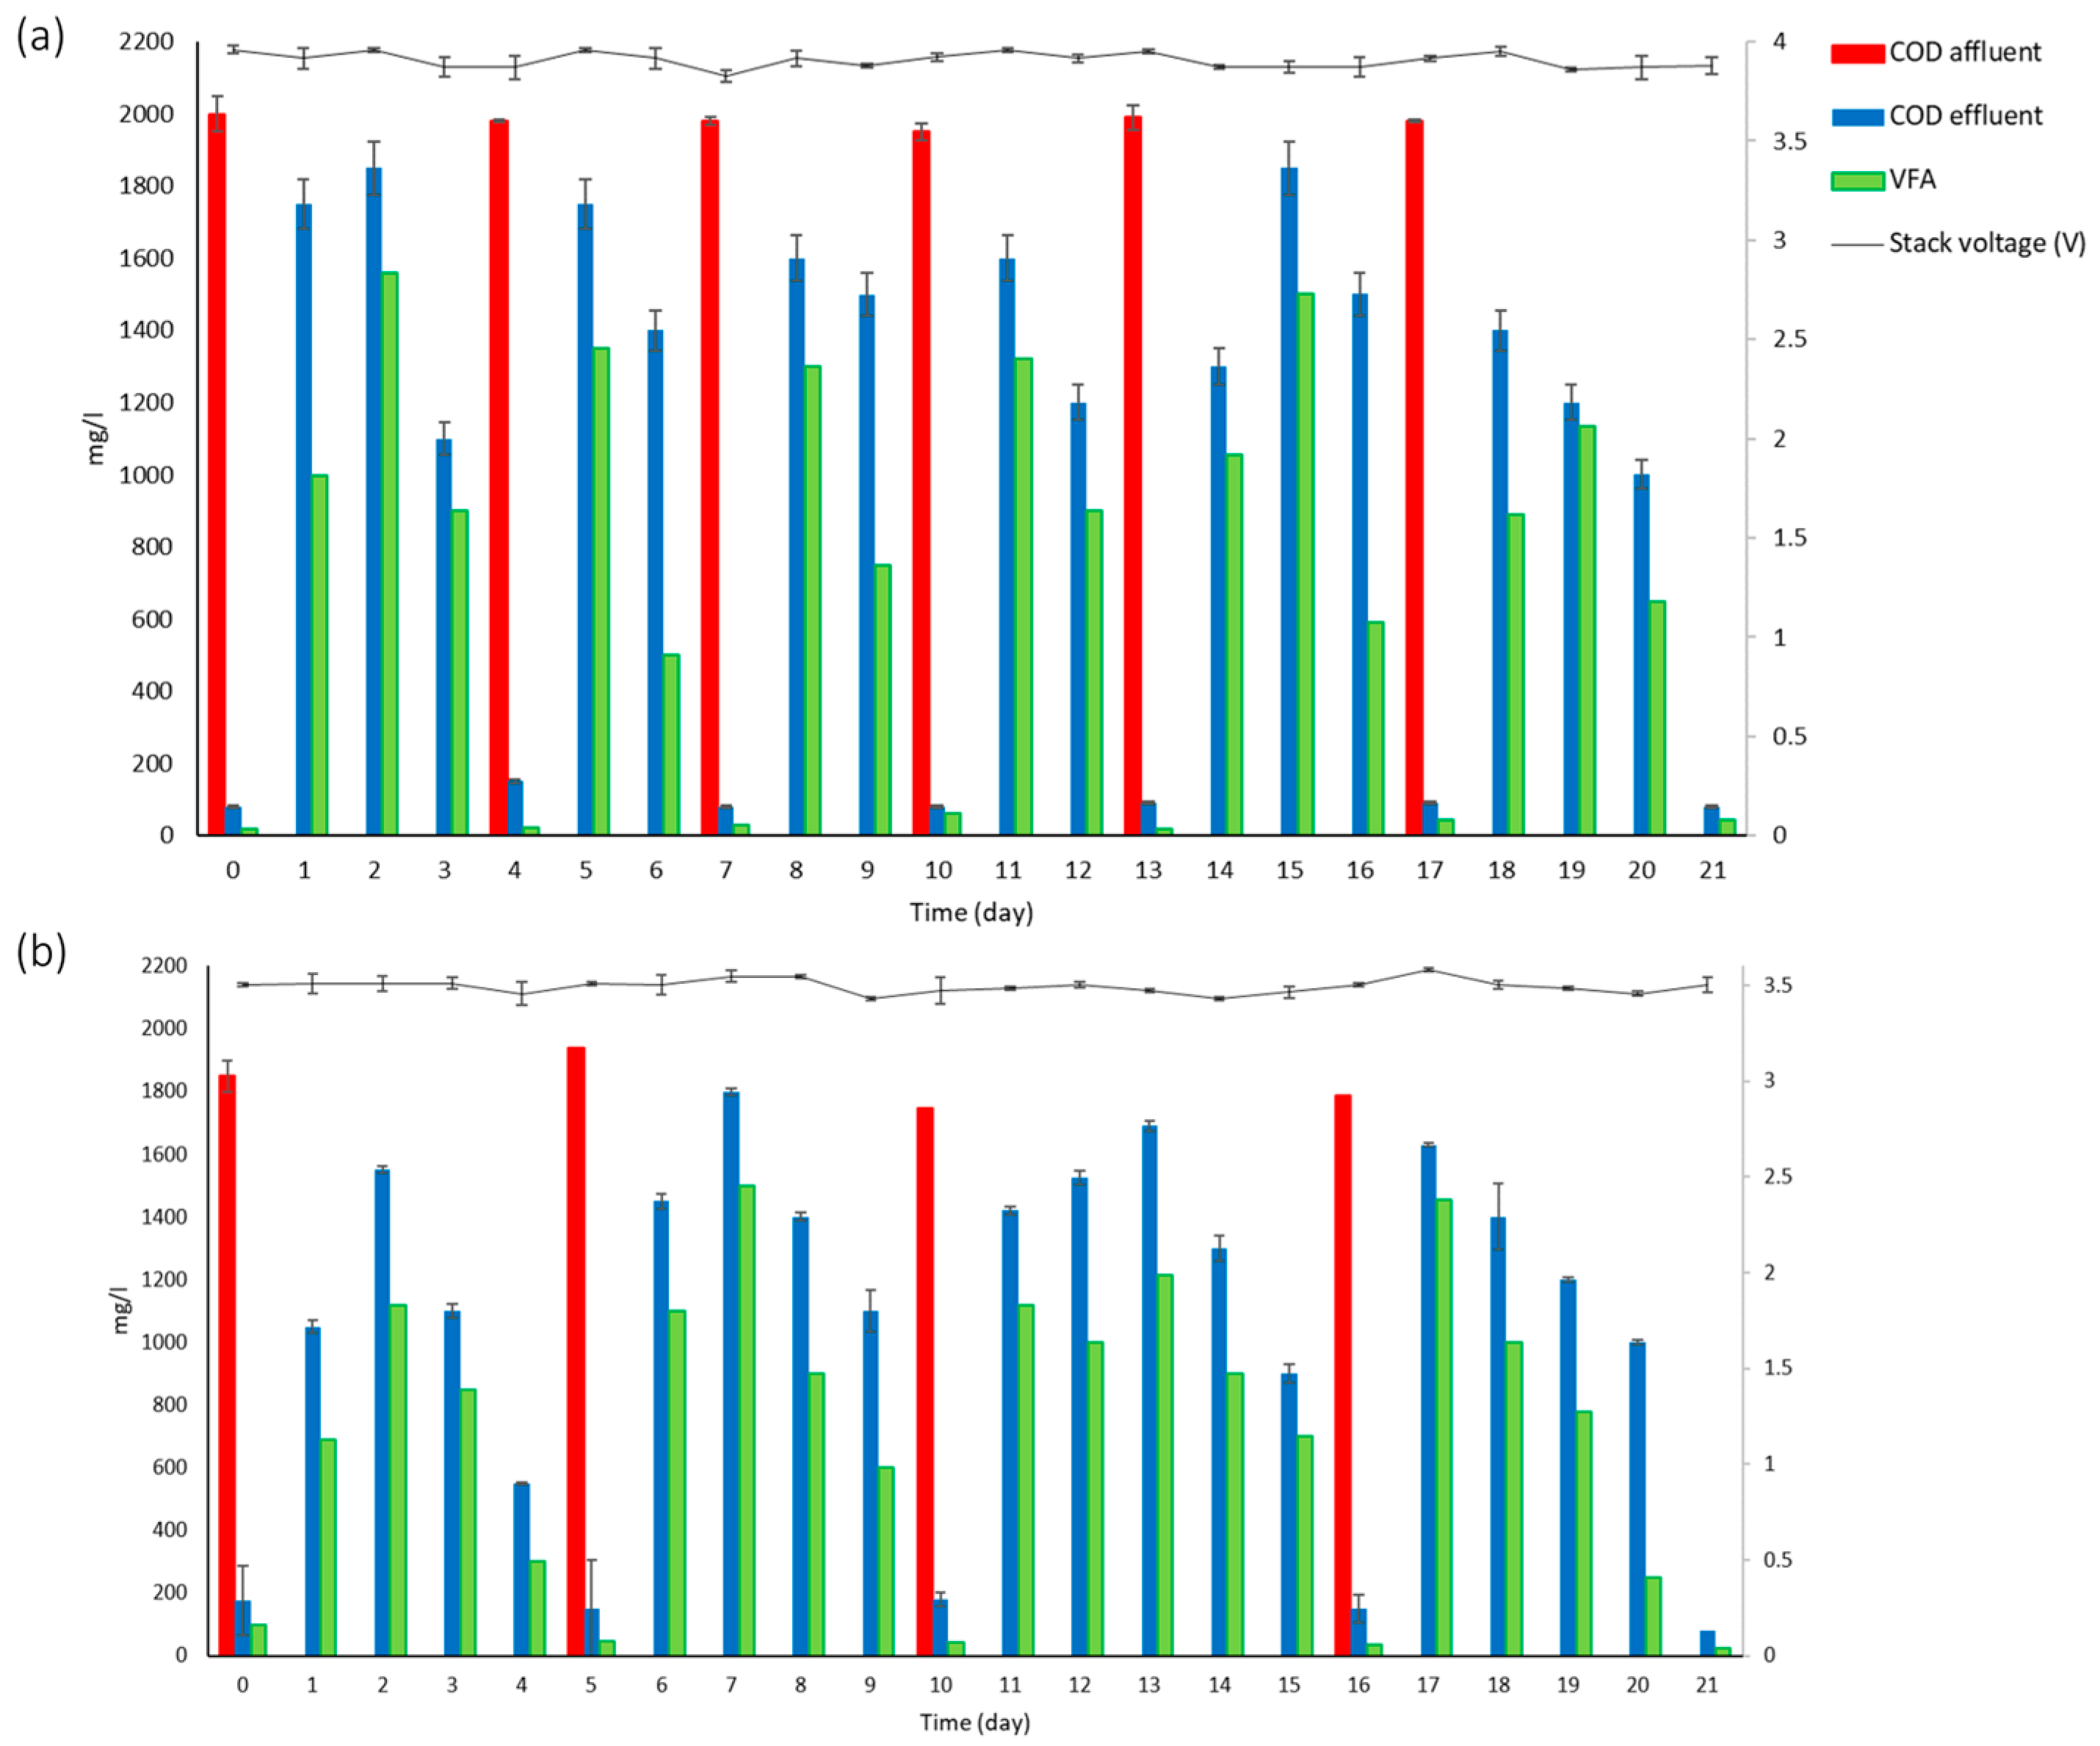
3.1.1. Chemical Oxygen Demand (COD)

The COD value was total COD. Once the voltage stabilized in the system, the synthetic brewery wastewater treatment was started (Figure 2a), replacing 135 L to reach 150 L of useful volume; according to the slope of the straight line, a removal rate of 1133.7 mg COD L−1 d−1 was obtained. The reactor was operated for 42 useful days; during the first 21 days, it presented six cycles between 3 and 4 days with a COD removal rate of 95 ± 1.4% at 26 ± 2 °C.
On the other hand, the CBW treatment (Figure 2b) presented cycles of 5–6 days with a COD elimination percentage of 93 ± 1.5%. A study by Feng et al. [12], which was among the first prototypes studied with a liquid volume of 28 mL, used titanium wire for the connection of an external circuit to carbon electrodes with real brewery wastewater with cycles of 4 days; however, its concentration was 1.3 times higher than the present study. It used Pt as a catalyst in the anode, buffer solution, and for temperature control (30 °C), influencing a better response (removing 98%). On the other hand, a study by Hiegemann et al. [37] tested an integrated 45 L pilot microbial fuel cell system connected in parallel over an external resistance box (RBox01, Voltcraft, Hirschau, Germany) to a current collector of cathodes with a stainless-steel mesh, using real brewery wastewater, which achieved an almost total removal of the initial concentration (510 mg L−1) in 6 days. Each cell was equipped with cathodes coated with platinum as a catalyst (0.5 mg cm2) and four PTFE (Polytetrafluoroethylene) diffusion layers on the air-facing side. In the case of a study conducted by Lu et al. [3], which had a 20 L microbial fuel cell system, voltages were measured every 15 min across an external resistor using a data acquisition system. It presented 7 days of cycles with 93% COD removal, with a concentration 1.7 times higher than that used in this study. They employed a tubular configuration of carbon-based cells and electrodes; they also used a carbon fiber cloth without any metal catalyst, a recirculation pump, mechanical oxygenation, and thermal pretreatment at the cathode. In a study by Dong et al. [11], a 90 L stackable pilot microbial fuel cell that used five independent capacitor-based circuits that were set to discharge alternately in a charging and discharging cycle of 5 min had 3 days of cycles with 0.45 times higher concentration than in the present study, presenting a COD removal rate of 1230 mg L−1 d−1, unlike the present study, which reached a COD removal rate of 992 mg L−1 d−1.

3.1.2. Performance of MFCs (Stacked)

Treatments with brewery wastewater show how voltage is dependent on COD removal, with maximum values of 0.44 and 0.39 V (individual MFC) and amplified voltage produced by serially connected capacitors of 4.1 and 3.6 V, respectively, for SBW and CBW (Figure 2a,b). In the study by Feng et al. [12], a voltage between 0.4 and 0.5 V, fed with brewery wastewater, was obtained, using Pt as catalyst in the cathode, which favored the voltage response. In agreement with this, in studies by Wen et al. [13] (180 mL volume, treating beer brewery wastewater) and Yu et al. [15] (working volume of 225 mL, single-chamber microbial fuel cells with brewery wastewater), the anode and cathode were connected by a copper wire with an external resistance of 100 Ω. These studies also used Pt as a catalyst and obtained voltages between 0.5 and 0.6 V. Driessen and Vereijken [38], who focused on a serpentine-type microbial fuel cell stack with 40 tubular air cathodes eating brewery wastewater, employed a stack with a usable volume of 10 L, reporting a total stack voltage of 23 V, with averages in each fuel cell of 0.58 and 0.64 V. Similarly, Dong et al. [11] obtained average values per fuel cell of 0.6 V in a usable volume of 90 L.

3.1.3. Volatile Fatty Acids

Chromatography analysis showed a dominant concentration of acetic acid, and only until day 2 did it present a low concentration of propionic acid (3 mg L−1) in SBW. The difference in the concentration of acids other than acetic acid is due to the limitation of the carbon source for propionate and butyrate, producing fermentative bacteria [39,40]. Maltose was one of the main components of SBW; this compound is a disaccharide that, when unfolded, gives rise to two units of D-glucose [41], and once this process occurs, it can take different routes (oxidation, fermentation, and/or biomass generation). Given that hydrolysis is required, it could be seen that the maximum generation of VFAs was between days 1 and 2 (after feeding). Compounds added in the SBW, in addition to maltose, also influence the production of VFAs, such as ethanol, which is thermodynamically more favorable for conversion to acetate compared to butyrate and propionate [41,42].
For CBW, all three types of acids were present, except for the last day, when only acetic acid was detected (between days 5 and 6), caused by the composition of the actual wastewater itself, which contained organic acids, mostly acetic acid, from beer production [41]. Generally, it was observed that acetate was predominant in the system; the presence of butyric acid (maximum concentration was 205 ± 59 mg L−1 on the first day) and propionic acid (maximum concentration was 95 ± 5 mg L−1 on the second day) were propitiated by the bacterial community; acetate and propionate, two of these acids, made the biggest contributions to the production of energy reported by Yu et al. [15], who found the presence of ethanol, acetate, butyrate, and propionate in an MFC fed with real brewery wastewater, which is consistent with the present study.

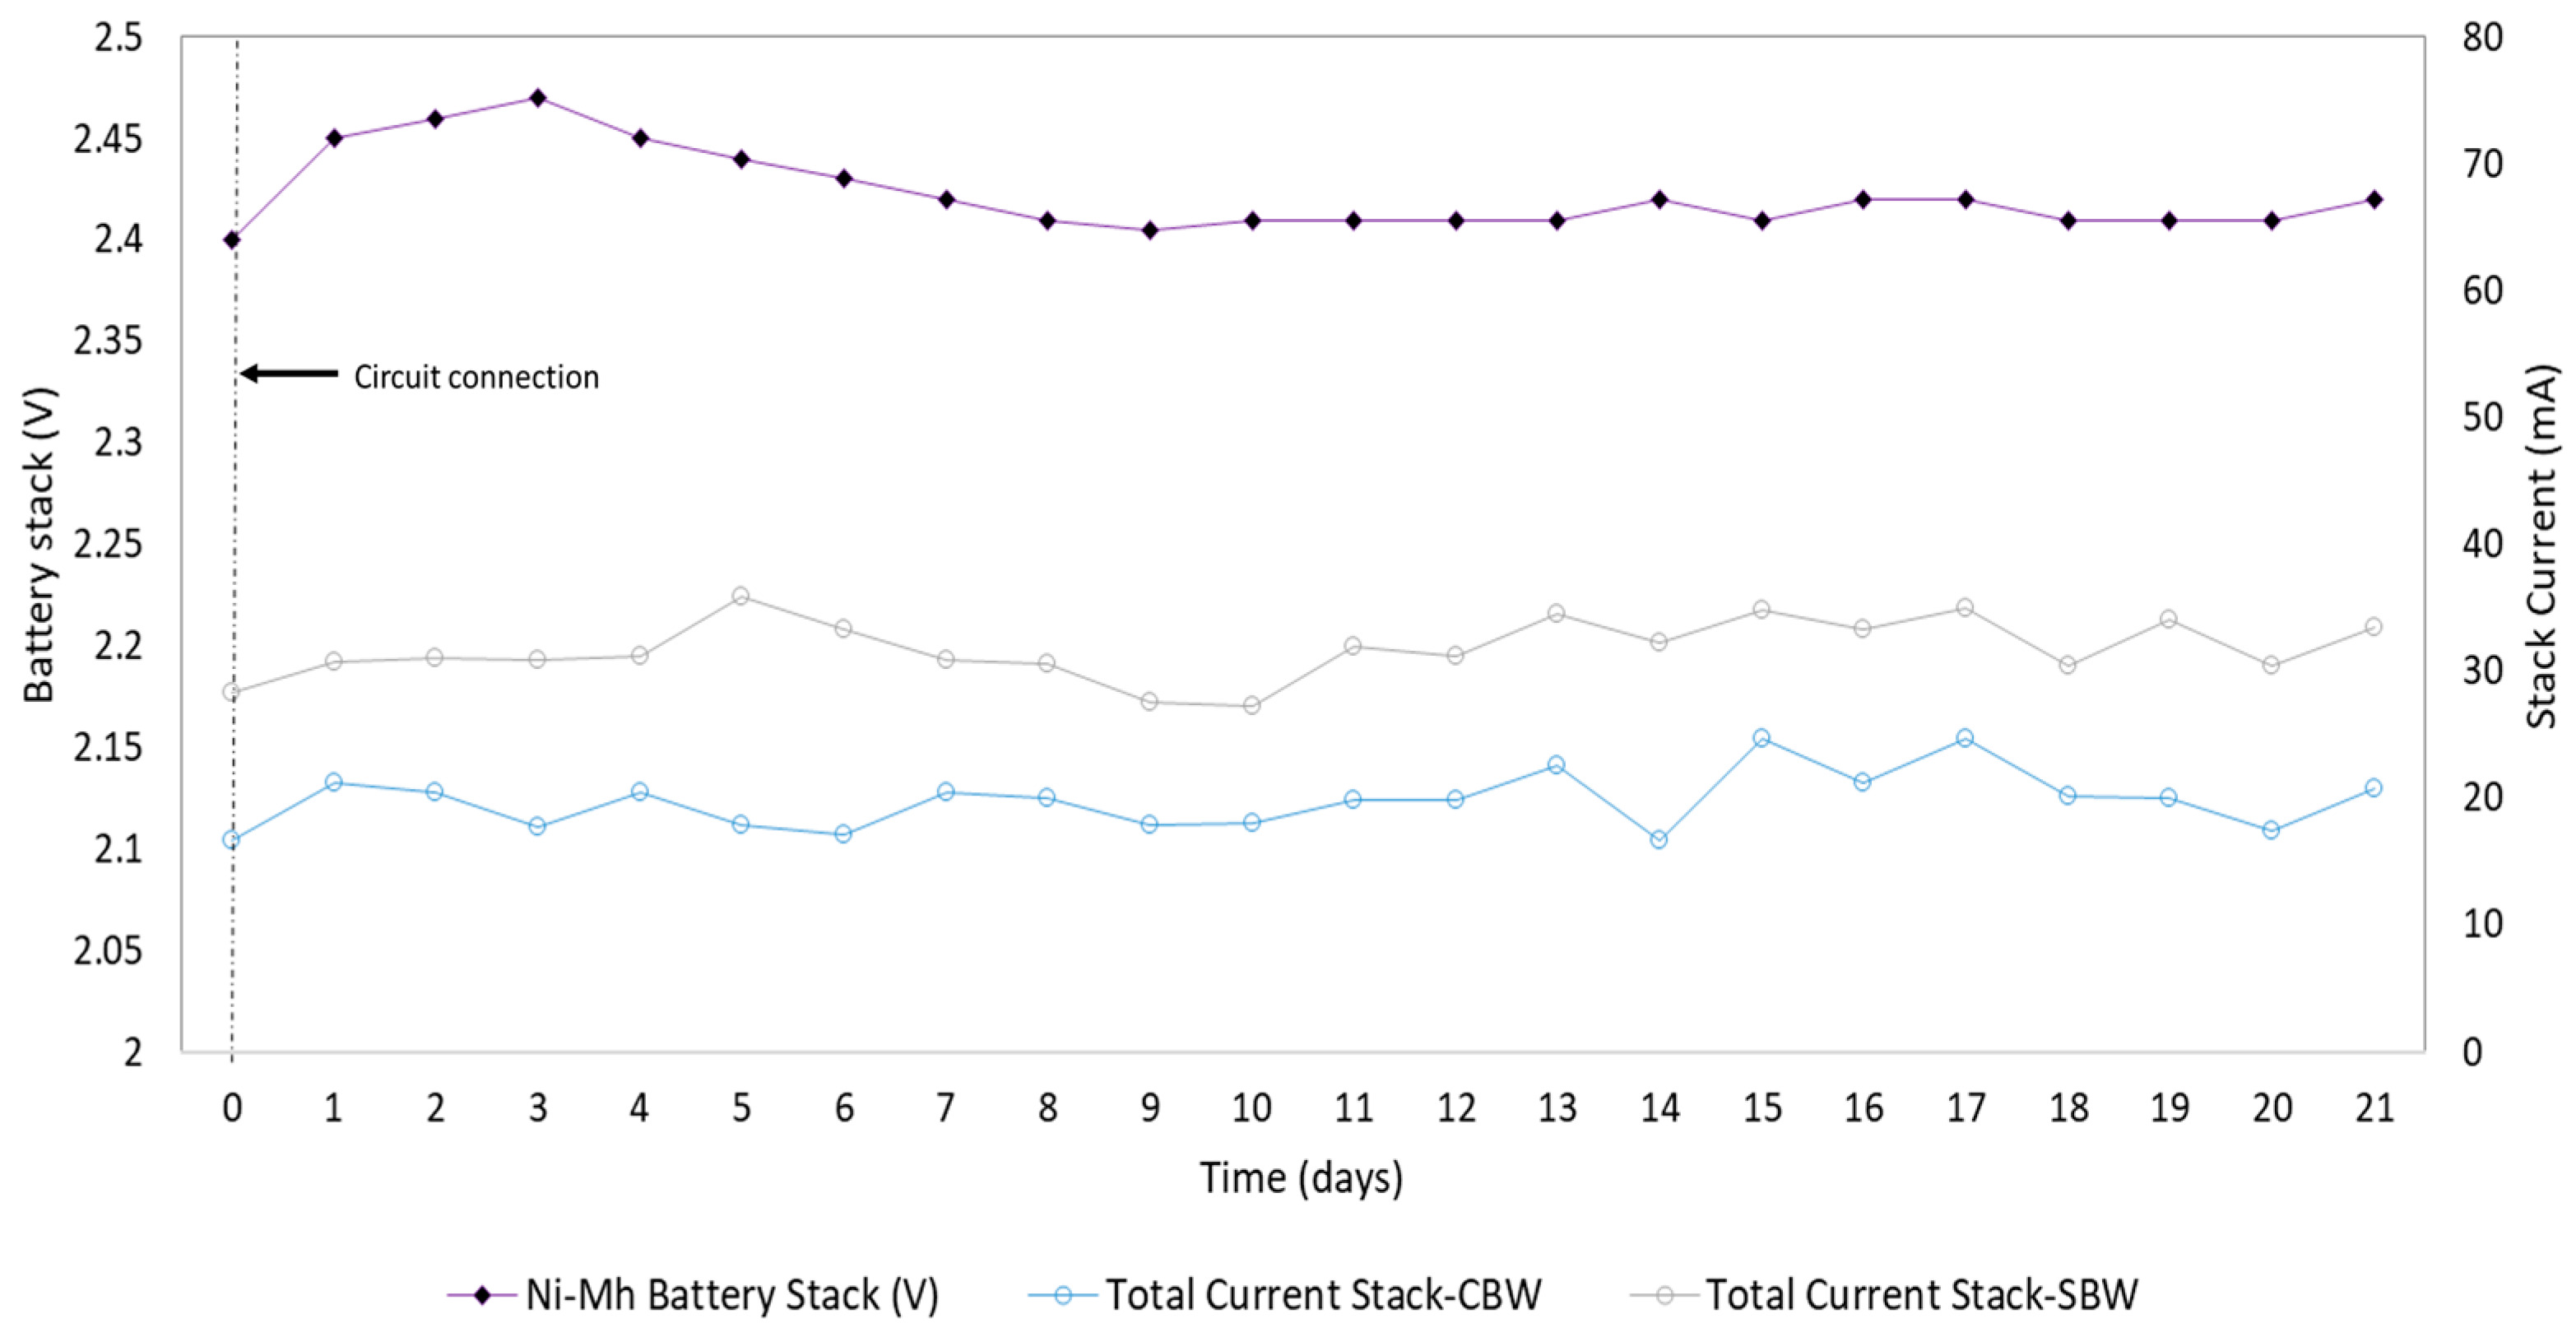
3.2. Ultra-Low-Power Circuit and Start-Up EHS Behavior

Although there are many EHSs described in the literature, it is crucial to pick one that best fits the system’s unique requirements [35,36,42,43]. It is crucial to keep in mind that the EHSs power source is a living organism; as a result, the amount of energy that may be harvested and the frequency at which this must be done must be considered.
The EHS used in this work was a capacitor-based system operated in an intermittent energy harvest (IEH) mode, because it has been reported that using this mode, it is possible to harvest twice as much energy compared to the continuous energy harvest (CEH) mode [36,44] and prevent voltage reversal in the cells. One of the main challenges in EHSs is the autonomy of the circuit. The circuit utilized in this study can self-power and keep a 2.4 V Ni-Mh battery charged (Figure 3). This is made possible by the energy harvesting for the nine MFCs in the stack, combined with the ultra-low consumption in the circuit (10.4 J) [45,46]. The total energy harvested by the nine cells depended on the capacitor charge time (CCT). When the CCT was 1 s, the energy harvested was 16 J, 65% higher than the energy consumption in the circuit, enabling the battery charge level to be maintained for the circuit to run on its own. A capacitor-based EHS was used in the ECOBOT III, harvesting 2 J of 48 MFCs with a microcontroller operating in a low mode, maintaining the energy level to power the ECOBOT functions [47].

3.3. Electrochemical Measurements

3.3.1. Coulombic Efficiency

Table 1 shows that the treatment of SBW had a CE of 57.2% ± 2.4. The presence of sulfate as a component of SBW stimulated the growth of sulfate-reducing bacteria, which reduce sulfate, obtaining sulfhydryl ions (HS-) [42] or hydrogen sulfide [43], which in turn are oxidized through the anodic respiration of these bacteria, thus increasing CE, as described and reported in different studies [44,45,46,47]. Given that throughout this treatment, there were fluctuations close to pH neutrality, which could be associated with the production of carbonates during the sulfate reduction process, it could be seen how the highest pH unit was present (7.55 ± 0.1) at the end of the treatment, which similarly occurred in a study of Cristiani et al. [48] and collaborators, who found that the system alkalinized as the carbon source used by sulfate-reducing bacteria was consumed.
In CBW treatment (Table 1), the reported range for brewery wastewater treatment CE ranges from 5.5 to 59 [3,11,12,13,14,15,49]. Although the literature exposes different electrochemical treatment options for better utilization of the substrate in electron recovery, it is not always related to higher COD removal efficiency, so wastewater treatment is closely related to other metabolic pathways, such as methanogenesis, including other electron donors and oxygen diffusion in wastewater [11,12,13]. In the case of the present study, a coulombic efficiency of 49.5% ± 0.71 was reported for craft brewery wastewater.

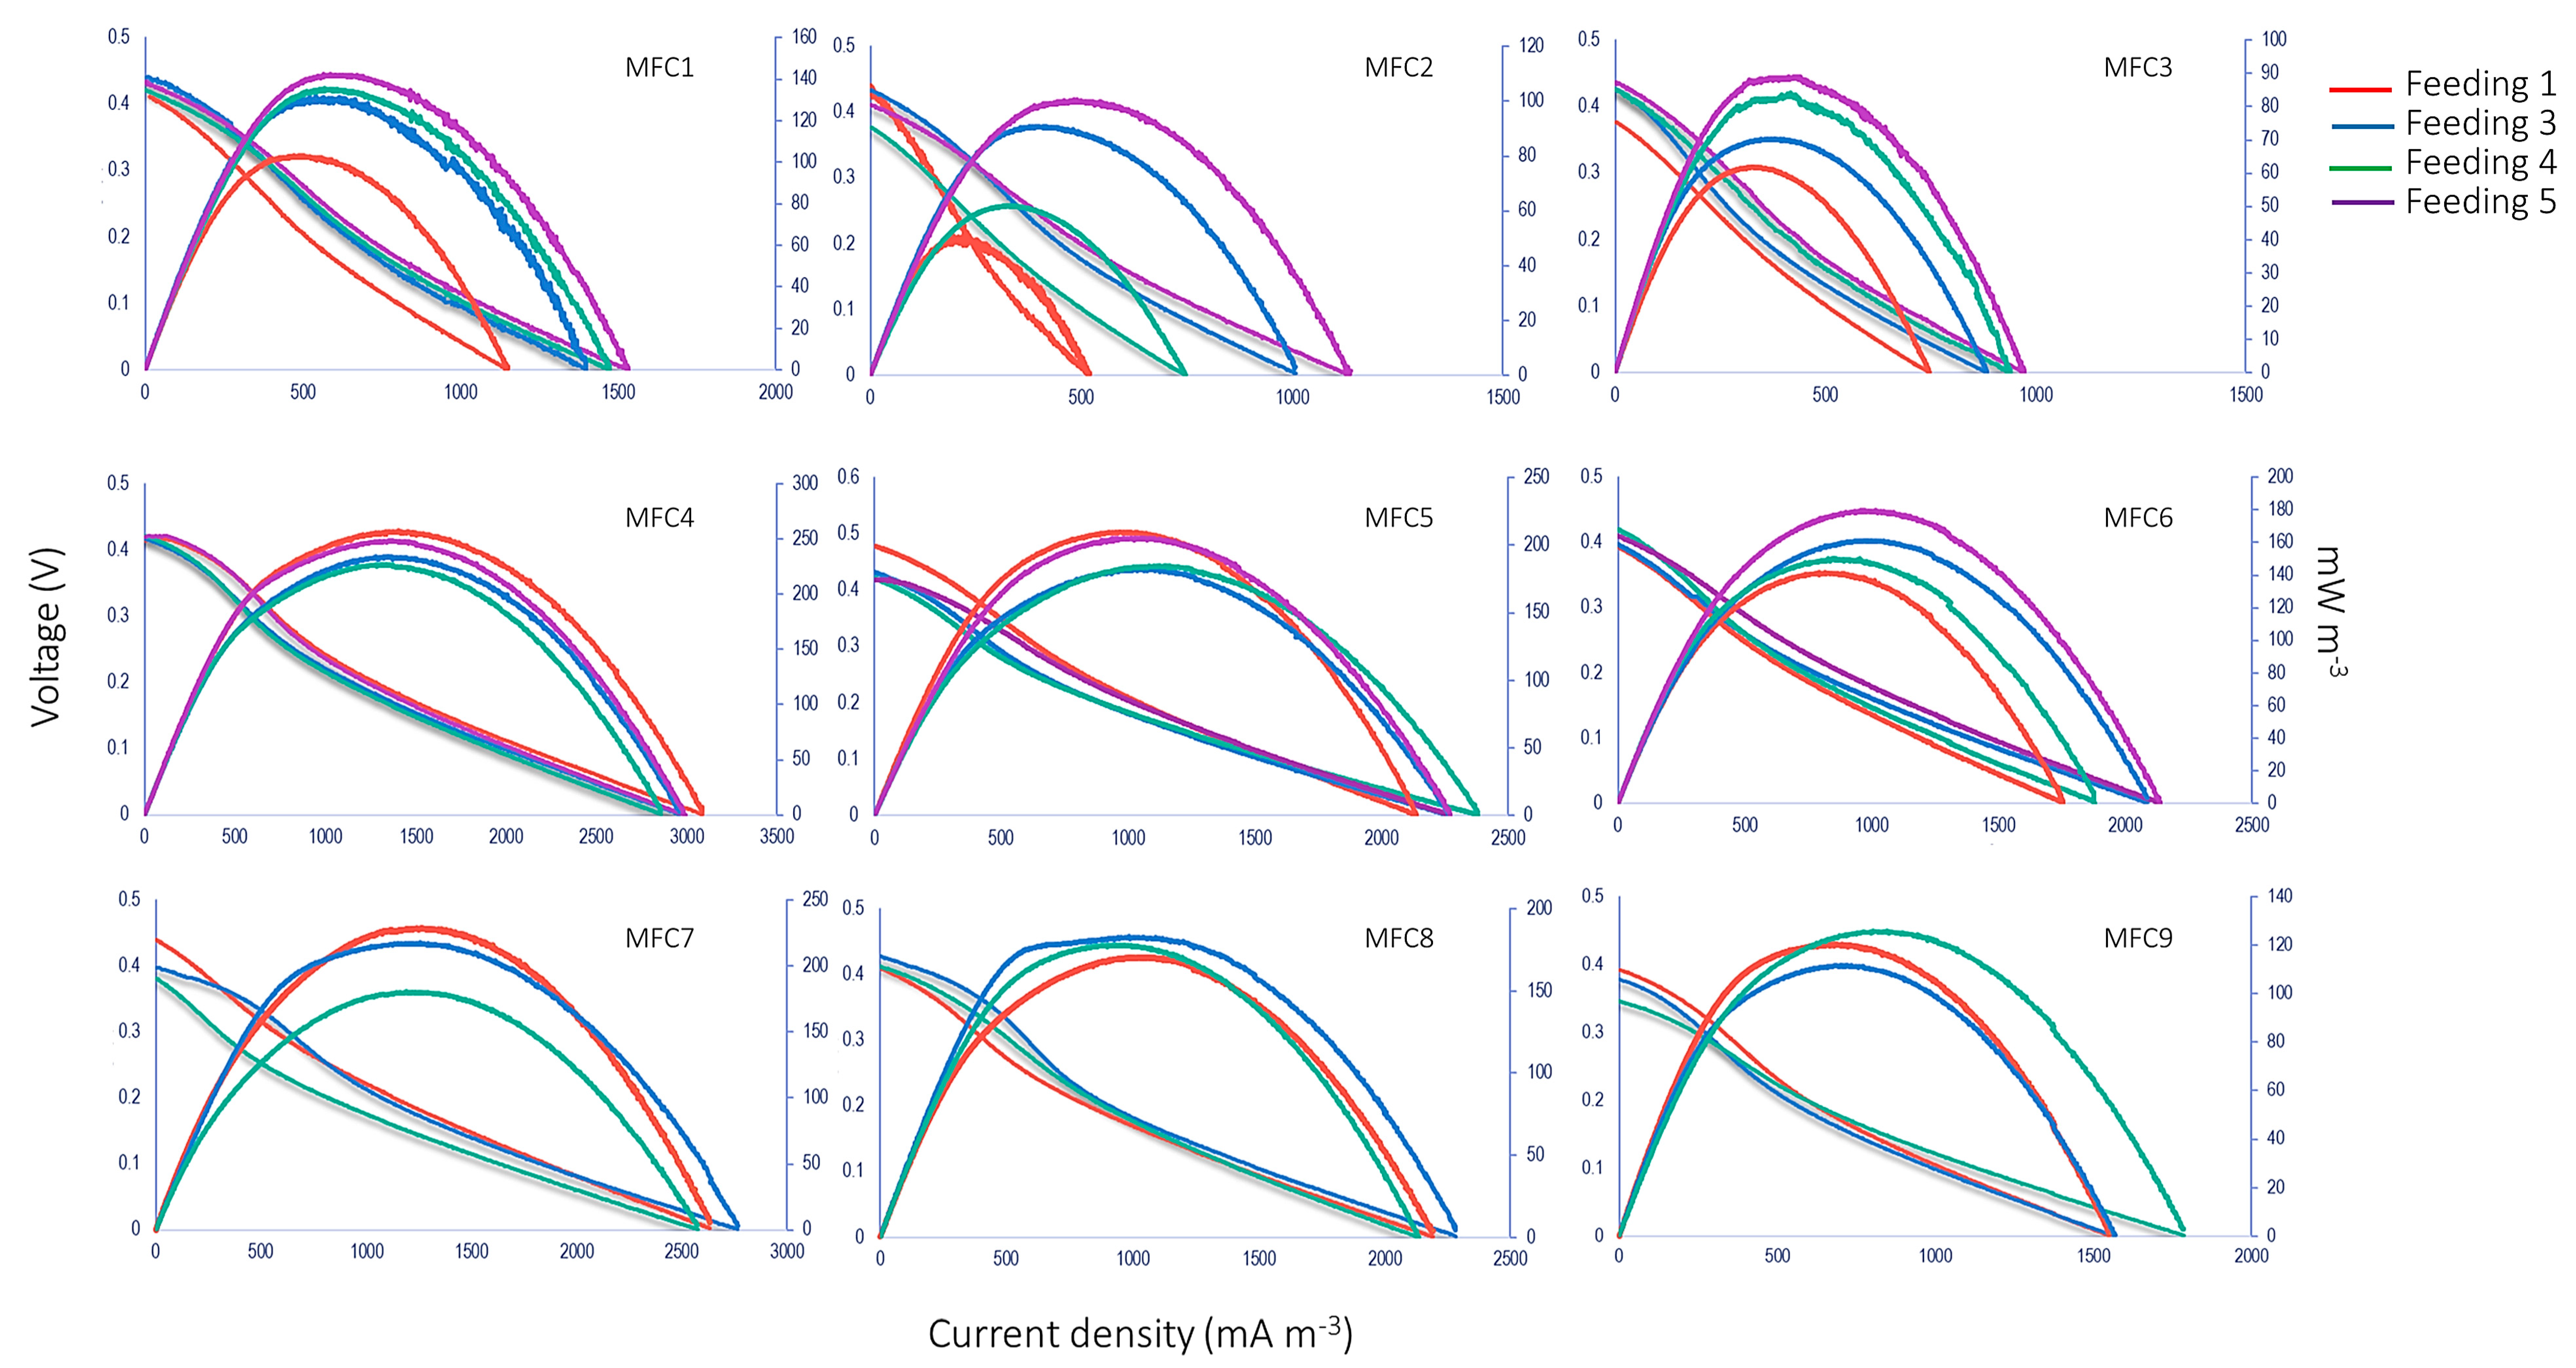
3.3.2. Polarization Curves

Figure 4 shows the behavior of the polarization curves of microbial fuel cells in the stack after the respective CBW feedings over time.
MFC1 obtained a power density in the last cycle of 225.36 mW m−3. On average, a power density of 235.60 ± 5.00 mW m−3 was generated. The sum of the power densities of the stack yielded a value of 1454.37 mW m−3 without a metal catalyst. The literature has reported that treatments with real brewery wastewater have presented power densities between 2944 and 9520 mW m−3 when employing cells with an aerated cathode and Pt as catalyst at the cathode [12,13,15]. The value obtained in the present study was more similar to the configuration performed by Moreno [33], with a maximum power density of 230.26 mW m−3. In a study reported by Zhuang et al. [14], which obtained a maximum power density of 4100 mW m−3 while employing a stack with a useful volume of 10 L for the treatment of brewery wastewater, the main differences that produced favorable results were the pretreatment of the cathode with a catalytic layer (Ni and MnO2) and variation of the connections (series and parallel) during the experimentation. On the other hand, in a study by Lu et al., [3], a power density of 440 mW m−3 was obtained, which is 3.5 times lower than that reported in the present study, in addition to having a thermal pretreatment at the cathode and forced oxygen flow at the cathode, which, on a larger scale, would represent external energy requirements to carry out the treatment.

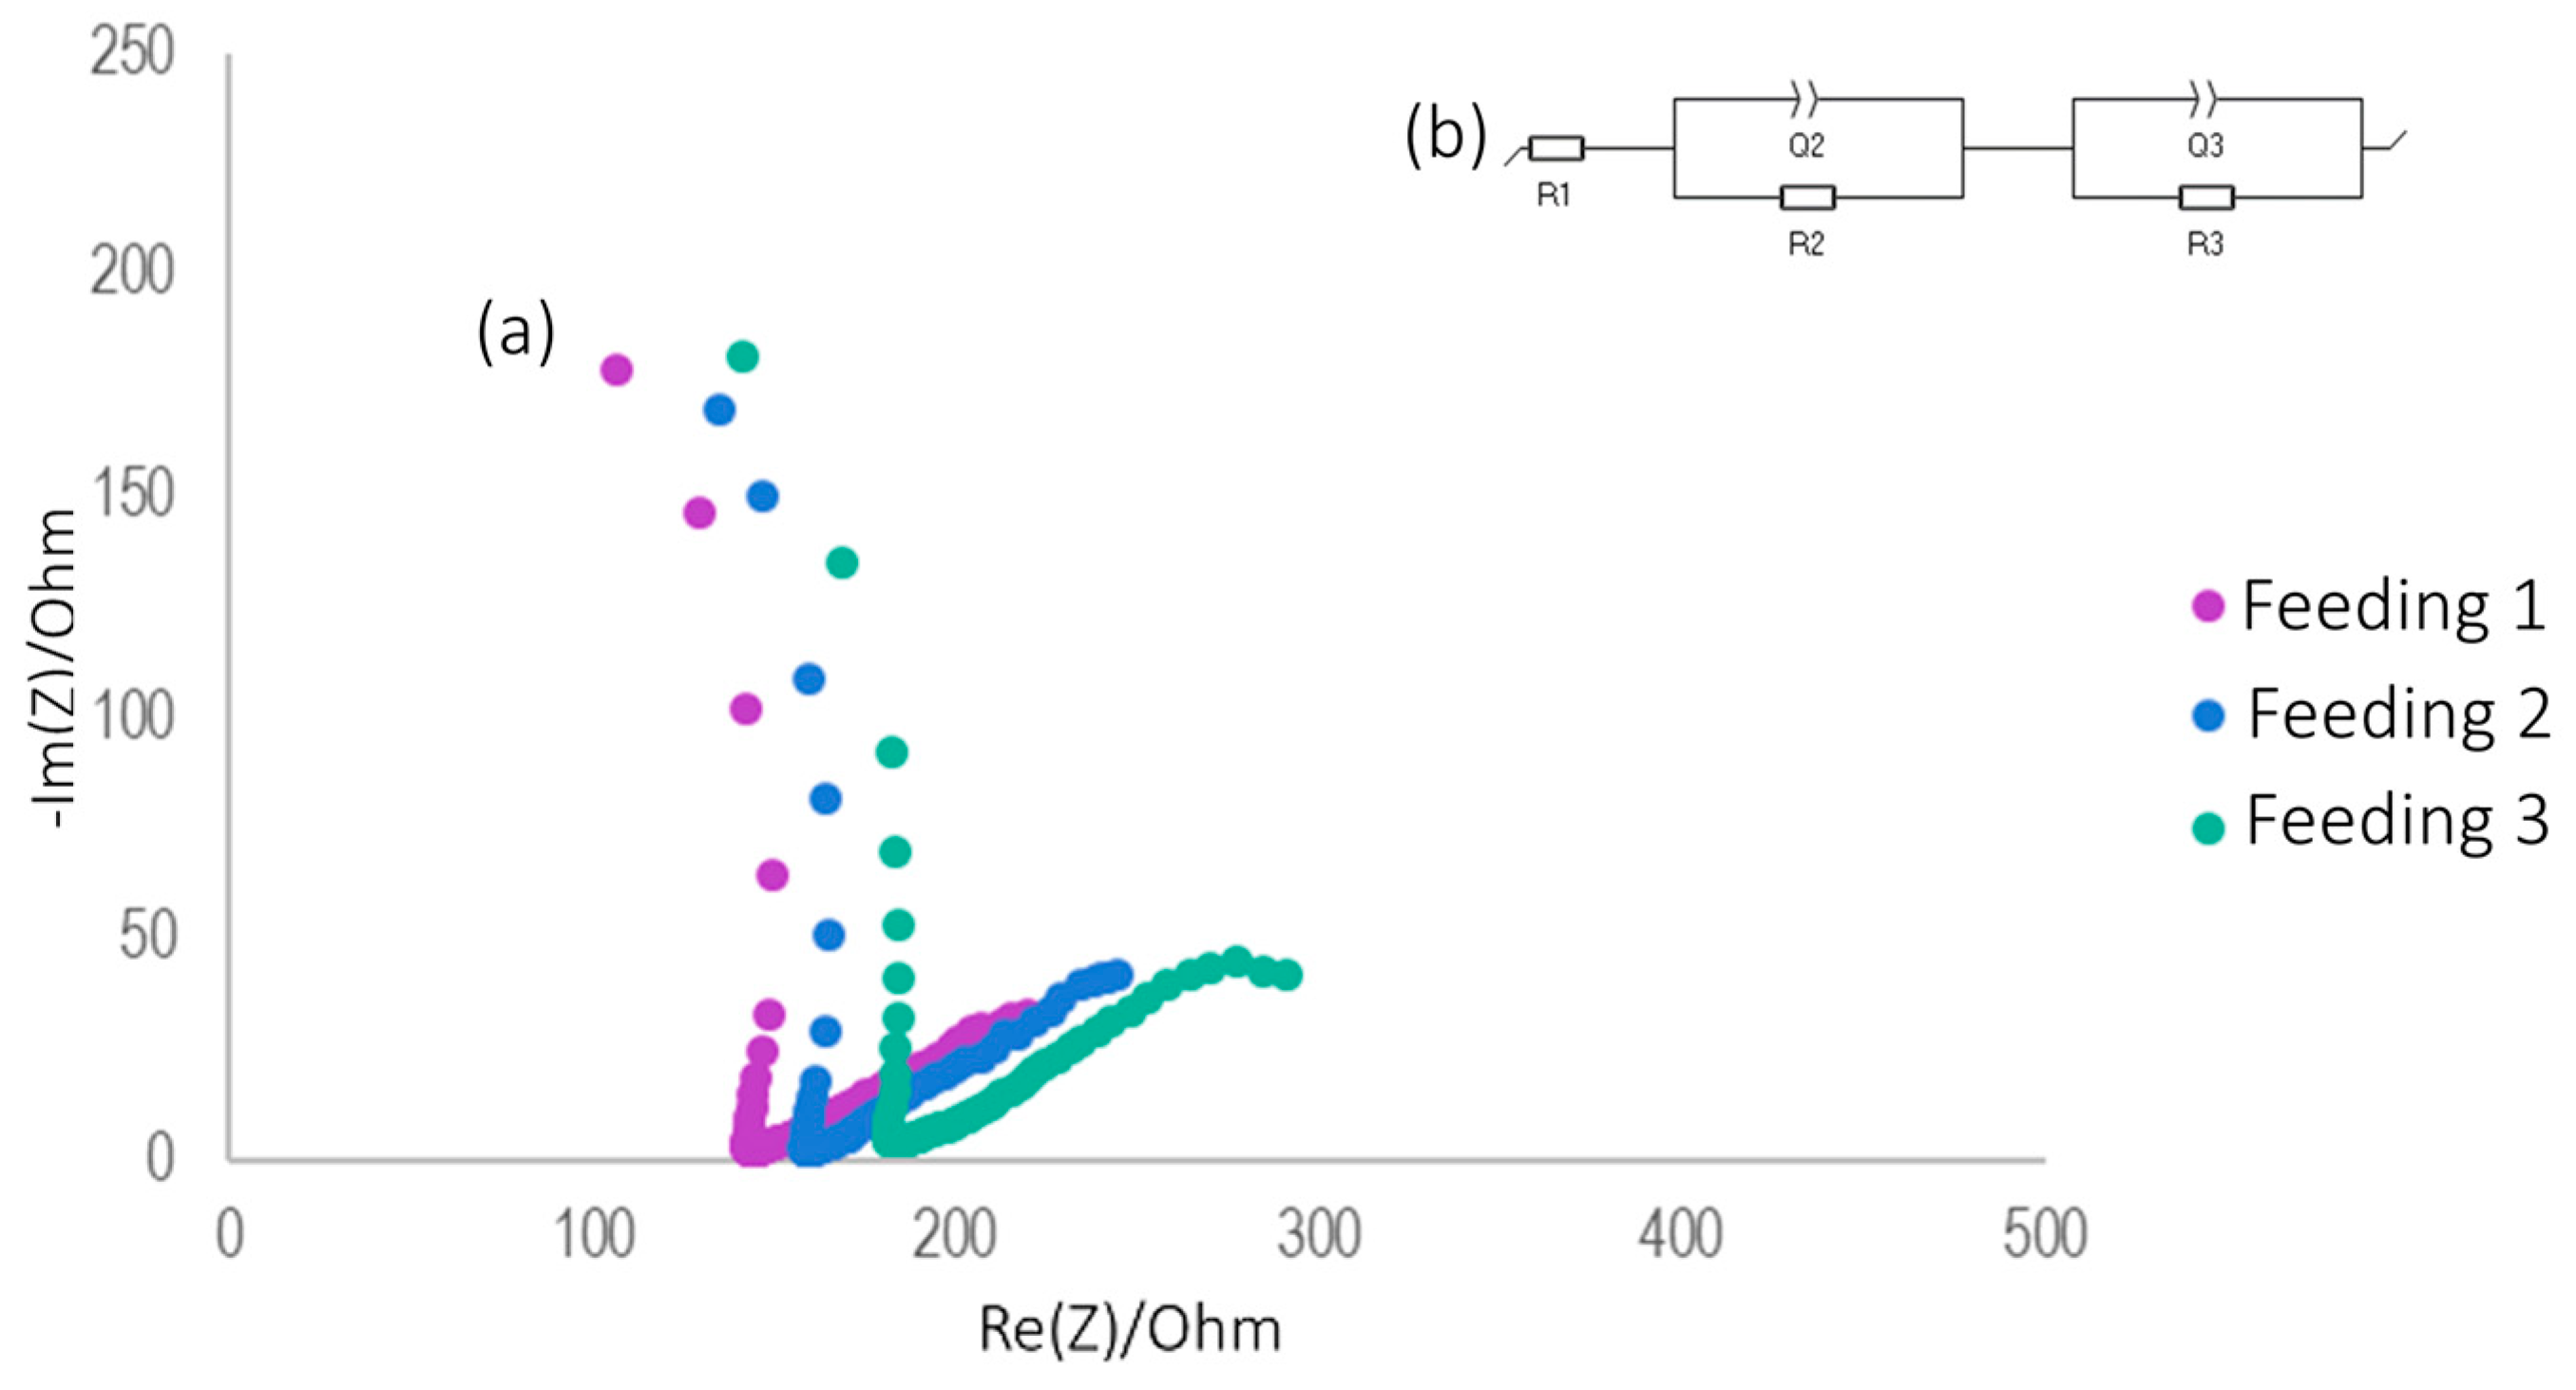
3.3.3. Electrochemical Impedance Spectroscopy

The experimental data were fitted using Ec-Lab® software (version 10.37). The whole-cell equivalent circuit circumscribes ohmic resistance, charge transfer process, and double layer, as well as diffusion and transfer processes [50,51,52,53].
The trend shown by the Nyquist diagrams (Figure 5a) shows the formation of two semicircles, which are represented by an equivalent circuit through a capacitor in parallel with a resistor [50,54]. Since the system was not a pure capacitor, the semicircles are represented by a constant-phase element, which is attributed to the heterogeneity of the electrode or reactions, named Q2 and Q3 [51,55], as presented in Figure 5b.
The resistance was characterized as ohmic resistance (R1), charge transfer resistance (R2), and diffusion resistance (R3) [31]. Figure 5b shows the general behavior of the resistances obtained during the CBW treatment. Likewise, it was concluded that the highest resistance was given by R2 (Table 2), which is the diffusion-controlled element and corresponds to proton transfer processes, followed by R3. However, the total internal resistance obtained with CBW water was between 198.9 and 208.9 Ω. Higher resistances have been reported during treatment with complex substrates such as cellulose (351 Ω) [56]. R1 represented a small fraction of the total internal resistance, only 3.5%, whereas R2 represented 78.1%, a very high percentage, mainly because no metal catalysts were used in the MFCs, with oxygen reduction at the cathode being the limiting process [50,54,57]. Finally, R3 accounted for 18.3% of the total internal resistance due to fouling processes and the development of biofilms on the air cathode as well as the accumulation of inert materials that can create a barrier to oxygen reduction [56].
Similarly, the study conducted by Feng et al. [12] for the treatment of brewery liquid waste using an aerated cathode reported a total internal resistance range between 595 and 4340 Ω, which was given through NaCl to adjust the conductivity, which was higher than the present study. Likewise, a study carried out by Çetinkaya et al. [58] had internal resistances between 130 and 45.26 Ω when employing microbial fuel cells fed by brewery wastewater and a subsequent treatment effluent from an anaerobic reactor, respectively. On the other hand, a study reported by Wang et al. [59], who performed impedance analysis in the treatment of brewery wastewater, obtained a low resistance between 4 and 35 Ω due to a cascade treatment of an agitated reactor followed by a microbial fuel cell.

4. Limitations

There are some limitations to this research study. The microflora was not identified in this study. Cattle and hog manure as well as the soil contain various microorganisms depending on many factors, including feed, hygiene, and location in the world, among others. Likewise, microbial community development in MFCs is complex and clearly affected by several factors in addition to anode potentials. However, electrochemically active microorganisms can be enriched from various natural sources, creating selective pressure on the microbial community to regulate respiratory pathways with a working bioanode potential, resulting in better wastewater treatment under maximum current or power.
The prototype was limited to 150 L, with a maximum hydraulic retention time of 5 days and a COD of 1831 ± 85 mg L−1 for craft brewery wastewater, and more studies need to be conducted in this way. However, to project a real-life scale, a sanitary hydraulic system must be designed, composed of an equalization tank followed by a holding containing the number of microbial fuel cells per liter, according to data obtained experimentally.

5. Conclusions

In this research, the batch operation of a scalable system stack of nine MFCs for craft brewery wastewater demonstrated its self-sustainability, reaching an organic matter removal measured through COD above 93 ± 1.8% without the use of external energy. In the impedance analysis, the total internal resistance was low (204.8 ± 5.2 Ω), without the use of a metal catalyst, with the reduction of oxygen being the limiting process. This study could be a viable foundation for large-scale MFC systems that could improve the technology for sustainable and energy-efficient wastewater treatment.

Author Contributions

O.Z.-M.: investigation, data curation, resources, supervision, project administration. D.V.-G.: investigation, writing—review and editing. R.T.-T.: conceptualization, supervision, project administration. J.D.-M.: data curation, validation, writing—review and editing. G.H.-Z.: data curation. E.E.-G.: data curation, validation, writing—review and editing. R.V.-O.: data curation, validation, writing—review and editing. L.A.-G.: resources, conceptualization, methodology, formal analysis, investigation, writing—original draft, visualization. All authors have read and agreed to the published version of the manuscript.

Funding

This work was supported by the Mexican National Council for Science and Technology, specifically through the CEMIE-Biogas-SENER (492405).

Institutional Review Board Statement

Not applicable.

Informed Consent Statement

Not applicable.

Data Availability Statement

The data are private but can be made available on request to the corresponding author.

Acknowledgments

The authors would like to express their gratitude to the Mexican National Council for Science and Technology for the master’s degree grant no. 421498.

Conflicts of Interest

The authors declare no conflicts of interest.

References

  1. CONAGUA. Numeragua México. Available online: https://sina.conagua.gob.mx/publicaciones/Numeragua_2022.pdf (accessed on 11 July 2023).
  2. De la Peña, M.E.; Ducci, J.; Zamora, V. Tratamiento de Aguas Residuales en México. 2013. Nota Técnica IDB-TN-521, 12. Available online: https://sswm.info/sites/default/files/reference_attachments/DE%20LA%20PE%C3%91A%20et%20al%202013.%20Tratamiento%20de%20aguas%20residuales%20en%20M%C3%A9xico..pdf (accessed on 23 July 2023).
  3. Lu, M.; Chen, S.; Babanova, S.; Phadke, S.; Salvacion, M.; Mirhosseini, A.; Chan, S.; Carpenter, K.; Cortese, R.; Bretschger, O. Long-term performance of a 20-L continuous flow microbial fuel cell for treatment of brewery wastewater. J. Power Sources 2017, 356, 274–287. [Google Scholar] [CrossRef]
  4. Hultberg, M.; Bodin, H. Fungi-based treatment of brewery wastewater—biomass production and nutrient reduction. Appl. Microbiol. Biotechnol. 2017, 101, 4791–4798. [Google Scholar] [CrossRef] [PubMed]
  5. Pant, D.; Van Bogaert, G.; Diels, L.; Vanbroekhoven, K. A review of the substrates used in microbial fuel cells (MFCs) for sustainable energy production. Bioresour. Technol. 2010, 101, 1533–1543. [Google Scholar] [CrossRef] [PubMed]
  6. Monroy, O.; Famá, G.; Meraz, M.; Montoya, L.; Macarie, H. Anaerobic digestion for wastewater treatment in Mexico: State of the technology. Water Res. 2000, 34, 1803–1816. [Google Scholar] [CrossRef]
  7. ACERMEX. Estado de la Industria de la Cerveza Artesanal. Available online: https://acermex.org/ (accessed on 11 July 2023).
  8. Alcántara-Hernández, R.J.; Taş, N.; Carlos-Pinedo, S.; Durán-Moreno, A.; Falcón, L.I. Microbial dynamics in anaerobic digestion reactors for treating organic urban residues during the start-up process. Lett. Appl. Microbiol. 2017, 64, 438–445. [Google Scholar] [CrossRef]
  9. Negassa, L.W.; Mohiuddin, M.; Tiruye, G.A. Treatment of brewery industrial wastewater and generation of sustainable bioelectricity by microbial fuel cell inoculated with locally isolated microorganisms. J. Water Process. Eng. 2021, 41, 102018. [Google Scholar] [CrossRef]
  10. Dong, Y.; Qu, Y.; He, W.; Du, Y.; Liu, J.; Han, X.; Feng, Y. A 90-liter stackable baffled microbial fuel cell for brewery wastewater treatment based on energy self-sufficient mode. Bioresour. Technol. 2015, 195, 66–72. [Google Scholar] [CrossRef]
  11. Feng, Y.; Wang, X.; Logan, B.E.; Lee, H. Brewery wastewater treatment using air-cathode microbial fuel cells. Appl. Microbiol. Biotechnol. 2008, 78, 873–880. [Google Scholar] [CrossRef]
  12. Wen, Q.; Wu, Y.; Cao, D.; Zhao, L.; Sun, Q. Electricity generation and modeling of microbial fuel cell from continuous beer brewery wastewater. Bioresour. Technol. 2009, 100, 4171–4175. [Google Scholar] [CrossRef]
  13. Zhuang, L.; Yuan, Y.; Wang, Y.; Zhou, S. Long-term evaluation of a 10-liter serpentine-type microbial fuel cell stack treating brewery wastewater. Bioresour. Technol. 2012, 123, 406–412. [Google Scholar] [CrossRef]
  14. Yu, J.; Park, Y.; Kim, B.; Lee, T. Power densities and microbial communities of brewery wastewater-fed microbial fuel cells according to the initial substrates. Bioprocess. Biosyst. Eng. 2015, 38, 85–92. [Google Scholar] [CrossRef] [PubMed]
  15. Guzmán-Ortíz, F.A.; Figueroa-Cárdenas, J.D.; Guadarramal-Lezama, A.Y.; Ambriz-Vidal, T.N.; Román-Gutiérrez, A.D.; Ronquillo de Jesús, E.; López-Perea, P. Characterization and evaluation of modern triticale (X Triticosecale Wittmack) lines for malt production and craft beer brewing. Rev. Mex. Ing. Química 2018, 17, 885–896. [Google Scholar] [CrossRef]
  16. Tabassum, N.; Islam, N.; Ahmed, S. Progress in microbial fuel cells for sustainable management of industrial effluents. Process Biochem. 2021, 106, 20–41. [Google Scholar] [CrossRef]
  17. Santoro, C.; Arbizzani, C.; Erable, B.; Ieropoulos, I. Microbial fuel cells: From fundamentals to applications. A review. J. Power Sources 2017, 356, 225–244. [Google Scholar] [CrossRef]
  18. Das, S.; Mangwani, N. Recent developments in microbial fuel cells: A review. J. Sci. Ind. Res. 2010, 69, 727–731. Available online: https://www.researchgate.net/publication/236872505_Recent_developments_in_microbial_fuel_cells_A_review (accessed on 15 February 2024).
  19. Feng, Y.; He, W.; Liu, J.; Wang, X.; Qu, Y.; Ren, N. A horizontal plug flow and stackable pilot microbial fuel cell for municipal wastewater treatment. Bioresour. Technol. 2014, 156, 132–138. [Google Scholar] [CrossRef]
  20. Wu, S.; Li, H.; Zhou, X.; Liang, P.; Zhang, X.; Jiang, Y.; Huang, X. A novel pilot-scale stacked microbial fuel cell for efficient electricity generation and wastewater treatment. Water Res. 2016, 98, 396–403. [Google Scholar] [CrossRef]
  21. Ge, Z.; He, Z. Long-term performance of a 200 liter modularized microbial fuel cell system treating municipal wastewater: Treatment, energy, and cost. Environ. Sci. Water Res. Technol. 2016, 2, 274–281. [Google Scholar] [CrossRef]
  22. Kim, T.; Yeo, J.; Yang, Y.; Kang, S.; Paek, Y.; Kwon, J.K.; Jang, J.K. Boosting voltage without electrochemical degradation using energy-harvesting circuits and power management system-coupled multiple microbial fuel cells. J. Power Sources 2019, 410–411, 171–178. [Google Scholar] [CrossRef]
  23. Ramadass, Y.K. Energy Processing Circuits for Low-Power Applications. Ph.D. Thesis, Massachusetts Institute of Technology, Cambridge, MA, USA, 2009. Available online: https://dspace.mit.edu/handle/1721.1/63026 (accessed on 19 July 2023).
  24. Ancona, V.; Caracciolo, A.B.; Borello, D.; Ferrara, V.; Grenni, P.; Pietrelli, A. Microbial fuel cell: An energy harvesting technique for environmental remediation. Int. J. Environ. Impacts 2020, 3, 168–179. [Google Scholar] [CrossRef]
  25. Alzate-Gaviria, L.; Fuentes-Albarran, C.; Alvarez-Gallegos, A.; Sebastian, J. Electricity Generation from a PEM Microbial Fuel Cell. Interciencia 2008, 33, 510–517. Available online: https://ve.scielo.org/scielo.php?pid=S0378-18442008000700008&script=sci_abstract&tlng=en (accessed on 15 February 2024).
  26. Tam, K.; Yang, C.-H.; Matsumoto, M.R.; Crowley, D.E.; Sheppard, J.D. Comparison of PCR-DGGE and selective plating methods for monitoring the dynamics of a mixed culture population in synthetic brewery wastewater. Biotechnol. Prog. 2005, 21, 712–719. [Google Scholar] [CrossRef]
  27. Alzate-Gaviria, L.; Tapia-Tussell, R.; Domínguez-Maldonado, J.; Chable-Villacis, R.; Rosiles-González, G.; Hernández-Zepeda, C. Removal of Coliphage MS2 Using a Microbial Fuel Cell Stack. Water 2021, 13, 2756. [Google Scholar] [CrossRef]
  28. Alzate-Gaviria, L.; García-Rodríguez, O.; Flota-Bañuelos, M.; Del Rio Jorge-Rivera, F.; Cámara-Chalé, G.; Domínguez-Maldonado, J. Stacked-MFC into a typical septic tank used in public housing. Biofuels 2016, 7, 79–86. [Google Scholar] [CrossRef]
  29. Atkinson, R.W.; Hazard, M.W.; Rodgers, J.A.; Stroman, R.O.; Gould, B.D. An open-cathode fuel cell for atmospheric flight. J. Electrochem. Soc. 2017, 164, F46–F54. [Google Scholar] [CrossRef]
  30. Prakash, G.K.S.; Viva, F.A.; Bretschger, O.; Yang, B.; El-Naggar, M.; Nealson, K. Inoculation procedures and characterization of membrane electrode assemblies for microbial fuel cells. J. Power Sources 2010, 195, 111–117. [Google Scholar] [CrossRef]
  31. Nandy, A.; Kumar, V.; Mondal, S.; Dutta, K.; Salah, M.; Kundu, P.P. Performance evaluation of microbial fuel cells: Effect of varying electrode configuration and presence of a membrane electrode assembly. N. Biotechnol. 2015, 32, 272–281. [Google Scholar] [CrossRef] [PubMed]
  32. Alzate-Gaviria, L.M.; Dominguez-Maldonado, J.A.; Del Rio-Rivera, F.J.; Flota-Banuelos, M.I.; Camara-Chale, G.R. Electronic Circuit for Harvesting Energy from Ultra-Low Power Sources. U.S. Patent No. 10,734,822; Filed 27 November 2015, and issued 4 August 2020, Available online: https://patents.google.com/patent/US10734822B2/en (accessed on 23 July 2023).
  33. Moreno, D. 2017 Evaluación de Tres Membranas y un Cátodo Aireado en Cuatro Stacks de Celdas de Combustible Microbianas. Yucatan Center for Scientist Research, Yucatan, 2017. Available online: https://cicy.repositorioinstitucional.mx/jspui/handle/1003/425 (accessed on 23 July 2023).
  34. Prasad, J.; Tripathi, R.K. Energy harvesting from sediment microbial fuel cell to supply uninterruptible regulated power for small devices. Int. J. Energy Res. 2019, 43, 2821–2831. [Google Scholar] [CrossRef]
  35. Carreon-Bautista, S.; Erbay, C.; Han, A.; Sanchez-Sinencio, E. An Inductorless DC–DC Converter for an Energy Aware Power Management Unit Aimed at Microbial Fuel Cell Arrays. IEEE J. Emerg. Sel. Top. Power Electron. 2015, 3, 1109–1121. [Google Scholar] [CrossRef]
  36. Khaled, F.; Ondel, O.; Allard, B.; Degrenne, N. Voltage balancing circuit for energy harvesting from a stack of serially-connected Microbial Fuel Cells. In Proceedings of the 2013 IEEE ECCE Asia Downunder, Melbourne, Australia, 3–6 June 2013; pp. 392–397. [Google Scholar] [CrossRef]
  37. Hiegemann, H.; Herzer, D.; Nettmann, E.; Lübken, M.; Schulte, P.; Schmelz, K.-G.; Gredigk-Hoffmann, S.; Wichern, M. An integrated 45 L pilot microbial fuel cell system at a full-scale wastewater treatment plant. Bioresour. Technol. 2016, 218, 115–122. [Google Scholar] [CrossRef]
  38. Driessen, W.; Vereijken, T. Recent Developments in Biological Treatment of Brewery Effluent. 2003. Available online: https://citeseerx.ist.psu.edu/document?repid=rep1&type=pdf&doi=a25dd02e8e8ee8b12046e99c73f783ed5ad3b29b (accessed on 24 July 2023).
  39. Freguia, S.; Teh, E.H.; Boon, N.; Leung, K.M.; Keller, J.; Rabaey, K. Microbial fuel cells operating on mixed fatty acids. Bioresour. Technol. 2010, 101, 1233–1238. [Google Scholar] [CrossRef]
  40. Linstromberg, W. Curso Breve de Química Orgánica. Reverté. España. 1977. Available online: https://books.google.com.mx/books?hl=es&lr=&id=PsUuSiY4YH0C&oi=fnd&pg=PA219&dq=Curso+breve+de+qu%C3%ADmica+org%C3%A1nica.+Revert%C3%A9.+Espa%C3%B1a&ots=qV0Ss1DRSk&sig=G4DyoBkS_dbviKtLCbSjao3ejjI&redir_esc=y#v=onepage&q=Curso%20breve%20de%20qu%C3%ADmica%20org%C3%A1nica.%20Revert%C3%A9.%20Espa%C3%B1a&f=false (accessed on 11 July 2023).
  41. Simate, G.S.; Cluett, J.; Iyuke, S.E.; Musapatika, E.T.; Ndlovu, S.; Walubita, L.F.; Alvarez, A.E. The treatment of brewery wastewater for reuse: State of the art. Desalination 2011, 273, 235–247. [Google Scholar] [CrossRef]
  42. González-Muñoz, M. Bacterias Reductoras de Sulfato de Sedimentos Costeros Como una Alternativa Para la Generación de Energía Renovable. Yucatan Center for Scientist Research, Yucatan, 2017. Available online: https://cicy.repositorioinstitucional.mx/jspui/handle/1003/704 (accessed on 15 February 2024).
  43. Zhao, F.; Rahunen, N.; Varcoe, J.R.; Roberts, A.J.; Avignone-Rossa, C.; Thumser, A.E.; Slade, R.C.T. Factors affecting the performance of microbial fuel cells for sulfur pollutants removal. Biosens. Bioelectron. 2009, 24, 1931–1936. [Google Scholar] [CrossRef] [PubMed]
  44. Tender, L.M.; Gray, S.A.; Groveman, E.; Lowy, D.A.; Kauffman, P.; Melhado, J.; Tyce, R.C.; Flynn, D.; Petrecca, R.; Dobarro, J. The first demonstration of a microbial fuel cell as a viable power supply: Powering a meteorological buoy. J. Power Sources 2008, 179, 571–575. [Google Scholar] [CrossRef]
  45. Zhao, F.; Rahunen, N.; Varcoe, J.R.; Chandra, A.; Avignone-Rossa, C.; Thumser, A.E.; Slade, R.C.T. Activated Carbon Cloth as Anode for Sulfate Removal in a Microbial Fuel Cell. Environ. Sci. Technol. 2008, 42, 4971–4976. [Google Scholar] [CrossRef] [PubMed]
  46. Schröder, U.; Harnisch, F.; Angenent, L.T. Microbial electrochemistry and technology: Terminology and classification. Energy Environ. Sci. 2015, 8, 513–519. [Google Scholar] [CrossRef]
  47. Serra, P.; Espírito-Santo, A. Sourcing power with microbial fuel cells: A timeline. J. Power Sources 2021, 482, 228921. [Google Scholar] [CrossRef]
  48. Cristiani, P.; Carvalho, M.L.; Guerrini, E.; Daghio, M.; Santoro, C.; Li, B. Cathodic and anodic biofilms in Single Chamber Microbial Fuel Cells. Bioelectrochemistry 2013, 92, 6–13. [Google Scholar] [CrossRef] [PubMed]
  49. Kim, K.-Y.; Chae, K.-J.; Choi, M.-J.; Ajayi, F.-F.; Jang, A.; Kim, C.-W.; Kim, I.S. Enhanced Coulombic efficiency in glucose-fed microbial fuel cells by reducing metabolite electron losses using dual-anode electrodes. Bioresour. Technol. 2011, 102, 4144–4149. [Google Scholar] [CrossRef]
  50. Sekar, N.; Ramasamy, R.P. Electrochemical Impedance Spectroscopy for Microbial Fuel Cell Characterization. J. Microb. Biochem. Technol. 2013, S6, 1–14. [Google Scholar] [CrossRef]
  51. He, Z.; Wagner, N.; Minteer, S.D.; Angenent, L.T. An Upflow Microbial Fuel Cell with an Interior Cathode: Assessment of the Internal Resistance by Impedance Spectroscopy. Environ. Sci. Technol. 2006, 40, 5212–5217. [Google Scholar] [CrossRef] [PubMed]
  52. Zhang, C.; Liang, P.; Jiang, Y.; Huang, X. Enhanced power generation of microbial fuel cell using manganese dioxide-coated anode in flow-through mode. J. Power Sources 2015, 273, 580–583. [Google Scholar] [CrossRef]
  53. Sindhuja, M.; Kumar, N.S.; Sudha, V.; Harinipriya, S. Equivalent circuit modeling of microbial fuel cells using impedance spectroscopy. J. Energy Storage 2016, 7, 136–146. [Google Scholar] [CrossRef]
  54. Yuan, X.; Song, C.; Wang, H.; Zhang, J. Electrochemical Impedance Spectroscopy in PEM Fuel Cells: Fundamentals and Applications; Springer Science & Business Media: London, UK, 2009. [Google Scholar]
  55. He, Z.; Mansfeld, F. Exploring the use of electrochemical impedance spectroscopy (EIS) in microbial fuel cell studies. Energy Environ. Sci. 2009, 2, 215–219. [Google Scholar] [CrossRef]
  56. Rismani-Yazdi, H.; Christy, A.D.; Carver, S.M.; Yu, Z.; Dehority, B.A.; Tuovinen, O.H. Effect of external resistance on bacterial diversity and metabolism in cellulose-fed microbial fuel cells. Bioresour. Technol. 2011, 102, 278–283. [Google Scholar] [CrossRef]
  57. Freguia, S.; Rabaey, K.; Yuan, Z.; Keller, J. Electron and Carbon Balances in Microbial Fuel Cells Reveal Temporary Bacterial Storage Behavior During Electricity Generation. Environ. Sci. Technol. 2007, 41, 2915–2921. [Google Scholar] [CrossRef]
  58. Çetinkaya, A.Y.; Köroğlu, E.O.; Demir, N.M.; Baysoy, D.Y.; Özkaya, B.; Çakmakçi, M. Electricity production by a microbial fuel cell fueled by brewery wastewater and the factors in its membrane deterioration. Chin. J. Catal. 2015, 36, 1068–1076. [Google Scholar] [CrossRef]
  59. Wang, H.; Qu, Y.; Li, D.; Ambuchi, J.J.; He, W.; Zhou, X.; Liu, J.; Feng, Y. Cascade degradation of organic matters in brewery wastewater using a continuous stirred microbial electrochemical reactor and analysis of microbial communities. Sci. Rep. 2016, 6, 27023. [Google Scholar] [CrossRef]
Figure 1. Stack setup: (a) assembly of 9 cells; (b) MFC components [27,32].
Beverages 10 00020 g001
Figure 2. Performance of COD, VFA, and stack voltage in treatment cycles from the stack system: (a) SBW and (b) CBW.
Beverages 10 00020 g002
Figure 3. Current values in the stack over time and voltage of the energy-harvesting circuit battery circuit connection.
Beverages 10 00020 g003
Figure 4. Polarization curve performance obtained from each of the nine MFCs (stack system) after CBW feedings.
Beverages 10 00020 g004
Figure 5. Full cell from CBW treatment: (a) Nyquist plot; (b) equivalent circuit of the system.
Beverages 10 00020 g005
Table 1. Bioelectrochemical performance systems from brewery wastewater.
SubstrateConfigurationMaterials Anode/CathodeUseful Volume (L)COD (mg L−1)/OLR (mg L−1 d−1)COD Removal (%)Columbic Efficiency (%)Maximum Power (mW m−3)Reference
Brewery WastewaterOne Chamber—Aerated CathodeCarbon cloth/carbon cloth–Pt0.0282250/NA85105100[12]
One Chamber—Aerated CathodeCarbon fiber graphite rod/activated carbon–Pt0.187436/NA4319.759520[13]
One Chamber—Aerated CathodeGraphite felt/carbon–Pt cloth0.225510/NA99412944[15]
Stack—Aerated cathodeGraphite felt/cloth and catalytic coating (Ni + MnO2)10NA/106086.47.64100[14]
Stack—Forced Oxygen CathodeCarbon fiber cloth/carbon fiber cloth–heat treatment18.83000/31093.3/94.6ND/5.5ND/440[3]
Stack—Aerated cathodeTitanium carbon/activated carbon brushes90830/NA84.719.79520[11]
Synthetic brewery wastewaterStack—Aerated cathodeGAC/carbon cloth1501980 ± 1795 ± 1.457.2 ± 2.41938.02This study
Craft brewery wastewaterStack—Aerated cathodeGAC/carbon cloth1501831 ± 8593 ± 1.849.5 ± 0.711454.37This study
NA: Not available; GAC: granular activated carbon; OLR: organic loading rate; Pt: Platinum; COD: chemical oxygen demand.
Table 2. Resistance values and constant-phase elements from CBW treatment.
FeedingR1 (Ω)Q2
(F.s(α−1))
α2R2 (Ω)Q3
(F.s(α−1))
α3R3 (Ω)X2Total Internal Resistance (Ω)
110.42 ± 2.71.5 ± 0.060.72 ± 0.08143.2 ± 2.710.18 ± 0.030.52 ± 0.0545.34 ± 2.620.0010198.96
39.03 ± 2.905.1 ± 1.40.90 ± 0.03155.3 ± 9.10.55 ± 0.140.57 ± 0.0644.58 ± 1.260.0081208.91
42.46 ± 4.496.32 ± 0.340.91 ± 0.01181.6 ± 4.471.38 ± 1.070.54 ± 0.0622.71 ± 4.280.0065206.77
204.88 ± 5.24
Disclaimer/Publisher’s Note: The statements, opinions and data contained in all publications are solely those of the individual author(s) and contributor(s) and not of MDPI and/or the editor(s). MDPI and/or the editor(s) disclaim responsibility for any injury to people or property resulting from any ideas, methods, instructions or products referred to in the content.

