Article

Understanding Sparkling Wine Consumers and Purchase Cues: A Wine Involvement Perspective

by
Gary J. Pickering
1,2,3,4,* and
Belinda Kemp
5
1
Department of Biological Sciences, Brock University, St. Catharines, ON L2S 3A1, Canada
2
Psychology Department, Brock University, St. Catharines, ON L2S 3A1, Canada
3
Cool Climate Oenology and Viticulture Institute, Brock University, St. Catharines, ON L2S 3A1, Canada
4
Gulbali Institute for Agriculture, Water and Environment, Charles Sturt University, Locked Bag 588, Wagga Wagga, NSW 2678, Australia
5
Wine Innovation Centre, National Institute of Agricultural Botany, New Rd., East Malling E19 6BJ, UK
*
Author to whom correspondence should be addressed.
Beverages 2024, 10(1), 19; https://doi.org/10.3390/beverages10010019
Submission received: 13 December 2023 / Revised: 1 February 2024 / Accepted: 5 February 2024 / Published: 16 February 2024
(This article belongs to the Special Issue Wine Economy and Consumption)

Abstract

:
Research on sparkling wine (SW) consumers, their market segmentation, and how they use purchase cues is relatively sparse compared to that for table wine, despite the substantial growth in sparkling wine in recent years. We address these gaps and particularly how the importance of SW purchase cues varies with wine involvement in an online survey of SW consumers from Ontario, Canada (n = 1011). Thirty intrinsic and extrinsic purchase cues were rated for importance (n = 609), and wine involvement was determined using the shortened version of the wine involvement scale. Overall, consumers rated (in descending order) price, flavour, quality, country, and sweetness level as the most important purchase cues, whereas several extrinsic factors, including bottle colour and shape, awards won, and vintage were of low importance. Females were 1.4 times more likely than males to cite target end use as the most important purchase cue. We further show that SW consumers can be segmented into three wine involvement categories (low, medium, high) which vary across multiple demographic, consumption, knowledge, and preference measures (n = 1003). Notably, the importance of six purchase cue categories (manufacture, price, endorsements, parentage, prestige/reputation, and place) varied with wine involvement (n = 609). These findings provide timely guidance for marketers and retailers seeking to align their products and communications with the needs and perceptions of SW consumers.

1. Introduction

Wine consumers use a range of cues when making purchase decisions, including those that are intrinsic to the product (e.g., taste attributes) and those that are extrinsic (e.g., price and region of origin). Understanding these cues and how their use varies between different market segments and consumer characteristics inform marketing and retailing decisions (e.g., branding and pricing) as well as direct communications with consumers. These cues also interact with production decisions, including wine style, the information to include on wine labels, and packaging considerations [1]. Wine involvement is one characteristic that varies considerably between consumers and allows for consumers to be segmented into groups that show considerably different wine consumption levels, preferences, and willingness to pay [2,3]. The use and importance of purchase cues for table wine have also been reported to differ with involvement, with implications for how these products are marketed [4].
Research on sparkling wine (SW)—a USD 34 billion global industry projected to grow annually at a rate of over 7% (AGM, 2021)—is much more limited than that on table wine in regard to understanding the role of wine involvement generally, the purchase cues that are important to consumers, and how these cues may vary with the level of wine involvement. Additionally, limited research to date has hinted that some important differences may exist between table and sparkling wine styles with respect to the perceptions of consumers and how they use purchase cues [5]. These considerations inform the current study.

1.1. Wine Purchase Cues and Involvement

Inherent to any product is a range of cues that act as indirect indicators of quality to consumers [6]. These are generally conceptualised as either intrinsic or extrinsic, and consumers rely on both to help form their opinions about products and make purchase decisions. Intrinsic cues are product attributes inherent to the objective nature of the product, whereas extrinsic cues are product characteristics that can be altered without influencing the objective nature of the product [7]. In the case of wine, intrinsic cues include the various dimensions of “taste” (e.g., aroma, flavour), and extrinsic cues include price, the reputation of the wine, and packaging [3]. A growing body of literature suggests that extrinsic cues often play a larger role than intrinsic cues in wine consumer purchase behaviour [8,9,10,11], perhaps reflecting greater familiarity than for intrinsic cues [4]. It is also likely that some extrinsic cues serve as a proxy indicator of intrinsic cues for consumers, given that quality typically cannot be assessed until the wine is being consumed [12].
How these cues are used by consumers varies with several demographic variables, including age, gender, socioeconomic status [8,13,14], and wine knowledge [15,16,17]. For instance, high levels of objective knowledge may be associated with using impersonal cues when making purchase decisions (e.g., wine reviews and advertising) [15]. Similarly, high levels of subjective knowledge are positively related to impersonal sources of information and one’s own preferences and negatively related to using personal sources (e.g., friends, sales personnel). Wine involvement has also been reported as a moderator of how consumers use purchase cues [2,4,18].
Over the last two decades, involvement has been an important theme in consumer behaviour research because of its significant effect on information processing and decision making of consumers [19]. It can be defined as an unobservable state of motivation, arousal, and interest [20], and has three typologies—enduring, situational, and response [21]. Enduring involvement encompasses the long-term attachment to and personal relevance of a product category [22] and is the construct examined in this paper, given its influence on wine consumers’ use of extrinsic purchase cues [4].
Consumers who vary in their level of involvement may respond differently to the cues they use when making a wine purchase [4,23,24,25,26]. For instance, less involved wine consumers are more receptive to wine awards [27] and may use less complex cues than highly involved consumers [28]. Additionally, consumers whose subjective knowledge is greater than their objective knowledge place significant meaning on single extrinsic cues and may tend to use cues in a more linear fashion rather than evaluating all the available information about a product [29]. Similarly, the number of information sources used by wine tourists varies based on their level of product involvement [30]. Finally, it has been speculated that highly involved wine consumers rely on the intrinsic attributes of the wine and the winemaking process, whereas those with a low level of involvement use extrinsic factors such as price and recommendations from others [15]. While prior research has suggested that utilisation of purchase cues is moderated by wine involvement, this finding has not been explored to our knowledge in the context of SW.

1.2. The Case of Sparkling Wine

Worldwide, SW production and consumption is increasing, bucking the trend observed with other wine styles [31]. It now accounts for 11% of the global volume exported and 23% in export value, making it the second largest category for value after bottled table wine [31]. Further, as a product category, SW is valued at USD 34 billion and is expected to reach USD 51.7 billion by 2027 [32]. However, the vast majority of prior consumer research on market segmentation, the importance of purchase cues, and variation due to wine involvement has focused on table wines. Additionally, it is far from clear that the findings from table wine research can be directly applied to SW. For instance, many extrinsic purchase cues differ (e.g., production methods, packaging, closure types), and in contrast with table wine, SW tends to be purchased for celebration rather than for its own consumption [33]. Further supporting this view, a transnational study concluded that consumers view table and SW as distinct products [5].
Some limited prior research has examined SW purchase cues and the importance of both intrinsic and extrinsic factors. For instance, amongst Croatian consumers, the intrinsic cues of taste and smell, together with the price/quality ratio, are the most important characteristics influencing SW purchase decisions [34]. Multiple extrinsic cues that influence purchase decisions have been identified, including place of origin, brand image and reputation, recommendations, consumption occasions, and price [33]. Interestingly, their data also suggest that the importance of some cues may vary depending on whether the purchase is for a gift or personal consumption. One study combined hedonic evaluations and experimental auctions with Italian consumers and concluded that both intrinsic (sensory) and extrinsic (production process info) cues can affect SW preferences [35]. Finally, the importance of different information components of SW labels in purchase decisions was also examined [3]. They concluded that while the relative importance of information type may vary with subjective knowledge, style preferences, and consumer age, a description of the wine’s sensory attributes, grape variety/blend, and region of origin are generally important cues, whereas expert endorsements are not.

1.3. The Current Study

This exploratory study has three main objectives. Firstly, we wish to determine the utility of wine involvement as a tool for segmenting SW consumers. Secondly, we seek to characterise the demographic features, and SW knowledge, behaviour, and preferences for consumers segmented by wine involvement. Thirdly, we wish to assess the variation in importance of purchase cues used by SW consumers that is attributable to their level of wine involvement. Our sample is from Ontario, which is Canada’s most populated province and its largest wine producer. Ontario has witnessed substantial growth in its SW production in recent years, and significant market potential for local SW has been identified [36].
Noteworthy, the Liquor Control Board of Ontario (LCBO) is one of the world’s largest wine buyers, distributors, and retailers [37] and where most Ontario SW consumers purchase their wine. Also, of all wine imports into Canada in 2022, SW showed the greatest growth (11% in volume, 21% in value; [31]). Thus, findings from this sample should be of interest to both local industry stakeholders as well as international SW exporters. Insights from this study should assist SW marketers and retailers in aligning their products and communications with the needs and behaviour of different wine involvement segments, as well as elucidate more generally the importance that SW consumers place on intrinsic and extrinsic purchase cues. Additionally, our study expands scholarship on the measurement of consumer behaviour through the application of a new tool for assessing SW involvement and informs the broader theory on the interaction between the saliency of purchase cues and level of consumer involvement in the product.

2. Materials and Methods

2.1. Participants and Characteristics

A total of 1011 SW consumers from Ontario, Canada, participated in this study. Eligible participants were instructed to complete an online questionnaire, presented via the survey management software Qualtrics (www.qualtrics.com). To be eligible to participate, all individuals had to be at least 19 years of age (the legal drinking age in Ontario), fluent in English, and identify as an SW drinker. The latter was assessed with two questions: when you drink wine how often is it sparkling wine? and on average, how often do you drink sparkling wine? Participants provided written consent prior to completing the study, and the study was cleared by the Human Research Ethics Board at Brock University (File #19-30) and conducted in accordance with Tri-Council ethical guidelines.
Table A1 provides full details of the measures used, which are summarised below. Respondents first completed basic demographic questions (Table 1). Wine and SW consumption was assessed using the approach of Thibodeau et al. [38]. The yearly intake for each was calculated by multiplying by 12 the factor of monthly frequency and standard drinks per drinking occasion. Amount typically paid per bottle, purchase channels, country of origin of purchases, and frequency of purchase of major international SW styles were also assessed using categorical response options (Appendix A). Liking of each of the four major Ontario SW styles (“Champagne style (dry, bready, yeasty)”; “Sweet, perfumed and less fizzy (like Moscato or Asti)”; “Light & fruity (like Prosecco)”, and “Pét-nat (cloudy ‘naturally sparkling’ wine)” [36]) was assessed using 9-point hedonic scales. Subjective wine knowledge was assessed using the summed responses (5-point Likert scale) to four knowledge statements (maximum score of 20), as adapted from Vecchio et al. [35]. Finally, objective SW knowledge was assessed by the number of correct responses (true/false/don’t know) to six general and region-specific questions about SW production, nomenclature, and regulation (maximum score of six; Table A1).

2.2. Wine Involvement

Wine involvement was assessed using the shortened version of the wine involvement scale [39]. This 10-item scale retains each of the five wine involvement dimensions of the original 24-item scale (interest, behaviour, ritual, pleasure, and risk) [40]. Using a 5-point Likert scale (1 = “strongly disagree”; 2 = “disagree”; 3 = “neither agree nor disagree”; 4 = “agree”; 5 = “strongly agree”), participants rated their level of agreement with each of the 10 statements: “I have a strong interest in wine”, “I often read wine magazines and publications”, “I drink wine mainly on special occasions” (reversed coded, r), “I often match my food and wine”, “I own proper wine glasses (e.g., Riedel, Spiegelau, etc.)”, “I seldom decant red wines (pour into another container to separate any sediment)” (r), “Drinking wine gives me pleasure”, “I enjoy and often attend wine tasting events”, “Deciding which wine to buy is an important decision for me”, and “I am not confident in my ability to select a wine” (r).
Items were presented in randomised order, and scores were summed across the 10 items, correcting for reverse-keyed items (r), for a total possible score of 50. This value was then multiplied by two to generate a final score out of 100, with higher scores indicating greater wine involvement. Based on tertile scores, three groups were created reflecting level of wine involvement: low (26–60, n = 336), medium (62–70, n = 336), and high (71–98, n = 331).

2.3. Purchase Cues

An extensive list of 30 purchase cues consisting of both intrinsic (n = 12) and extrinsic (n = 18) factors was developed from the existing wine literature, drawing particularly from two prior studies [14,35] (Table A2). Consumers were told “Please select the factors (if any) that are important to you when considering which sparkling wine to buy and/or drink”, and the items were presented in randomised order. For analysis purposes, we collapsed individual items into 10 subclasses, as informed by previous research on SW [3]: sensory: what I expect it to taste like, the style of wine, the sweetness level, the quality, colour, aroma/smell, flavour, and effervescence (the type of foam and fizziness from the bubbles); manufacture: how the wine was produced (e.g., bottle-fermented), grape variety/blend, and vintage/year produced; alcohol: alcohol content; price: price; endorsements: advice from others (e.g., friends, LCBO staff), expert reviews, awards, stars, etc. won by the wine; target—end use: the occasion (e.g., whether buying as a gift or celebration), match with food, who I’ll be drinking it with, ease of use (e.g., how easy it is to open the bottle); parentage: the wine company/brand; prestige/reputation: the prestige of the wine, and the reputation of the wine; place: the country the wine is from and the appellation or sub-region the wine is from; package: bottle shape, bottle colour, bottle size, label information, and label design.
All individual cue items that were chosen as being important to a consumer were then presented again as a list with the statement “Please select the MOST important factors to you when considering which sparkling wine to buy and/or drink”, with a selection of up to five items permitted.

2.4. Data Preparation and Analysis

Data preparation and analysis were conducted using XLSTAT (v. 2022.2.1) (Addinsoft, New York, NY, USA). The characteristics of each wine involvement tertile when compared using ANOVA (age, household income, wine involvement, total wine and SW intake measures, subjective wine knowledge, objective SW knowledge, price paid, and liking) or chi-square (gender, education, SW intake as % of all wine, frequency of use as a mixer, purchase channels, regional preferences) analysis. The mean values for each category range (Table A1) were used to estimate household income and price paid per bottle. Purchase channel and preference response options were collapsed in some instances to ensure sufficient counts (>30) in each cell for analysis purposes (Table 2).
The importance of purchase cue information was explored with simple descriptive statistics, and then variation within wine involvement tertiles was examined using chi-square, with importance operationalised as the proportion of participants within each wine involvement level who cited at least one item for a given purchase cue category (Table A2). For cue items identified by consumers as the most important in SW purchase decisions, we conducted logistic regression analyses to determine whether wine involvement (score out of 100), subjective wine knowledge (score out of 20), and gender (male/female) were predictive of at least one item being selected for a given cue category. In order to avoid multicollinearity effects, objective SW knowledge was not examined in these models as it was correlated with subjective knowledge (r = 0.340, p < 0.0001).

3. Results

Participants who selected “none” or “never”, respectively, to the questions when you drink wine how often is it sparkling wine? and on average, how often do you drink sparkling wine? were removed from the dataset. Data from eight participants were removed as they did not complete the wine involvement questions, leaving 1003 usable responses. The median completion time for the survey was 10.1 min. Subjective SW knowledge scores ranged from 4 to 20, with a mean of 12.3 (+/−3.1 SD), and Cronbach’s standardised and non-standardised alpha were 0.786 and 0.784, respectively, indicating good internal consistency [41]. Objective SW knowledge scores ranged from 0 to 5, with a mean of 1.3 (+/−1.3 SD), indicating relatively low SW knowledge in this sample.

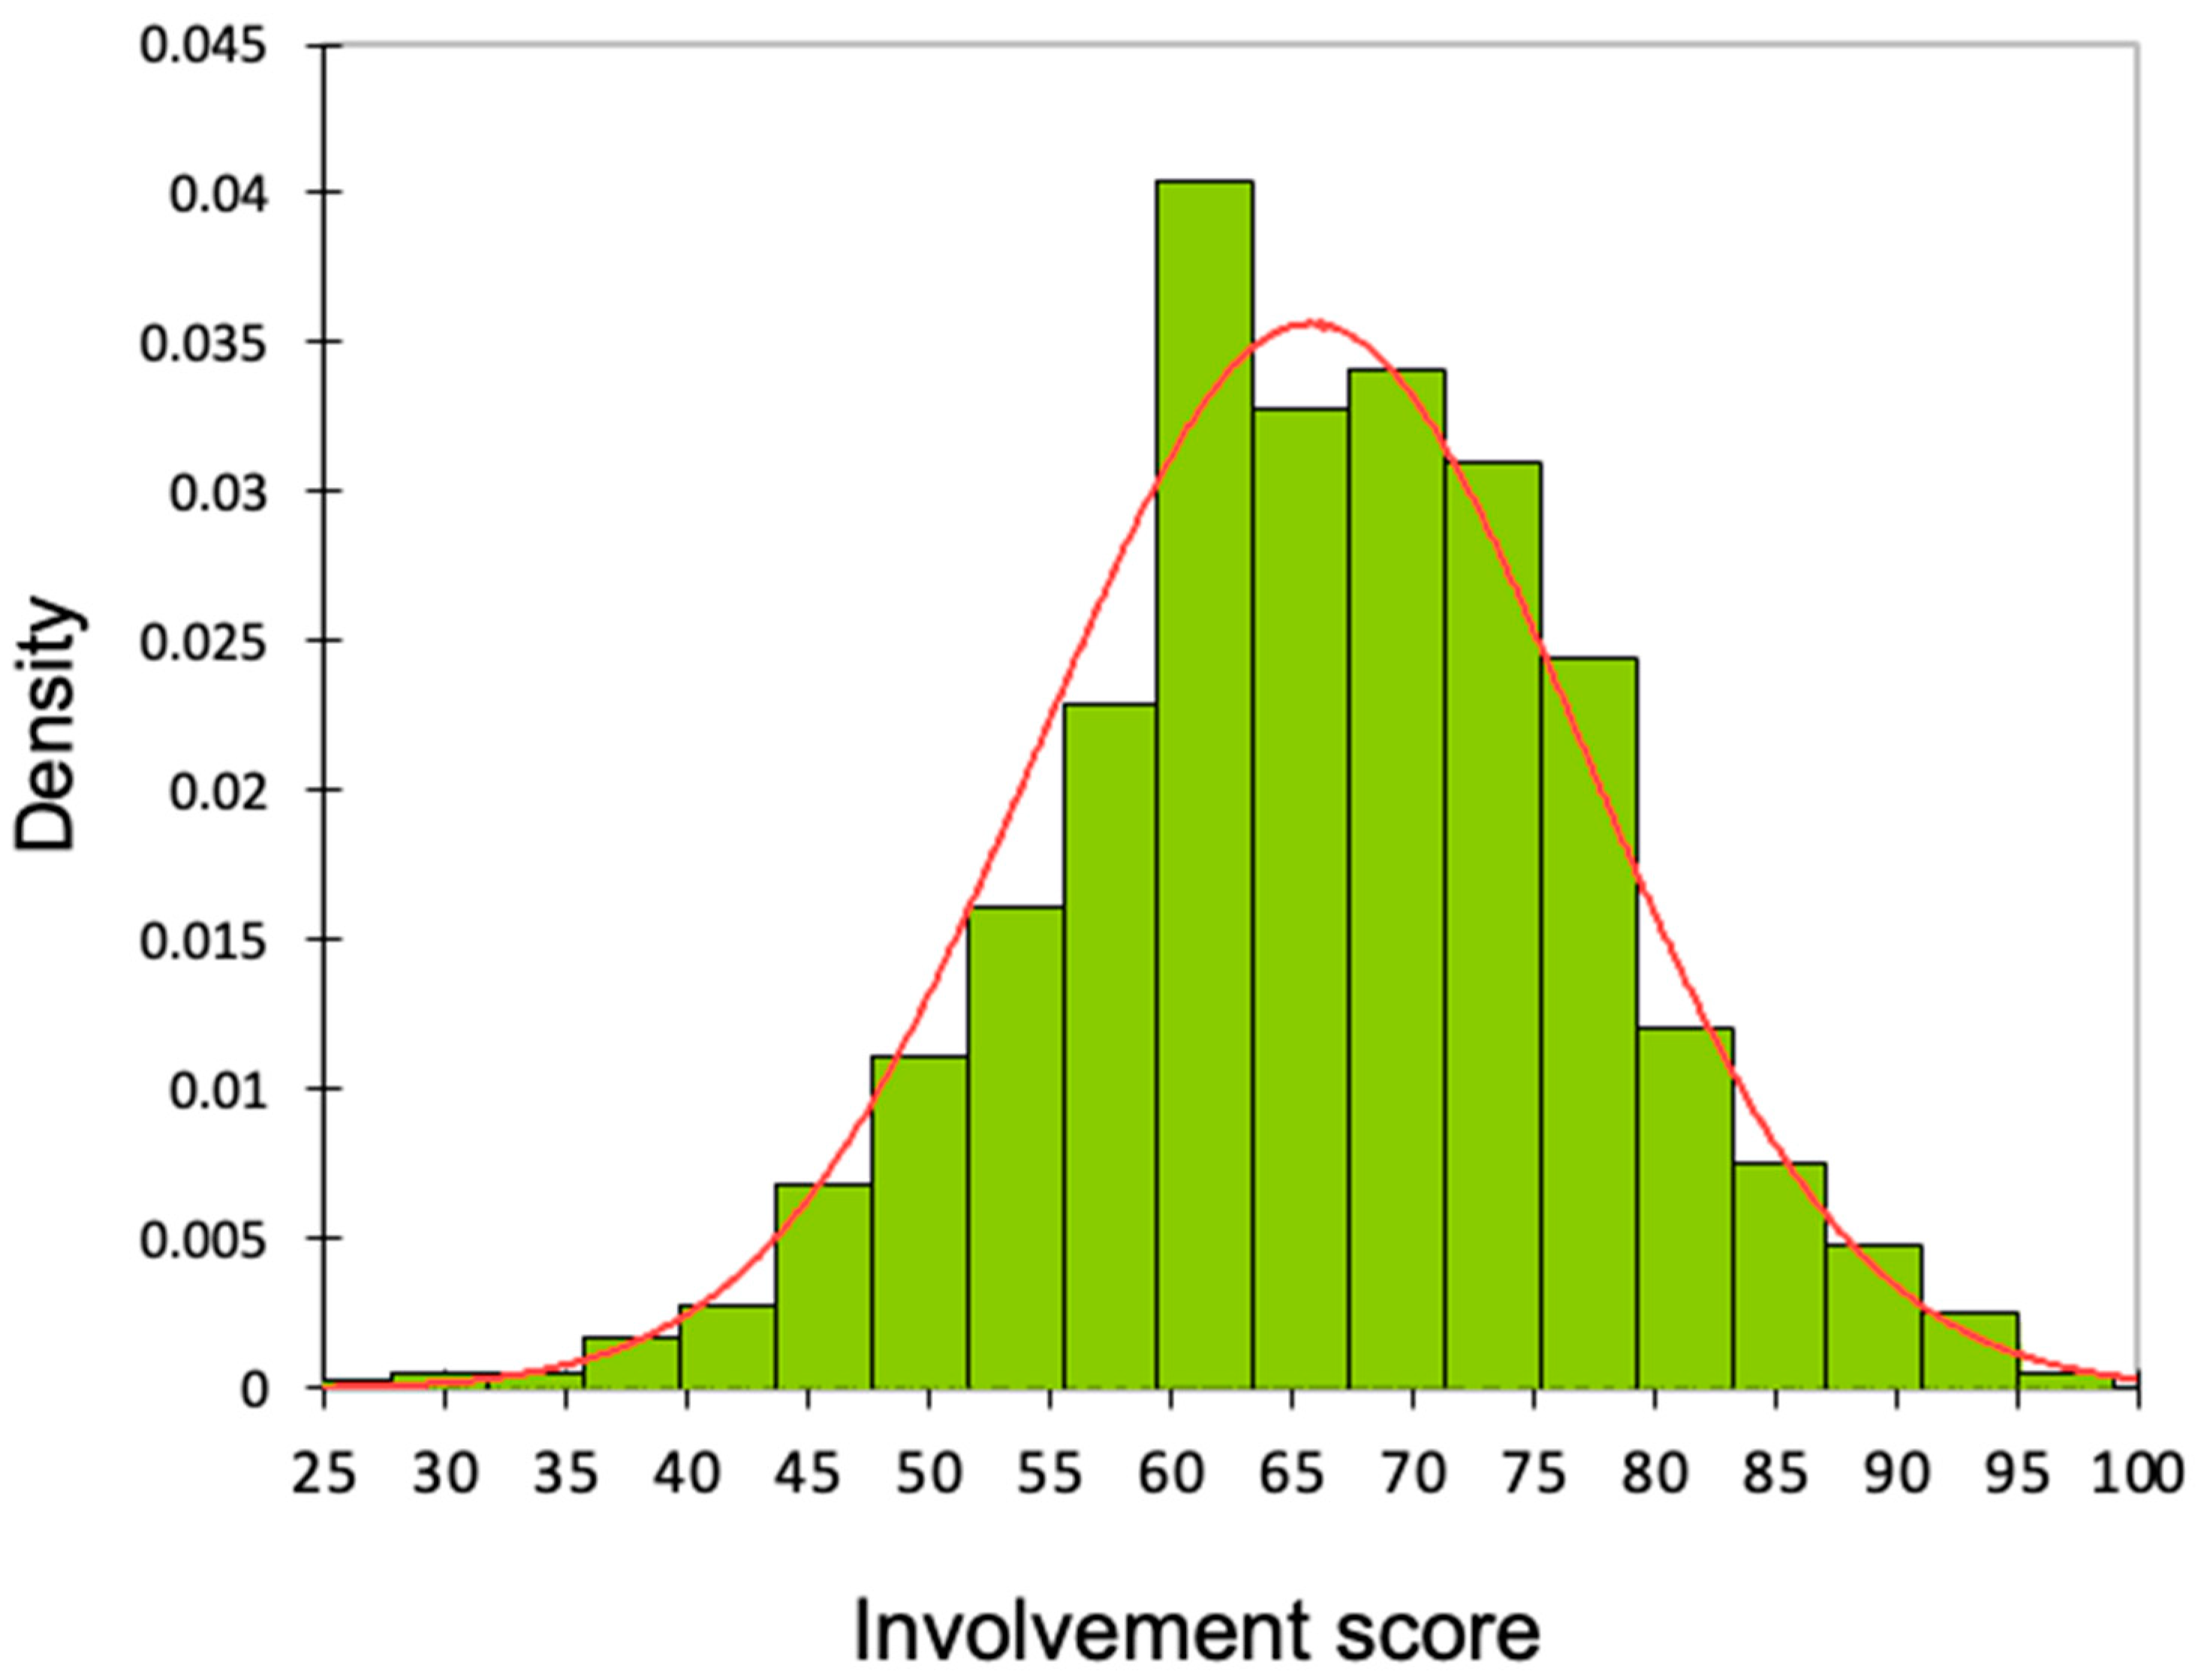
3.1. Wine Involvement and Characterisation of Consumers

Wine involvement scores (out of 100) ranged from 26 to 98, with a mean of 65.8 (+/−11.2 SD), and followed a normal distribution (JB = 2.3, df = 2, p = 0.32) (Figure 1). Values for Cronbach’s standardised and non-standardised alpha were 0.716 and 0.703, respectively, indicating acceptable internal consistency amongst the wine involvement questions while still reflecting some variation, which is appropriate for a multi-dimensional construct [41].
Table 2 shows the characteristics of SW consumers for each wine involvement segment. The mean age of the sample was relatively high (51.5 years), and the mean age of involvement segments differed in that medium-involvement consumers were younger than low-involvement consumers. High-involvement participants reported a higher household income than low- or medium-involvement respondents. As expected, total wine intake, subjective wine knowledge, and objective SW knowledge increased with wine involvement. With respect to SW consumption, yearly intake, frequency of intake, and number of drinks consumed per occasion were greater for high-involvement consumers than for low- and medium-involvement consumers. Interestingly, the proportion of SW consumed relative to total wine intake did not differ between involvement groups. The typical price paid for SW increased with wine involvement level.
Frequency of use of all wine channels except pubs varied between low- and high-involvement groups (Fisher’s exact test). For the LCBO store, low-involvement consumers were overrepresented in the “all the time” category and underrepresented in the “most of the time” category, with the reverse finding for high-involvement consumers. For LCBO online, low-involvement participants were overrepresented in the “never” category and underrepresented in the combined some/most/all of the time category, with the reverse finding for high-involvement respondents. The same result was observed for the online—other purchase channel, which includes sources such as wine clubs. For winery store, high-involvement consumers were overrepresented in the “some of the time” and combined most or all of the time categories and underrepresented in the “never” category, with the reverse finding for low-involvement consumers. Finally, for restaurants, the low-involvement group was overrepresented in the “never” category and underrepresented in the combined some/most/all of the time category.
There were no differences between involvement segments in their preference (as expressed in purchase frequency) for domestic vs. international SW, and few differences in their preferences for specific international wine regions/styles (as expressed in consumption frequency). The exception was Cava, where high-wine-involvement individuals were overrepresented in the combined all the time, most of the time, and some of the time category and underrepresented in the rarely, never, or don’t know category, with the reverse finding for low-involvement consumers (Fisher’s exact test). For domestic (Ontario) wine styles, consumers overall gave their highest liking scores for “light & fruity (like Prosecco)” wines, and their lowest scores for “Pét-nat (cloudy ‘naturally sparkling’ wine)”. Liking scores for “Champagne style (dry, bready, yeasty)” and Pét-nat varied with wine involvement in that more highly involved consumers liked these products more.

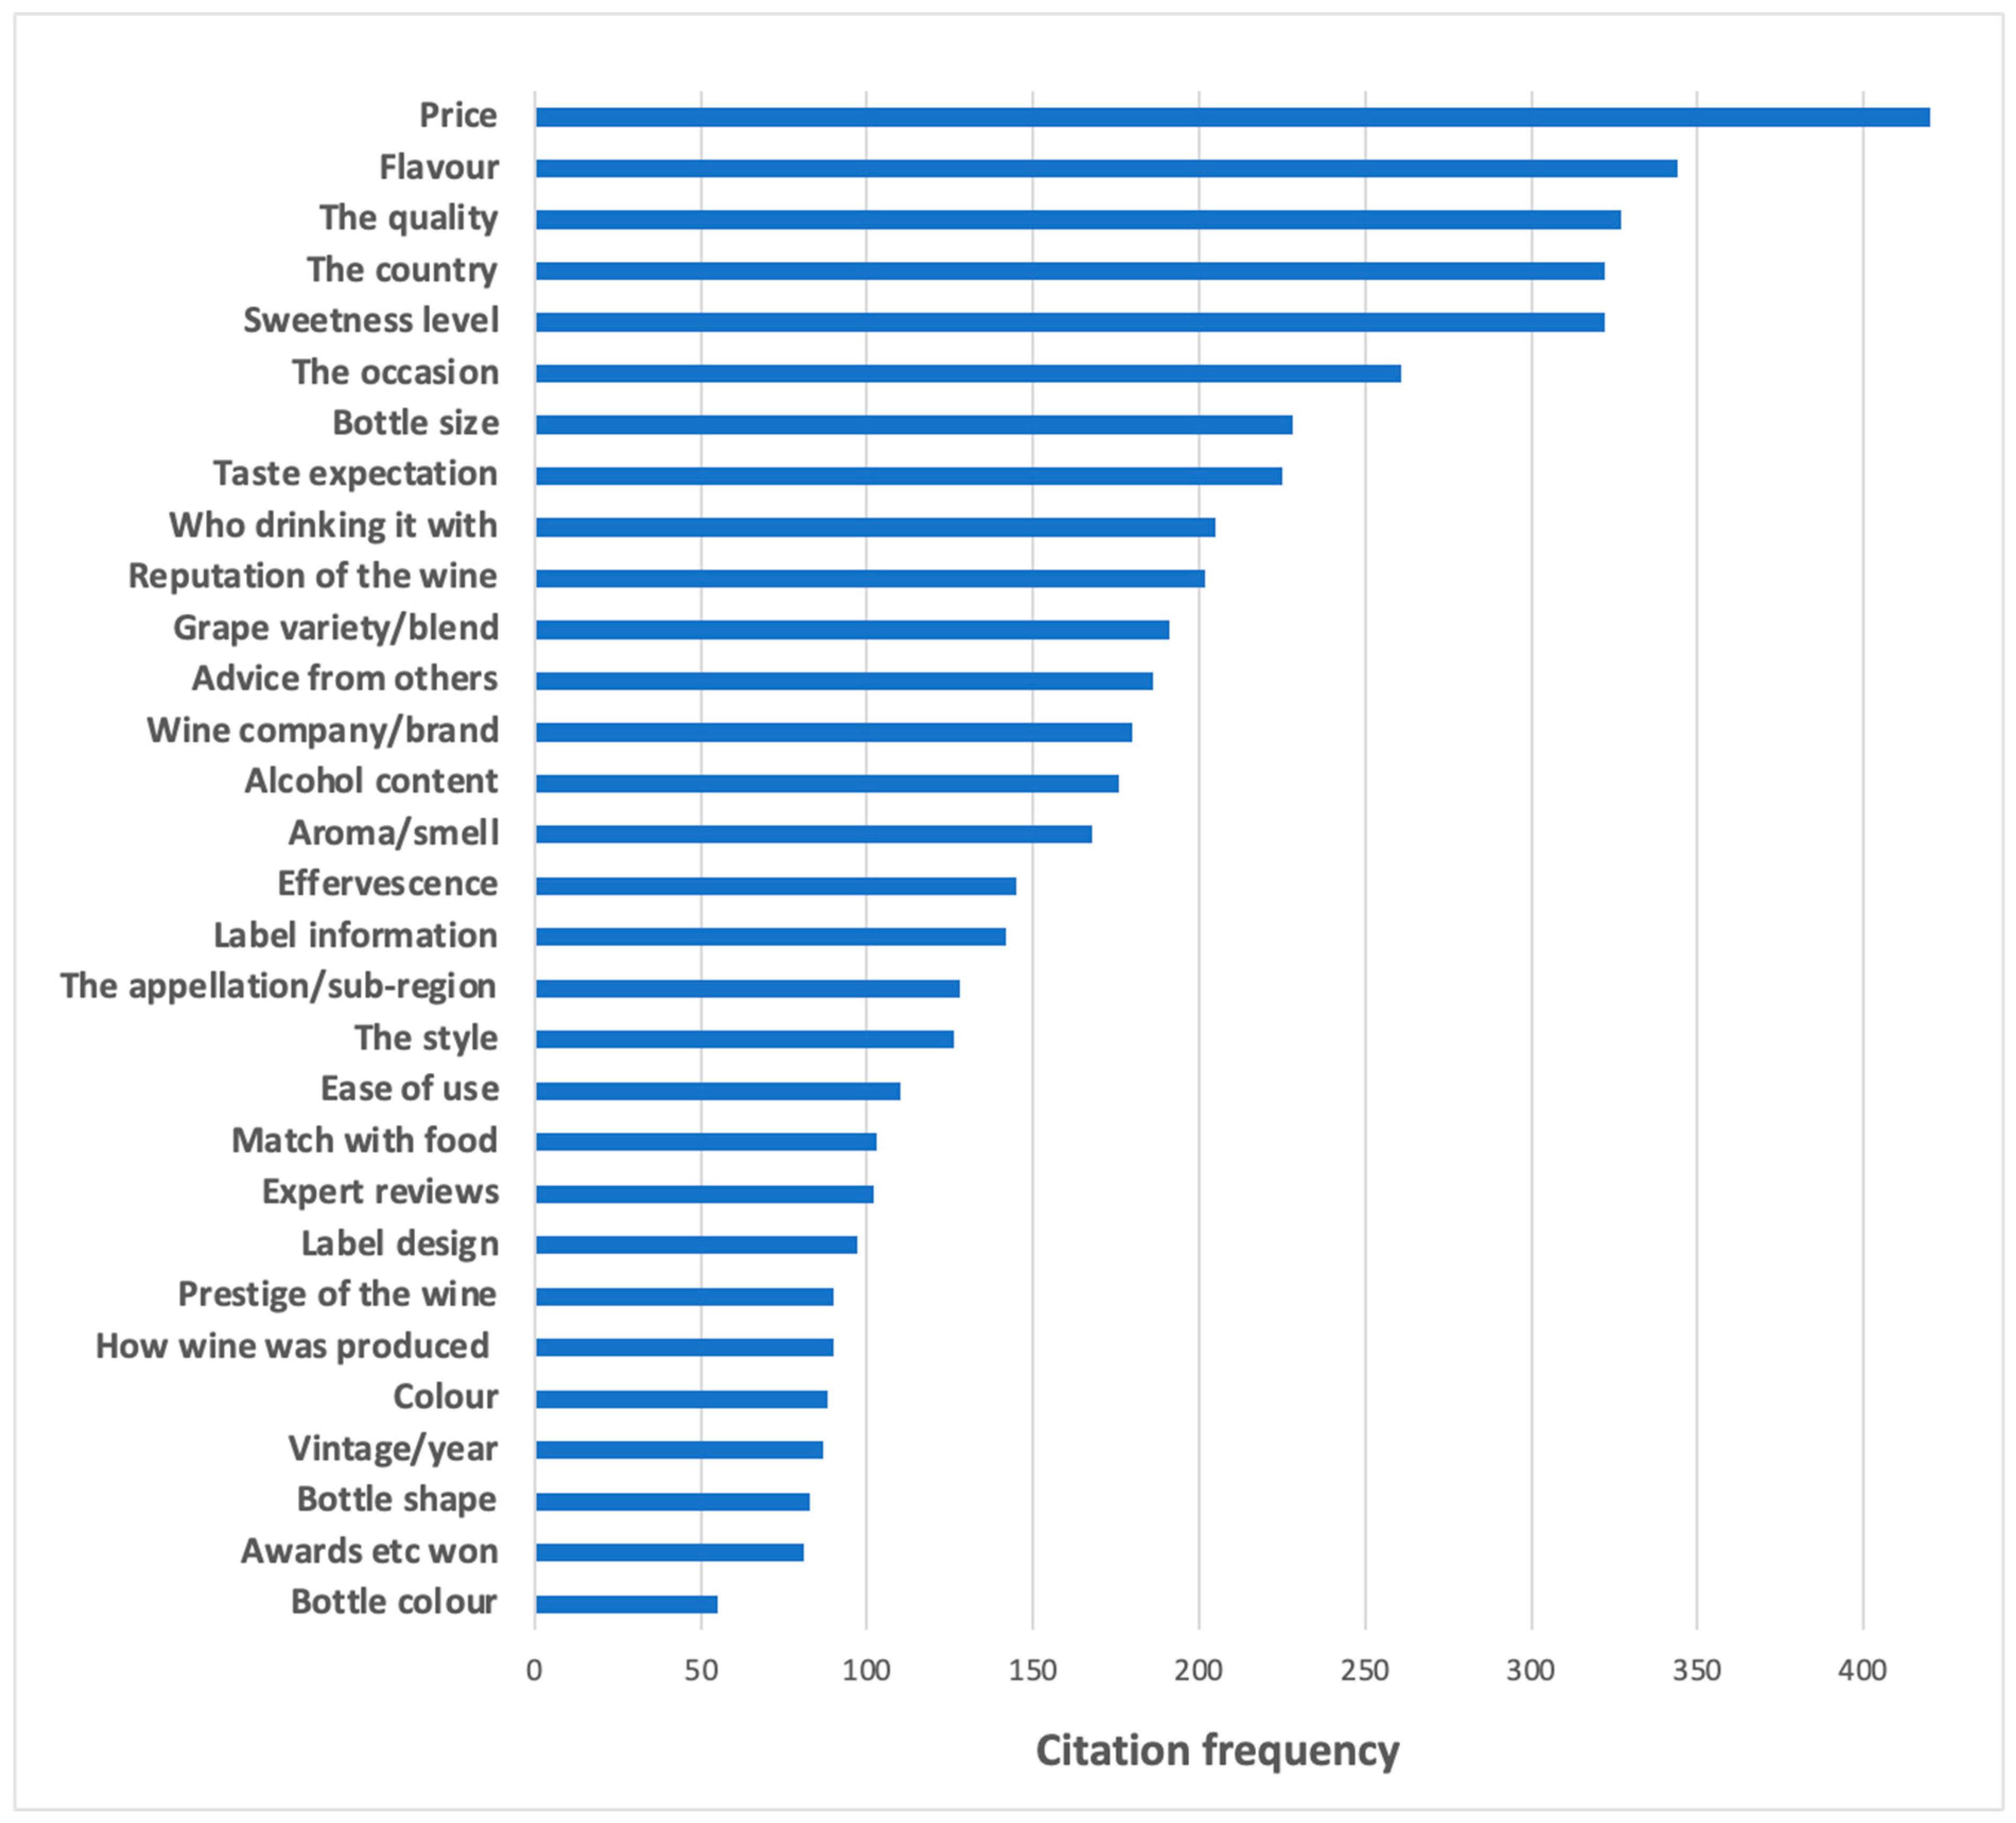
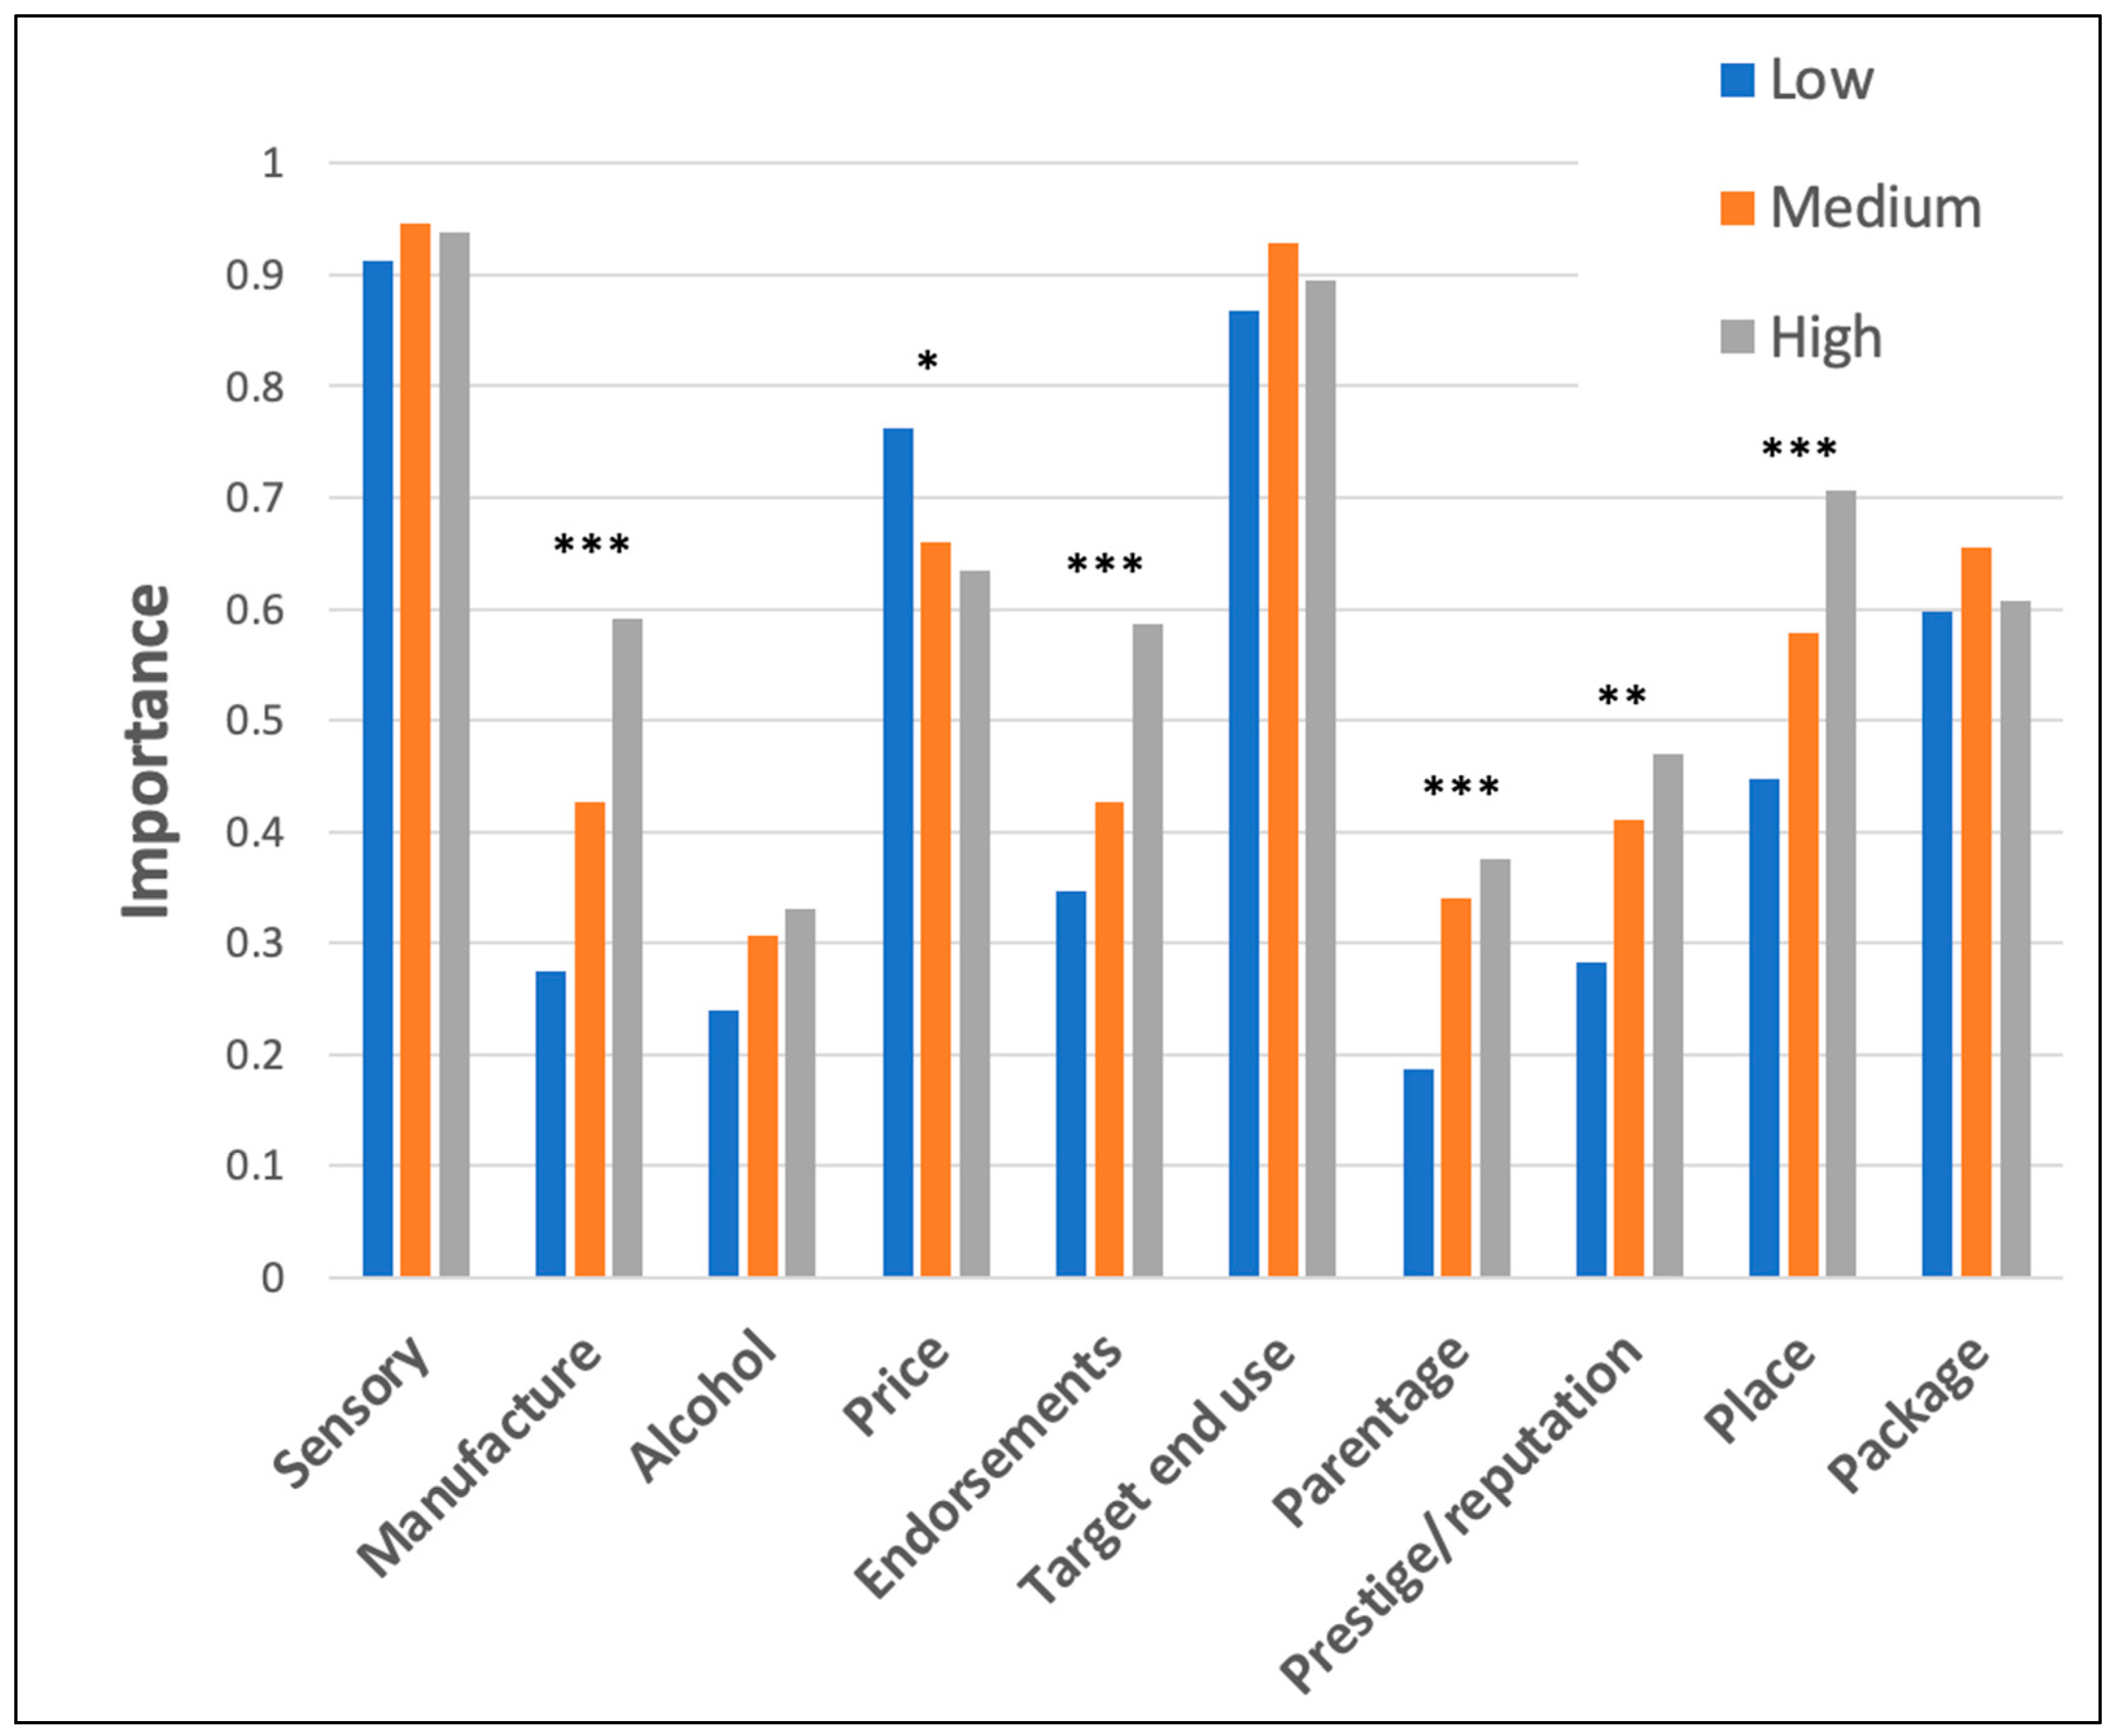
3.2. Importance of Sparkling Wine Purchase Cues

Figure 2 shows the citation frequencies for all 30 individual items for participants who responded to all of the purchase cue questions (n = 609). An average of 8.7 (+/−5.1 SD) cues was reported as important in SW purchase decisions. Price was the most frequently cited (69% of consumers), followed by flavour (56%), quality (54%), country (53%), and sweetness level (53%). Bottle colour (9%) and shape (14%) were among the three least commonly cited cues, and unexpectedly, “awards, stars, etc. won by the wine” was the second least cited item (13%).
We were also interested in how wine involvement would interact with consumers’ rating of cue importance. The number of items selected as being important varied across all three wine involvement groups (df = 2606; F = 22.7; p < 0.0001), with high-involvement consumers identifying 10.4 cues (+/−0.37 SE), medium-involvement consumers 8.8 (+/−0.34 SE), and low-involvement consumers 7.1 cues (+/−0.33 SE). Next, we calculated the proportion of participants within each wine involvement level who cited at least one item for a given purchase cue category as being important (Figure 3) and performed a chi-square analysis. As shown, manufacture, price, endorsements, parentage, prestige/reputation, and place all varied significantly with wine involvement; for five of the six cues, high-involvement consumers cited the cue more frequently than low-involvement consumers (Fisher’s exact test).
We examined the price result in more detail, as Fisher’s exact test did not separate wine involvement group proportions. Price cues, as a proportion of all cue items selected by each participant, varied with wine involvement ((2606), F = 19.6, p < 0.0001) in that low-involvement consumers cited them proportionally higher (twice as high) (14.6% +/− 0.84 SE) than high-involvement consumers (7.2% +/− 0.92 SE). As our endorsement finding does not agree with a prior study, where it was reported that lower-involved wine consumers are more receptive to wine awards than highly involved consumers [27], we examined the awards cue specifically, with the result being consistent with the wider endorsement category finding (χ2 = 14.6, df = 1, p < 0.0001); low-involvement consumers were less likely to identify awards as important and high-involvement consumers were more likely to select them as important (Fisher’s exact test).
We speculated that intrinsic cues (e.g., sensory qualities) may be especially valued by high-involvement consumers. We tested this hypothesis by using the citation counts for each cue item and calculating the proportion of intrinsic to total cue items used by each respondent. These values were then examined using a one-way ANOVA; involvement level was not a significant factor ((2606), F = 0.887, p = 0.41)).
We also considered consumers’ responses to the question that asked them to nominate the most important factor(s) in SW purchase decisions. Price was again the most cited cue (54% of consumers), followed by quality (37%), sweetness level (34%), flavour (31%), country (23%), taste expectation (18%), and the occasion (17%) (full results in Table A2). Significant models for the logistic regression analyses are summarised in Table 3. Wine involvement was inversely associated with price and positively associated with package in predicting the citation of these cues as one of the most important influencing purchase decisions. Subjective wine knowledge positively predicted manufacture and was negatively associated with package cues. Gender was significantly associated with target end use, with females being approx. 1.4 times more likely to cite this cue as one of the most important than were males.

4. Discussion

4.1. Market Segmentation Based on Involvement

Wine involvement plays an important part in consumers’ perception of quality and purchase intent and may allow for segmentation of the market [2,42]. The shortened 10-item wine involvement scale employed here retains each of the five dimensions of the original scale [40], can be completed in a shorter timeframe than the original, is more comprehensive than several other involvement measures, and yields normally distributed data. These findings contribute to the uniqueness of this study, and we recommend consideration of this scale for studies where time is a constraint (such as with online surveys), yet capturing a robust measure of the wine involvement construct is desired.
In agreement with other recent findings for table wine (e.g., [22,43]), our results show that SW consumers can be segmented according to level of wine involvement. Importantly, our segmentation yielded actionable characteristics for marketers and retailers. For instance, consumer use of purchase channels other than the LCBO increased with level of wine involvement, including online channels. This provides an opportunity to better optimise placement of SW brands and corresponding promotional efforts by considering the level of involvement of customers utilising those channels. As expected, both subjective and objective SW knowledge and price typically paid for SW increased with wine involvement, in general agreement with other studies on Canadian consumers [3] and with samples from other countries (see [33] for a review). The greater household income of more highly involved SW consumers also reported here likely facilitates their ability to pay more per bottle. Wine knowledge and involvement are likely mutually reinforcing, and retailers may benefit from education initiatives (such as regular tutored store tastings) with respect to transitioning the preferences of less knowledgeable and involved consumers towards higher value SW products. Further work that incorporates psychometric variables might be useful to expand our knowledge on involvement to determine if SW consumers can be segmented more broadly into useful typologies, as, for instance, with the “neophytes”, “snobs”, “modest” and “experts” classification scheme used for general wine consumers [44].
As anticipated and in approximate agreement with findings for wine in general [22], more highly involved participants consumed more SW in total and more frequently and had more drinks per occasion than less involved consumers. However, SW intake as a proportion of all wine consumed did not vary across involvement levels, suggesting that SW does not hold a “privileged” position with respect to the preferences of more highly involved wine consumers. Further, we found no differences attributable to involvement level between purchase frequency of international vs. domestic SW, and Cava was the only international style that differed with involvement, in that it was purchased more frequently by more highly involved consumers. Thus, promotion of the virtues of Cava amongst those less involved in wine (for instance, “the flavours of the Champagne method (method traditionelle) without the cost”) might help to grow the market for this wine in Ontario. For domestic styles, Champagne-style Ontario SW and Pét-nat were liked more by more highly involved consumers, possibly reflecting the greater importance placed on the wine’s prestige (Figure 3) and lower wine neophobia [39], respectively.

4.2. Market Segmentation Based on Purchase Cues

Consistent with other findings, price and flavour were identified as the most important SW purchase cues overall [34]. Similarly, perceived quality is important to most SW consumers, as the third most cited cue for importance and the second most cited cue for most important in our sample. In contrast, “awards etc. won” and “expert endorsements” are not identified as important; indeed, they can be seen as irrelevant to SW consumers’ conscious purchase motivators, with only 4% (awards) and 5% (expert reviews) of consumers citing them as amongst their five most important cues. Similarly, awards won or expert endorsements in general were of low relative importance to Croatian and Ontario SW consumers [3,34]. These findings may reflect consumers’ use of other information, including their own experiences with the product in the case of repeat purchases, as the primary source(s) for making their quality judgements. From a marketing budget perspective, SW producers may wish to carefully consider the value of entering into and promoting results from wine shows, given the resources and expense involved [45]. Further, additional caution should be applied when considering promoting awards and expert endorsement for products targeted at younger consumers, as they may be less willing to buy SW featuring this information [3].
In agreement with Australian consumers [33], country of origin was one of the five most cited cues influencing purchase decisions. This may be a proxy for perception of quality, perhaps especially for Champagne, which is seen by many consumers as the highest quality SW. Sweetness level was also among the most cited for importance in our study, consistently with other reports highlighting the importance of residual sweetness in consumer preference of SW [46].
With respect to which cues were among the most important in making SW purchase decisions, high subjective wine knowledge was positively associated with manufacture and negatively associated with packaging. It is possible that those who perceive themselves as more knowledgeable view manufacturing information (e.g., cuvee close or methode traditionelle) as important indicators of the intrinsic quality of the wine, while those with low(er) perceived knowledge rely more on packaging cues, and perhaps label information specifically, for indications of quality. Alternatively, label information typically contains a description of the sensory attributes of a wine [12], and previous work has suggested that SW consumers with high subjective wine knowledge view such descriptions very unfavourably [3]. Interestingly, females were significantly more likely than males to cite target end use amongst the most important purchase cues. This is an important and unique finding as it suggests that the social context and situational elements (e.g., the occasion and food match) of the consumption environment are particularly salient for females. Thus, target end use information may be an important label element to include on SW targeted at females and to promote in retail communications with female customers, such as shelf talkers and recommendations by sales staff.

4.3. Purchase Cues Interact with Wine Involvement

The number of total cues and cue categories selected as important in making SW purchase decisions increased with wine involvement, consistent with speculation that low-involvement wine consumers are less cognitively involved than the more highly involved [47]. They may rely less on processing factual information about the product [48]—possibly due to lower perceived knowledge and confidence [15]—and instead use family and friends more in their decision making [49]. Our results also show that parentage and prestige/reputation are particularly important to more highly involved SW consumers. Prior work has also suggested that these and related elements of brand image and symbolism can influence SW purchase decisions generally [33], and we extend that finding to show that it varies with wine involvement. Thus, SW marketing initiatives for “higher-end” consumers and products, including development of promotional materials, should take care to ensure they reflect these values.
The importance of price in making purchase decisions decreased with involvement level. As speculated for table wine, less involved consumers may wish to reduce the potential financial risk of buying wine that is unsuitable by choosing less expensive alternatives, and thus would value price as an important purchase cue [23]. Additionally, more involved SW consumers may be less sensitive to potential financial risk as their household income is higher.
In broad agreement with one study [22], but in contrast with another for table wine [27], we found that low-involvement consumers were less likely to identify endorsements as important and high-involvement consumers were more likely to select them as important. The discrepancy with the latter study [27] may reflect a genuine difference attributable to wine style (SW vs. Shiraz table wine), or possibly changes in consumers themselves over the approx. 16 years between the recruitment of each study’s cohort. Given the nominally greater importance placed on quality by more highly involved consumers (p (Fisher’s exact test for number of times quality is cited as important, high vs. low) = 0.045), it is possible that endorsements are serving as an important de facto indicator of quality for these consumers. Thus, marketers may wish to promote product endorsements in retail channels used more by highly involved consumers (e.g., wineries and online and specialty wine stores) and/or in corresponding media (e.g., wine magazines). It is possible that our packaging finding (Table 3) reflects a similar indicator of quality for at least some more highly involved consumers, as previously suggested for table wine [50,51], and suggests that the packaging elements of premium SW should reflect the expectations of involved consumers around pedigree and inferred quality.
This latter finding is interesting in the context of pressure for the wine industry to transition to less conventional packaging, including lighter bottles, in order to promote greater sustainability [52,53]. Wine bottle manufacture, filling, and distribution represent the most carbon-intensive processes in wine production (reviewed in [54]), with greenhouse gas emissions attributable to the transport of bottled wines being especially impacted by bottle weight and the focus of much recent attention in both the popular and academic literature (e.g., [52,55]). Sparkling wine bottles are especially heavy due to functional requirements from the greater internal pressure, yet bottle weight may lead to higher price and quality expectations of consumers [56], especially those with higher wine expertise [55]. So, while highly involved wine consumers are more inclined to engage with sustainably produced wine in their purchase decisions [57], there is a concurrent need for consumer education around the sustainability-related benefits of the various alternative packaging initiatives currently under study, particularly given the importance of packaging in cuing quality for more highly involved SW consumers.

4.4. Limitations and Other Considerations

Our study is not without limitations. The age of our sample was relatively high (51.5 years); we encourage further investigation into the importance of cues and wine involvement effects for younger consumers, particularly in light of prior studies that have reported age differences in SW consumption behaviour [13] and the use of purchase cues [3]. Additionally, given that cultural context can affect SW engagement [5], future research should consider testing the generalisability of our findings in other markets/countries.
Several studies (e.g., [33,58]) have shown that SW purchase decisions are sometimes linked to the intended consumption occasion (e.g., dinner party or gift), and prior research with table wine suggests that the occasion not only affects the importance of purchase cues but is mediated by involvement level (e.g., [42]). Thus, we encourage this finding to be explored within the context of SW. Finally, rather than a reliance on self-reported importance ratings for purchase cues, more nuanced insights may be possible in future research by using alternative methodologies. In particular, the discrete choice experiment approach of some researchers [27] and variants may allow for elucidation of the interactions between cues, at least in the context of those pertaining to label information.
In this study, we show that SW consumers can be categorised into actionable market segments based on their level of wine involvement. We also describe a shortened version of the Bruwer and Huang scale [40] that retains each of the five original wine involvement dimensions and appears well positioned as a robust and rapid measure of the construct. We describe the relative importance of 30 intrinsic and extrinsic SW purchase cues, and for the first time examine how this set of cues varies with level of wine involvement. Our findings inform scholarship around the drivers and complexity of consumer decision making and provide guidance to SW marketers and retailers on aligning their products and communications with the needs and perceptions of their customers.

Author Contributions

Conceptualisation, G.J.P.; methodology, G.J.P. and B.K.; formal analysis, G.J.P.; investigation, G.J.P.; data curation, G.J.P.; writing—original draft preparation, G.J.P.; writing—review and editing, G.J.P. and B.K. supervision, G.J.P. and B.K.; project administration, G.J.P. and B.K.; funding acquisition, G.J.P. and B.K. All authors have read and agreed to the published version of the manuscript.

Funding

This research was funded by the Ontario Grape and Wine Research Inc. (Project Grant # 002100) to G.J.P.and B.K.

Data Availability Statement

The data presented in this study are available on request from the corresponding author.

Acknowledgments

Thank you to Shannon Ruzgys, Hannah Pickering, Margaret Thibodeau, and Gillian Dale, Brock University, for technical support/editorial assistance.

Conflicts of Interest

The authors declare that this study received funding from the Ontario Grape and Wine Research Inc. The funder had no other involvement in the study.

Appendix A

Table A1. Survey questions used in study.
ConstructMeasure(s)Response OptionsScaleSource
DemographicsAge19–24, 25–34, 35–45, 46–54, 55–65, 65+Categorical—select one-
GenderMale, Female, Non-binary/third gender, Prefer to self-describe, Prefer not to sayCategorical—select one[39]
Household incomeUnder 25 k, 25–45 k, 46–65 k, 66–85 k, 86–100 k, 101–200 k, 200 k+Categorical—select one[39]
EducationHigh school cert./equivalent or less; Apprenticeship or trades certificate/diploma; College qualification; University undergraduate qualification; University graduate degreeCategorical—select one[39]
Wine consumption and involvementOn average, how many times a month do you drink wine0, 1, 2, 3, 4, 5, 6, 7, 8, 9, 10, 11, 12, 13, 14, 15–19, 20–24, 25–29, 30 or more.Quantitative[38]
On days when you drink wine, how many standard drinks do you consume? (a standard drink is 5 oz. wine)1, 2, 3, 4, 5, 6, 7, 8, 9, 10 or moreQuantitative[38]
Wine involvement1. I have a strong interest in wine
2. I often read wine magazines and publications
3. I drink wine mainly on special occasions (r)
4. I often match my food & wine
5. I own proper wine glasses (e.g., Riedel, Spiegelau, etc.)
6. I seldom decant red wines (r)
7. Drinking wine gives me pleasure
8. I enjoy and often attend wine tasting events
9. Deciding which wine to buy is an important decision for me
10. I am not confident in my ability to select a wine (r)
5-point Likert (strongly disagree-strongly agree)[39], as adapted from [1]
Wine knowledgeSubjective wine knowledge1. I feel quite knowledgeable about wine
2. Compared to most other people, I know less about wine (r)
3. When it comes to wine, I really do not know a lot (r)
4. Among my friends, I am one of the ‘experts’ on wine
5-point Likert
(strongly disagree -strongly agree)
Adapted from [35]
Objective sparkling wine knowledgeIn sparkling wine made using the ‘Traditional Method’, the bubbles are produced from a fermentation that takes place in the bottle; The process of aging sparkling wines on lees (or dead yeast cells) is called ‘Charmat’; In Champagne, Riesling and Pinot gris are 2 common grape varieties used in sparkling wine. Trident Estate and Kempo Vineyards are 2 of Ontario’s main sparkling wine producers; Pinot noir and Chardonnay are 2 grape varieties commonly used for Ontario sparkling wine; Ontario sparkling wine must be bottle-aged a minimum of 2 years before it can be sold.Categorical.
(True/False/I don’t know)
-
Sparkling wine behaviour
a
Fizz consumption
Fizz purchase involvement & behaviour
Intrinsic
Extrinsic
On average, how often do you drink sparkling wine?Never; Once a year; 2–4 times a year; 5–10 times a year; once a month; 2–3 times a month; 1–2 times a week; more than twice a week.Quantitative-
On days when you drink sparkling wine how many standard drinks do you consume? (a standard drink is 5 oz. wine):1, 2, 3, 4, 5 (a bottle), more than 5.Quantitative-
When you drink sparkling wine, how often is it as a mix (e.g., a mimosa or other cocktail)?Never; Occasionally; Often; Always.Categorical—select one-
Where do you buy your sparkling wine from?: LCBO store; LCBO online; Other online source, including wine club; Winery store; Pub; Restaurant; OtherAll of the time; Most of the time; Some of the time; Never.Categorical—select one-
When buying sparkling wine, how much do you typically pay per 750 mL bottle (or equivalent)?$8–14.99; $15–19.99; $20–24.99; $25–29.99; $30–39.99; $40 or moreCategorical—select one-
How much of the sparkling wine that you buy and/or drink is from the following regions?: Ontario; Elsewhere in Canada; International; I don’t know where the wine is from0%; 25%; 50%; 75%; 100%Categorical.
(Total must = 100%)
-
When drinking sparkling wine, how often is it (leave blank if you never drink or don’t know): Prosecco (from Italy); Champagne (from France); Cava (from Spain); Sekt (from Germany); Asti (from Italy); Crémant (from France); Australian sparkling wine; OtherAll the time; most of the time; some of the time; rarely.Categorical-
When buying Ontario sparkling wine, how much do you typically pay per 750 mL bottle (or equivalent)?$10–14.99; $15–19.99; $20–24.99; $25–29.99; $30–39; $40–59.99; $60 or more.Categorical—select one-
How much do you like the following styles of Ontario sparkling wines? Champagne style (dry, bready, yeasty); Sweet, perfumed and less fizzy (like Moscato or Asti); Light & fruity (like Prosecco); Pét-nat (cloudy ‘naturally sparkling’ wine); Other (please state)Dislike extremely; Dislike very much; Dislike moderately; Dislike slightly; Neither like nor dislike; Like slightly; Like moderately; Like very much; Like extremely; I have never tried this style.Quantitative
(9-point hedonic scale)
-
Purchase cuesPlease select the factors (if any) that are important to you when considering which sparkling wine to buy and/or drinkWhat I expect it to taste like; The style of wine; The sweetness level; The quality; Colour; Aroma; Flavour; Effervescence; Grape variety/blend; Vintage (including whether it is non-vintage or not); How the wine was produced (e.g., bottle-fermented); Match with food; Alcohol content; Bottle shape; Bottle colour; Ease of use (e.g., how easy to open the bottle); The country the wine is from; The appellation or sub-region the wine is from; Price; Label information; Label design; Advice from others (e.g., friends, LCBO staff); Expert reviews; The occasion (e.g., whether buying as a gift or celebration); The wine company; The brand name; Awards, stars, etc won by the wine; The prestige of the wine; The reputation of the wine; Who I’ll be drinking it with.Categorical
Check-all-that-apply
[14,35]
Please select the MOST important factors to you when considering which sparkling wine to buy and/or drink (select up to 5)Cues selected in prior question are presentedCategorical
Check-all-that-apply
-
(r) Reverse coded for analysis purposes.
Table A2. Measures of importance of sparkling wine purchase cues for total sample (n = 609).
Cue Item *TypeCategoryPrevalence of Citation
ImportantMost Important
Frequency Cited% Consumers Selecting ItemFrequency
Cited
% Consumers Selecting Item
Taste expectationIntrinsicSensory2253710818
Style of wineSensory12621234
Sweetness levelSensory3225320734
QualitySensory3275422437
ColourSensory8814122
AromaSensory16828539
FlavourSensory3445618631
EffervescenceSensory14524447
How producedManufacture9015193
Grape variety/blendManufacture19131478
VintageManufacture8714193
Alcohol contentAlcohol176299516
PriceExtrinsicPrice4206932554
Advice from othersEndorsements186317713
Expert reviewsEndorsements10217325
Awards, stars, etc.Endorsements8113274
The occasionTarget—end use2614310117
Food matchTarget—end use10317346
Who drinking it withTarget—end use205347212
Ease of useTarget—end use11018295
The wine company/brandParentage18030508
Prestige of the winePrestige/Reputation9015193
Reputation of the winePrestige/Reputation20233569
The country it is fromPlace3225314023
The sub-regionPlace12821183
Bottle shapePackage8314102
Bottle colourPackage55991
Bottle sizePackage22837488
Label informationPackage14223203
Label designPackage9716183
* The wording of some cues has been abbreviated; refer to the text (Materials and Methods) for the complete cue presented to participants.

References

  1. Bruwer, J.; Huang, J. Wine product involvement and consumers’ BYOB behaviour in the South Australian on-premise market. Asia Pac. J. Mark. Logist. 2012, 24, 461–481. [Google Scholar] [CrossRef]
  2. Cox, D. Predicting consumption, wine involvement and perceived quality of Australian red wine. J. Wine Res. 2009, 20, 209–229. [Google Scholar] [CrossRef]
  3. Pickering, G.J.; Duben, M.; Kemp, B. The importance of informational components of sparkling wine labels varies with key consumer characteristics. Beverages 2022, 8, 27. [Google Scholar] [CrossRef]
  4. Bruwer, J.; Chrysochou, P.; Lesschaeve, I. Consumer involvement and knowledge influence on wine choice cue utilisation. Br. Food J. 2017, 119, 830–844. [Google Scholar] [CrossRef]
  5. Charters, S.; Velikova, N.; Ritchie, C.; Fountain, J.; Thach, L.; Dodd, T.H.; Fish, N.; Herbst, F.; Terblanche, N. Generation Y and sparkling wines: A cross-cultural perspective. Int. J. Wine Bus. Res. 2011, 23, 161–175. [Google Scholar] [CrossRef]
  6. Richardson, P.S.; Dick, A.S.; Jain, A.K. Extrinsic and intrinsic cue effects on perceptions of store brand quality. J. Mark. 1994, 58, 28–36. [Google Scholar] [CrossRef]
  7. Veale, R.; Quester, P. Tasting quality: The roles of intrinsic and extrinsic cues. Asia Pac. J. Mark. Logist. 2009, 21, 195–207. [Google Scholar] [CrossRef]
  8. Elliot, S.; Barth, J.E. Wine label design and personality preferences of millennials. J. Prod. Brand Manag. 2012, 21, 183–191. [Google Scholar] [CrossRef]
  9. Charters, S.; Lockshin, L.; Unwin, T. Consumer responses to wine bottle back labels. J. Wine Res. 1999, 10, 183–195. [Google Scholar] [CrossRef]
  10. Barber, N.; Almanza, B.A. Influence of wine packaging on consumers’ decision to purchase. J. Foodserv. Bus. Res. 2007, 9, 83–98. [Google Scholar] [CrossRef]
  11. Kelley, K.; Hyde, J.; Bruwer, J. US wine consumer preferences for bottle characteristics, back label extrinsic cues and wine composition: A conjoint analysis. Asia Pac. J. Mark. Logist. 2015, 27, 516–534. [Google Scholar] [CrossRef]
  12. Mueller, S.; Lockshin, L.; Saltman, Y.; Blanford, J. Message on a bottle: The relative influence of wine back label information on wine choice. Food Qual. Prefer. 2010, 21, 22–32. [Google Scholar] [CrossRef]
  13. Lerro, M.; Vecchio, R.; Nazzaro, C.; Pomarici, E. The growing (good) bubbles: Insights into US consumers of sparkling wine. Br. Food J. 2020, 122, 2371–2384. [Google Scholar] [CrossRef]
  14. Thomas, A.; Pickering, G. The importance of wine label information. Int. J. Wine Mark. 2003, 15, 58–74. [Google Scholar] [CrossRef]
  15. Dodd, T.H.; Laverie, D.A.; Wilcox, J.F.; Duhan, D.F. Differential effects of experience, subjective knowledge, and objective knowledge on sources of information used in consumer wine purchasing. J. Hosp. Tour. Res. 2005, 29, 3–19. [Google Scholar] [CrossRef]
  16. Frøst, M.B.; Noble, A.C. Preliminary study of the effect of knowledge and sensory expertise on liking for red wines. Am. J. Enol. Vitic. 2002, 53, 275–284. [Google Scholar] [CrossRef]
  17. Mueller, S.; Francis, L.; Lockshin, L. The Relationship between Wine Liking, Subjective and Objective Wine Knowledge: Does It Matter Who Is Your ‘Consumer’ Sample? Ph.D. Dissertation, AWBR Academy of Wine Business Research, Adelaide, Australia, 2008. [Google Scholar]
  18. Lockshin, L.S.; Cohen, E. Using product and retail choice attributes for cross-national segmentation. Eur. J. Mark. 2011, 45, 1236–1252. [Google Scholar] [CrossRef]
  19. Dholakia, U.M. A motivational process model of product involvement and consumer risk perception. Eur. J. Mark. 2001, 35, 1340–1362. [Google Scholar] [CrossRef]
  20. Rothschild, M.L. Perspectives on involvement: Current problems and future directions. Adv. Consum. Res. 1984, 11, 216–217. [Google Scholar]
  21. Rothschild, M.L. Advertising strategies for high and low involvement inventory in marketing. In Attitude Research Plays for High Stakes; Mahoney, J., Silverman, B., Eds.; American Marketing Association: Chicago, IL, USA, 1979; pp. 74–93. [Google Scholar]
  22. Koksal, H.; Seyedimany, A. Wine consumer typologies based on level of involvement: A case of Turkey. Int. J. Wine Bus. Res. 2023, 35, 597–613. [Google Scholar] [CrossRef]
  23. Quester, P.G.; Smart, J. Product involvement in consumer wine purchases: Its demographic determinants and influence on choice attributes. Int. J. Wine Mark. 1996, 8, 37–56. [Google Scholar] [CrossRef]
  24. Yuan, J.; Morrison, A.M.; Cai, L.A.; Linton, S. A model of wine tourist behaviour: A festival approach. Int. J. Tour. Res. 2008, 10, 207–219. [Google Scholar] [CrossRef]
  25. Capitello, R.; Sirieix, L. Consumers’ perceptions of sustainable wine: An exploratory study in France and Italy. Economies 2019, 7, 33. [Google Scholar] [CrossRef]
  26. Pickering, G.J.; Best, M. An exploration of consumer perceptions of sustainable wine. J. Wine Res. 2023, 34, 232–246. [Google Scholar] [CrossRef]
  27. Lockshin, L.; Wade, J.; d’Hauteville, F.; Perrouty, J.P. Using simulations from discrete choice experiments to measure consumer sensitivity to brand, region, price, and awards in wine choice. Food Qual. Prefer. 2006, 17, 166–178. [Google Scholar] [CrossRef]
  28. Barber, N.; Almanza, B.; Dodd, T. Relationship of wine consumers’ self-confidence, product involvement, and packaging cues. J. Foodserv. Bus. Res. 2008, 11, 45–64. [Google Scholar] [CrossRef]
  29. Perrouty, J.P.; d’Hauteville, F.; Lockshin, L. The influence of wine attributes on region of origin equity: An analysis of the moderating effect of consumers perceived expertise. Agribusiness 2006, 22, 323–341. [Google Scholar] [CrossRef]
  30. Dodd, T.H. Influences of Consumer Attitudes and Involvement on Purchase Behavior in an Industrial Tourism Context. Ph.D. Dissertation, Texas Tech University, Lubbock, TX, USA, 1995. [Google Scholar]
  31. International Organisation of Vine and Wine (OIV). State of the World Vine and Wine Sector in 2022. Available online: https://www.oiv.int/sites/default/files/documents/2023_SWVWS_report_EN.pdf (accessed on 12 December 2023).
  32. Allied Market Research (AMR). Global Sparkling Wines Market, Opportunities and Forecast, 2021–2027. Available online: https://www.alliedmarketresearch.com/sparkling-wines-market-A08370 (accessed on 28 March 2022).
  33. Verdonk, N.; Wilkinson, J.; Culbert, J.; Ristic, R.; Pearce, K.; Wilkinson, K. Toward a model of sparkling wine purchasing preferences. Int. J. Wine Bus. Res. 2017, 29, 58–73. [Google Scholar] [CrossRef]
  34. Cerjak, M.; Tomić, M.; Fočić, N.; Brkić, R. The importance of intrinsic and extrinsic sparkling wine characteristics and behavior of sparkling wine consumers in Croatia. J. Int. Food Agribus. Mark. 2016, 28, 191–201. [Google Scholar] [CrossRef]
  35. Vecchio, R.; Lisanti, M.T.; Caracciolo, F.; Cembalo, L.; Gambuti, A.; Moio, L.; Siani, T.; Marotta, G.; Nazzaro, C.; Piombino, P. The role of production process and information on quality expectations and perceptions of sparkling wines. J. Sci. Food Agric. 2019, 99, 124–135. [Google Scholar] [CrossRef]
  36. Pickering, G.; Kemp, B. Focus the Fizz: Using Consumer Insights to Inform Branding, Labelling and Development of OntarioSparkling Wine; Report for Ontario Grape and Wine Research Inc.: St. Catharines, ON, Canada, 2020; Available online: https://ontariograpeandwineresearch.com/file/download/hGCtL5whAd4irTcVwaHUvQ2020 (accessed on 5 December 2023).
  37. Kemp, B.; Charnock, H.; Pickering, G. What does ‘buying local’ mean to wine consumers? J. Wine Res. 2022, 33, 1–16. [Google Scholar] [CrossRef]
  38. Thibodeau, M.; Bajec, M.; Pickering, G. Orosensory responsiveness and alcohol behaviour. Physiol. Behav. 2017, 177, 91–98. [Google Scholar] [CrossRef]
  39. Pickering, G.J.; Dale, G.; Kemp, B. Optimization and Application of the Wine Neophobia Scale. Beverages 2021, 7, 41. [Google Scholar] [CrossRef]
  40. Giacomarra, M.; Galati, A.; Crescimanno, M.; Vrontis, D. Geographical cues: Evidences from New and Old World countries’ wine consumers. Br. Food J. 2020, 122, 1252–1267. [Google Scholar] [CrossRef]
  41. Lance, C.E.; Butts, M.M.; Michels, L.C. What did they really say? Organ. Res. Methods 2006, 9, 202–220. [Google Scholar] [CrossRef]
  42. Quester, P.G.; Smart, J. The influence of consumption situation and product involvement over consumers’ use of product attribute. J. Consum. Mark. 1998, 15, 220–238. [Google Scholar] [CrossRef]
  43. Koksal, M.H. Segmentation of wine consumers based on level of involvement: A case of Lebanon. Br. Food J. 2021, 123, 926–942. [Google Scholar] [CrossRef]
  44. Ellis, D.; Caruana, A. Consumer wine knowledge: Components and segments. Int. J. Wine Bus. Res. 2018, 30, 277–291. [Google Scholar] [CrossRef]
  45. Dunphy, R.; Lockshin, L. A history of the Australian wine show system. J. Wine Res. 1998, 9, 87–105. [Google Scholar] [CrossRef]
  46. McMahon, K.M.; Diako, C.; Aplin, J.; Mattinson, D.S.; Culver, C.; Ross, C.F. Trained and consumer panel evaluation of sparkling wines sweetened to brut or demi sec residual sugar levels with three different sugars. Food Res. Int. 2017, 99, 173–185. [Google Scholar] [CrossRef]
  47. Lockshin, L.; Spawton, T. Using involvement and brand equity to develop a wine tourism strategy. Int. J. Wine Mark. 2001, 13, 72–81. [Google Scholar] [CrossRef]
  48. Charters, S. Drinking sparkling wine: An exploratory investigation. Int. J. Wine Mark. 2005, 17, 54–68. [Google Scholar] [CrossRef]
  49. Rasmussen, M.K. The Effect of Region of Origin on Consumer Choice Behavior. Master’s Thesis, University of South Australia, Adelaide, SA, Australia, 2001. [Google Scholar]
  50. Lockshin, L.; Rhodus, W. The effect of price and oak flavor on perceived wine quality. Int. J. Wine Mark. 1993, 5, 13–25. [Google Scholar] [CrossRef]
  51. Charters, S.; Pettigrew, S. The dimension of wine quality. Food Qual. Prefer. 2007, 18, 997–1007. [Google Scholar] [CrossRef]
  52. McIntyre, D. The Weight of That Wine Bottle Doesn’t Indicate Quality, and It’s Hurting the Planet. Washington Post, NA, USA. 4 November 2021. Available online: https://link.gale.com/apps/doc/A681264823/AONE?u=anon~328d45e3&sid=googleScholar&xid=3129ded6 (accessed on 12 December 2023).
  53. SWR. Sustainable Wine Roundtable. 2023. Available online: https://swroundtable.org/about-us/ (accessed on 12 December 2023).
  54. Baiano, A. An overview on sustainability in the wine production chain. Beverages 2021, 7, 15. [Google Scholar] [CrossRef]
  55. Soares, J.; Ramos, P.; Poças, F. Is lightweighting glass bottles for wine an option? Linking technical requirements and consumer attitude. Packag. Technol. Sci. 2022, 35, 833–843. [Google Scholar] [CrossRef]
  56. Piqueras-Fiszman, B.; Spence, C. The weight of the bottle as a possible extrinsic cue with which to estimate the price (and quality) of the wine? Observed correlations. Food Qual. Prefer. 2022, 25, 41–45. [Google Scholar] [CrossRef]
  57. Pickering, G.J. Consumer engagement with sustainable wine: An application of the Transtheoretical Model. Food Res. Int. 2023, 174, 113555. [Google Scholar] [CrossRef]
  58. Judica, F.; Perkins, W.S. A means-end approach to the market for sparkling wines. Int. J. Wine Mark. 1992, 4, 10–18. [Google Scholar] [CrossRef]
Figure 1. Distribution of wine involvement scores (n = 1003).
Beverages 10 00019 g001
Figure 2. Importance of sparkling wine purchase cues for entire sample (n = 609). Consumers could select as many factors as were important to them.
Beverages 10 00019 g002
Figure 3. Importance of purchase cues as a function of wine involvement (low, medium, high). *, **, *** indicate p(X2) < 0.05, 0.001, and 0.0001, respectively.
Beverages 10 00019 g003
Table 1. Demographics of sample (n = 1003).
n
Gender
Female517
Male484
Undisclosed2
Age (years)
Mean (SD)51.5 (15.2)
Range 20–89
Household Income
Under CAD 25,00061
CAD 25,000–45,000124
CAD 46,000–65,000151
CAD 66,000–85,000160
CAD 86,000–100,000163
CAD 101,000–200,000279
CAD 200,000+63
Highest Education
High School diploma118
Apprenticeship or trade certificate38
College diploma251
University undergraduate degree329
University graduate degree266
Table 2. Characteristics of wine involvement segments (n = 1003).
Consumer CharacteristicsWine Involvement Level
LowMediumHigh
DemographicsGender (% male/female) NS45/5548/5252/48
Age (years) *53.4 a50.0 b51.2 ab
Household income (CAD) **91,124 b94,063 ab102,871 a
Education (% university/non-university) NS57/4357/4364/36
Involvement and intakeWine involvement (/100) ***53.7 c65.9 b78.1 a
Total wine intake (standard drinks/yr) ***191 b308 a368 a
Wine knowledgeSubjective wine knowledge (/20) ***10.0 c12.4 b14.9 a
Objective sparkling knowledge (/6) ***1.0 c1.3 b1.9 a
Sparkling wine behavior and preferencesIntake (standard drinks/yr) ***16 b23 b41 a
Intake as % of all wine NS10.59.110.8
Consumption frequency (times/yr) ***7.2 b10.8 b16.4 a
Drinks per occasion ***1.8 b1.9 b2.1 a
Frequency of use as a mixer (% never or rarely/more frequently) NS75/2570/3073/27
Typical price paid (CAD/bottle) ***17.9 c20.0 b21.9 a
Typical price paid for Ontario wine ***18.2 c20.3 b21.7 a
Purchase channelLCBO store (% never or some of time/most of time/all of time) **9/25/6611/32/578/41/51
Online—LCBO (% never/more frequently) ***91/1081/2071/30
Online—other (% never/more frequently) **90/1183/1777/23
Winery store (% never/some of the time/most or all of the time) ***61/31/846/47/737/51/13
Pub (% never/more frequently) NS75/2568/3266/34
Restaurant (% never/more frequently) *50/5041/5938/62
PreferencesRegion (>50% purchases) (domestic/international/no pref. (50:50)) NS47/38/1550/32/1841/35/24
International (intake frequency; rarely, never or don’t know/some, most or all of the time)
            Prosecco NS76/2471/2974/26
            Champagne NS79/2173/2776/24
            Cava *90/1087/1383/17
            Sekt NS92/890/1092/8
            Asti NS82/1982/1885/15
            Crémant NS91/988/1286/14
            Australian NS89/1188/1285/15
Domestic (Ontario; 9-point hedonic (liking) scale)
            Champagne—style ***6.2 b6.4 b7.0 a
            Moscato/Asti—style NS6.26.06.2
            Prosecco—style NS6.96.97.1
            Pét-nat ***5.3 b5.8 a6.0 a
*, **, *** signify p(F) or p(χ2) < 0.05, 0.01, and 0.001, respectively. Means with different letters are significantly different from each other (Tukey’s HSD). NS = Not significant.
Table 3. Logistic regression for citation of specific cues as among the most important when purchasing sparkling wine. Reference category for gender is male.
Purchase CuesPredictorsβStandard ErrorWald X2Pr > X2Odds Ratio
PriceWine involvement score−0.1440.0664.7790.0290.98
Subjective wine knowledge−0.0970.0662.1340.1440.95
Gender—female0.0440.0460.9150.3391.18
PackageWine involvement score0.1900.0904.4680.0351.03
Subjective wine knowledge −0.2410.0907.1670.0070.88
Gender—female0.0590.0630.8800.3481.24
ManufactureWine involvement score0.1550.1002.4110.1211.03
Subjective wine knowledge0.2640.1006.9080.0091.15
Gender—female−0.1080.0702.3950.1220.68
Target end useWine involvement score0.1100.0692.5010.1141.02
Subjective wine knowledge−0.0710.0691.0410.3080.96
Gender—female0.0970.0493.9320.0471.42
Disclaimer/Publisher’s Note: The statements, opinions and data contained in all publications are solely those of the individual author(s) and contributor(s) and not of MDPI and/or the editor(s). MDPI and/or the editor(s) disclaim responsibility for any injury to people or property resulting from any ideas, methods, instructions or products referred to in the content.

