Article

Consumer Acceptance and Physicochemical Properties of a Yogurt Beverage Formulated with Upcycled Yogurt Acid Whey

by
Viral Shukla
,
Marcela Villarreal
and
Olga I. Padilla-Zakour
*
Cornell AgriTech, Department of Food Science, Cornell University, Geneva, NY 14456, USA
*
Author to whom correspondence should be addressed.
Beverages 2024, 10(1), 18; https://doi.org/10.3390/beverages10010018
Submission received: 19 December 2023 / Revised: 1 February 2024 / Accepted: 2 February 2024 / Published: 6 February 2024
(This article belongs to the Section Tea, Coffee, Water, and Other Non-Alcoholic Beverages)

Abstract

:
Drinkable yogurts are low-viscosity beverages often created by diluting yogurt with water or high-value-fluid milk. Yogurt acid whey, a typically discarded byproduct of the Greek yogurt industry, may serve as an upcycled ingredient for these types of products with minimal processing. In this study, differing concentrations of acid whey (35%, 40%, and 45% w/w) were added to a mango yogurt beverage with 0.2% and 0.4% w/w stabilizer and analyzed for physicochemical properties over a 40-day period. The analysis indicated that the percentage of acid whey was positively correlated with both viscosity and water-holding capacity. A hedonic sensory analysis of the beverages indicated positive consumer acceptance of such upcycled products, with enhanced acceptance at 25–35% addition. This study demonstrates the potential for consumer acceptance of yogurt beverages upcycled with native-acid whey, providing insights into sustainable practices within the food industry.

Graphical Abstract

1. Introduction

Yogurt is a thickened dairy product created through fermentation with lactic acid bacteria (LAB). A decrease in pH from the lactic acid produced leads to the curdling of the casein, creating what is known as a conventional/ spoonable yogurt. Yogurt has been consumed for thousands of years in various forms. Yogurts that have a lower viscosity, known as drinkable yogurts, have gained popularity as an easier-to-consume product that overlaps the snack and beverage categories [1,2]. The US drinkable yogurt sub-category has shown a 33% growth from 2019 to 2021 and has indicated strong growth independent of yogurt category stagnation and inflation [1]. As opposed to spoonable yogurt, which is handled very carefully, drinkable yogurt production can use high shear stress, such as homogenization, to produce a smooth product. Beyond mechanical stress, liquids such as milk or water may be added to further dilute the yogurt into a drinkable beverage [2].
On the opposite side of the spectrum, products such as Greek yogurt are created by straining excess whey to produce a thick spoonable consistency. This process produces the byproduct known as acid whey at a 1:2 yogurt-to-acid whey ratio [3]. Compared to sweet whey produced from cheese making, acid whey has a low pH (~4.2) and sour yogurt taste. The negative sensory aspects of acid whey often lead to its disposal in favor of high-value casein curd [4]. Environmental concerns with the disposal of yogurt acid whey due to its high biological oxygen demand (>35,000 mg O2/L) and the difficulty of stabilizing the product by spray drying have incentivized the industry to find viable alternatives to upcycle whey [5,6]. In particular, acid whey has difficulties in concentration and fractionization due to its physicochemical properties and protein, ash, and lactose content [7]. Thus, to sustainably use the large amounts of whey produced, acid whey should be used in its native state.
The production of yogurt beverages (drinkable yogurts) requires the addition of high-value fluid milk or low-nutrition water, but they may be replaced with the direct addition of acid whey, thus facilitating its utilization. These yogurt + liquid types of beverages are described by Tamime and Robinson and include common beverages such as Ayra, Doogh, laban, and lassi [2]. Acid whey contains many useful components, such as potassium, phosphorus, and calcium, which can be an added value [8]. Similar flavors between whey and yogurt may lead to a greater acceptance compared to its use in other beverage types, and the addition of fruit or other sources of natural flavors may contribute to masking the acid whey flavor [9]. The literature has shown various examples of its uses, including sweet-whey juice beverages [9], baked goods [10], sauces [11,12], and fermented beverages [13,14], most often taking advantage of the added ash, macronutrient, and sustainable aspects of the ingredient.
The formulation of yogurt acid whey beverages requires examining any possible effects on physicochemical properties and sensory acceptance. The objectives of this study were to develop an upcycled mango-flavored yogurt beverage utilizing native-yogurt acid whey to determine its physicochemical properties over 40 days of refrigerated storage and its consumer acceptability.

2. Materials and Methods

2.1. Materials

Yogurt acid whey was obtained from Greek yogurt from a company in the upstate New York region and pasteurized at 72 °C for 15 s upon receipt in a jacketed steam kettle (Groen TDA-10 QT, Elk Grove, IL, USA). Commercial low-fat mango yogurt (cultured and pasteurized grade A reduced fat milk, skim milk, sugar, mangos, corn starch, agar, pectin, natural flavors, fruit and vegetable concentrates for color) was acquired from Cornell Dairy (Ithaca, New York, NY, USA). The Dairy Blend Acidified Beverage 120 stabilizer (cellulose gum, pectin) was obtained from TIC Gums (White Marsh, MD, USA). Sodium hydroxide and buffer reference standards were acquired from VWR (Radner, PA, USA). All reagents were of food or ACS reagent chemical grade and kept in suitable containment until use.

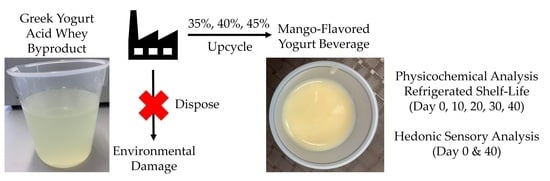
2.2. Beverage Creation

Beverages were made with 35%, 40%, and 45% acid whey w/w, with the rest being mango yogurt to achieve a drinkable consistency. Mango yogurt was selected because it is the most popular flavor from the Cornell Dairy Plant, as per plant management. A 45% water/ 55% yogurt sample served as the control. The stabilizer was added at 0.2% and 0.4% w/w to increase the water-holding capacity. This resulted in 8 experimental conditions (Table 1). The stabilizer was first hydrated at 60 °C then mixed with mango yogurt and any additional whey until homogenous. As matrix stability is a strong factor in shelf life and consumer appeal, stabilizer may be added by industrial processors to enhance their products. Samples were heated to 55 °C and treated with homogenization at 6.9 MPa (FT9 Armfield, Ringwood, Hampshire, UK). Samples were stored in airtight containers in the dark at 4 °C for analysis.

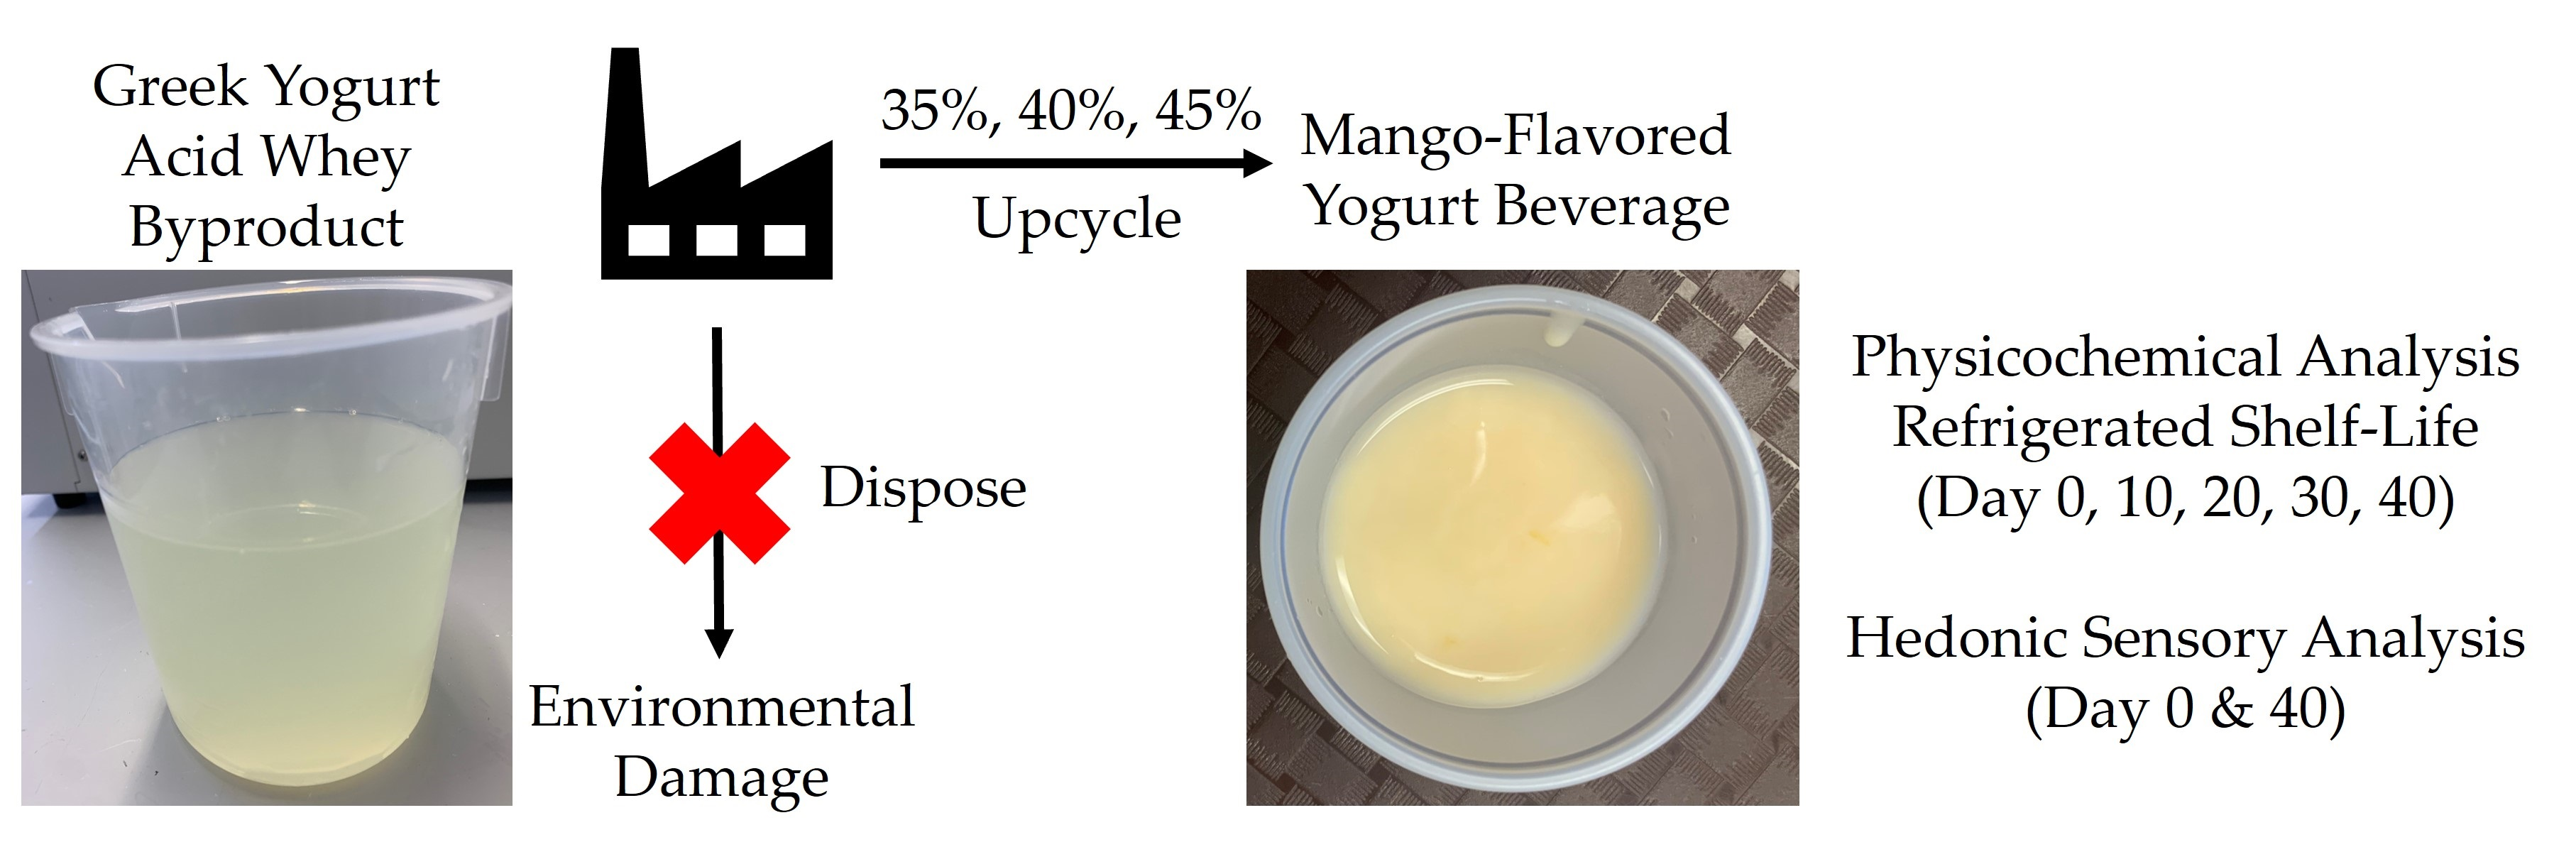
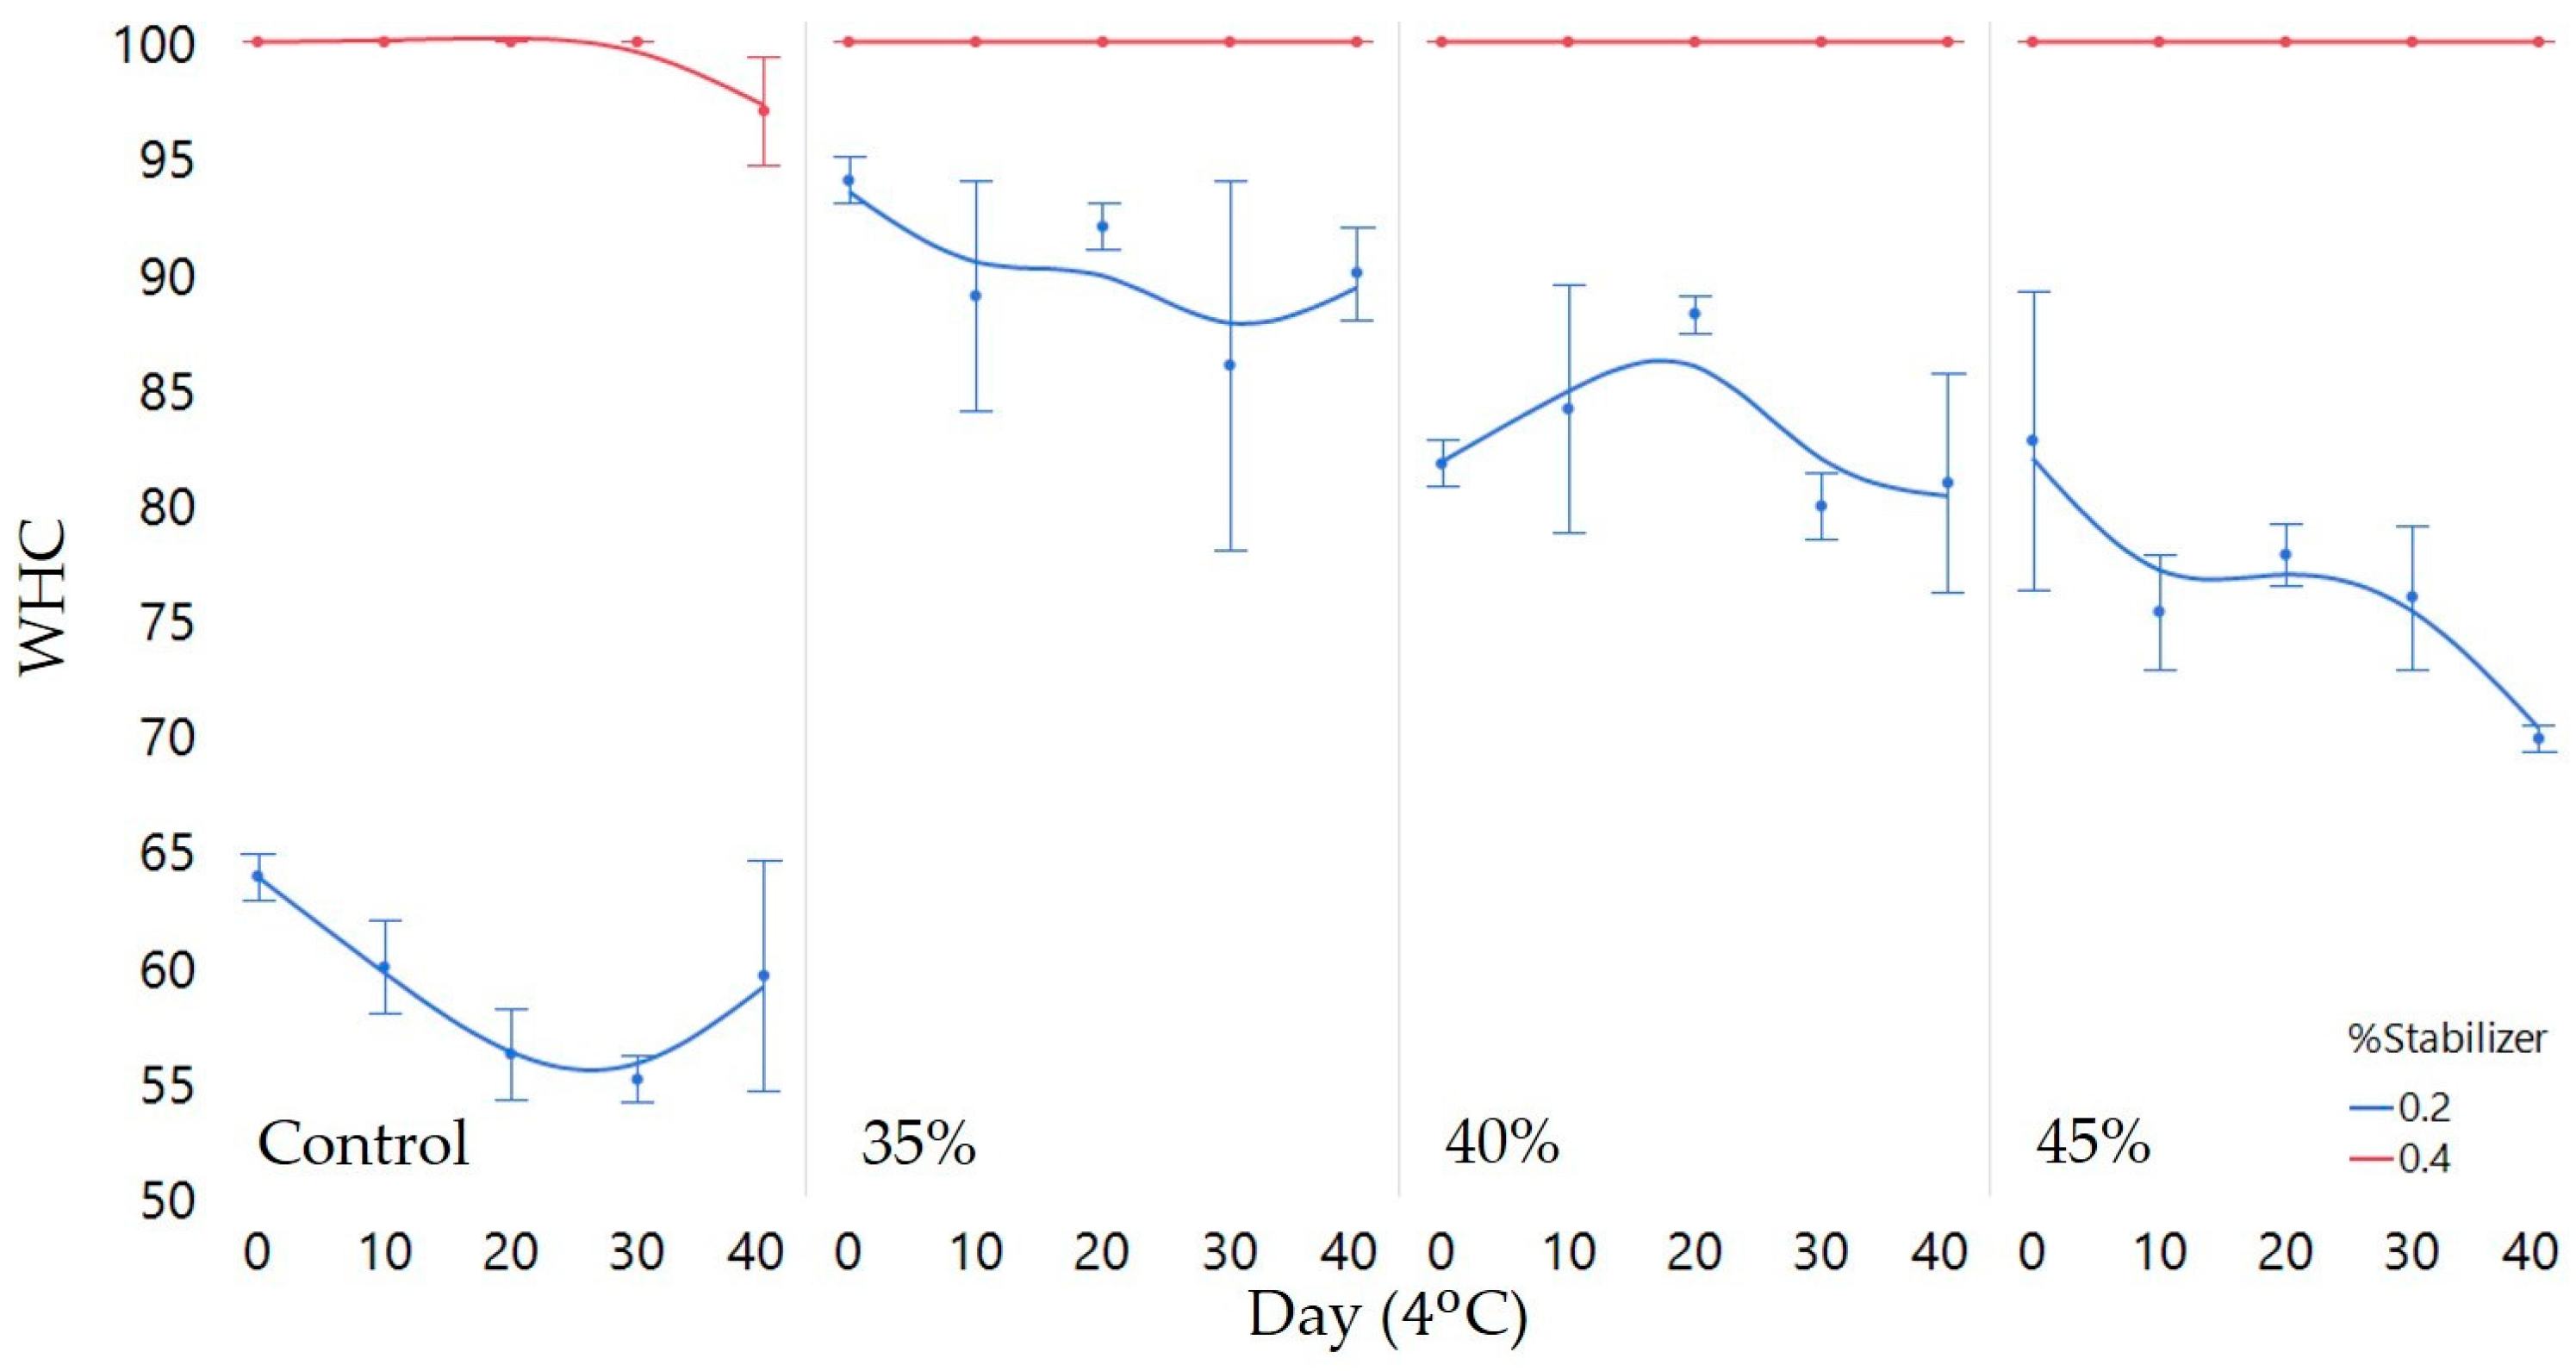
2.3. Physicochemical Characteristics

All samples were tested for various physicochemical properties at 0, 10, 20, 30, and 40 days of refrigerated storage. The pH was measured using an Orion 3-star benchtop pH meter (Thermo Fisher Scientific, Waltham, MA, USA). L*a*b* color values were measured using a bench top Labscan XE, Hunter L*a*b* colorimeter (Hunter Associates Laboratory, Reston, VA, USA) in reflective mode (D65 illuminant, 10° observer angle). The beverage was measured using a 2 cm depth quartz cell. A change in color (ΔE) was determined by the compound distance calculation of the color space:
E * = L * L i * 2 + a * a i * 2 + b * b i * 2
Water-holding capacity (WHC) was measured via centrifuging 15 g of the sample at 2500 rpm for 10 min at 4 °C in a Beckman Avanti J-25 Centrifuge (Beckman Coulter, Brea, CA, USA). WHC was calculated (100 % whey expelled). Titratable acidity (TA) was measured using a G20 compact titrator (Mettler Toledo, Schwerzenbach, Switzerland) [15]. Ten grams of the sample was diluted with 50 mL of deionized water and titrated with 0.1 N NaOH. TA was expressed as g of lactic acid/100 g of the beverage. Viscosity was measured in a Brookfield DV–III ULTRA (Brookfield Engineering Lab Inc., Stoughton, MA, USA) with a VL-1 spindle at 114 rpm and 10 °C. Before the measurement, samples were agitated for 5 s to follow consumer-mixing instructions before drinking a yogurt beverage. Viscosity measurements at a shear rate of 25 s−1 were taken for 30 s and the viscosity value was recorded after 10 s [16].

2.4. Sensory Analysis

An affective sensory test was conducted on mango yogurt beverages using 25, 35, and 45%acid whey and 0.2% stabilizer formulations to determine the consumer appeal of acid whey addition. Compared to the shelf-life study, 40% was removed, and 25% was added. Based on initial evaluations, consumers found it difficult to perceive a difference between 40% and 45% based on texture and other attributes. Consumers also indicated a preference for thicker beverages (less added liquid) when asked about the yogurt beverage category. Due to the difficulty in discerning differences in 5% changes and a desire for thicker beverages, a sensory analysis was conducted at 10% intervals starting at 25% to give a larger spectrum to analyze the consumer appeal of these types of upcycled beverages. The test was conducted in two parts, one after the other. Part 1 was conducted to determine if a difference in preference existed between a yogurt beverage made with acid whey versus water in terms of consumer acceptance. Part 2 was conducted to see if a difference in the amount of acid whey (25%, 35%, 45%) affects consumer acceptance and the characteristics of an acid whey yogurt beverage.
A total of 120 consumers (71% female and 29% male) were recruited from the university and surrounding region through the sensory evaluation center’s communication list. In part 1, participants were asked about their overall liking (1-Dislike extremely to 9-Like extremely) of a 45% (w/w) water–yogurt beverage versus a 45% acid whey yogurt beverage. Additionally, participants were asked to select which sample they preferred. In part 2, an affective test comprised of 9-point hedonic scale questions (1-Dislike extremely to 9-Like extremely) was used to evaluate the appearance, texture, mouth feel, flavor, and overall liking between 25%, 35%, and 45% acid whey yogurt beverages. Five-point and just-about-right (JAR) questions were asked for smoothness, thickness, sweetness, tartness, and mango flavor; a penalty analysis was conducted to analyze the effects of various characteristics on overall liking. Additionally, a 5-point purchase intent question (1-Definitely would not purchase 5-Definitely would purchase) was asked. Panelists were given a statement informing them of the addition of acid whey into the beverages and were asked about their likelihood to purchase the product if it was available to them at the store where they typically shop and at the price that they typically pay for these types of products.
A second qualitative sensory focus group using 45% acid whey and 45% water control was conducted to evaluate acceptability at a 40-day shelf life. A total of 8 consumers (75% female and 25% male) discussed the two samples for 45 min with moderation by the Cornell University Sensory Evaluation Center manager, who is an expert in sensory science.
Panelists were served chilled 50 mL servings in a balanced randomized block test. All samples in the study were blinded using 3-digit codes. Testing was conducted at the Cornell University Sensory Evaluation Center and approved by the Cornell University Institutional Review Board for Human Participants (protocol #1405004676, reviewed in 2021). Informed consent forms were provided to panelists, who were recruited with normal senses of smell and taste. Participants received financial compensation for their participation in the study. Samples were tested to ensure safety. The tests were designed and conducted using RedJade Sensory Evaluation Software (Curion, Deerfield, IL, USA).

2.5. Proximate Analysis

Proximate analysis was conducted on the acid whey for fat (AOAC 954.02) and crude protein (AOAC 992.23). Mineral analysis was conducted using a Thermo iCAP 6300 Inductively Coupled Plasma Radial Spectrometer (Waltham, MA, USA). Analysis was conducted in a commercial analysis laboratory (Dairy One, Ithaca, NY, USA).

2.6. Statistical Analysis

All measurements were taken in duplicates for each triplicate batch of the same formulation, leading to six repetitions. The differences between treatments were determined using a one-way analysis of variance (ANOVA) with Tukey’s HSD. The hypotheses were tested with a confidence level of 95%, using Excel (Microsoft, Redmond, Washington) and SPSS (IBM, Armonk, New York, NY, USA) software. Sensory analysis data were analyzed using RedJade software (Curion, Deerfield, IL, USA).

3. Results

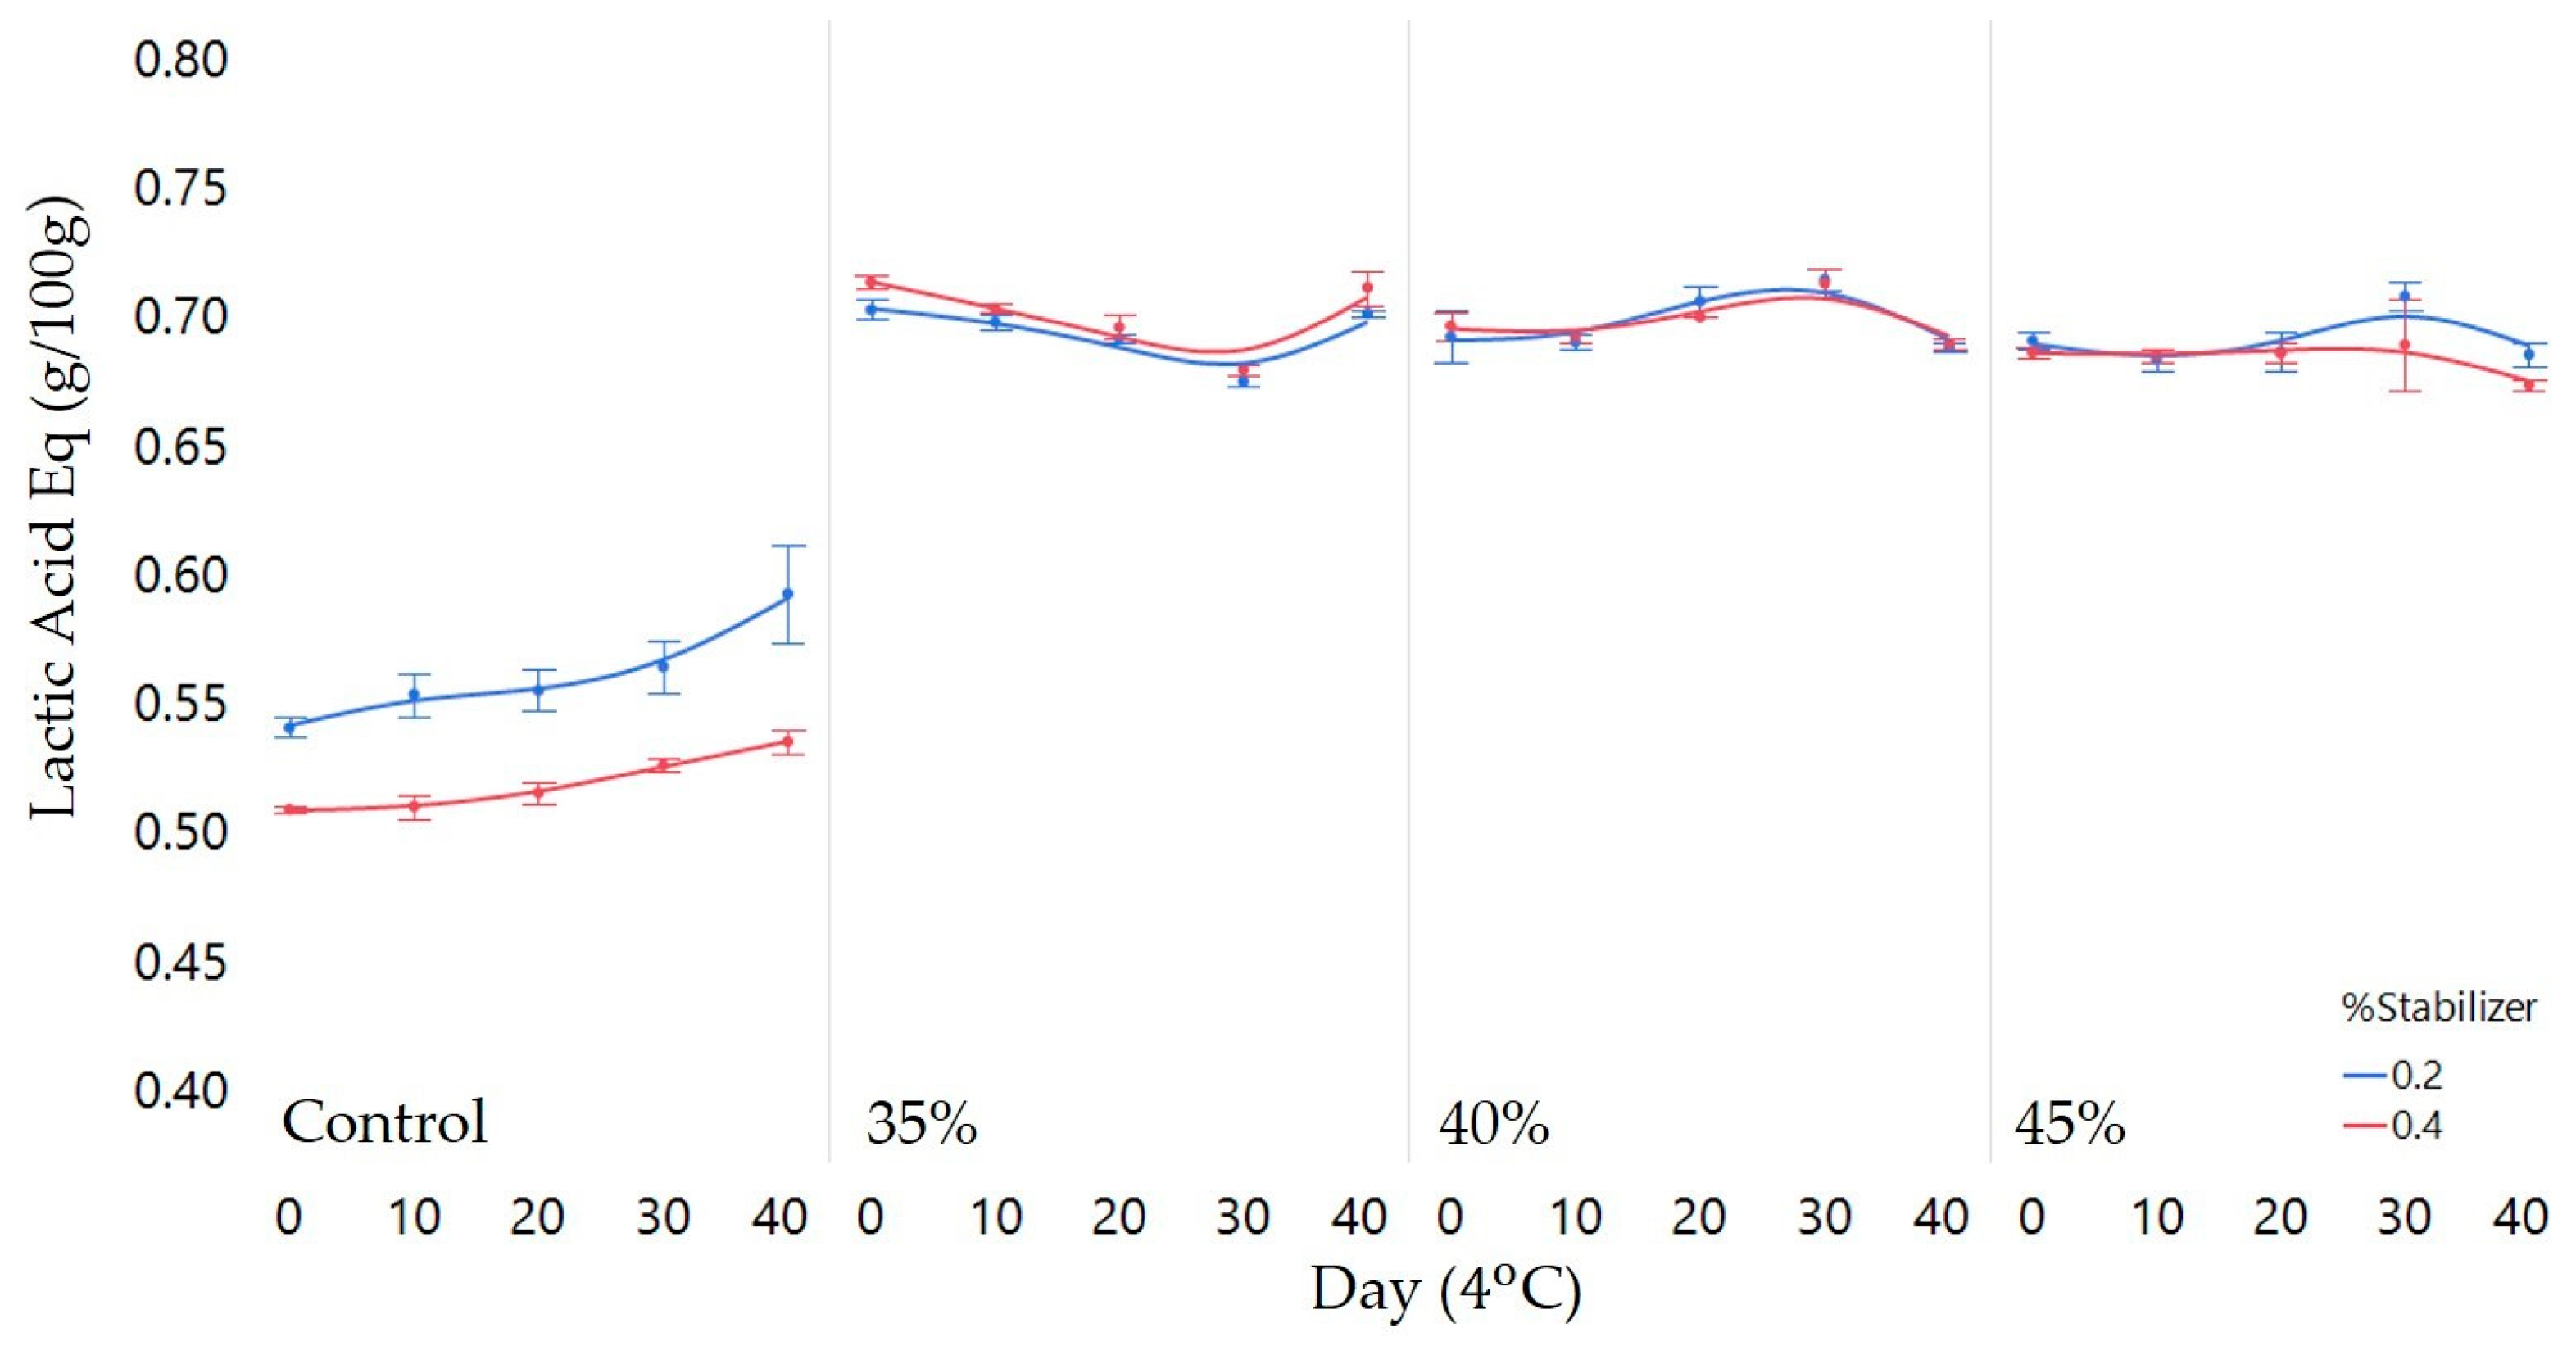
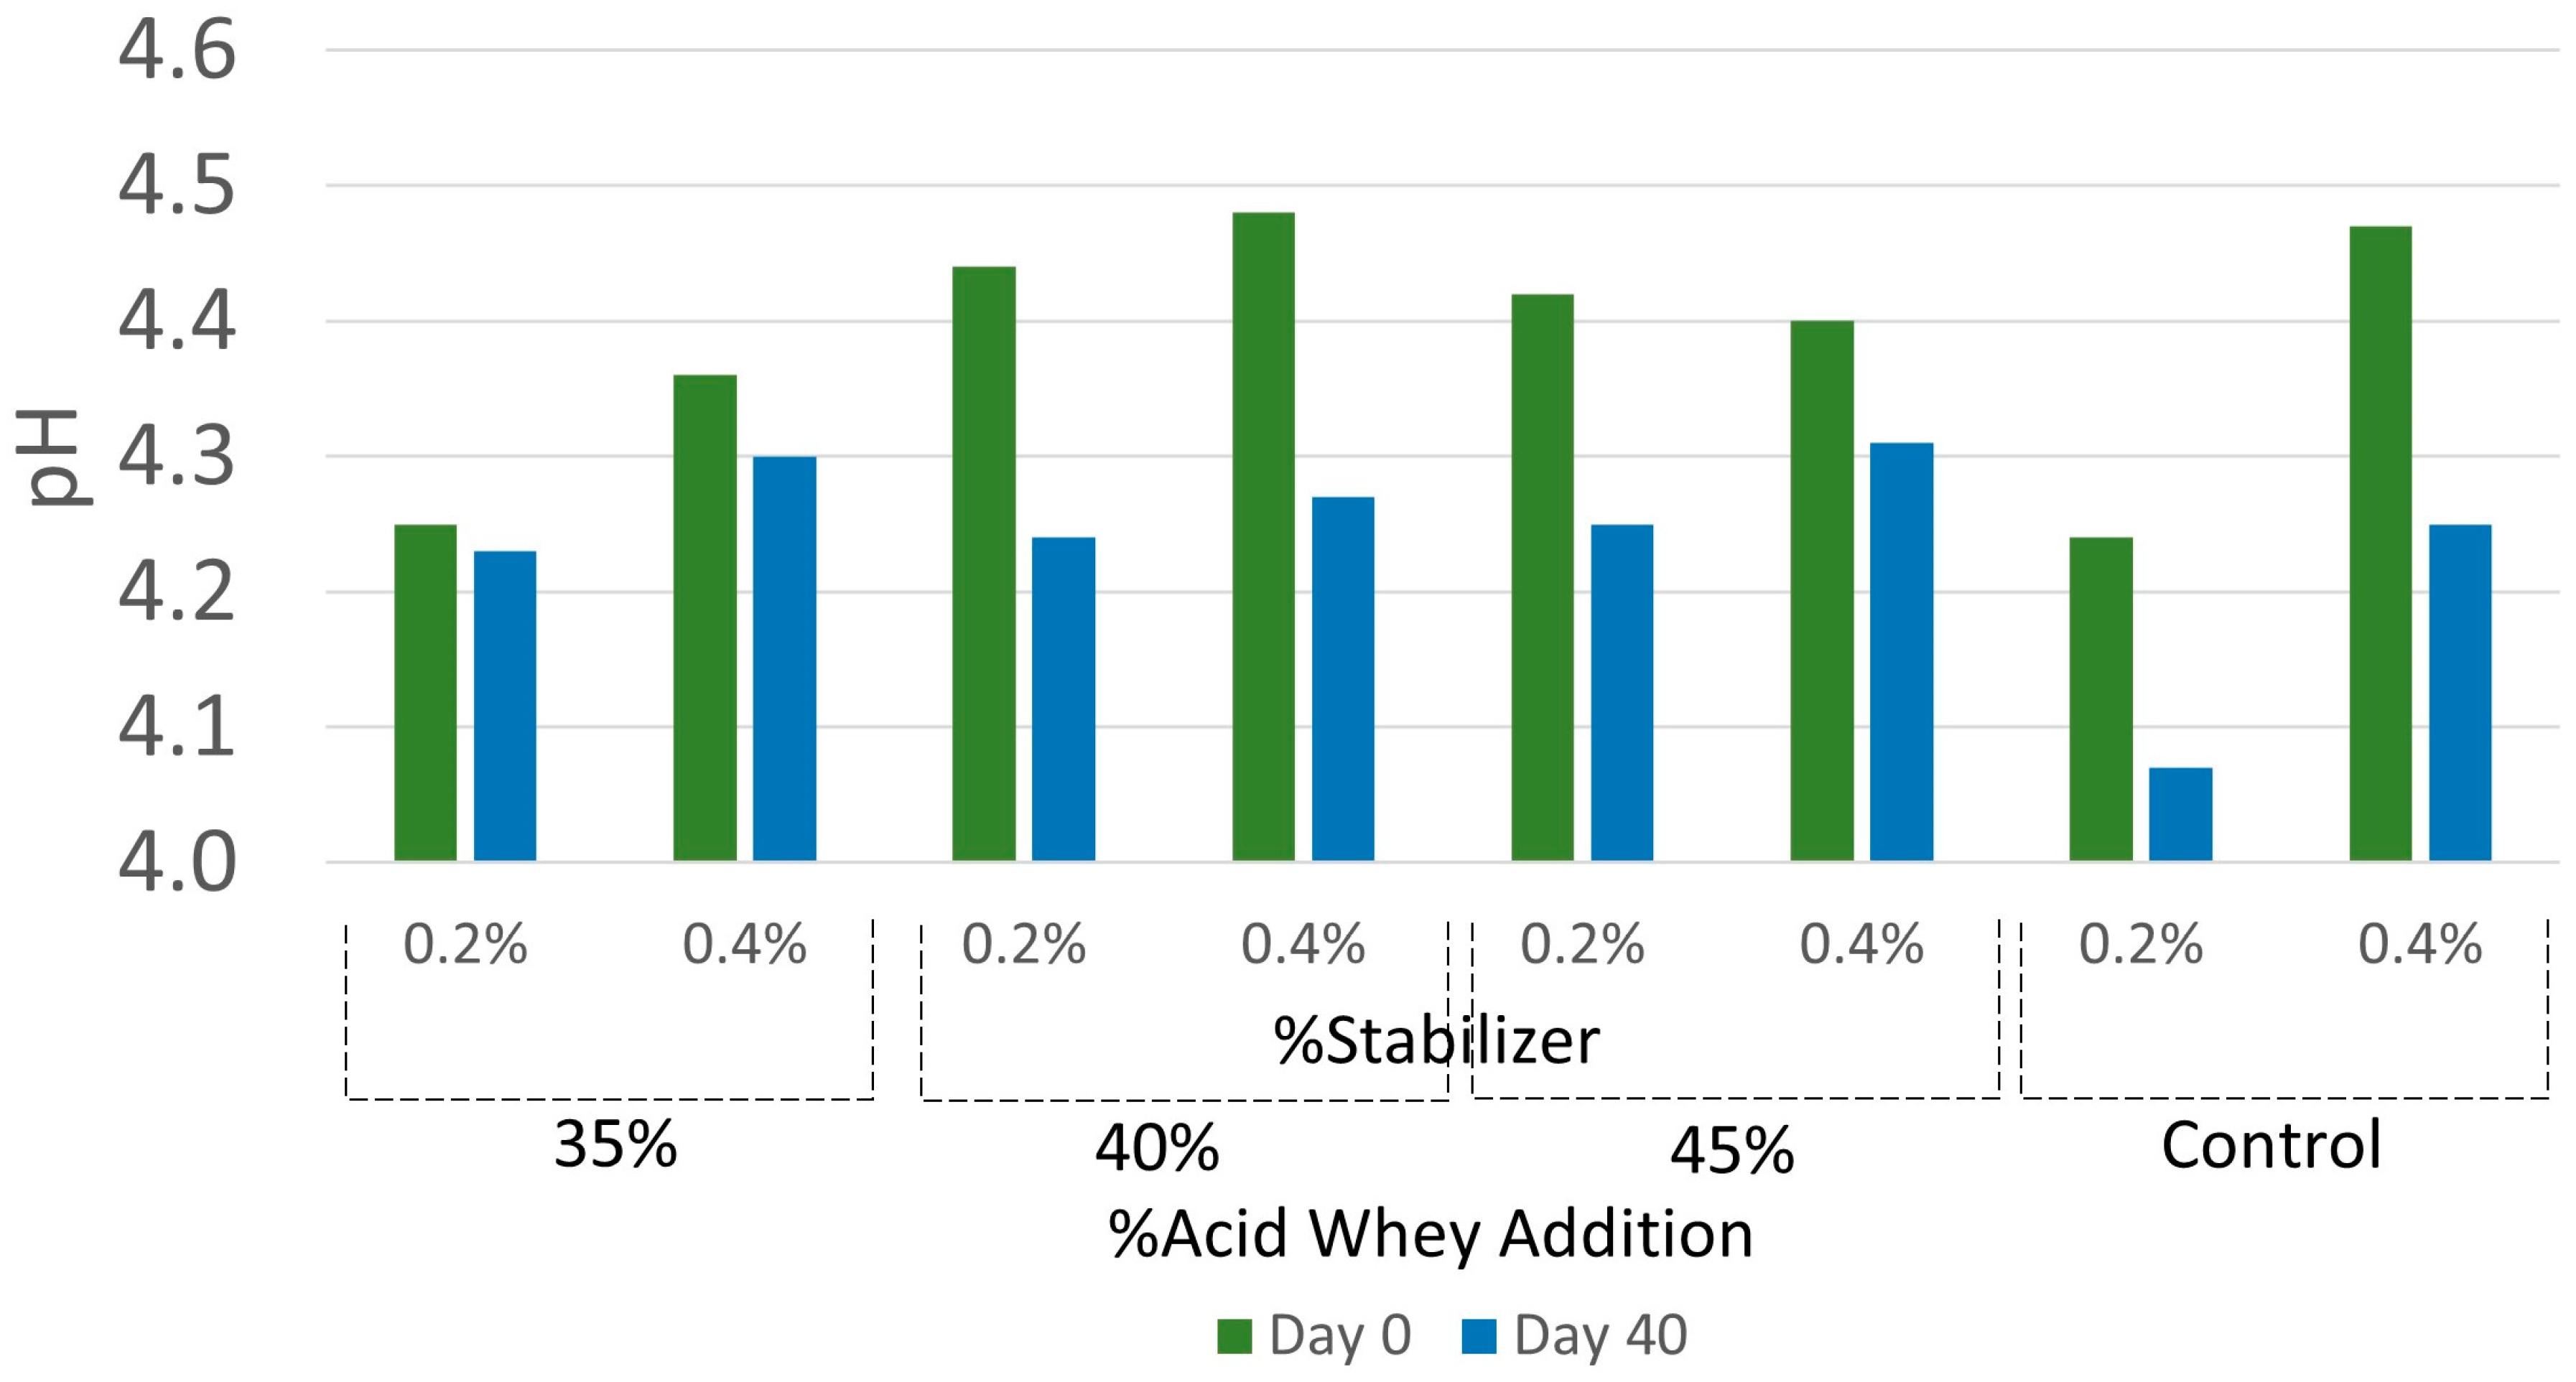
3.1. Physicochemical Characteristics

The water-holding capacity (WHC) is shown in Figure 1. Graphs showing post hoc analysis results can be found in the supplementary materials. WHC indicates the ability of the yogurt matrix to not release water under a centripetal force, with 100% indicating no apparent separation. The stabilizer appears to have a strong effect on WHC, with only 0.4% creating a strong enough water-retaining matrix to be stable for over 40 days in all samples. Acid whey samples, for the most part, did not change significantly (p < 0.05) over time, though a trend of decreasing WHC over the 40 days was apparent. The control sample exhibited a significantly lower WHC in 0.2% stabilizer samples.
The changes in viscosity over shelf life are indicated in Figure 2. Viscosity shows a similar trend to WHC and appears to be visually positively correlated with the stabilizer content. Samples with 0.4% stabilizer showed a significant and relatively large difference between acid whey concentrations, contrary to the case for 0.2% stabilizer samples, which were not significantly different. Control samples with 0.4% stabilizer did not follow a similar trend to whey samples and, while higher than 0.2% samples, were not significantly different from 0.2% whey samples. Over the shelf life, all acid whey samples with 0.4% stabilizer exhibited an increase in viscosity within 10 days that was maintained over 40 days.
Titratable acidity (TA) over shelf life is indicated in Figure 3. TA maintained similar levels between the %stabilizer and %acid whey addition, indicating that yogurt and acid whey have a similar TA. As expected, the control had a lower TA due to the use of water instead of acid whey; however, in this case, the %stabilizer was significant. Control samples also acidified up to 50 mg/100 g of lactic acid equivalents over time. All samples had a pH < 4.6, indicating that they would not present a risk for Clostridium botulinum growth (Figure 4). pH was relatively consistent across samples, including the control, with all experiencing a decrease in pH over the 40 days.
The color components for days 0 and 40 were measured as L*a*b* values, and change in color (ΔE) values were determined between days 0 and 40 (Supplementary Materials). The beverage was orange and not significant (p > 0.05) between samples. Overall, color was not greatly affected over the shelf life, as any changes would be considered unnoticeable based on the ΔE.

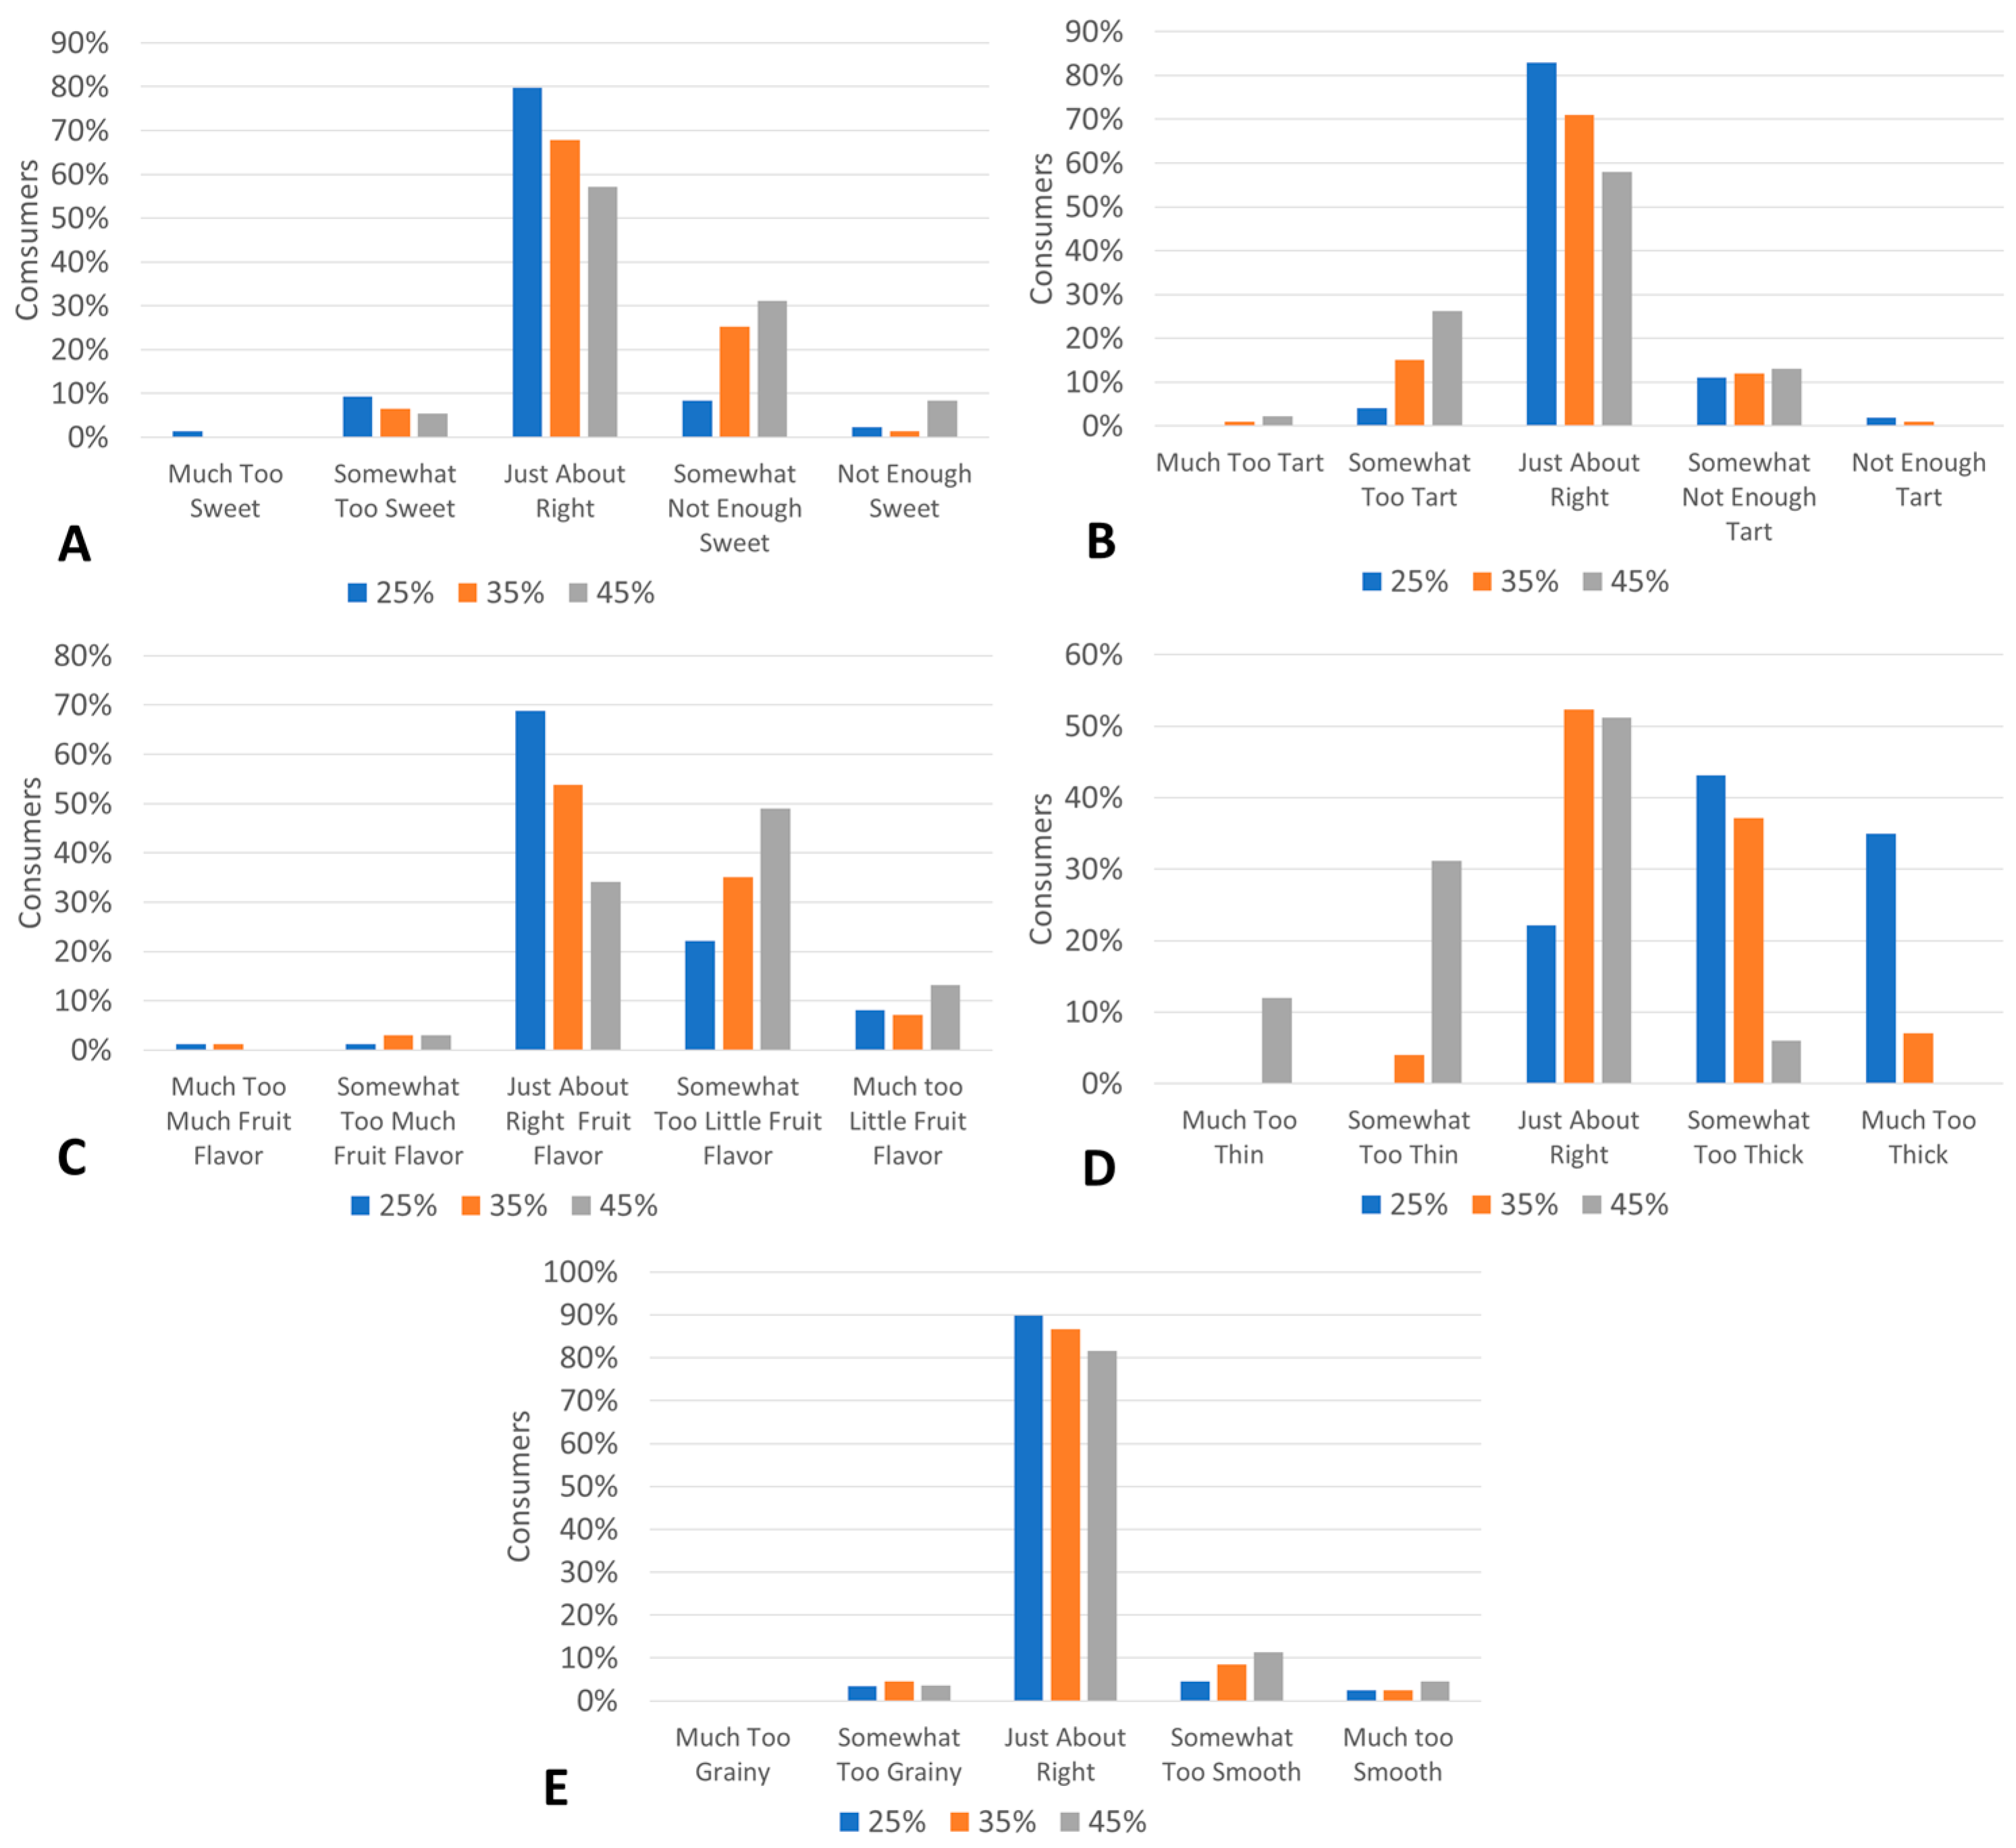
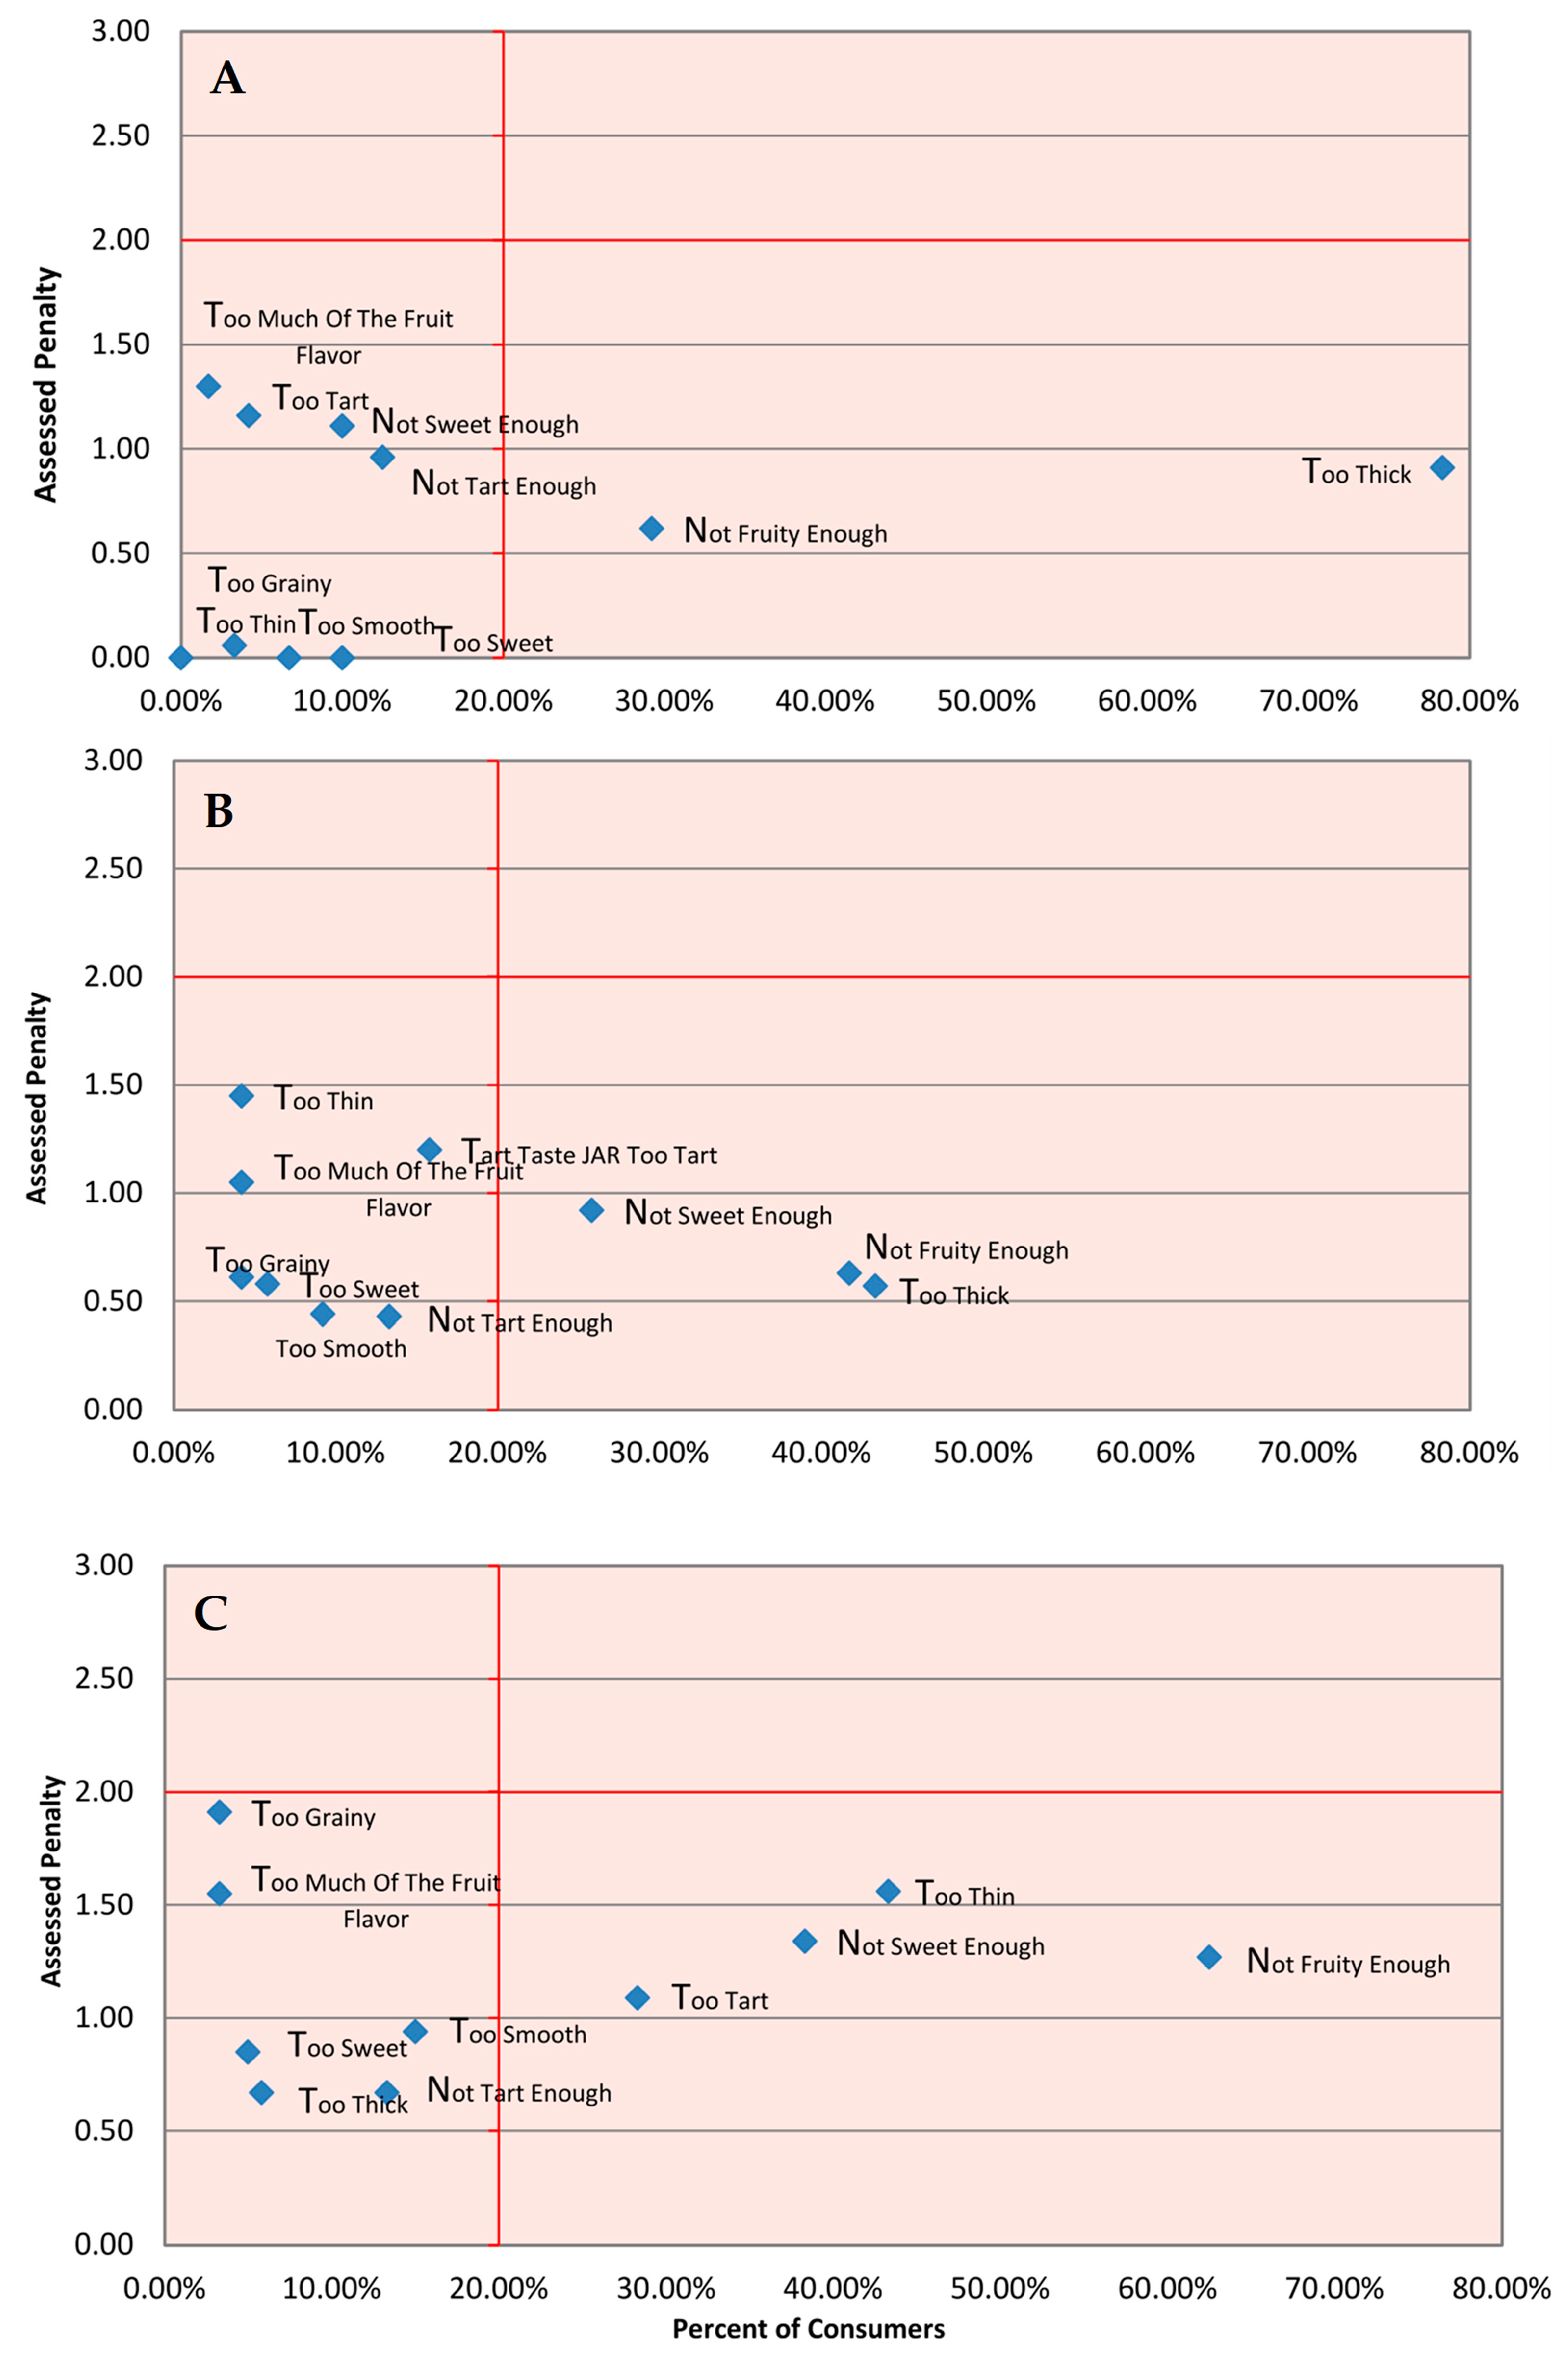
3.2. Sensory Analysis

An affective sensory test was conducted to determine consumer appeal to various additions of acid whey. The first portion of the test determined no significant difference (p > 0.05) in the 9-point overall liking of water (5.95) versus acid whey (6.06). In total, 52.5% of respondents indicated a preference for acid whey over water, citing that the water sample was too watery and that the 45% acid whey sample had a better flavor profile, better balance of sweetness, was more refreshing, and the taste was more memorable. Overall, it was determined that acid whey does not negatively affect the product, and its addition up to 45% is an acceptable substitute compared to water for dilution.
Table 2 shows the mean scores for the 9-point hedonic attribute questions for the second portion. Overall, 25% and 35% acid whey formulations were liked significantly higher than 45% on the 9-point scales, with 35% acid whey receiving higher scores for all except flavor. The JAR scores for sweetness, tartness, fruit flavor, mouth texture, and mouth graininess are shown in Figure 5.
Purchase intent was asked to better determine the acceptability of an upcycled beverage. On a 5-point scale, 57% of panelists stated that they would buy, 35% stated they may or may not buy, and 8% would not. The results show that few panelists would not purchase an upcycled yogurt beverage based on the examples presented in this study.
The penalty analyses of the samples are shown in Figure 6. Penalty analysis plots the mean drop in the overall liking score for a sample by the %consumers indicating a category of a JAR question, e.g., ~80% of panelists found 25% acid whey addition (A) to be too thick, and those scoring the sample as such scored the overall liking of the product to be ~1 point lower than others. The basis for which characteristics are deemed critical varies, but it is generally held that characteristics with a mean drop of <0.75 and consumers < 10% can be disregarded, and those that have consumers > 20% and %consumers * mean drop > 0.3 are critical faults [17,18]. Those that fall between the two ranges may be deemed faults in the product and are less critical. Characteristics with a penalty > 2 and consumers > 20% were deemed critical for acceptability.
A focus group was conducted to evaluate the 45% acid whey and control samples at their end of shelf life. The goal was to obtain consumer feedback regarding acceptability and the associated drivers. Overall, consumers found the whey sample acceptable but one-dimensional in its flavor profile; it was described as unbalanced and mostly sour tasting. The control was preferred overall by the respondents. In terms of aroma, consumers found the aroma character of both test products to be acceptable, with the whey sample having a single dairy note. Overall, both samples were perceived to have a similar appearance that consumers liked: creamy, smooth, appropriate viscosity, and an attractive pale color. The taste and flavor of both products were found to be acceptable, though participants expressed their preference for the control sample as more balanced. Respondents found that both samples had acceptable consistency, which is appropriate for a beverage, although it was noted that the whey sample was somewhat thicker than the control. Respondents experienced an aftertaste of both products. Some found that the aftertaste of the control sample was acceptable compared to the whey sample, which had a much more pronounced aftertaste that was not well-liked. To improve the product, the respondents suggested increasing the fruitiness of the flavor and decreasing the sharper lingering aftertaste, which was also described as astringent and building. In terms of consistency, respondents recommended a smoother and more homogenous texture and the sample to be less thick. Due to the small sample size (n = 8), only qualitative and general trends were collected, and no statistical analysis was conducted on the focus group data.

3.3. Nutrition

Table 3 displays the nutritional information for the products based on proximate analyses conducted at a third-party laboratory.

4. Discussion

4.1. Sensorial and Physicochemical Properties

To be a successful product, the beverage must exhibit preferred characteristics and be physiochemically stable over its shelf life. In order to be a successful form of upcycling, the addition of acid whey should at least be in parity with the control, if not with an added value. According to part one of the sensory analysis, water and acid whey at a 45% addition were both deemed similar in liking as a strong indicator of upcycling acceptance. In total, 45% was chosen as it was the highest percentage of whey addition in this study and would likely have the highest possible impact on acceptance. In terms of pH (Figure 4), the beverage is an acid-fermented food and continues to acidify slightly over 40 days, likely due to the growth of lactic acid bacteria. Samples were within 0.2 pH of each other, and acidity was relatively the same; however, there was a slightly enhanced tartness perceived in samples with 45% acid whey during sensory evaluation. For JAR scores (Figure 5), samples were considered acceptable for sweetness, with a small trend of decreased sweetness perceived with increased whey addition; although there is lactose in acid whey, it is not as sweet as sucrose added to the yogurt. The inverse was found in terms of tartness, which is expected as these flavors have shown to be inversely perceived in such beverages [20]. In terms of flavor, the samples were deemed lacking in fruity flavor. This, again, could be attributed to the decreased yogurt content but could also be a sign of various salts or yogurt flavors from the acid whey causing a change in taste; this trend was mirrored in the 9-point flavor scores. The formulation with 25% acid whey (Figure 6) was deemed to be too thick by a large majority of consumers, which decreased in both %consumers and penalty with the other samples. Penalty analysis indicates that an increase in acid whey content has reduced flavor in terms of sweetness and fruitiness for an increasing number of consumers. Overall, no characteristic appears to greatly affect the liking of the beverages to a majority of consumers. At the end of shelf-life testing, it was found that the whey sample soured at a greater rate and had an unbalanced flavor, emphasizing the lack of fruity flavor from the initial test.
It Is likely that samples would continue to decrease in pH over time and may be a mechanism of quality failure for the end of shelf life, as seen in the focus group. For TA (Figure 3), samples were mostly not significantly different except for the control. This non-significance was evident throughout the shelf-life, which appears to differ from the pH results. Acid whey samples had a higher TA due to the lactic acid in the whey; however, the 5% differences, in addition, did not appear to affect TA, pointing to acid whey and yogurt having similar amounts of acid. In the control sample, the 0.2% stabilizer addition had a significantly higher TA compared to 0.4%. The literature has shown that an increase in pectin often leads to no difference or a positive (but not significant) trend of increased TA in yogurt products [21,22,23,24]. The addition of methylcellulose does not appear to have a significant effect on yogurt’s TA [25]. One study noted that an increase in methylcellulose can depress lactic acid production in yogurt [26]. The color was stable throughout the shelf life and was similar for all the samples. The beverage had an orange color coming from the fruit and vegetable concentrate in the yogurt. While acid whey may range from clear to yellow due to its vitamin B content, it did not appear to have an effect on the final beverage. Appearance scores (Table 2) differed between sensory samples, which could be attributed to characteristics other than color, such as syneresis. The end-of-shelf-life analysis showed equal acceptance for both samples in discussion. Sensory analysis indicates an optimal range where various attributes must be balanced to achieve the highest consumer appeal. In this study, the addition of 25–35% acid whey appears to be optimal. In terms of purchase intent, more than half of the participants noted positive purchase intent. Even though there are some limitations due to this question being asked at the end of the session without the bias of any of the tastings, it is possible that these scores may change if panelists were to only receive the highest ranked (35% acid whey) instead of all three as their example. With the 25–35% addition being the most liked, there is an upper limit to the amount of acid whey that can be effectively upcycled. From an economic standpoint, a high amount of more expensive yogurt is required to make a palatable and stable product.

4.2. Matrix Stability

Though a liquid product, matrix, and emulsion stability are important for a thickened yogurt beverage. Texture and mouth feel are important factors when it comes to yogurt acceptance [27]. According to sensory analysis (Figure 6), a vast majority found the 25% whey addition to be too thick, with equal numbers stating that 45% was too thin and 35% was too thick. Based on 9-point scores and penalty analysis, consumers appear to prefer a slightly thicker beverage that is still drinkable. In terms of viscosity (Figure 2), 0.2% stabilizer samples (which were used for the sensory analysis) were deemed not significantly different. While both samples were acceptable at the end of shelf life, the difference in thickness was still apparent after 40 days. This is echoed in the viscosity data, as viscosity did not change significantly over time for those samples. WHC (Figure 1), on the other hand, was significantly different on day 0. There is an inverse relationship between whey addition and WHC in 0.2% stabilizer formulations, likely due to the increase in liquid. WHC is a marker for gel stability and syneresis. There is an apparent decrease in WHC over time, pointing to a possible breakdown of the matrix, more readily releasing liquid. It is possible that the 0.4% stabilizer addition may form a more stable product but may be too viscous for consumers. Acid whey is rich in free calcium, which increases the gelling properties of pectin, which is likely the cause of an increase in viscosity and water-holding capacity in 0.4% stabilizer samples when comparing control versus %whey additions [28]. For 0.4% stabilizer samples, viscosity was significantly different, likely due to the difference in the liquid amount, which changed greatly over time. The flocculation of the particles within the beverage could create higher drag forces and increase viscosity; increases in pectin have been shown to change intermolecular forces between micelles and induce greater flocculation [25]. This thickening may also be linked to the decrease in pH, as this has been shown to lead to increased viscosity [29]. Care must be taken to account for the various characteristics of acid whey compared to milk/ water when attempting to substitute acid whey, particularly when the goal is to use as much of the byproduct as possible to decrease waste.

4.3. Nutrition

In terms of nutrition (Table 3), acid whey is an added value; it provides nutrients comparable to high-value milk while being a low-cost product. This is one advantage of acid whey compared to sweet whey, as it contains more minerals, such as containing more calcium, due to its solubilization from the casein micelle at a low pH [30]. Both milk and acid whey formulations contain sugar in the form of water-soluble lactose, which would not be considered added sugar for labeling purposes. The slightly lower sugar content in acid whey formulations may be attributed to the fermentation of lactose into lactic acid by LAB. Based on the reference amount customarily consumed for such beverages, in a 45% beverage, acid whey provides an additional 2.38 g of whey protein; as a complete milk protein, it would add 5% recommended daily value (DV) protein. Skim milk provides 3.64 g (7%DV) of protein as it contains whey + casein. In terms of mineral content, the acid whey product would have the same daily value of sodium, calcium, and potassium as a skim milk product after rounding as per the FDA. When compared to water, there is a much greater increase in proteins, minerals, and calories, which would otherwise be wasted if it were not upcycled. This indicates that acid whey, even in its native form, can effectively provide sustainable added nutrition as an additive.
This study shows a strong possibility for the upcycling of relatively high amounts of acid whey in a yogurt beverage, both from physicochemical and sensorial aspects, pointing to the 25–35% addition as optimal. This work highlights the use of acid whey in its native form without the need for further processing the whey into another usable form. This is key in upcycling acid whey as the literature has shown difficulties in concentrating and fractionating acid whey in attempts to upcycle it due to its native properties [31,32]. More research is required on various processing methods of the beverage, which may impact matrix stability when manufactured, particularly to increase stability past the decline after 40 days found here. Additional work may also be conducted on the use of a stabilizer and any possible synergies with manufacturing methods. Though limited in scope, this study shows a decline in acceptance at 40 days of the refrigerated shelf life of these beverages, particularly in terms of sour and astringent flavors, with more research needed on increasing acceptable shelf life past this time.

4.4. Limitations

There are some limitations in conducting this study. The end of shelf-life sensory analysis was performed with a small consumer sample over a limited period of time, thus statistical analysis was unable to be conducted. A hedonic test similar to that conducted at the beginning of shelf-life is required to draw more conclusive conclusions. The 45% water versus whey addition was used for the initial sensory study to determine differences in acceptance at the highest amount used in this study to see the greatest possible sensorial effect of whey addition. The non-significance in this study indicates that at high levels, consumers accept the water versus whey addition equally, but there is the limitation of not knowing if consumer liking would be greater at lower additions due to the number of samples able to be served in a sensory panel. This study was conducted on a simple yogurt beverage, as described by Tamime and Robinson [2]. This beverage contained yogurt, fruit, a sweetener (from the yogurt), a stabilizer, and liquid. This study does include sensory analysis related to the fruit’s addition, and only the liquid and stabilizer additions were specifically studied. While this study considers the effect of the homogenization used to process the samples, it is limited in scope in relation to other processes that may be used in the industry.

5. Conclusions

This study finds that native acid whey may be a suitable ingredient for the creation of drinkable yogurt based on physicochemical properties. It also points to an optimal range of acid whey addition at 25–35%, which is acceptable to consumers based on the sensorial and chemical characteristics of whey. This study also shows that physical quality declines over 40 days and points to the use of stabilizers up to 0.4% as a possible solution. Sensory analysis found the upcycled beverage to be acceptable as a fruit-flavored yogurt beverage, though acceptability declines over a 40-day shelf-life.

Supplementary Materials

The following supporting information can be downloaded at: https://www.mdpi.com/article/10.3390/beverages10010018/s1, Figure S1: Water Holding Capacity (WHC) With Post-Hoc Statistical Analysis; Figure S2: Viscosity With Post-Hoc Statistical Analysis; Figure S3: Titratable Acidity With Post-Hoc Statistical Analysis; Figure S4: Beverage Color.

Author Contributions

Conceptualization, O.I.P.-Z.; methodology, V.S. and M.V.; investigation, V.S. and M.V.; writing—original draft preparation, V.S.; writing—review and editing, V.S. and M.V. and O.I.P.-Z.; supervision, O.I.P.-Z. All authors have read and agreed to the published version of the manuscript.

Funding

This research was funded by the New York State Department of Environmental Conservation, contract #CM04068 Utilization of Acid Whey, and the USDA NIFA NC1023 project NYG-623810 under #7001076.

Institutional Review Board Statement

Informed consent was received from sensory panelists prior to participation. The study was conducted in accordance with the Declaration of Helsinki and the protocol was approved by the Cornell University Institutional Review Board.

Data Availability Statement

The data presented in this study are available on request from the corresponding author.

Acknowledgments

The authors thank the Cornell Sensory Evaluation Center for technical assistance in conducting the sensory trials and the Cornell Food Venture Center Pilot Plant for technical assistance in processing.

Conflicts of Interest

The authors declare no conflicts of interest.

References

  1. Mintel. Yogurt and Yogurt Drinks US 2022; Mintel Group Ltd.: London, UK, 2022. [Google Scholar]
  2. Tamime, A.Y.; Robinson, R.K. Yoghurt-Science and Technology, 2nd ed.; Woodhead Publishing Limited: Sawston, UK, 1999; ISBN 0849317851. [Google Scholar]
  3. Bolwig, S.; Brekke, A.; Strange, L.; Strøm-Andersen, N. Valorisation of Whey: A Tale of Two Nordic Dairies. In From Waste to Value: Valorisation Pathways for Organic Waste Streams in Circular Bioeconomies; Routledge: Oxfordshire, UK, 2019; pp. 162–186. [Google Scholar] [CrossRef]
  4. Smith, S.; Smith, T.J.; Drake, M.A. Short Communication: Flavor and Flavor Stability of Cheese, Rennet, and Acid Wheys. J. Dairy Sci. 2016, 99, 3434–3444. [Google Scholar] [CrossRef]
  5. Rocha-Mendoza, D.; Kosmerl, E.; Krentz, A.; Zhang, L.; Badiger, S.; Miyagusuku-Cruzado, G.; Mayta-Apaza, A.; Giusti, M.; Jiménez-Flores, R.; García-Cano, I. Invited Review: Acid Whey Trends and Health Benefits. J. Dairy Sci. 2021, 104, 1262–1275. [Google Scholar] [CrossRef]
  6. Smithers, G.W. Whey-Ing up the Options—Yesterday, Today and Tomorrow. Int. Dairy J. 2015, 48, 2–14. [Google Scholar] [CrossRef]
  7. Buchanan, D.; Martindale, W.; Romeih, E.; Hebishy, E. Recent Advances in Whey Processing and Valorisation: Technological and Environmental Perspectives. Int. J. Dairy Technol. 2023, 76, 291–312. [Google Scholar] [CrossRef]
  8. Menchik, P.; Zuber, T.; Zuber, A.; Moraru, C.I. Short Communication: Composition of Coproduct Streams from Dairy Processing: Acid Whey and Milk Permeate. J. Dairy Sci. 2019, 102, 3978–3984. [Google Scholar] [CrossRef] [PubMed]
  9. Djurić, M.; Carić, M.; Milanović, S.; Tekić, M.; Panić, M. Development of Whey-Based Beverages. Eur. Food Res. Technol. 2004, 219, 321–328. [Google Scholar] [CrossRef]
  10. Flinois, J.C.; Dando, R.; Padilla-zakour, O.I. Yogurt Acid Whey Utilization for Production of Baked Goods: Pancakes and Pizza Crust. Foods 2019, 8, 615. [Google Scholar] [CrossRef]
  11. Andreou, V.; Chanioti, S.; Xanthou, M.Z.; Katsaros, G. Incorporation of Acid Whey Yogurt By-Product in Novel Sauces Formulation: Quality and Shelf-Life Evaluation. Sustainability 2022, 14, 15722. [Google Scholar] [CrossRef]
  12. Camacho Flinois, J.; Dando, R.; Padilla-Zakour, O.I. Effects of Replacing Buttermilk with Yogurt Acid Whey in Ranch Dressing. J. Dairy Sci. 2019, 102, 7874–7883. [Google Scholar] [CrossRef]
  13. Skryplonek, K.; Dmytrów, I.; Mituniewicz-Małek, A. Probiotic Fermented Beverages Based on Acid Whey. J. Dairy Sci. 2019, 102, 7773–7780. [Google Scholar] [CrossRef]
  14. Lievore, P.; Simões, D.R.S.; Silva, K.M.; Drunkler, N.L.; Barana, A.C.; Nogueira, A.; Demiate, I.M. Chemical Characterisation and Application of Acid Whey in Fermented Milk. J. Food Sci. Technol. 2015, 52, 2083–2092. [Google Scholar] [CrossRef]
  15. Keogh, M.K.; O’Kennedy, B.T. Rheology of Stirred Yogurt as Affected by Added Milk Fat, Protein and Hydrocolloids. J. Food Sci. 1998, 63, 108–112. [Google Scholar] [CrossRef]
  16. Shama, F.; Sherman, P. Identification of Stimuli Controlling the Sensory Evaluation of Viscosity Ii. Oral Methods. J. Texture Stud. 1973, 4, 111–118. [Google Scholar] [CrossRef]
  17. Narayanan, P.; Chinnasamy, B.; Jin, L.; Clark, S. Use of Just-about-Right Scales and Penalty Analysis to Determine Appropriate Concentrations of Stevia Sweeteners for Vanilla Yogurt. J. Dairy Sci. 2014, 97, 3262–3272. [Google Scholar] [CrossRef] [PubMed]
  18. Lawless, H.T.; Patel, A.A.; Lopez, N.V. Mixed Messages: Ambiguous Penalty Information in Modified Restaurant Menu Items. Food Qual. Prefer. 2016, 52, 232–236. [Google Scholar] [CrossRef]
  19. USDA Milk, Fat Free (Skim). Available online: https://fdc.nal.usda.gov/fdc-app.html#/food-details/1097521/nutrients (accessed on 17 December 2023).
  20. Gonzalez, N.J.; Adhikari, K.; Sancho-Madriz, M.F. Sensory Characteristics of Peach-Flavored Yogurt Drinks Containing Prebiotics and Synbiotics. LWT 2011, 44, 158–163. [Google Scholar] [CrossRef]
  21. Arioui, F.; Ait Saada, D.; Cheriguene, A. Physicochemical and Sensory Quality of Yogurt Incorporated with Pectin from Peel of Citrus Sinensis. Food Sci. Nutr. 2017, 5, 358–364. [Google Scholar] [CrossRef]
  22. Khubber, S.; Chaturvedi, K.; Thakur, N.; Sharma, N.; Yadav, S.K. Low-Methoxyl Pectin Stabilizes Low-Fat Set Yoghurt and Improves Their Physicochemical Properties, Rheology, Microstructure and Sensory Liking. Food Hydrocoll. 2021, 111, 106240. [Google Scholar] [CrossRef]
  23. Tobil, M.; Deh, C.Y.; Agbenorhevi, J.K.; Sampson, G.O.; Kpodo, F.M. Effect of Okra Pectin on the Sensory, Physicochemical and Microbial Quality of Yoghurt. Food Nutr. Sci. 2020, 11, 442–456. [Google Scholar] [CrossRef]
  24. Mada, T.; Duraisamy, R.; Abera, A.; Guesh, F. Effect of Mixed Banana and Papaya Peel Pectin on Chemical Compositions and Storage Stability of Ethiopian Traditional Yoghurt (Ergo). Int. Dairy J. 2022, 131, 105396. [Google Scholar] [CrossRef]
  25. Andiç, S.; Boran, G.; Tunçtürk, Y. Effects of Carboxyl Methyl Cellulose and Edible Cow Gelatin on Physico-Chemical, Textural and Sensory Properties of Yoghurt. Int. J. Agric. Biol. 2013, 15, 245–251. [Google Scholar]
  26. Eze, C.M.; Aremu, K.O.; Alamu, E.O.; Okonkwo, T.M. Impact of Type and Level of Stabilizers and Fermentation Period on the Nutritional, Microbiological, and Sensory Properties of Short-Set Yoghurt. Food Sci. Nutr. 2021, 9, 5477–5492. [Google Scholar] [CrossRef] [PubMed]
  27. Bruzzone, F.; Ares, G.; Giménez, A. Temporal Aspects of Yoghurt Texture Perception. Int. Dairy J. 2013, 29, 124–134. [Google Scholar] [CrossRef]
  28. Said, N.S.; Olawuyi, I.F.; Lee, W.Y. Pectin Hydrogels: Gel-Forming Behaviors, Mechanisms, and Food Applications. Gels 2023, 9, 732. [Google Scholar] [CrossRef] [PubMed]
  29. Penna, A.L.B.; Gurram, S.; Barbosa-Cánovas, G.V. Effect of High Hydrostatic Pressure Processing on Rheological and Textural Properties of Probiotic Low-Fat Yogurt Fermented by Different Starter Cultures. J. Food Process Eng. 2006, 29, 447–461. [Google Scholar] [CrossRef]
  30. Jelen, P. Whey Processing: Utilization and Products. In Encyclopedia of Dairy Sciences, 2nd ed.; Academic Press: Cambridge, MA, USA, 2011; pp. 731–737. [Google Scholar] [CrossRef]
  31. Chandrapala, J.; Duke, M.C.; Gray, S.R.; Zisu, B.; Weeks, M.; Palmer, M.; Vasiljevic, T. Properties of Acid Whey as a Function of PH and Temperature. J. Dairy Sci. 2015, 98, 4352–4363. [Google Scholar] [CrossRef]
  32. Dec, B.; Chojnowski, W. Characteristics of Acid Whey Powder Partially Demineralised by Nanofiltration. Polish J. Food Nutr. Sci. 2006, 15, 87. [Google Scholar]
Figure 1. Water-holding capacity (WHC) of beverages, expressed as %water retained with varied amounts of whey addition and %stabilizer over 40 days at 4 °C. Mean ± SD.
Beverages 10 00018 g001
Figure 2. Viscosity of beverages, expressed in centipoise, with varied amounts of whey addition and %stabilizer over 40 days at 4 °C. Mean ± SD.
Beverages 10 00018 g002
Figure 3. Titratable acidity (TA) of beverages, expressed as g of lactic acid equivalents/100 g, with varied amounts of acid whey addition and %stabilizer over 40 days at 4 °C. Mean ± SD.
Beverages 10 00018 g003
Figure 4. Changes in pH of beverages with varied amounts of acid whey addition and %stabilizer for days 0 and 40 at 4 °C.
Beverages 10 00018 g004
Figure 5. Consumer responses for just about right (JAR) questions for (A) sweetness; (B) tartness; (C) fruit flavor; (D) mouth texture; and (E) mouth graininess.
Beverages 10 00018 g005
Figure 6. Penalty analysis from sensory analysis for (A) 25%; (B) 35%; (C) 45% acid whey addition to drinkable yogurt beverage.
Beverages 10 00018 g006
Table 1. Experimental conditions for beverage formulation.
Acid Whey %Water %Yogurt %Stabilizer %
35064.80.2
35064.60.4
40059.80.2
40059.60.4
45054.80.2
45054.60.4
04554.80.2
04554.60.4
Percentages are in weight/weight.
Table 2. Mean scores of 9-point hedonic questions from the sensory study.
Acid Whey AdditionAttribute
AppearanceTextureMouth FeelFlavorOverall Liking
25%6.73 a6.53 ab6.54 ab7.08 a6.59 a
35%6.83 a6.93 a6.68 a6.94 a6.74 a
45%6.24 b6.39 b6.13 b6.10 b5.16 b
a,b different letters are significantly different from those in the same column (p < 0.05). 1-Dislike extremely to 9-Like extremely.
Table 3. Proximate analysis of acid whey, skim milk, yogurt, and formulated beverages.
Yogurt Beverage
Nutrient 1UnitAcid WheySkim Milk 1Yogurt 235%40%45%
Proteing/100 g2.23.44.73.83.73.6
Fatg/100 g0.30.081.471.061.000.94
Carbohydrate 3g/100 g2.94.9619.4113.6312.8111.98
Calcium (Ca)g/100 g0.110.120.160.140.140.14
Potassium (K)g/100 g0.170.160.170.170.170.17
Sodium (Na)g/100 g0.0360.0420.0650.0550.0530.052
1 Skim milk values courtesy of USDA [19]. 2 Yogurt values courtesy of Cornell Dairy (Ithaca, NY, USA). 3 Estimated carbohydrates calculated from macronutrients.
Disclaimer/Publisher’s Note: The statements, opinions and data contained in all publications are solely those of the individual author(s) and contributor(s) and not of MDPI and/or the editor(s). MDPI and/or the editor(s) disclaim responsibility for any injury to people or property resulting from any ideas, methods, instructions or products referred to in the content.

