Article

White Sparkling Wine Proteins and Glycoproteins and Their Behavior in Foam Expansion and Stability

Department of Agronomy, Food, Natural Resources, Animals, and Environment (DAFNAE), University of Padua, Viale dell’Università, 16, 35020 Legnaro, Padova, Italy
*
Author to whom correspondence should be addressed.
Beverages 2024, 10(1), 21; https://doi.org/10.3390/beverages10010021
Submission received: 5 February 2024 / Revised: 26 February 2024 / Accepted: 28 February 2024 / Published: 7 March 2024
(This article belongs to the Section Quality, Nutrition, and Chemistry of Beverages)

Abstract

:
The volume and stability of wine foams are influenced by many components of the matrix, especially proteins. However, the synergistic or inhibiting effects among these protein fractions, as well as their interactions with other wine components, are still under study. The present research aims to understand the individual and cooperative effects of different wine proteins and glycoproteins on the volume and stability of foams. To address this objective, different protein fractions were purified from a Chardonnay white wine and tested in different model wine conditions (with/without ethanol), along with a commercial yeast-based oenological additive. Different fractions were considered, including total protein fraction (FT), Mannoproteins (MP), and non-mannosylated proteins (NMP), as well as a protein fraction soluble in ammonium sulfate (FSA). These protein fractions were characterized, and their foaming properties were evaluated using a modified Rudin apparatus. The results showed that FT exhibited higher foam expansion (FE%) compared to its subfractions (NMP and MP) that, when tested individually, did not guarantee optimal foam formation. This suggests that foaming properties are enhanced when both glycosylated and non-glycosylated proteins are present in the system. Additionally, the foaming behavior was influenced by the presence of ethanol in the model wine. The FSA fraction demonstrated high foam expansion and stability, with ethanol enhancing foam expansion but reducing stability. A commercial yeast-based oenological additive, mainly containing glycoproteins, was also tested and behaved similarly to MP. This study provides valuable insights for sparkling wine producers to optimize practices for enhancing product quality and confirm previous research regarding the role of the synergy between MP and NMP in wine foam formation and stability.

1. Introduction

Among the quality requirements that characterize a sparkling wine, foam certainly represents the first and one of the most important sensorial parameters that are evaluated by the consumer. For this reason, winemakers are very interested in understanding the factors responsible for the foam behavior in sparkling wine. The properties of foam, described in terms of formation and stability, are influenced by different parameters, including grape variety, harvesting, and oenological techniques [1,2]. The formation and stability of the foam are favored by the presence of compounds that lower the surface tension of the liquid by placing themselves at the air–liquid interface; in particular, they expose the hydrophobic part towards the air and the hydrophilic part to the liquid phase, producing a more or less elastic film that incorporates the gas bubbles [3,4]. In sparkling wines, the molecules involved in the foam formation and in its stability are represented by proteins and glycoproteins, thanks to their surface properties [1,5,6,7].
Among glycoproteins, the most important fraction is that of yeast mannoproteins (MP), highly glycosylated proteins (10% proteins and 90% polysaccharides) with a carbohydrate fraction consisting of approximately 98% mannose and 2% glucose, and with a molecular weight between 20 and over 450 kDa [8,9].
This fraction is released from the yeast cell wall during fermentation and following autolysis [10]. Yeast autolysis occurs naturally at the end of the stationary phase and is associated with cell death. When sugars and other nutritional compounds are used up, the yeast cell consumes its energy reserves made up of glycogen and other elements. When these also end, the cell begins the degeneration phase, and autolysis is triggered. The autolysis mechanism begins when hydrolytic enzymes release cell walls and cytoplasmic components into the wine and ends with further autolytic degradation of more polymerized compounds into low molecular weight molecules in the extracellular environment [11].
Winemaking techniques such as the aging on lees (in French sur lies) exploit the release of yeast components to naturally enrich the wine with different yeast fractions such as mannoproteins, fatty acids, and nitrogenous and volatile compounds [12,13], thus benefiting wine stability, flavor, and foaming properties. The release of yeast molecules during aging on lees is influenced by time (usually >3 months), temperature, stirring, and the choice of the yeast strain [14].
The effect on foam is evident in the case of Champagne and other bottle-fermented sparkling wines, whose foams exhibit typical stability and regularity. Mannoproteins could represent one of the compounds involved in foaming, although there are conflicting opinions on this aspect. As previously reported, mannoproteins have a positive effect on the quality of foam in white wines [15]; in fact, a model wine solution added with a mannoprotein fraction has better foaming properties. Other studies, however, demonstrate that these proteins have no effect on the stability of the foam [16]. The parameters, therefore, to be taken into consideration for a correct evaluation of wine foam from a sensorial point of view are foamability and persistence, i.e., the volume of foam produced and its stability over time.
In addition to mannoproteins, proteins have been associated with wine foam stability and volume. In fact, some authors reported a relationship between protein concentration and the quality of wine foam [17,18], and it is known that protein depletion (with bentonite), applied to improve wine stability, is detrimental to the formation and stability of foam in sparkling wines [19].
Some authors suggested that the importance of proteins in stabilizing the foam of wines is not direct but rather due to their interaction with glycoproteins (particularly mannoproteins). This interaction would contribute to the stabilization of the air–liquid interface, thus contrasting bubbles collapse and coalescence [18]. However, more studies are needed to better understand this mechanism, as well as testing proteins from different grape varieties and winemaking styles as well as proteins released by the yeast during its autolysis. Furthermore, considering their commercial success as technological additives, the impact of exogenous yeast proteins and glycoproteins often added to wine should be considered in this complex scenario. In addition, considering the rising demand for dealcoholized wines [20], it would be interesting to assess how the absence of ethanol can affect the effectiveness of these foaming fractions.
Therefore, the aim of this study is to investigate the impact of wine proteins and glycoproteins (specifically mannoproteins) on foam characteristics in relation to the presence or absence of ethanol. To study their single and eventual cooperative effects on foam volume and stability, different fractions were purified from a Chardonnay white wine and tested in model wine conditions with or without ethanol. A commercial yeast-based oenological additive containing both glycoproteins and proteins will also be included in the experimental design. This study will provide valuable insights for sparkling wine producers, aiding them in optimizing their practices to enhance the overall quality of their products.

2. Materials and Methods

2.1. Extraction of Protein Fractions

To evaluate the biochemical and rheological characteristics of white wine glycoproteins, protein fractions obtained according to different extraction protocols were analyzed. Furthermore, to better understand their effect on the parameters examined, they were compared with a commercial product containing a yeast mannoprotein known as MP40 TM, commonly used in winemaking for the tartaric stabilization of potassium salts (Mannostab® by Laffort, Bordeaux, France). However, it is important to point out that the composition of this product is not known, as its production process is patented [21].
The wine used was a Chardonnay white wine produced with the sur lies method (10 months in contact with its residual yeasts) of the 2018 vintage. The methods used for the preparation of the different fractions used are described as follows:
  • Chardonnay white wine (500 mL) was dialyzed for 12 h at 4 °C against distilled water using a 3.5 kDa tubular membrane (Spectrum Chemical, New Brunswick, NJ, USA). Subsequently, the clear wine was frozen and freeze-dried. The powder obtained at the end of this process, containing the total wine macromolecules, was called the total fraction (FT).
  • Chardonnay white wine (500 mL) was dialyzed as described in point 1. The dialyzed solution was then diluted 1:1 v/v with a saline buffer at pH 7.4 (Tris 20 mM, NaCl 0.5 M, CaCl2 1 mM, 1 mM MgCl2, and 1 mM MnCl2) and filtered with PTFE filters with MWCO 0.45 µm (Sartorius, Goettingen, Germany). Two distinct protein fractions were purified from this sample using the ÄKTApurifier affinity chromatography system (UP900 by Amersham, Chalfont St. Giles, UK). This system managed using the Unicorn 5.1 Software, mounted a column packed with 30 mL of Sepharose conjugated with Concanavalin A (Sigma-Aldrich, St. Louis, MO, USA). The sample was loaded via a 150 mL Superloop, and peaks were acquired at 214 nm. The first fraction collected corresponded to proteins having no affinity for Concanavalin A and, therefore, not mannosylated (NMP). Instead, for the elution of the mannosylated fraction (MP), a 0.5 M solution of Methyl-α-d-Mannopyranoside (Sigma-Aldrich, St. Louis, MO, USA) was used. Both fractions, MP and NMP, were subsequently dialyzed against water for 12 h at 4 °C with 3.5 kDa membranes and finally freeze-dried.
  • Chardonnay white wine (500 mL) was subjected to precipitation with 60% (w/v) ammonium sulfate. The sample was then centrifuged at 14,000× g for 30 min, and the supernatant containing the ammonium sulfate-soluble protein fraction was dialyzed and lyophilized (FSA).

2.2. Protein Quantification
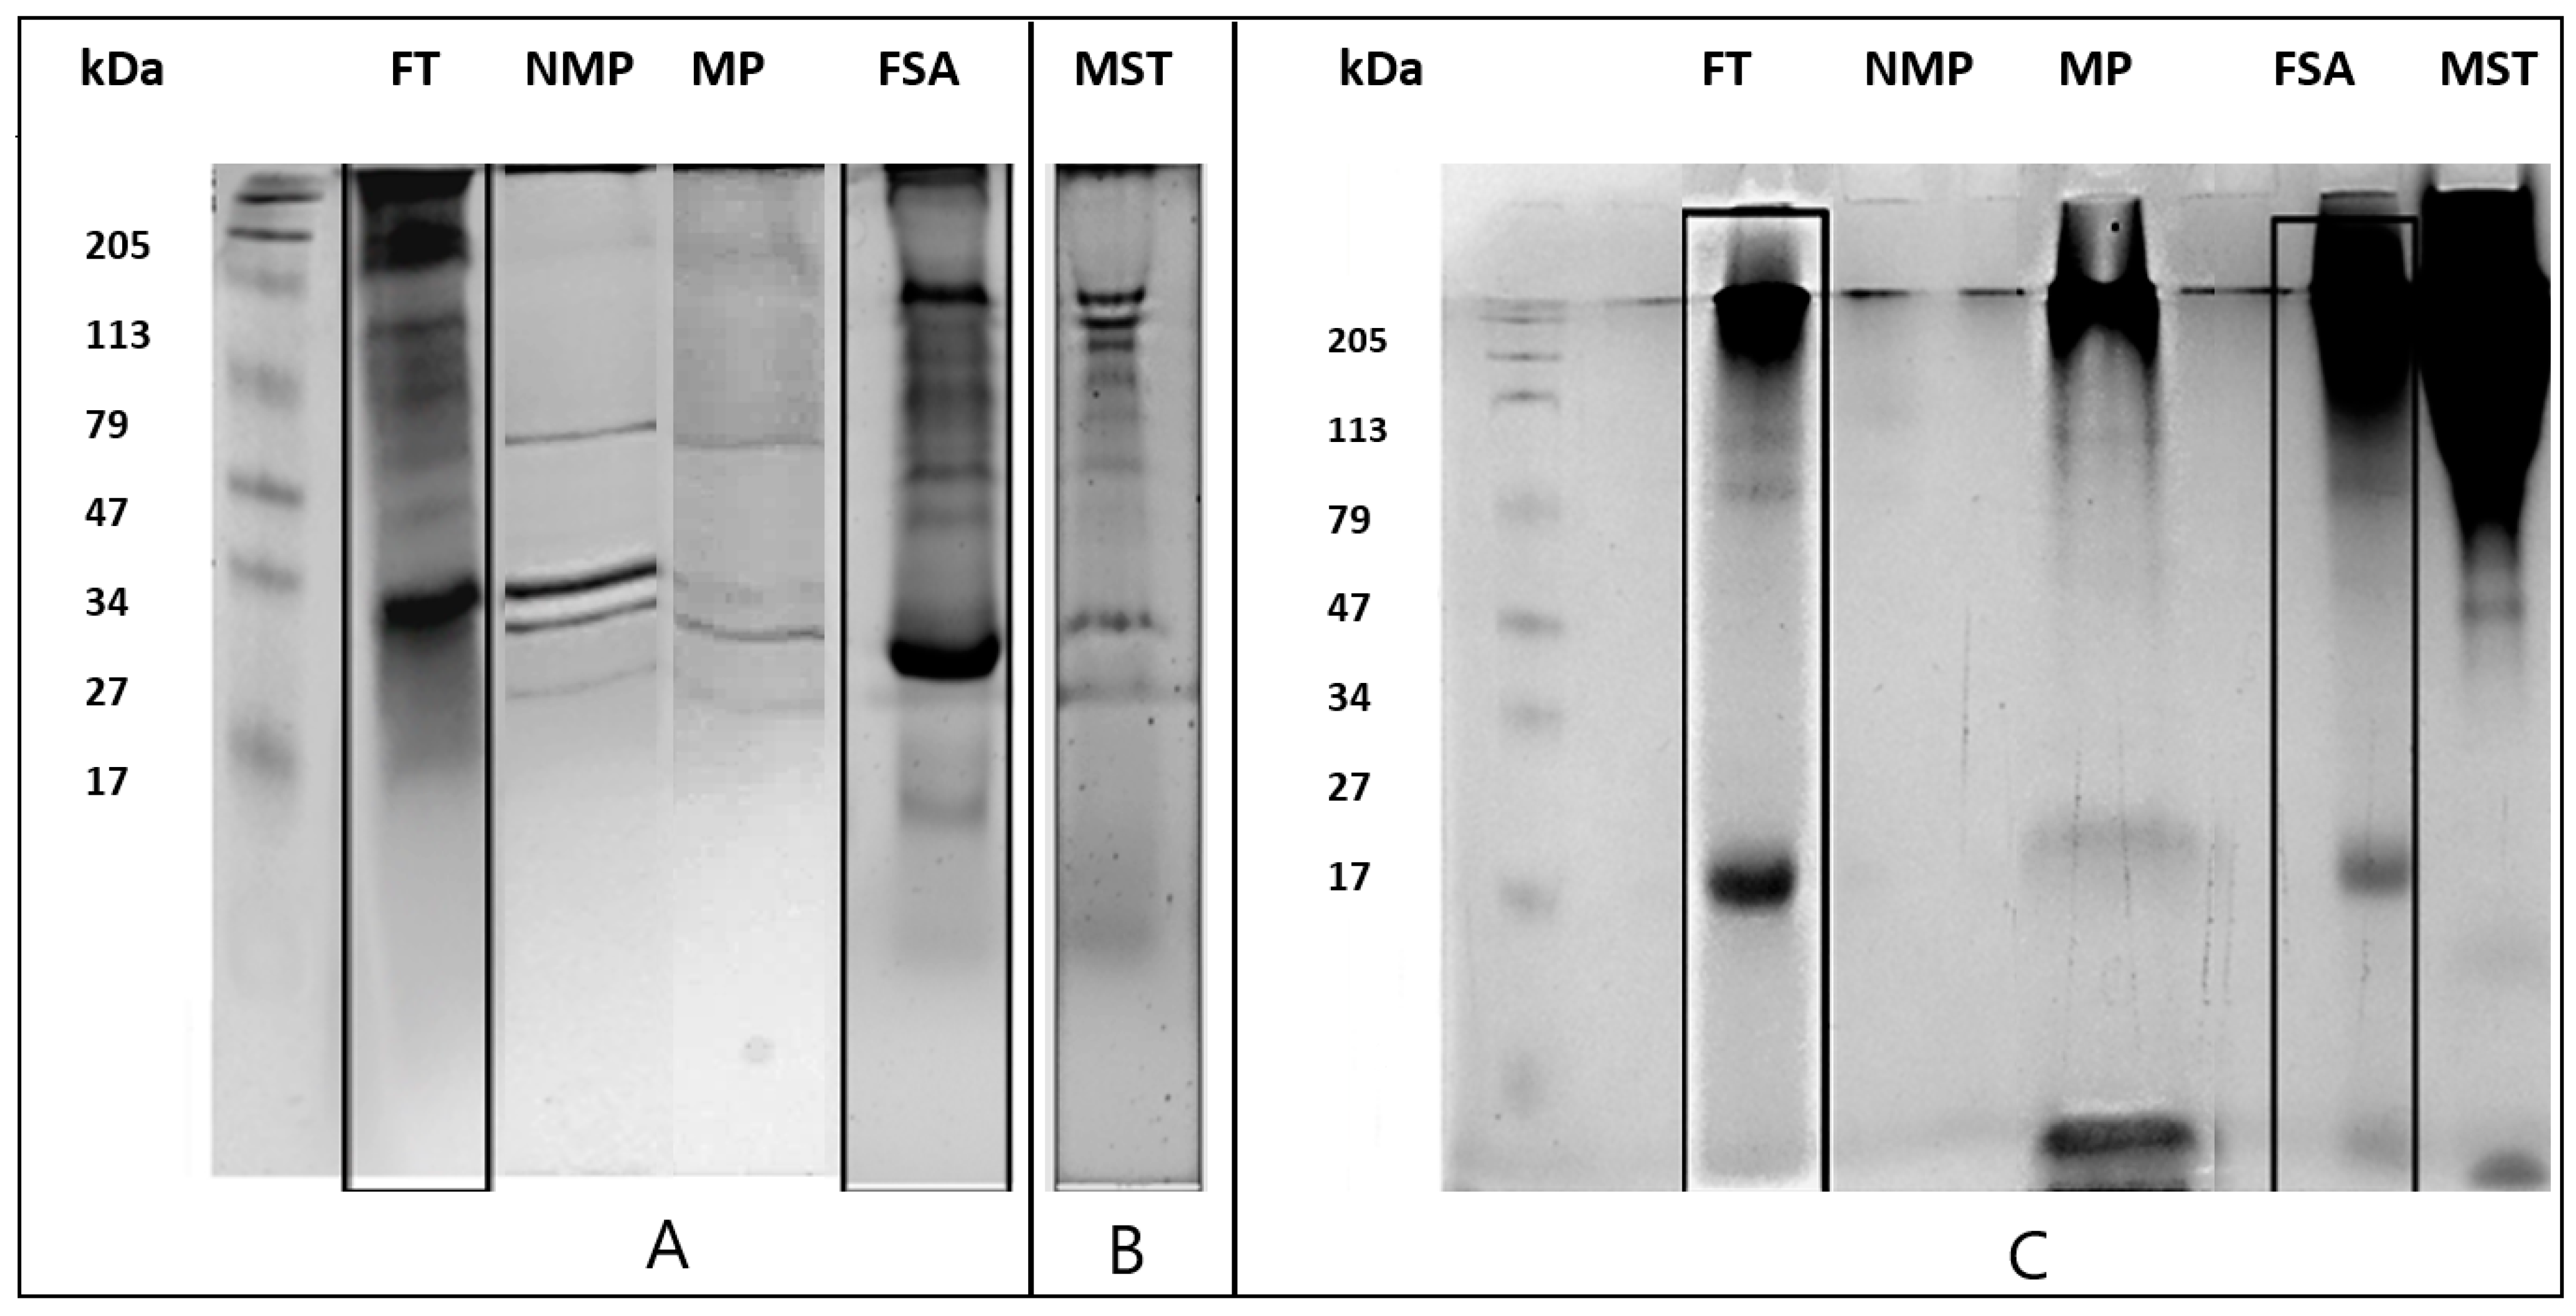
For all the protein fractions examined, the weight yield was calculated, and the total protein content was determined spectrophotometrically with the bicinchoninic acid assay (BCA Assay, Pierce), using bovine serum albumin as standard.

2.3. SDS-PAGE

The protein fractions obtained, as described in Section 3.1 and Mannostab®, were solubilized in 100 µL of Laemmli buffer and analyzed using SDS-PAGE at 15% acrylamide. The electrophoresis was carried out at a constant 48 mA in MiniProtean cells with a standard of known molecular weight (Biorad-161-0318; Bio-Rad Laboratories, Hercules, CA, USA). The gels obtained were stained with Comassie Brillant Blue and Sypro Ruby Stain (Sigma-Aldrich, St. Louis, MO, USA) and, to highlight the glycosylated proteins, staining with periodic acid-Schiff (PAS) (Sigma-Aldrich, St. Louis, MO, USA) was also used. All gels were acquired with ChemiDocTM XRS (Bio-Rad Laboratories, Hercules, CA, USA), and images were processed with ImageLab Software (Bio-Rad Laboratories, Hercules, CA, USA).

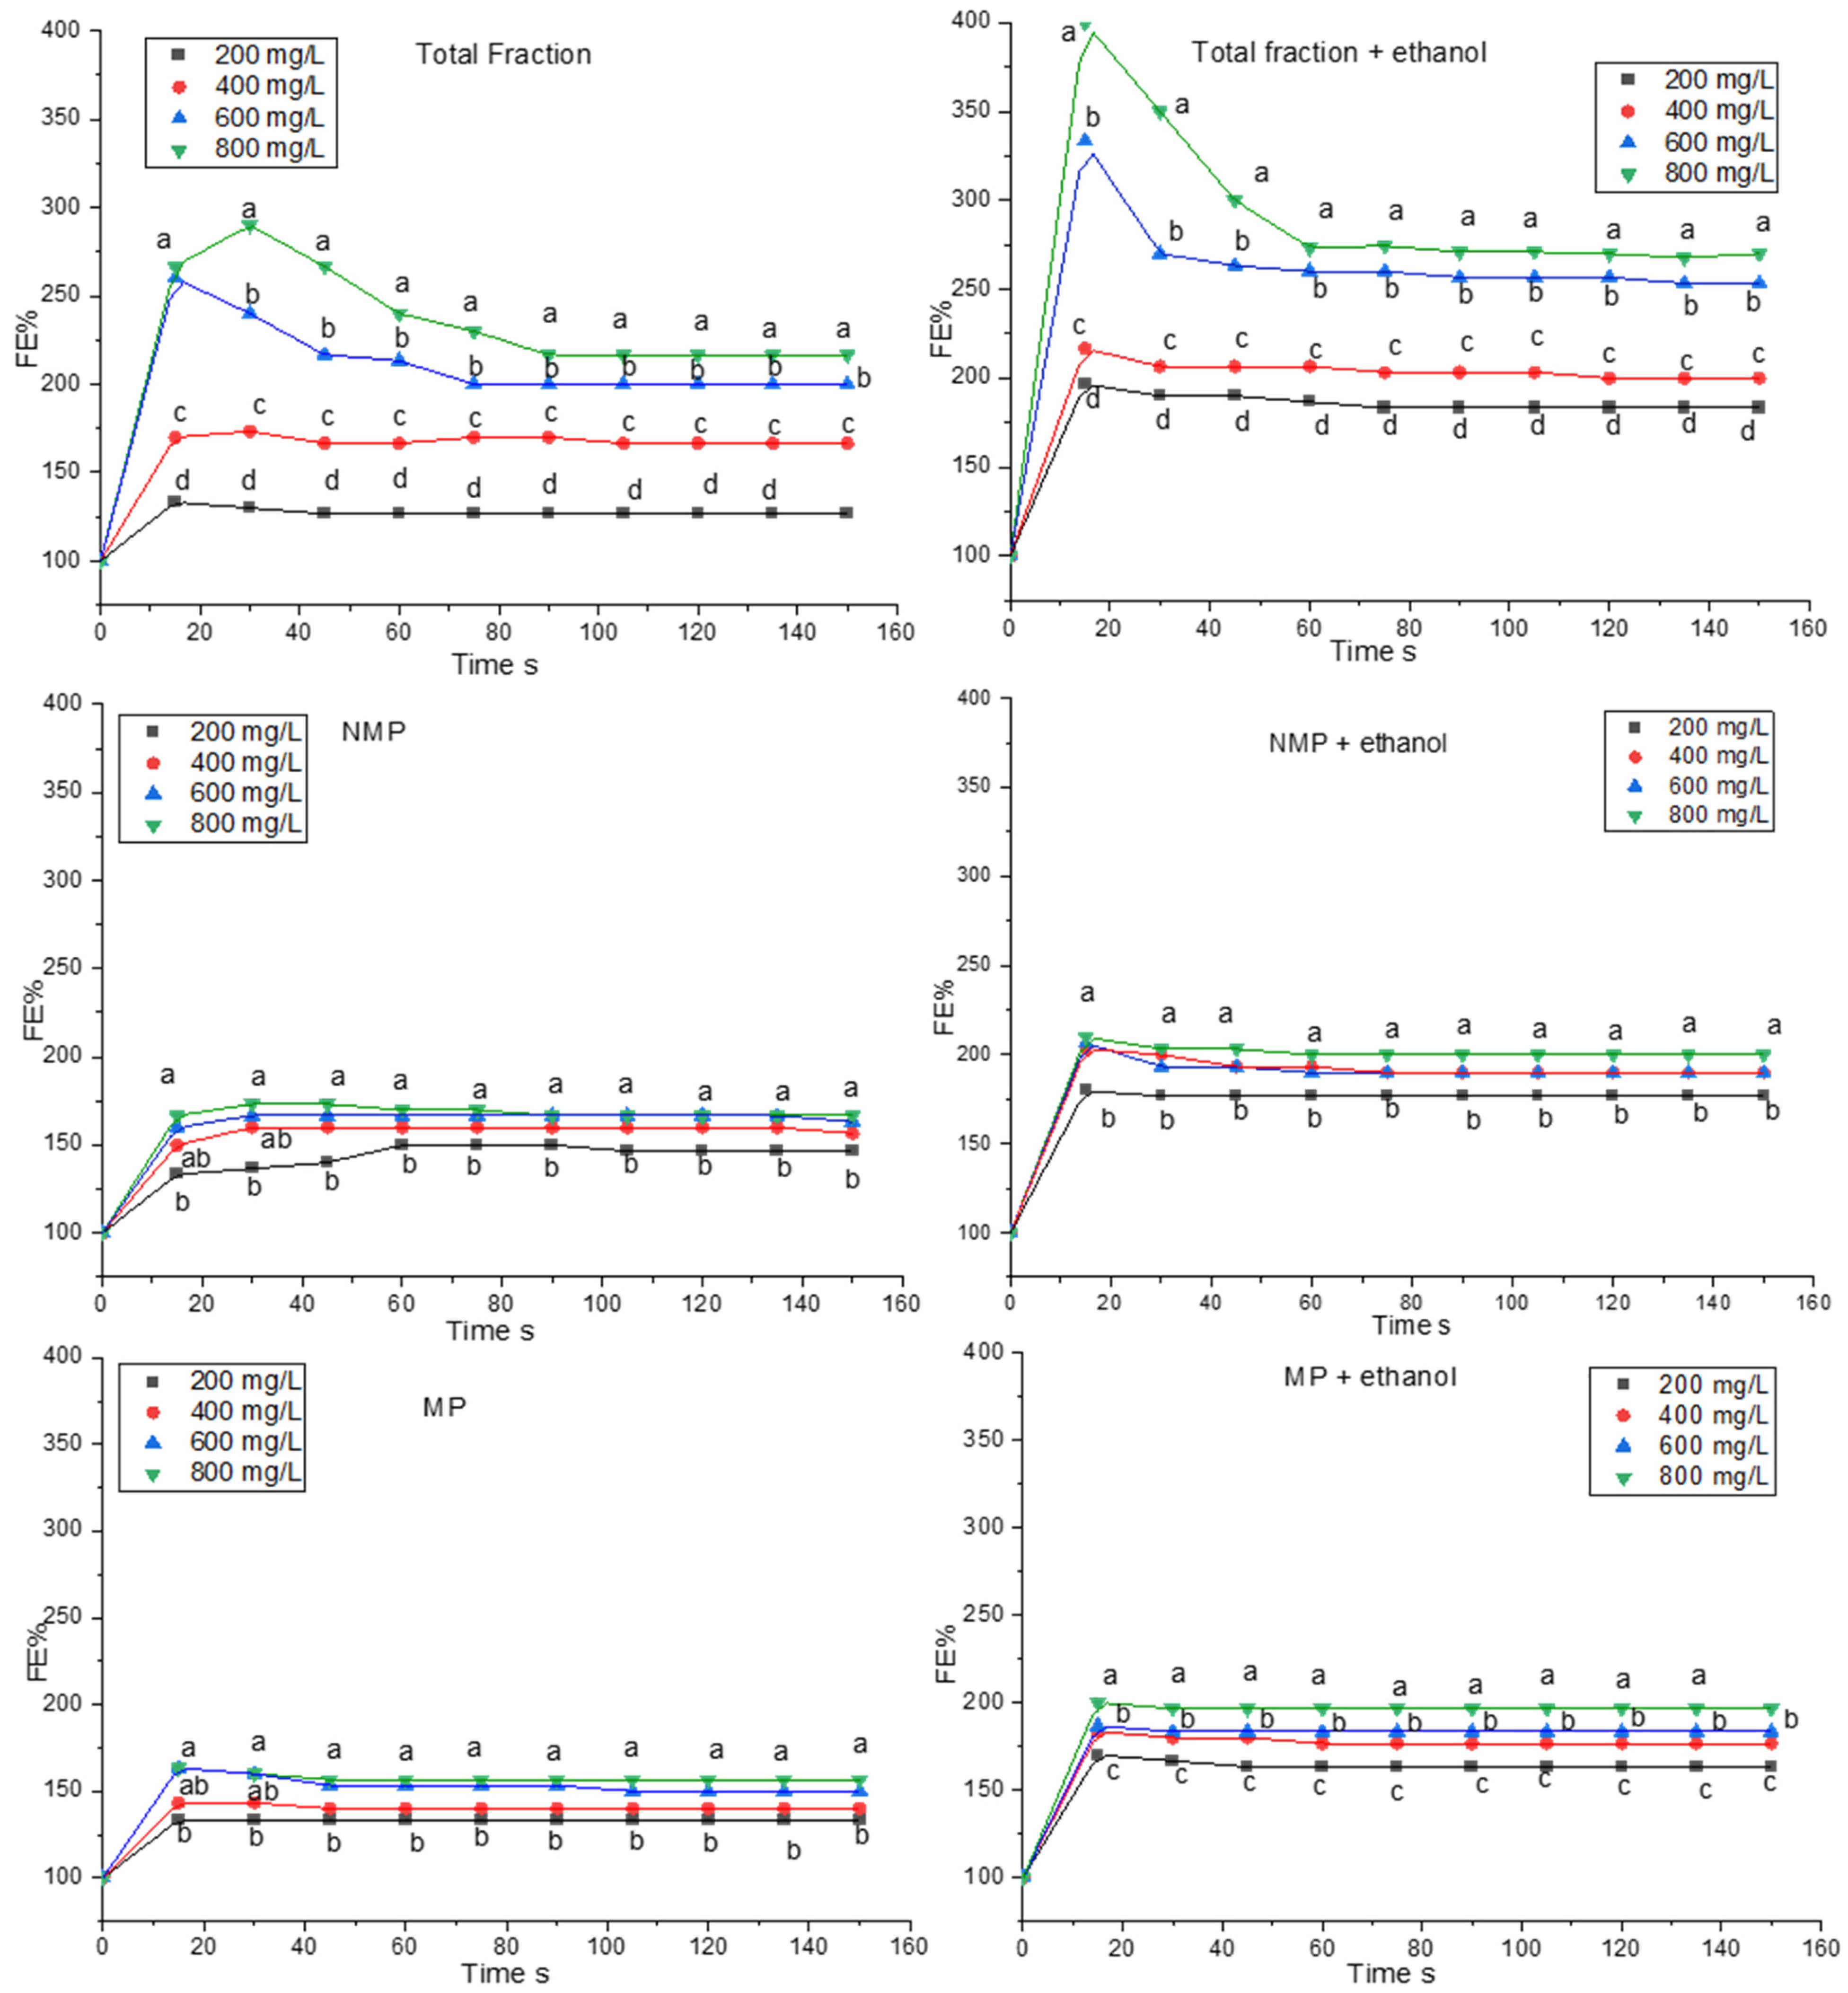
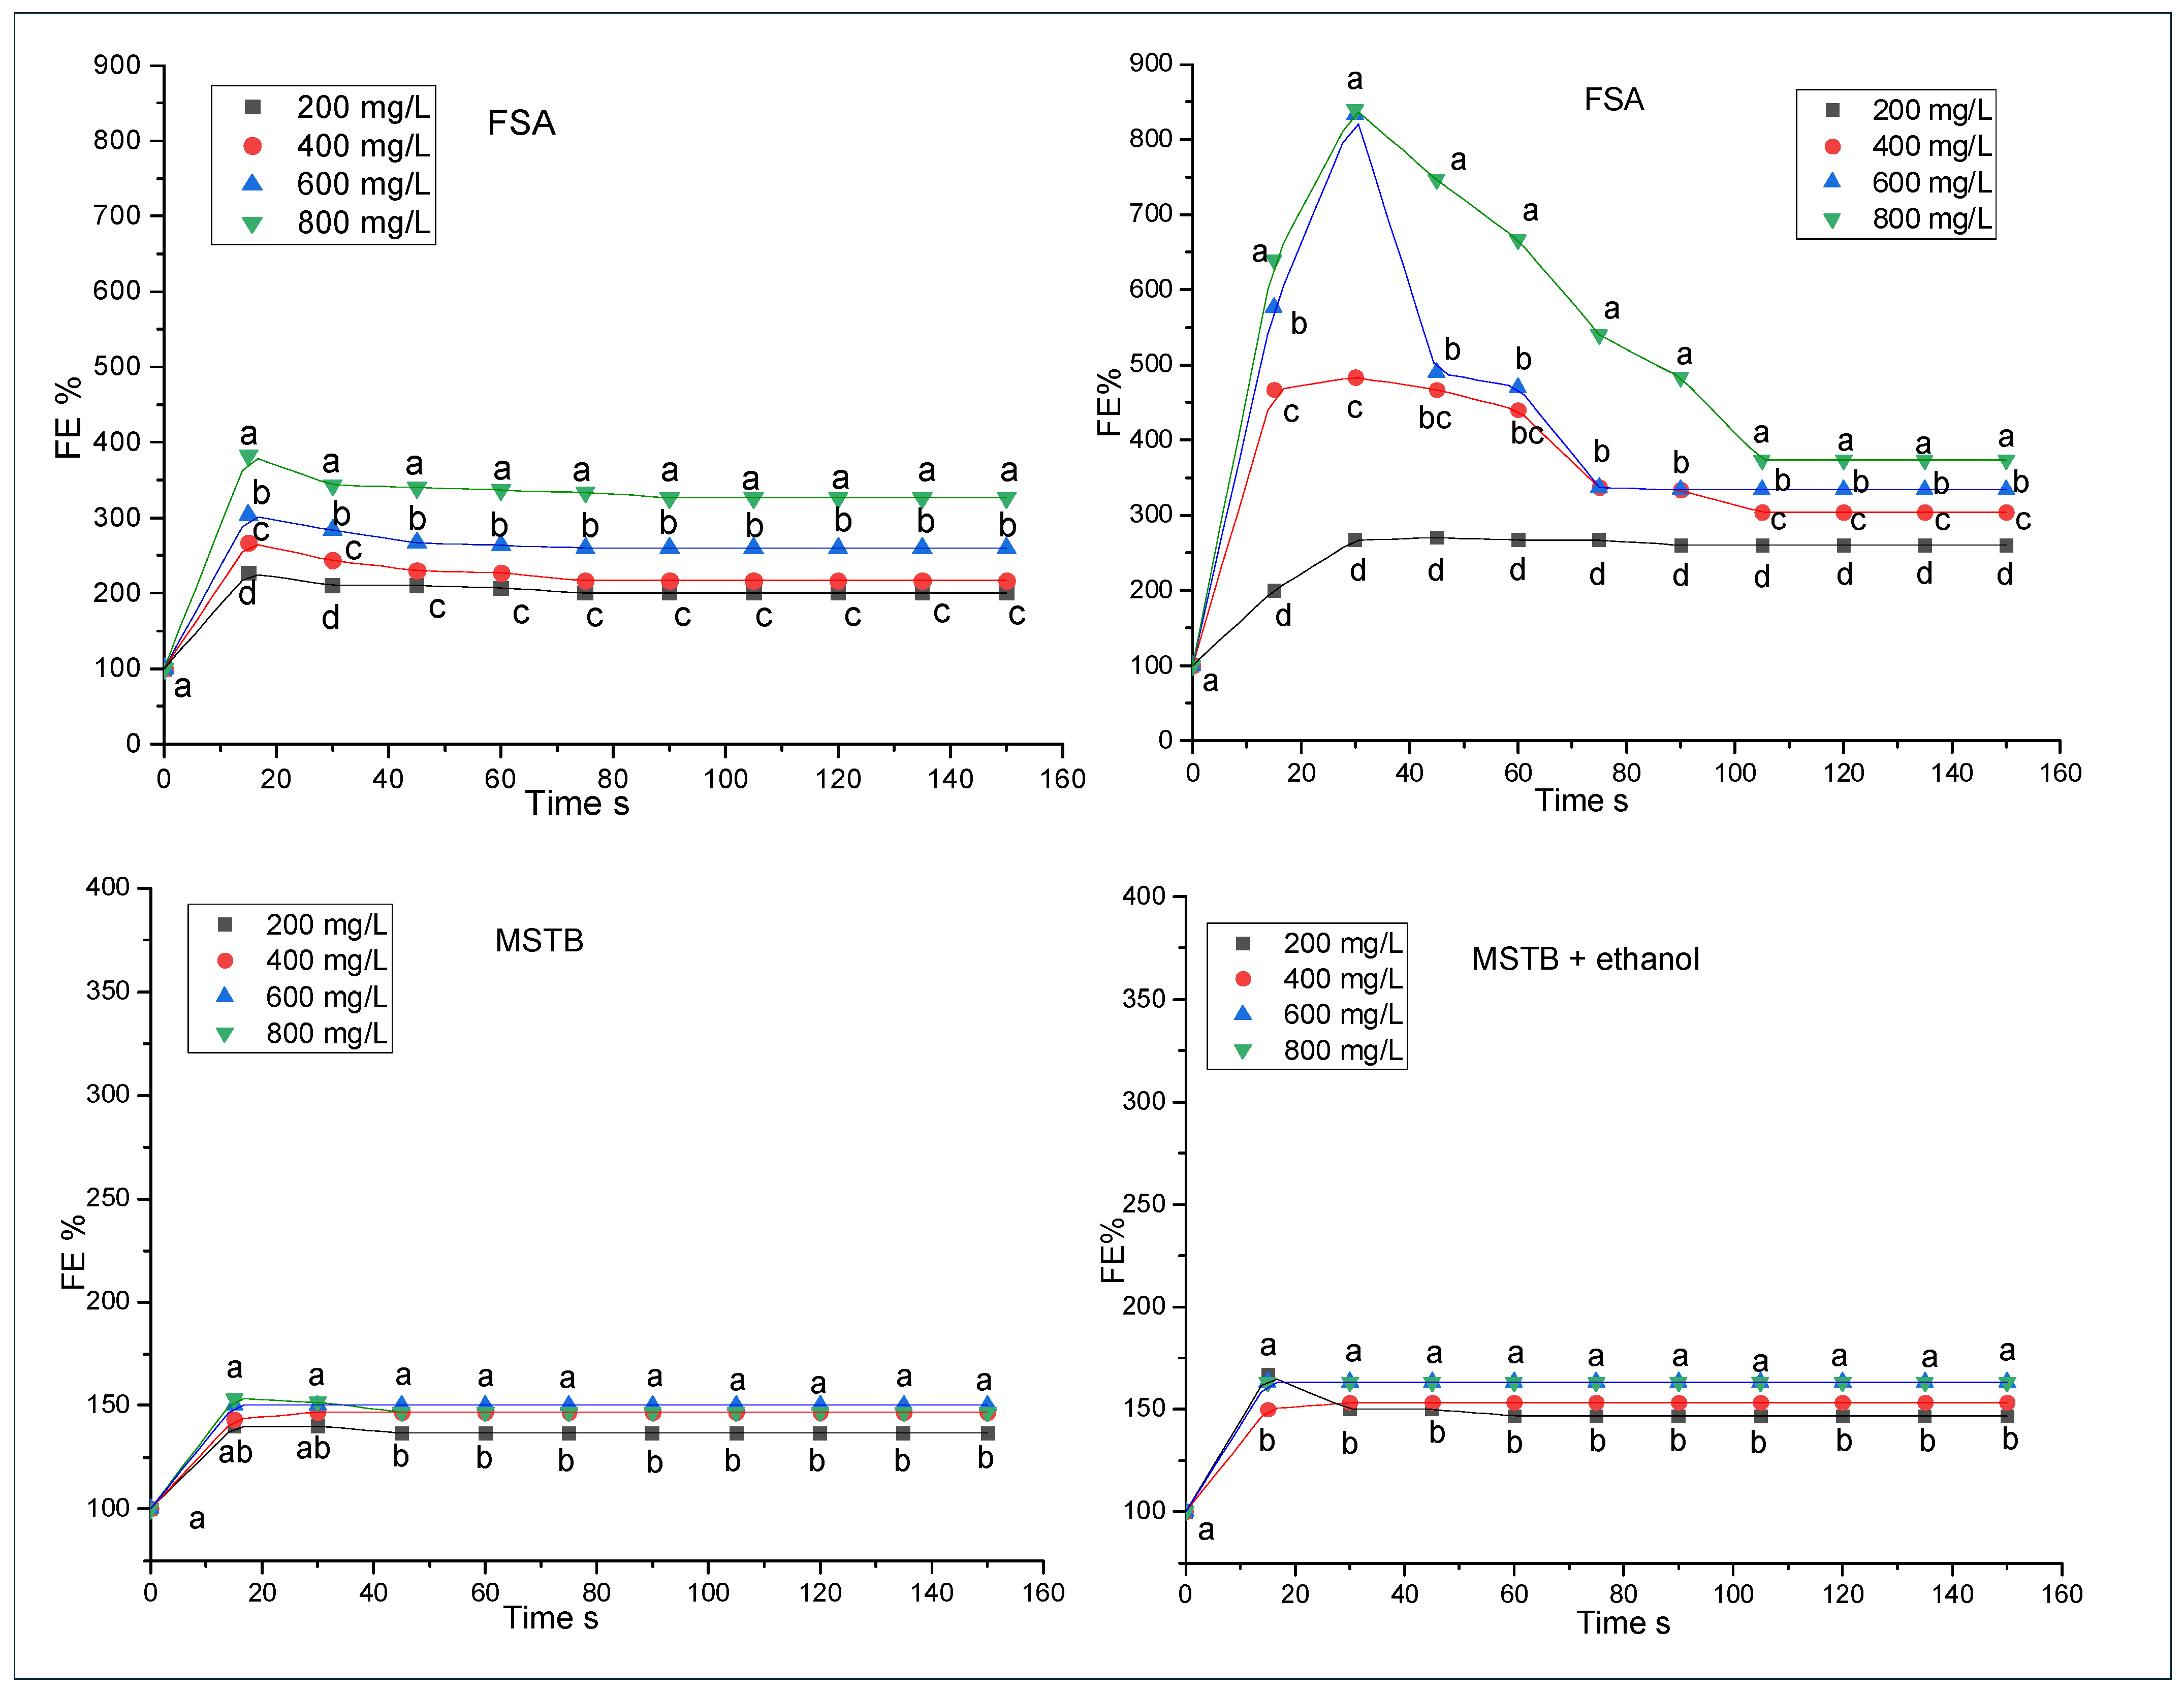
2.4. Foaming Properties

To evaluate the effect of the extracted protein fractions and the commercial Mannostab® (Laffort, Bordeaux, France) on foamability, the modified Rudin apparatus was used as follows.
To generate foam through gas sparging, a cylindrical glass column of 50 cm in height and 3.5 cm in diameter, graduated in centimeters, closed at the bottom with a sintered glass plate (40–60 µm, pore diameter), and connected to CO2, was used [18]. Before each analysis, the tube was cleaned with ethanol and then rinsed three times with milli-Q water. Solutions at scalar concentrations from 200 to 800 mg/L of FT, NMP, MP, FSA, and MSTB (Mannostab®) were prepared in model wine with and without ethanol, as follows: 2.5 g/L tartaric acid, buffered with 5 M KOH to pH 3.5, added with 10% ethanol in the sample with alcohol. A volume of 20 mL for each solution was placed in the cylinder, and CO2 was sparged at a constant flow rate (260 mL/min) and pressure (300 kPa) from the bottom; the foam height was measured every 15 s for 150 s. To monitor the stability of the foam, the gas flow was stopped, and the foam decay was measured in terms of the persistence of the foam on the surface. Each sample was analyzed in triplicate.
The data were expressed as foam expansion (FE%) [22]:
F E % = F o a m   v o l u m e   ( m L ) I n i t i a l   l i q u i d   v o l u m e   ( m L ) × 100 .

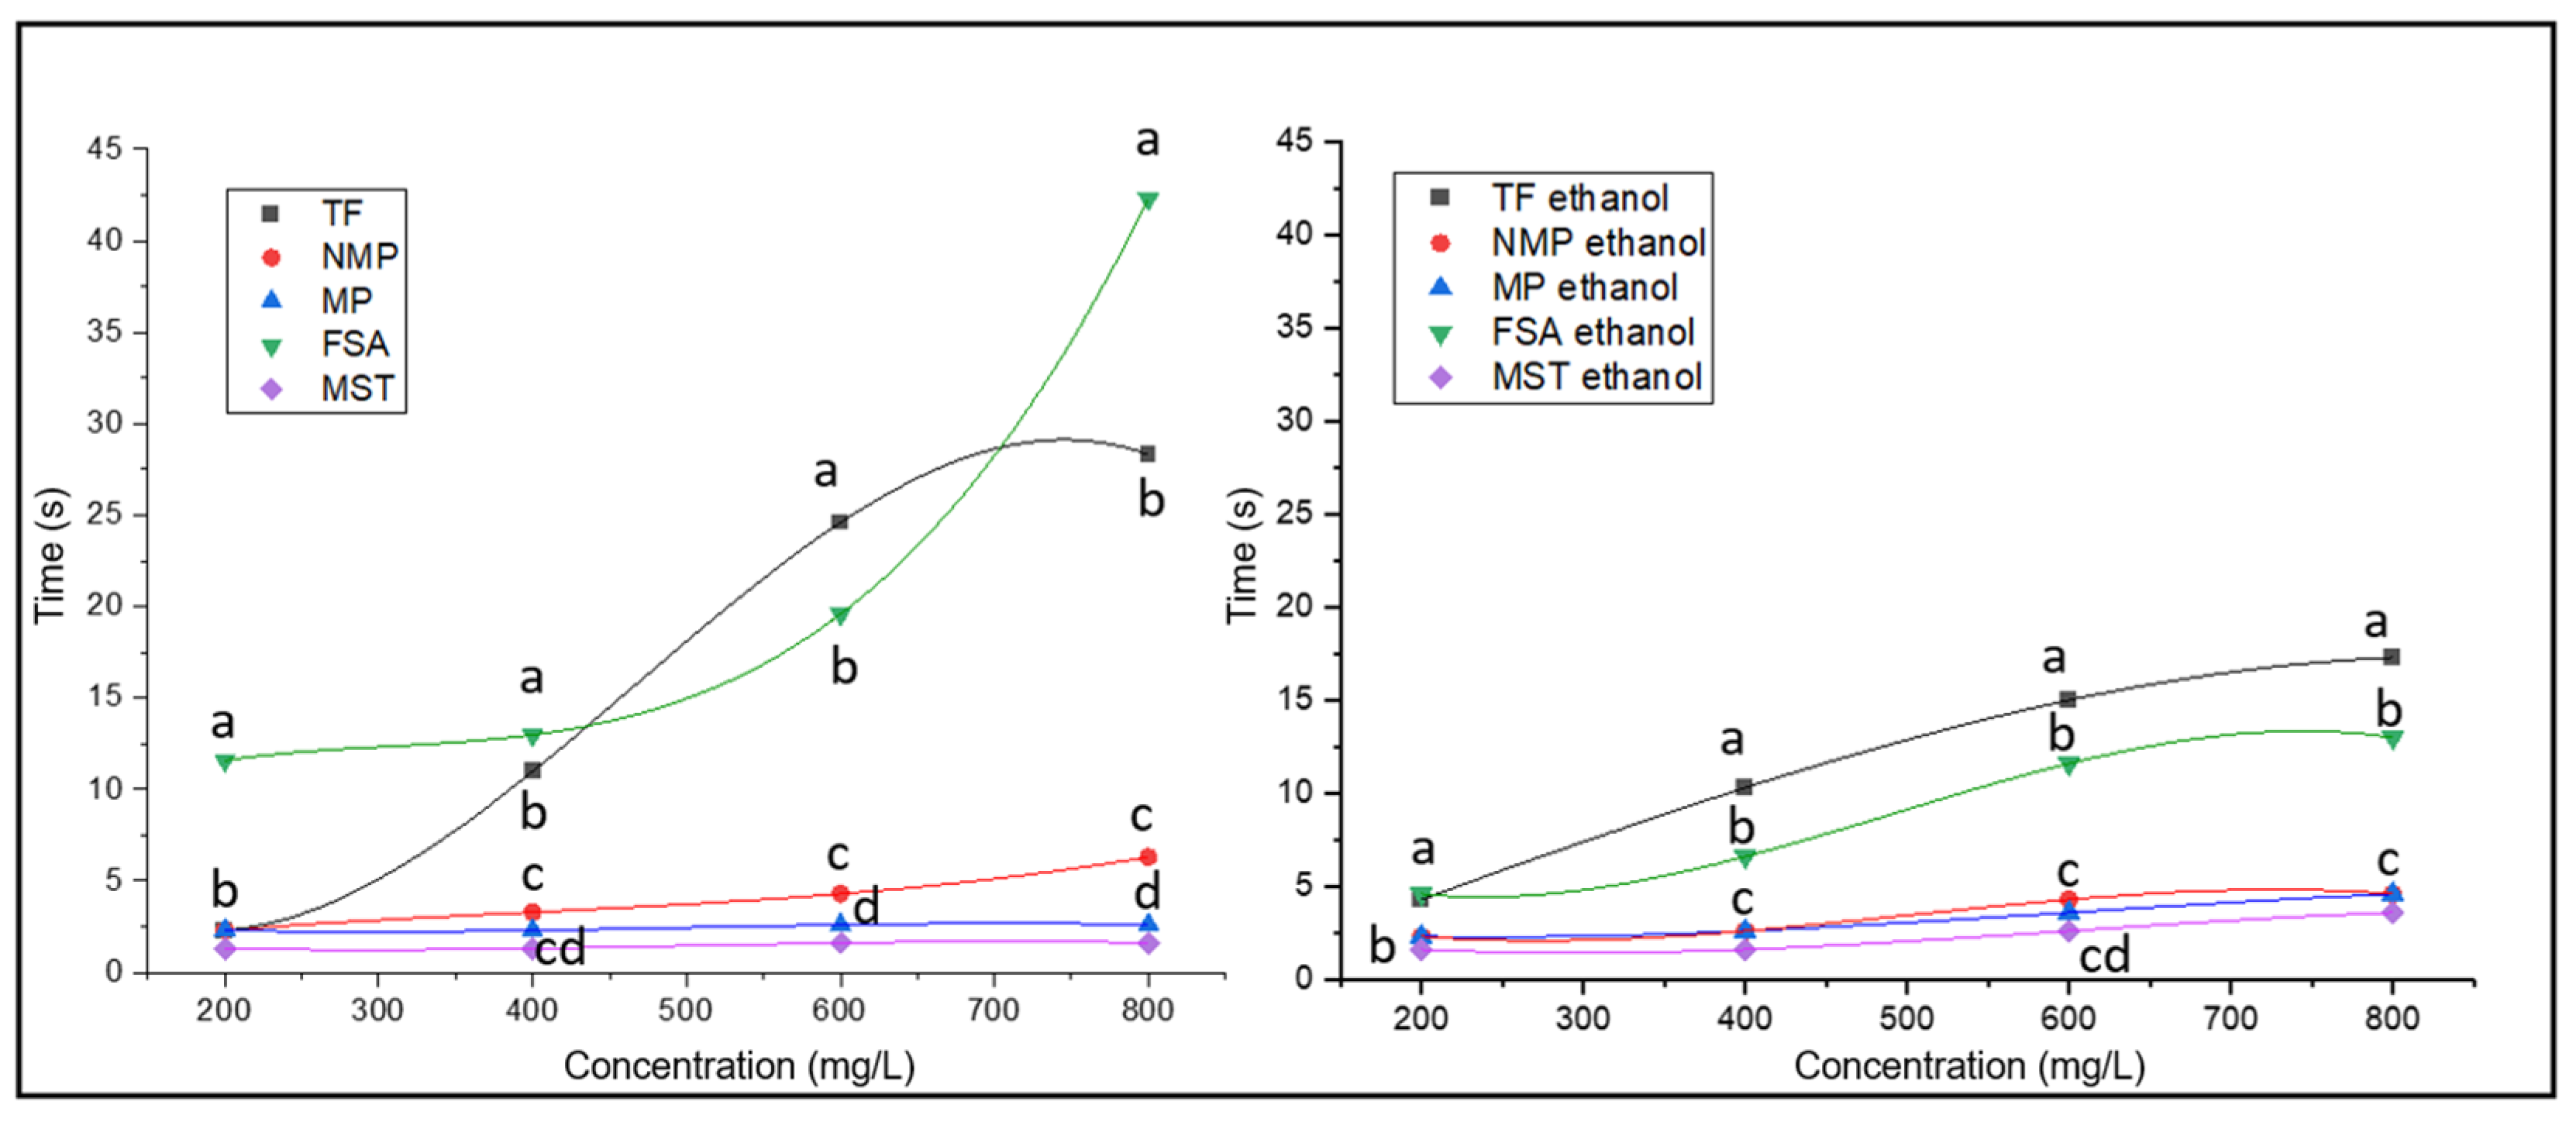
2.5. Statistical Analysis

All the data collected were analyzed both by descriptive and inferential (ANOVA with Tuckey’s test; p < 0.05) statistics. The software used were Origin 2018 Graphing and Analysis (OriginLab Corporation, Northampton, MA, USA) and Statgraphics Centurion XVI (StatPoint Technologies Inc., Warrenton, VA, USA).

3. Result and Discussion

3.1. Protein Concentrations

Table 1 shows the yields of all the protein fractions examined, including the weight yield (dry powder) and the total protein content determined spectrophotometrically with the bicinchoninic acid assay (BCA Assay, Pierce).
As observed in Table 1, the sum between the weight yields of the fractions of non-mannosylated proteins (NMP) and mannoproteins (MP) approaches the weight yield of the total fraction (FT). However, in terms of protein concentration, the sum of MP and NMP accounts only for 56–86% of the protein detected in FT. This lower protein recovery is probably attributable to the loss of solubility of a part of the proteins after freeze-drying.
By observing the soluble fraction obtained through the extraction method with ammonium sulfate (FSA), the recovered yield is quite high (84.4 mg/L), although the quantity, expressed in mg/L is lower than that recovered with dialysis and freeze-drying. The lower quantity of dry extract recovered via precipitation with salt could be attributable to the loss of proteins and other high molecular weight compounds during ammonium sulfate precipitation, allowing for the obtaining of a fraction richer in polysaccharides.
The total fraction (FT) showed a protein content of 36.5 mg/L, in line with literature data [23]. In fact, in white wines, the total protein concentration varies from 1 to 250 mg/L and is affected by the cultivar, winemaking, and storage methods of the product [23]. The protein content of the mannoprotein fraction (MP) was only 1.1 mg/L. This low level was expected, considering that mannoproteins are composed of 87–90% mannose and only to a lesser extent of protein [24]. On the other hand, the purified fraction of non-mannosylated proteins (NMPs) has an unexpectedly low protein content at 19.2 mg/L. As suggested before, the freeze-drying process may have rendered a part of the proteins insoluble in that fraction.
The protein fraction obtained via precipitation with ammonium sulfate (FSA) was confirmed to be richer in polysaccharides, showing a protein content of 24.2 mg/L, which was lower than the value measured in the total fraction.
Regarding the commercial product Mannostab®, it is not possible to draw conclusions on the weight yield as the content is not known. As Table 1 shows, the calculation of the protein yield per mg of d.w. (dry weight) highlights the different protein components compared to the rest of the weighed material. In particular, the FT fraction has 239 µm/mg d.w., a higher quantity than the two parts, NMP (167.9 µm/mg d.w.) and MP (37.4 µm/mg d.w.). The FSA fraction deserves separate consideration; in fact, it has a protein concentration of 284.7 µm/mg d.w. and represents the fraction with the highest amount of protein.
The yeast-based oenological additive Mannostab® (MSTB) has not been analyzed for total proteins and extraction yield. However, its protein concentration was previously reported as 106.4 µg protein/mg [24]. The exact concentration is not reported by the producer [25].

3.2. SDS-PAGE Profile

Figure 1A shows the electrophoretic profiles of the protein fractions stained with Coomassie Brilliant Blue. In the total fraction (FT), poorly recognizable bands are visible in the molecular weight range from 200 to 47 kDa. However, at around 30 kDa, a well-defined band is visible, which, due to its electrophoretic mobility, could be a chitinase, a protein particularly abundant in ripe grapes [23]. In the non-mannosylated protein (NMP) fraction, few defined bands are noted; at around 30 kDa, there is a band corresponding to chitinases, as in the FT fraction, and immediately below, at around 27 kDa, there is a medium-defined band probably belonging to the thaumatin class [26]. As for the mannoprotein fraction extracted with ConA (MP), it presents only three very distinct and medium intensity bands at approximately 30, 27, and 17 kDa. The protein fraction soluble in ammonium sulfate (FSA) reported a profile similar to FT fraction, presenting a complex protein profile composed of many bands defined at molecular weights between 205 and 113 kDa, 50 kDa, 27 kDa, and 17 kDa. Only the bands around 100–120 kDa appeared less intense in the FSA fraction, probably due to the precipitation of these molecules during the ammonium sulfate treatment. The last column corresponds to the proteins of the commercial product Mannostab® (MST). With the standard Coomassie blue staining, no bands were detectable; for this reason, the fraction was also analyzed via a more sensitive method, Sypro Rubin Stain staining (Figure 1B). In this case, molecular weight bands of approximately 50 and 47 kDa and a band at approximately 17 kDa were visible.
Figure 1C shows the electrophoretic profile of the protein fractions analyzed with Schiff reagent, specific for the visualization of glycoproteins. In general, mannoproteins mostly presented a high molecular weight, which makes them unable to enter the running gel. This results in the formation of intense bands located between the spacer and the running gel, a behavior already observed in a previous study testing different yeast extracts [27].
Also, in this case, FT and FSA reported a similar profile connotated by the presence of an undefined but intense band with a high molecular weight greater than 80 kDa and two bands at 60 and 47 kDa, which probably correspond to the glycosylated grape invertase [28] and/or mannoproteins deriving from yeast autolysis [14,26]. A defined band at approximately 17 kDa is present in almost all fractions except non-mannosylated proteins (NMPs) and the commercial product Mannostab® (MST). The latter mainly presents a high molecular weight protein profile between 50 and 200 kDa and a defined band at around 30 kDa, which could correspond to the mannoprotein fragment MP32 already described in this commercial product [29].
As expected, in the non-mannosylated proteins (NMP), no glycosylated bands were detected, except for a small part with a high molecular weight, which may consist of glycoproteins with glycosylation different from those with mannose [30].

3.3. Foaming Properties

Figure 2 and Figure 3 shows the foam expansion (FE%) generated via the flow of CO2 passing through solutions containing scalar concentrations of protein extracts in the absence and presence of ethanol. As shown in Figure 2, the foaming behavior of FT, expressed as FE%, shows that the 800 mg/L concentration of protein extract presents the highest values, which reach almost 300 FE% (3 × the initial volume) and remains at the values of 250 FE% even after 160 s of observation. The sample with 600 mg/L of FT protein presents similar behavior to the previous one, although it reaches statistically lower values of FE%. On the contrary, 200 mg/L and 400 mg/L have lower FE% (125% and 175%, respectively) compared to the concentrations seen previously. All these FE% values were significantly higher when ethanol was included in the system. This was particularly evident for the 800 mg/L concentration, which reached a peak of 400% FE. This could be due to the decrease in surface tension that, in the presence of flowing CO2, can result in a higher effervescence of the solution [31]. However, in terms of foam stability (Figure 4), the presence of ethanol seems to have no effect (at 200 and 400 mg/L) or negative effect (at 600 and 800 mg/L), an outcome that is in contrast with previous reports [31].
Figure 2 also shows the foaming behavior of the separated protein fractions. In this case, the FE% of the NMP protein samples is particularly low, and increasing the protein concentration of the solutions does not seem to affect the foaming characteristics. In fact, the FE% of the samples with 400, 600, and 800 mg/L of NMP is around 170 FE%, regardless of the concentration, and remains constant over time. The lowest protein concentration (200 mg/L) is statistically lower (130 FE%) than the other concentrations. The foaming behavior of the NMP fraction when ethanol is present in the model wine slightly increases in terms of FE% (Figure 2). In terms of foam stability, the foam produced with this fraction rapidly disappears (after about 5 s), with minor differences due to the concentration and the presence of ethanol.
The MP fraction also generally presents low FE% in the solution without ethanol, reaching values around 155 FE% at higher protein concentrations (600 and 800 mg/L), while at 200 and 400 mg/L, the FE% was 125. Even in the case of MPs, the presence of ethanol in the model wine results in a slight increase in FE%, which reaches values of 200 FE% with the maximum concentration of MPs, intermediate values of 175% for 400 and 600 mg/L, and 160% for 200 mg/L of MP. As for NMP, when it is alone, this fraction demonstrates poor foamability at any protein concentration and with/without ethanol present in the system (Figure 4).
In general, Figure 2 shows that the FT fraction has a higher FE% compared to what is reported by its two subfractions (MP and NMP) tested alone. It seems that the NMP and MP, when present together in the original FT fraction, act synergistically in promoting foam expansion with FE% values significantly higher than when they are separated. Therefore, the greater FE% observed in FT compared to NMP and MP could be due to the different types of proteins present in the two fractions, which, when together, promote greater expansion of the foam. As seen in Figure 1 (SDS-PAGE), FT presents proteins distributed over a wide range of molecular weights, with high, intermediate, and low molecular weight proteins, contrary to what is observed in the NMP fraction, which presents few and in MP where they are barely noticeable. Therefore, it is possible to state that the presence of glycoproteins alone is not enough to guarantee optimal foam formation, as that formed when non-glycosylated proteins are also present in the system. It could be hypothesized that the expansion of the foam could be due to the synergy between the glycoproteins, with their hydrophobic and hydrophilic components, and the non-glycosylated proteins, characterized by a lower molecular weight, thus confirming the hypothesis of Vincenzi and colleagues [18]. Further confirmation of this synergy is provided by the observation that in the FT sample, FE% doubles when the initial dose (200 mg/L) is quadrupled (to 800 mg/L), while for MP and NMP, the same increase led to an increase of only 25%. This emphasizes that even when mannoproteins reach elevated concentrations, foam yield is modest if the non-glycosylated protein fraction is absent in the system.
This hypothesis on the foaming behavior of proteins can also be formulated when they are solubilized in an alcoholic solution (Figure 2). In this case, however, the higher FE% could be due to the effect of ethanol on the hydrophobic component of the proteins involved in foam formation, as previously reported [32].
The foaming behavior, expressed with the parameter FE%, observed in the graphs of Figure 2, is reproposed in Figure 3. In fact, the fraction separated from the wine using ammonium sulfate (FSA) and solubilized in the absence of ethanol shows an expansion of 400% and 300% in the presence of concentrations of 800 mg/L and 600 mg/L, respectively, followed by 400 and 200 mg/L. Furthermore, it is observed that the FE% trends remain almost unchanged over time. When ethanol is present in the system, the FE% parameter presents very high values (820%), especially when in the presence of high concentrations (800 and 600 mg/L); however, FE% tends to decrease over time until it stabilizes at values of 400 and 350 after 100 s of observation. In the presence of ethanol, the FSA protein fraction, even at lower concentrations (200 and 400 mg/L), shows higher foam expansion than all the other cases observed (Figure 2 and Figure 3).
In terms of foam stability, the FSA sample produced the more stable foams of this study at every concentration tested (Figure 4). In this regard, it is important to note the doubling of the foam stability produced with FSA when transitioning from 600 to 800 g/L. This almost exponential growth could indicate the establishment of a synergic effect among the molecules present. This results in an overall foam stability effect, which, at 800 g/L, is much more pronounced than one would expect solely based on the concentration growth of the FSA components from 600 to 800 g/L. At this concentration, the difference with respect to the other samples is maximized, with foams made using FSA in the absence of ethanol being by far the most stable (43 s), followed by foams induced by FT (27 s) (Figure 4). The fact that these samples were the best performing in terms of foam stability can be explained by examining their variate protein composition (Figure 1). In fact, among the fractions tested in the present study, these two are the only ones reporting both glycosylated and non-glycosylated proteins present in high amounts and covering all molecular weights (high, medium, and low) (Figure 1, rectangles). These conditions, in a previous study testing different yeast extracts, were significantly correlated with foam stability, with the concentration of the low molecular weight fraction (here noticeable in FSA; Figure 1C) reporting the highest Pearson’s coefficient [33]. This also aligns with a prior study in which it was noted that mannoproteins with molecular weights ranging between 10 and 30 kDa played a primary role in enhancing the foaming properties of a model wine [10].
In the case of the FT sample, the scenario appears reversed with the presence of alcohol, which decreases the time during which foams remain stable at all the tested concentrations (Figure 4). When ethanol is present, despite remaining the most stable among the produced foams, stability reported using FSA and FT dropped significantly, with the value of FSA more than halved compared to what was reported in the absence of ethanol. The negative correlation between ethanol concentration and foam stability has already been noted in beer, where, after interfacial studies, ethanol was indicated as responsible for reducing the rigidity of the protein layer adsorbed at the liquid–air interface, thus decreasing its elasticity with an increased probability of film rupture [34].
Finally, the MST sample, containing the commercial mannoproteins of the Mannostab product, shows an FE% trend similar to what was observed for the MP sample extracted with ConA from wine. Even in this case (Figure 3, MST), the FE% varies between 125% and 150%, tends to remain constant over time, and the effect of the concentration of the extract on the value of the parameter is evident only when comparing the two extremes, 800 and 200 mg/L. These values did not change in the presence of ethanol, which, however, seems to confer higher stability to the foam.
Also, in this case (Figure 3 and Figure 4), the same considerations about the foaming behavior of Figure 2 could be expressed. In fact, both FT and FSA fractions contain glycosylated and non-glycosylated proteins (205 to 17 kDa, Figure 1), which could act synergistically in promoting FE%. On the contrary, the MP and MST fractions, which contain only highly glycosylated compounds, as also shown in Figure 1C, do not show a high aptitude for foam expansion.
In summary, as reported in the graphs of Figure 2 and Figure 3, the proteins extracted from the wine using different methods and the commercial product participate differently in foamability, expressed in terms of FE%. In general, the foam that forms at the air–liquid interface is an unstable system because surface tension counteracts the forces needed for its maintenance, and by its nature, the foam tends to collapse. It has been observed that proteins, with their surfactant properties, migrate to the air–liquid interface and form foam thanks to electrostatic and hydrophobic forces, hydrogen, and covalent bonds. These interactions are responsible for the formation of the viscoelastic film that surrounds the air bubbles. However, some proteins act as good foam formers but are not able to stabilize them; on the contrary, some proteins are not good foam formers but guarantee their stability [33,35]. Thus, the different values of parameter FE% observed in Figure 2 and Figure 3 may be explained using the different properties of the protein fractions studied in the formation of the foam. Ethanol also plays an important role in the foaming characteristics of wine proteins because it decreases the surface tension of the system and modulates the adsorption of other surfactant compounds [15]. Generally, ethanol can act at the level of hydrophobic proteins by modifying their foamability, but it can also negatively influence the surface tension of the liquid, with negative effects on the foam’s stability.
Curves in Figure 4, describing the stability of the foam as a function of the concentration of the extract, were interpolated with third-degree functions. In all cases, the cubic function shows R2 equal to 1, indicating a perfect fitting of the data (Table 2). As Table 2 shows, the curves can be described using different parameters. In particular, with and without ethanol, the MP and MST extracts show very similar and very low values of the parameters B1, B2, and B3, indicating that the stability of the foam is not due to the concentration of the extracts. The NMP sample also presents parameter values close and with the same order of magnitude as those of MP and MST, with some statistical differences. The FSA and FT samples deserve separate consideration; in fact, the functions described using the two samples show very different parameters from each other and with values that highlight inflection points to indicate a complex and non-linear trend in describing the stability behavior of the foams as a function of the concentration of the two extracts. In general, the parameters of the cubic functions in Table 2, obtained by interpolating the concentration points as a function of the stability time, are never linear, highlighting the complexity of the foaming behavior exhibited by the protein and glycoprotein extracts of wine.

4. Conclusions

Wine proteins, from both grape and yeast, play a fundamental role in the development and stability of foam in sparkling wine. Considering the heterogeneity of this fraction, understanding the role of the different groups of proteins in foam formation is critical for advancing sparkling wines’ production processes.
In this study, the best foam expansion and stability were achieved when total protein extracts (FT and FSA) were present in the model system. These fractions contain both proteins and glycoproteins of high and low molecular weight, which appear to act in synergy, ensuring voluminous and stable foams. On the contrary, when tested alone, glycoproteins and proteins showed poor foaming performance. Similar performances were achieved with a commercial yeast glycoprotein extract.
The study further highlights that the presence of ethanol in the system may be critical, as it could favor foam expansion but also destabilize it fast. This aspect should be taken into account in further studies focusing on the production of dealcoholized wines.
This research suggests the need for further studies that are useful for winemakers to understand the molecular interactions behind the synergistic behavior of the different protein components in the formation and stability of foam in sparkling wine.

Author Contributions

Conceptualization, G.L. and A.D.I.; Formal analysis, M.V., S.V. and S.Z.; Funding acquisition, G.L.; Investigation, G.L., A.D.I., M.V. and S.Z.; Methodology, S.Z., M.V. and G.L.; Project administration, G.L.; Resources, G.L.; Supervision, S.V. and A.D.I.; Validation, S.V.; Writing—original draft, G.L.; Writing—review and editing, S.V. and A.D.I. All authors have read and agreed to the published version of the manuscript.

Funding

This research was funded by the University of Padova, Italy (BIRD165379, DOR1847072).

Data Availability Statement

The data presented in this study are available upon request from the corresponding author.

Acknowledgments

The authors thank the farm Filippi Mattia (Trento, Italy), for providing wine for the research.

Conflicts of Interest

The authors declare no conflicts of interest.

References

  1. Liger-Belair, G.; Cilindre, C. Recent Progress in the Analytical Chemistry of Champagne and Sparkling Wines. Annu. Rev. Anal. Chem. 2021, 14, 21–46. [Google Scholar] [CrossRef]
  2. Kemp, B.; Condé, B.; Jégou, S.; Howell, K.; Vasserot, Y.; Marchal, R. Chemical Compounds and Mechanisms Involved in the Formation and Stabilization of Foam in Sparkling Wines. Crit. Rev. Food Sci. Nutr. 2019, 59, 2072–2094. [Google Scholar] [CrossRef] [PubMed]
  3. Schramm, L.L. Emulsions, Foams, Suspensions, and Aerosols: Microscience and Applications; John Wiley & Sons: Hoboken, NJ, USA, 2014; ISBN 978-3-527-33706-4. [Google Scholar]
  4. Huang, Y.; Li, J.; Liu, Y.; Gantumur, M.-A.; Sukhbaatar, N.; Zhao, P.; Oh, K.C.; Jiang, Z.; Hou, J. Improving Gas-Water Interface Properties and Bioactivities of α-Lactalbumin Induced by Three Structurally Different Saponins. Food Hydrocoll. 2023, 138, 108463. [Google Scholar] [CrossRef]
  5. Aguié-Béghin, V.; Adriaensen, Y.; Péron, N.; Valade, M.; Rouxhet, P.; Douillard, R. Structure and Chemical Composition of Layers Adsorbed at Interfaces with Champagne. J. Agric. Food Chem. 2009, 57, 10399–10407. [Google Scholar] [CrossRef] [PubMed]
  6. Abdallah, Z.; Aguié-Béghin, V.; Abou-Saleh, K.; Douillard, R.; Bliard, C. Isolation and Analysis of Macromolecular Fractions Responsible for the Surface Properties in Native Champagne Wines. Food Res. Int. 2010, 43, 982–987. [Google Scholar] [CrossRef]
  7. Vilela, A.; Cosme, F.; Pinto, T. Emulsions, Foams, and Suspensions: The Microscience of the Beverage Industry. Beverages 2018, 4, 25. [Google Scholar] [CrossRef]
  8. Dupin, I.V.S.; Stockdale, V.J.; Williams, P.J.; Jones, G.P.; Markides, A.J.; Waters, E.J. Saccharomyces Cerevisiae Mannoproteins That Protect Wine from Protein Haze: Evaluation of Extraction Methods and Immunolocalization. J. Agric. Food Chem. 2000, 48, 1086–1095. [Google Scholar] [CrossRef] [PubMed]
  9. Cosme, F.; Fernandes, C.; Ribeiro, T.; Filipe-Ribeiro, L.; Nunes, F.M. White Wine Protein Instability: Mechanism, Quality Control and Technological Alternatives for Wine Stabilisation—An Overview. Beverages 2020, 6, 19. [Google Scholar] [CrossRef]
  10. Nunez, Y.P.; Carrascosa, A.V.; González, R.; Polo, M.C.; Martínez-Rodríguez, A.J. Effect of Accelerated Autolysis of Yeast on the Composition and Foaming Properties of Sparkling Wines Elaborated by a Champenoise Method. J. Agric. Food Chem. 2005, 53, 7232–7237. [Google Scholar] [CrossRef]
  11. Moreno-Arribas, M.V.; Polo, C. Wine Chemistry and Biochemistry; Springer Science & Business Media: Berlin, Germany, 2008; ISBN 978-0-387-74118-5. [Google Scholar]
  12. Tao, Y.; García, J.F.; Sun, D.-W. Advances in Wine Aging Technologies for Enhancing Wine Quality and Accelerating Wine Aging Process. Crit. Rev. Food Sci. Nutr. 2014, 54, 817–835. [Google Scholar] [CrossRef]
  13. Franceschi, D.; Lomolino, G.; Sato, R.; Vincenzi, S.; De Iseppi, A. Umami in Wine: Impact of Glutamate Concentration and Contact with Lees on the Sensory Profile of Italian White Wines. Beverages 2023, 9, 52. [Google Scholar] [CrossRef]
  14. Escot, S.; Feuillat, M.; Dulau, L.; Charpentier, C. Release of Polysaccharides by Yeasts and the Influence of Released Polysaccharides on Colour Stability and Wine Astringency. Aust. J. Grape Wine Res. 2001, 7, 153–159. [Google Scholar] [CrossRef]
  15. Péron, N.; Cagna, A.; Valade, M.; Marchal, R.; Maujean, A.; Robillard, B.; Aguié-Béghin, V.; Douillard, R. Characterisation by Drop Tensiometry and by Ellipsometry of the Adsorption Layer Formed at the Air/Champagne Wine Interface. Adv. Colloid. Interface Sci. 2000, 88, 19–36. [Google Scholar] [CrossRef]
  16. Puff, N.; Marchal, R.; Aguié-Béghin, V.; Douillard, R. Is Grape Invertase a Major Component of the Adsorption Layer Formed at the Air/Champagne Wine Interface? Langmuir 2001, 17, 2206–2212. [Google Scholar] [CrossRef]
  17. De Iseppi, A.; Marangon, M.; Vincenzi, S.; Lomolino, G.; Curioni, A.; Divol, B. A Novel Approach for the Valorization of Wine Lees as a Source of Compounds Able to Modify Wine Properties. LWT 2021, 136, 110274. [Google Scholar] [CrossRef]
  18. Vincenzi, S.; Crapisi, A.; Curioni, A. Foamability of Prosecco Wine: Cooperative Effects of High Molecular Weight Glycocompounds and Wine PR-Proteins. Food Hydrocoll. 2014, 34, 202–207. [Google Scholar] [CrossRef]
  19. Vanrell, G.; Canals, R.; Esteruelas, M.; Fort, F.; Canals, J.M.; Zamora, F. Influence of the Use of Bentonite as a Riddling Agent on Foam Quality and Protein Fraction of Sparkling Wines (Cava). Food Chem. 2007, 104, 148–155. [Google Scholar] [CrossRef]
  20. Mangindaan, D.; Khoiruddin, K.; Wenten, I.G. Beverage Dealcoholization Processes: Past, Present, and Future. Trends Food Sci. Technol. 2018, 71, 36–45. [Google Scholar] [CrossRef]
  21. Moine, V.L.; Dubourdieu, D. Biological Product for the Physico-Chemical Stabilization of a Wine. Patent Application No. FR2726284B1, 27 December 1996. [Google Scholar]
  22. Partsia, Z.; Kiosseoglou, V. Foaming Properties of Potato Proteins Recovered by Complexation with Carboxymethylcellulose. Colloids Surf. B Biointerfaces. 2001, 21, 69–74. [Google Scholar] [CrossRef] [PubMed]
  23. Vincenzi, S.; Mosconi, S.; Zoccatelli, G.; Pellegrina, C.D.; Veneri, G.; Chignola, R.; Peruffo, A.; Curioni, A.; Rizzi, C. Development of a New Procedure for Protein Recovery and Quantification in Wine. Am. J. Enol. Vitic. 2005, 56, 182–187. [Google Scholar] [CrossRef]
  24. Wang, S.; Wang, X.; Zhao, P.; Ma, Z.; Zhao, Q.; Cao, X.; Cheng, C.; Liu, H.; Du, G. Mannoproteins Interfering Wine Astringency by Modulating the Reaction between Phenolic Fractions and Protein in a Model Wine System. LWT 2021, 152, 112217. [Google Scholar] [CrossRef]
  25. Li, S.; Zhai, H.; Ma, W.; Duan, C.; Yi, L. Yeast Mannoproteins: Organoleptic Modulating Functions, Mechanisms, and Product Development Trends in Winemaking. Food Front. 2023, 4, 1091–1126. [Google Scholar] [CrossRef]
  26. Vincenzi, S.; Marangon, M.; Tolin, S.; Curioni, A. Protein Evolution during the Early Stages of White Winemaking and Its Relations with Wine Stability. Aust. J. Grape Wine Res. 2011, 17, 20–27. [Google Scholar] [CrossRef]
  27. De Iseppi, A.; Curioni, A.; Marangon, M.; Vincenzi, S.; Kantureeva, G.; Lomolino, G. Characterization and Emulsifying Properties of Extracts Obtained by Physical and Enzymatic Methods from an Oenological Yeast Strain. J. Sci. Food Agric. 2019, 99, 5702–5710. [Google Scholar] [CrossRef] [PubMed]
  28. Jégou, S.; Conreux, A.; Villaume, S.; Hovasse, A.; Schaeffer, C.; Cilindre, C.; Van Dorsselaer, A.; Jeandet, P. One Step Purification of the Grape Vacuolar Invertase. Anal. Chim. Acta 2009, 638, 75–78. [Google Scholar] [CrossRef]
  29. Moine-Ledoux, V.; Dubourdieu, D. An Invertase Fragment Responsible for Improving the Protein Stability of Dry White Wines. J. Sci. Food Agric. 1999, 79, 537–543. [Google Scholar] [CrossRef]
  30. Snyman, C.; Mekoue Nguela, J.; Sieczkowski, N.; Divol, B.; Marangon, M. Characterization of Mannoprotein Structural Diversity in Wine Yeast Species. J. Agric. Food Chem. 2023, 71, 19727–19738. [Google Scholar] [CrossRef]
  31. Dussaud, A.; Robillard, B.; Carles, B.; Duteurtre, B.; Vignes-Adler, M. Exogenous Lipids and Ethanol Influences on the Foam Behavior of Sparkling Base Wines. J. Food Sci. 1994, 59, 148–151. [Google Scholar] [CrossRef]
  32. Brissonnet, F.; Maujean, A. Characterization of Foaming Proteins in a Champagne Base Wine. Am. J. Enol. Vitic. 1993, 44, 297–301. [Google Scholar] [CrossRef]
  33. De Iseppi, A.; Marangon, M.; Lomolino, G.; Crapisi, A.; Curioni, A. Red and White Wine Lees as a Novel Source of Emulsifiers and Foaming Agents. LWT 2021, 152, 112273. [Google Scholar] [CrossRef]
  34. Brierley, E.R.; Wilde, P.J.; Onishi, A.; Hughes, P.S.; Simpson, W.J.; Clark, D.C. The Influence of Ethanol on the Foaming Properties of Beer Protein Fractions: A Comparison of Rudin and Microconductivity Methods of Foam Assessment. J. Sci. Food Agric. 1996, 70, 531–537. [Google Scholar] [CrossRef]
  35. Ferreira, I.M.P.L.V.O.; Jorge, K.; Nogueira, L.C.; Silva, F.; Trugo, L.C. Effects of the Combination of Hydrophobic Polypeptides, Iso-α Acids, and Malto-Oligosaccharides on Beer Foam Stability. J. Agric. Food Chem. 2005, 53, 4976–4981. [Google Scholar] [CrossRef] [PubMed]
Figure 1. SDS-PAGE (15%): SDS-PAGE of protein fractions stained with different protocols. (A) Coomassie Brilliant Blue stain. Total fraction (FT); non-mannosylated proteins (NMP); mannoproteins (MP); fraction soluble in ammonium sulfate (FSA). (B) Sypro Ruby Stain. Mannostab® (MST). (C) Schiff reagent (staining glycosylated proteins only). Total fraction (FT); non-mannosylated proteins (NMP); mannoproteins (MP); fraction soluble in ammonium sulfate (FSA); Mannostab® (MST).
Beverages 10 00021 g001
Figure 2. Foam expansion (FE%); foamability test of protein and glycoprotein extracts (FT, NMP, and MP) in model wine with and without ethanol. Each extract is tested at the following concentrations: 200, 400, 600, and 800 mg/L. Each test was performed in triplicate. Data significance was assessed by ANOVA and Tukey’s test. Points indicated by the same letter are not significantly different at p ≤ 0.05.
Beverages 10 00021 g002
Figure 3. Foam expansion (FE%); foamability test of protein and glycoprotein extracts (FSA and MST) in model wine with and without ethanol. Each extract was tested at the following concentrations: 200, 400, 600, and 800 mg/L. Each test was performed in triplicate. Data significance was assessed by ANOVA and Tukey’s test. Points indicated by the same letter are not significantly different at p ≤ 0.05.
Beverages 10 00021 g003
Figure 4. Stability curves interpolated with data of foam stability, measured in seconds, as a function of protein fraction concentration. Data significance was assessed by ANOVA and Tukey’s test. Points indicated by the same letter are not significantly different at p ≤ 0.05.
Beverages 10 00021 g004
Table 1. Extracted protein fractions: Total Fraction (FT), Non-mannosilated protein (NMP), Mannoprotein extracted using ConA (MP), and soluble fraction in sulfate ammonium (FSA). The yields of the extracted fractions are expressed in dry weight (m/L), and total proteins are measured using the BCA method (see Section 2).
Fractions Extracted ProteinWeight Yield (Dry Weight, d.w.) mg/LTotal Protein mg/Lµg Protein/mg d.w.
Total Fraction (FT)152.3 ± 8.336.5 ± 2.3239.6 ± 1.3
Not mannosilated protein (NMP)114.3 ± 4.219.2 ± 0.9167.9 ± 2.3
Mannoprotein extracted by ConA (MP)29.4 ± 1.51.1 ± 0.1537.4 ± 0.9
soluble fraction in Sulfate ammonium (FSA)84.4 ± 1.724.2 ± 2.3286.7 ± 3.4
Table 2. Parameters of the cubic curve (Figure 4) interpolated with data of foam stability, measured in seconds as a function of protein fraction concentration. Data significance was assessed by ANOVA and Tukey’s test. Values followed by the same letter are not significantly different at p ≤ 0.05.
y = Intercept + B1 × x1 + B2 × x2 + B3 × x3
FSATFMPMSTNMP
R211111
intercept4.5 ± 0.3 b13.03 ± 0.2 a3.2 ± 0.4 c2.2 ± 0.08 d0.3 ± 0.002 e
B10.06792 a−0.128 d−0.0077 c−0.0077 c0.0141 b
B2−2.08 × 10⁻⁴ c4.31 × 10−4 a1.88 × 10−5 b1.88 × 10−5 b−2.50 × 10⁻⁵ d
B32.27 × 10−7 a−3.08 × 10⁻⁷ d−1.25 × 10⁻⁸ c−1.25 × 10⁻⁸ c2.08 × 10−8 b
FSA ethanolFT ethanolMP ethanolMST ethanolNMP ethanol
R211111
intercept12.2 ± 1.1 a−1.9 ± 0.3 d3.4 ± 0.4 c3.6 ± 0.3 c6.2 ± 0.5 b
B1−0.073 d2.90 × 10−2 a−0.01 b−0.01 b−0.034 c
B22.02 × 10−4 a1.13 × 10−5 d2.63 × 10−5 c3.75 × 10−5 c8.75 × 10−5 b
B3−1.37 × 10⁻⁷ a−2.29 × 10⁻⁸ b−1.40 × 10⁻⁸ b−2.08 × 10⁻⁸ b−5.83 × 10⁻⁸ c
Disclaimer/Publisher’s Note: The statements, opinions and data contained in all publications are solely those of the individual author(s) and contributor(s) and not of MDPI and/or the editor(s). MDPI and/or the editor(s) disclaim responsibility for any injury to people or property resulting from any ideas, methods, instructions or products referred to in the content.

